sequential fragmentation / transport theory, pyroclast ... · deposits at mt. st. helens (msh)...
TRANSCRIPT
Boise State UniversityScholarWorks
Geosciences Faculty Publications and Presentations Department of Geosciences
4-1-2014
Sequential Fragmentation / Transport Theory,Pyroclast Size-Density Relationships, and theEmplacement Dynamics of Pyroclastic DensityCurrents – A Case Study on the Mt. St. Helens(USA) 1980 EruptionChelsea Mackaman-LoflandUniversity of Washington
Brittany D. BrandBoise State University
Jacopo TaddeucciInstituto Nazionale di Geofisica e Vulcanologia
Kenneth WohletzLos Alamos National Laboratory
NOTICE: this is the author’s version of a work that was accepted for publication in Journal of Volcanology and Geothermal Research. Changes resultingfrom the publishing process, such as peer review, editing, corrections, structural formatting, and other quality control mechanisms may not be reflectedin this document. Changes may have been made to this work since it was submitted for publication. A definitive version was subsequently published inJournal of Volcanology and Geothermal Research, Volume 275, (2014). DOI: 10.1016/j.jvolgeores.2014.01.016
Publication InformationMackaman-Lofland, Chelsea; Brand, Brittany D.; Taddeucci, Jacopo; and Wohletz, Kenneth. (2014). "Sequential Fragmentation /Transport Theory, Pyroclast Size-Density Relationships, and the Emplacement Dynamics of Pyroclastic Density Currents – A CaseStudy on the Mt. St. Helens (USA) 1980 Eruption". Journal of Volcanology and Geothermal Research, 275, 1-13. http://dx.doi.org/10.1016/j.jvolgeores.2014.01.016
�������� ����� ��
Sequential fragmentation / transport theory, pyroclast size-density relation-ships, and the emplacement dynamics of pyroclastic density currents – A casestudy on the Mt. St. Helens (USA) 1980 eruption
Chelsea Mackaman-Lofland, Brittany D. Brand, Jacopo Taddeucci, Ken-neth Wohletz
PII: S0377-0273(14)00041-9DOI: doi: 10.1016/j.jvolgeores.2014.01.016Reference: VOLGEO 5267
To appear in: Journal of Volcanology and Geothermal Research
Received date: 22 June 2013Accepted date: 31 January 2014
Please cite this article as: Mackaman-Lofland, Chelsea, Brand, Brittany D., Taddeucci,Jacopo, Wohletz, Kenneth, Sequential fragmentation / transport theory, pyroclast size-density relationships, and the emplacement dynamics of pyroclastic density currents –A case study on the Mt. St. Helens (USA) 1980 eruption, Journal of Volcanology andGeothermal Research (2014), doi: 10.1016/j.jvolgeores.2014.01.016
This is a PDF file of an unedited manuscript that has been accepted for publication.As a service to our customers we are providing this early version of the manuscript.The manuscript will undergo copyediting, typesetting, and review of the resulting proofbefore it is published in its final form. Please note that during the production processerrors may be discovered which could affect the content, and all legal disclaimers thatapply to the journal pertain.
ACCEPTED MANUSCRIPT
Manuscript Title: Sequential fragmentation / transport theory, pyroclast size-density
relationships, and the emplacement dynamics of pyroclastic density currents – A case study on
the Mt. St. Helens (USA) 1980 eruption
Corresponding Author: Chelsea Mackaman-Lofland1. [email protected]
List of Authors: Chelsea Mackaman-Lofland1, Brittany D Brand
1,2, Jacopo Taddeucci
3, Kenneth
Wohletz4
Author Affiliations: 1Department of Earth and Space Sciences, University of Washington,
Seattle, WA 98195; 2Department of Geosciences, Boise State University, Boise, ID 83725;
3Instituto Nazionale di Geofisica e Vulcanologia, Rome, Italy;
4Los Alamos National Laboratory,
Los Alamos, NM 87545
ACCEPTED MANUSCRIPT
Abstract
Pyroclastic density currents (PDCs) are the most dangerous hazard associated with
explosive volcanic eruptions. Despite recent advancements in the general understanding of PDC
dynamics, limited direct observation and/or outcrop scarcity often hinder the interpretation of
specific transport and depositional processes at many volcanoes. This study explores the
potential of sequential fragmentation / transport theory (SFT; cf. Wohletz et al. 1989), a
modeling method capable of predicting particle mass distributions based on the physical
principles of fragmentation and transport, to retrieve the transport and depositional dynamics of
well-characterized PDCs from the size and density distributions of individual components within
the deposits. The extensive vertical and lateral exposures through the May 18th
, 1980 PDC
deposits at Mt. St. Helens (MSH) provide constraints on PDC regimes and flow boundary
conditions at specific locations across the depositional area. Application to MSH deposits
suggests that SFT parameter distributions can be effectively used to characterize flow boundary
conditions and emplacement processes for a variety of PDC lithofacies and deposit locations.
Results demonstrate that (1) the SFT approach reflects particle fragmentation and transport
mechanisms regardless of variations in initial component distributions, consistent with results
from previous studies; (2) SFT analysis reveals changes in particle characteristics that are not
directly observable in grain size and fabric data; (3) SFT parameters are more sensitive to
regional transport conditions than local (outcrop-scale) depositional processes. The particle
processing trends produced using SFT analysis are consistent with the degree of particle
processing inferred from lithofacies architectures: for all lithofacies examined in this study,
suspension sedimentation products exhibit much better processing than concentrated current
deposits. Integrated field observations and SFT results provide evidence for increasing density

ACCEPTED MANUSCRIPT
segregation within the depositional region of the currents away from source, as well as for
comparable density-segregation processes acting on lithic concentrations and pumice lenses
within the current. These findings further define and reinforce the capability of SFT analysis to
complement more conventional PDC study methods, significantly expanding the information
gained regarding flow dynamics. Finally, this case study demonstrates that the SFT
methodology has the potential to constrain regional flow conditions at volcanoes where outcrop
exposures are limited.
ACCEPTED MANUSCRIPT
1. Introduction
Pyroclastic density currents (PDCs) are ground-hugging currents of gas, ash, and
pyroclasts that travel at high velocities down the flanks of volcanoes (Francis, 1993; Sparks et
al., 1997). PDCs are the most dangerous hazard associated with explosive volcanic eruptions,
but because of current opacity and the risk inherent to observing PDCs in real time, the controls
on transport and depositional processes are poorly understood. Volcanologists analyze PDC
deposits to reconstruct flow characteristics. The flow information inferred from the study of
PDC deposits is used to establish primary controls on runout distance, dynamic pressure, and
other hazardous aspects of these currents (e.g., Valentine, 1998; Calder et al., 2000; Allen, 2001;
Bourdier and Abdurachman, 2001; Dellino et al., 2011). However, outcrop exposure is often
incomplete, and the extent to which local depositional characteristics are representative of the
parent current transport and depositional processes at given spatial and temporal locations is still
uncertain (e.g., Druitt, 1995; Giordano, 1998; Wohletz, 1998; Taddeucci and Wohletz, 2001;
Branney and Kokelaar, 2002; Taddeucci and Palladino, 2002).
For this study, our objectives are to find and test methods that link PDC deposit
characteristics with parent flow dynamics. We examine the solid fraction of PDCs, which is
made up of discrete components including juvenile pumice and vitric glass fragments, accidental
lithics, and free crystals. During both regional transport (i.e., transport from the PDC source to
the depositional site) and local deposition, the components are preferentially sorted as a function
of their size, density, and shape characteristics, resulting in particle distributions that can be
identified at the outcrop scale (Wohletz et al., 1989; Calder et al., 2000; Tadddeucci and
Wohletz, 2001; Burgisser and Bergantz, 2002; Taddeucci and Palladino, 2002). We analyze the
particle distributions in PDC deposits using sequential fragmentation / transport theory (SFT), a
ACCEPTED MANUSCRIPT
methodology that predicts mass distributions based on the physical principles of fragmentation
and transport (Wohletz et al., 1989).
2. Field Location: Mt. St. Helens
The MSH eruption began the morning of May 18th
with the collapse of the bulging
edifice and subsequent debris avalanche. The debris avalanche was followed by a lateral blast
that resulted from the decompression and rapid expansion of magma beneath the collapsed
edifice (Kieffer, 1981; Fisher, 1990). The Plinian eruption that commenced after the blast
continued throughout the day, reaching the climactic phase in the late afternoon (Christiansen
and Peterson, 1981; Rowley et al., 1981; Criswell, 1987). The increase in eruptive intensity
through the early afternoon and during the climactic phase produced multiple PDCs generated by
column collapse events, which buried the area north of the crater under 10s of meters of PDC
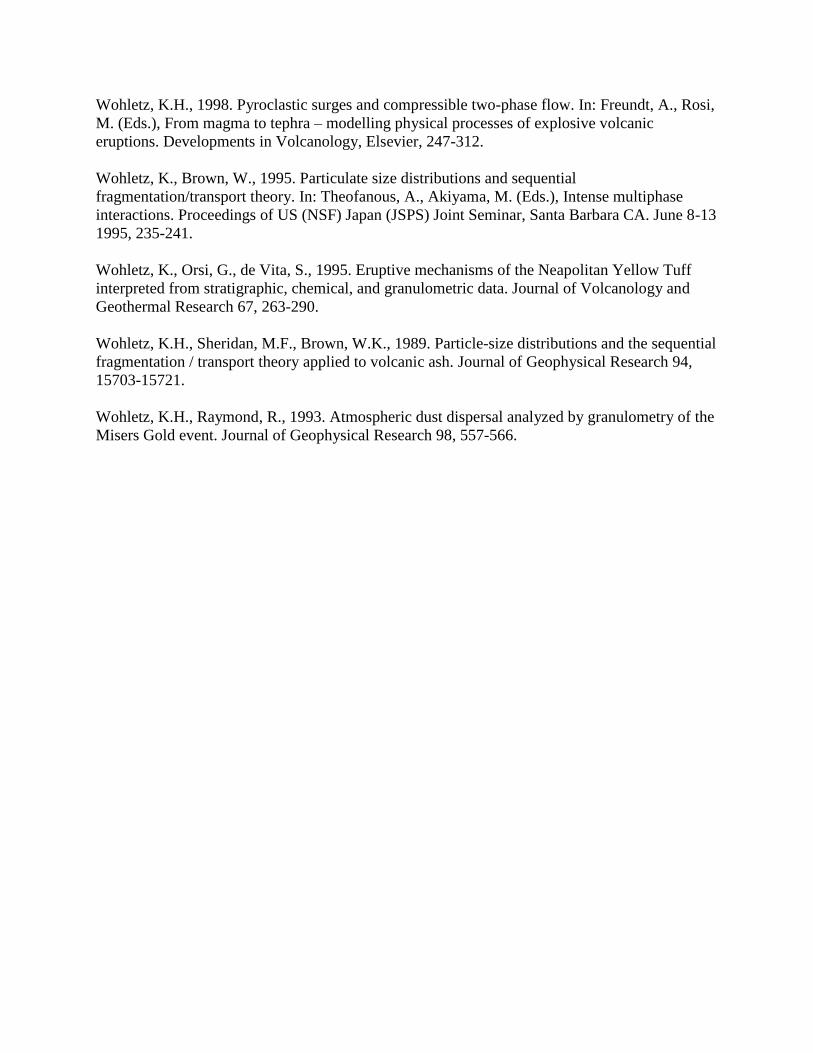
deposits (the present-day pumice plain; area with red arrows in Fig. 1).
Deep drainage erosion over the past 30 years has provided kilometers of excellent
exposure through the MSH deposits, allowing a detailed study of deposit structures to be
conducted (cf. Pollock and Brand, 2012; Pollock, 2013; Brand et al., in review). Readers are
referred to Brand et al. (in review) for a detailed analysis and interpretation of each MSH flow
unit and outcrop location. Here we restrict our descriptions to the general depositional features
and trends that are relevant to our research. ‘Proximal’ refers to outcrops <5.25 km from the
crater, ‘medial’ refers to outcrops 5.25-7.25 km from the crater, and ‘distal’ refers to outcrops
>7.25 km from the crater. Lithofacies abbreviations are modified from Branney and Kokelaar
(2002) and are presented in Table 1.

ACCEPTED MANUSCRIPT
2.1 Mt. St. Helens PDC Flow Units
Four major PDC flow units are identified in the drainages that transect the pumice plain,
which extends from the break in slope north of the MSH crater to Johnson Ridge (Figs. 1, 2).
We associate Units I and II with the waxing afternoon phase of the eruption (termed the early ash
flow phase by Criswell, 1987), and Units III and IV with the climactic phase of the eruption
(termed the climactic ash flow phase by Criswell, 1987).
Units I and II represent the first PDCs to traverse the MSH pumice plain. The base of
Unit I is rarely exposed, but where observed it is in contact with debris avalanche and blast
deposits from the beginning phases of the eruption. Overall, both Units I and II are thicker (>10
m) and dominated by massive lapilli tuff (mLT) in the distal regions, and thinner (<6 m) and
dominated by stratified (sLT) to diffusely-stratified and diffusely cross-stratified (dsLT) deposits
in the medial distances (Table 1). Both flow units grade between mLT, dsLT, and sLT over short
vertical and lateral distances (vertical gradations occur within meters; lateral gradations over 10s-
100s of meters), and the deposits generally become finer grained and have tighter sorting with
distance from source (See Fig. 4 in Brand et al., in review). Pumice lenses are common in both
flow units and increase in abundance in the distal regions. The contacts between Units I and II,
and between Units II and III, are characterized by thin (<50 cm), somewhat laterally continuous
massive tuffs.
The massive nature and general lack of fabric within the distal deposits suggests they
were produced by a concentrated current with negligible shear stress. However, the proximal
stratified and diffusely-stratified deposits indicate depositional regions where traction and/or
granular flow boundaries occurred, likely as a consequence of variability in surface roughness,
and reflect the inherent unsteadiness within the currents that produced Units I and II. The
ACCEPTED MANUSCRIPT
laterally continuous and massive nature of the fine ash layer between the units suggests
deposition occurred via direct fallout (cf. Branney and Kokelaar, 2002). Thus we interpret that
the fine ash layers settled from a co-ignimbrite ash cloud, the waning tail of the current, or some
combination of the two.
The climactic phase of the eruption produced the most voluminous and wide-spread
PDCs, which are responsible for the massive, lithic block-rich Unit III and IV. These units are
more widely exposed than Units I and II, with excellent outcrops proximal to distal from source
(Fig. 2). Unit III often has an erosive contact with scours that extend into the underlying flow
unit (Unit II). Where not erosive, the contact between Units II and III is denoted by a fines-rich
massive tuff similar to that found between Units I and II. The contact between Units III and IV
varies from sharp with a thin massive tuff at the contact, to diffuse and unrecognizable.
Units III and IV are block-rich, poorly-sorted massive lapilli tuffs. They are evenly
distributed across the pumice plain, and have thicknesses up to 9.5 and 8 m respectively. The
blocks of Unit III are found in lithic breccias (mlBr; Table 1) close to the base of the flow unit, in
lithic lenses dispersed throughout the thickness of the deposit, or as individual lithics randomly
dispersed throughout the deposit. Block accumulations sometimes reveal a diffuse fabric,
although this is not pervasive across the flow unit. There is no obvious decrease in the Unit III
median grain size or increase in degree of sorting with distance from source (See Fig. 4 in Brand
et al., in review). Pumice lenses are not present in Unit III, and the Unit III deposits are not fines
depleted. The negligible fines depletion (and therefore lack of evidence for ash elutriation),
weak segregation of lithics, and lack of obvious pumice segregation suggests that the deposits
were produced by a highly concentrated current with suppressed size-density segregation (Druitt,
1995; Druitt et al., 2007). The general absence of fabric suggests low basal shear rates that
ACCEPTED MANUSCRIPT
locally and temporally increase to produce the rarely-observed diffuse block fabric (Units III
lateral facies variations visible in Fig. 3).
Unit IV is typically finer-grained than Units I-III, and develops tighter sorting with
distance from source (Brand et al., in review). The blocks of Unit IV are most often found as
concentrated lithic breccias at the base of the flow unit or dispersed within the first few meters
above the base of the unit (Figs. 2, 3). Pumice lenses are common in Unit IV and increase in
abundance in the distal regions. The massive nature, basal accumulation of lithic blocks, and
abundant pumice lenses suggest that Unit IV was deposited from the base of a concentrated,
density stratified current with negligible basal shear stress. The even thicknesses of Units III and
IV across the depositional area and the extensive runout distances observed (up to 9 km) suggest
that both units were deposited by highly mobile currents. This evidence, combined with the
massive characteristics, high ash content, and general lack of fabric within the deposits, suggests
that the currents were fluidized and maintained high internal pore pressure across much of the
runout distance (cf. Roche, 2012).
2.2 Research Objectives
The excellent vertical and lateral PDC deposit exposure at MSH offers a unique
opportunity to test the applicability of using size-density relationships and physical parameters to
describe component particle distributions and decipher local versus regional transport processes.
This study seeks to determine (1) to what degree SFT analysis of particle fragmentation and
transport mechanisms is influenced by variations in the initial component distributions of target
pyroclastic deposits, (2) how the results of SFT analysis compare with conventional PDC study
methods when examining the impact of travel distance on the deposit characteristics of a single
PDC flow unit, and (3) the extent to which size-density relationships and SFT analysis can be
ACCEPTED MANUSCRIPT
used to reconstruct flow boundary conditions and emplacement mechanisms for a variety of PDC
lithofacies. We additionally combine field observations with SFT results in order to obtain
further information regarding PDC dynamics within the flow boundary zone.
3. Methods
3.1 Grain Size, Componentry, and Density Methods
For each sample we collected grain size data from -8 ɸ to 8 ɸ . Scaled photographs were
analyzed to determine the percent of clasts < -6 ɸ . Grain sizes between -6 ɸ and -3 ɸ were
sieved in the field, and medium grain sizes (-3 to 2 ɸ ) were dried and sieved in the lab. All
sieving was conducted at one-ɸ intervals using standard sieve techniques. The finest fraction
(>2 ɸ ) was analyzed using a MicroTrak laser grain size instrument.
As defined in Branney and Kokelaar (2002), “fines depletion” refers to deposits that
contain a lesser amount of ash than the surrounding PDC deposits. To determine the relative
quantity of fine ash in the MSH deposits, we follow the methods of Walker (1983) and compares
the sample weight percent of ash smaller than 0 ɸ (1 mm; F1) with the weight percent of ash
smaller than 4 ɸ (1/16 mm; F2). Ash smaller than 4 ɸ is most susceptible to elutriation, so
calculating the F2:F1 ratio enables the observation of relative fines enrichment or depletion in
the PDC deposits (Walker, 1983). For the data spread at MSH, F2:F1 ratios ≤1.6:10 are
considered “fines-depleted” and ratios ≥3.5:10 are considered “fines-enriched.”
Juvenile pumice, free crystals, and accidental lithic components were distinguished for
each grain size. We separated the components by hand picking down to 4 ɸ (a binocular
microscope was used for phi sizes > 0 ɸ ). Due to the difficulty of accurately separating the three
components for grain sizes smaller than 4 ɸ , we determined the componentry of the finest size
bins using a scanning electron microscope (SEM). Consistent with assumptions made in the
ACCEPTED MANUSCRIPT
literature, MSH grain sizes > 4 ɸ are predominately made up of crystals and crystal fragments
(Sparks, 1976). We also observe a fraction of glass particles derived from fragmented pumices
that are present in this size class; however, due to the extremely small proportion of glass and the
physical difficulty of separating glass and crystal fragments in this size range, the glass
component is not included in this study. To ensure the accuracy of the component distributions,
we calculated the relative % (in number of particles) of each component after a 100, 300, 500,
and 1000 particle count for several samples. This accuracy study indicated that a 300 particle
count for each grain size is accurate to within 5% (slightly greater error for grain sizes ≤0 ɸ ); the
component percentages presented in this study were determined using particle counts of at least
300 grains.
Density was calculated using water displacement methods for lithic and crystal
components for grain sizes between -3 ɸ and 1 ɸ ; water displacement methods were applied to
>300 clasts for each component grain size. During water displacement we observed that closest
packing for lithics and crystals results in ~50% particle void space. To calculate the pumice
density we measured the weight of each sample, and assume 50% void space between pumice
clasts to determine the pumice sample volume. We use these weight and assumed volume values
to calculate MSH pumice density for the -3 ɸ to 1 ɸ size range. A secondary density study was
conducted for the 1 ɸ grain size using a helium picnometer to determine sample volume and
void space for the lithic and crystal components (the pumice vesicularity resulted in inaccurate
picnometer volume measurements). The water displacement and helium picnometer methods
produce consistent density results. We average the density measurements of each component,
and use the resulting values to convert particle size-frequency diagrams from volume to weight
proportions (Fig. 2).
ACCEPTED MANUSCRIPT
3.2 Sequential Fragmentation / Transport Theory
PDC component grain size distributions are described using sequential fragmentation /
transport theory (SFT). SFT analysis is a methodology that predicts particle mass distributions
through integration of a sequence of fragmentation and transport events, parameterized by an
initial mass distribution and the mass sensitivities of fragmentation and transport processes
(Brown and Wohletz, 1995). Predicted SFT distributions are optimized to observed sample
distributions in order to establish a forward model that best characterizes the sample. While
conventional methods have historically provided effective descriptions of size-frequency
distributions, the methods (e.g., lognormal best-fit curves) are based on empirical
characterizations of grain size data, and as such any physical interpretation is fundamentally
limited (Sheridan et al., 1987; Wohletz et al., 1989; Wohletz, 1998). SFT applies to particle
mass distributions that have undergone a sequence of fragmentation and transport events, and
produces distribution models that are physically rather than empirically based (Wohletz et al.,
1989). As such, SFT can be used to determine physical processes from distribution parameters.
Additionally, previous studies indicate that model functions produced using SFT analysis fit the
size-frequency curves of pyroclastic deposits more accurately than lognormal functions (Wohletz
et al., 1989; Orsi et al., 1992; Wohletz and Raymond, 1993; Brown and Wohletz, 1995; Wohletz
et al., 1995; Taddeucci and Palladino, 2002).
We apply the SFT software program developed by K. Wohletz (©KWARE, University of
California 2000) to analyze the MSH data. This software allows user-interactive characterization
of data subpopulations within complex, polymodal size distributions. For each sample, the bulk
grain size distribution is decomposed into discrete component distributions, which are then
analyzed individually using the SFT software. The program first fits a cubic spline curve to the

ACCEPTED MANUSCRIPT
grain size histogram. The operator then isolates distribution subpopulations, and characterizes
each subpopulation by determining the approximate mode, standard deviation, and weight
fraction for a representative SFT function. The operator is able to refine the synthetic SFT
functions to create a best-fit composite curve for the original data spline (Fig. 4). Best-fit is
determined by calculating the residual weight fraction between the original histogram spline and
the synthetic composite curve. In cases where the MSH samples display clear data curve
truncations, rather than discarding the data points we include approximate weight percent and
componentry values in order to complete the curves and obtain representative functions and
descriptive parameters.
SFT analysis characterizes the MSH component distributions using one to six data
subpopulations, and describes the subpopulations in terms of three parameters: weight fraction,
mode, and dispersion. Weight fraction expresses the relative proportion of a given subpopulation
within the entire component sample. Mode is the phi size at the peak of a subpopulation.
Dispersion is directly related to the mass sensitivity of the subpopulation fragmentation or
transport mechanisms; larger dispersion values reflect increased particle processing through
fragmentation and transport events. The dispersion parameter describes the shape of the
synthetic size-frequency curve similar to the standard deviation for a lognormal curve, but SFT
dispersion also controls a predicted amount of skewness. Dispersion values near -1 produce
coarse, flat model distributions, while increasing values (reflecting more advanced particle
processing) result in distributions that are fine-skewed and more peaked (Fig. 5). When plotted
against each other, the weight fraction, mode, and dispersion parameters can be used to attribute
the different subpopulations to specific particle transport and emplacement mechanisms (e.g.,
Wohletz et al., 1989; Orsi et al., 1992; Wohletz and Raymond, 1993; Wohletz, 1998). See
ACCEPTED MANUSCRIPT
Wohletz et al. (1989) for a complete description of the SFT software program and the
mathematical derivation of the parameters.
4. Results
4.1 Grain Size, Componentry, and Density Results
Juvenile pumice, free crystals, and accidental lithic components were distinguished for
each grain size. The juvenile MSH pumice clasts are characterized by approximately 30%
phenocrysts, including plagioclase, orthopyroxene, amphibole, and iron-titanium oxide crystals,
in a glassy groundmass with microlites (weight percent calculated vesicle-free to 100%; Kuntz et
al., 1981). Comparison of the crystal size and mineralogy of both pumice and free crystals
suggests that free crystals are almost entirely derived from fragmented pumices. A greater
quantity of felsic crystals than mafic crystals are observed for all crystal size bins. Lithics are
derived from past eruptive periods at MSH, and include basalt, basaltic andesite, andesite, dacite,
and rhyodacite. Average pumice density was calculated to be 1300 kg m-3
, lithic density to be
2700 kg m-3
, and crystal density to be 2600 kg m-3
. These average values were used to calculate
component weight percent for each sample and create bulk and individual component
distributions (Fig. 2).
4.2 SFT Results
SFT descriptive parameters (weight fraction, mode, and dispersion) are plotted for the
pumice, lithic, and crystal components of each sample. The mode versus weight percent plots
allow us to determine the most representative SFT subpopulations for each component within a
given sample. The mode versus dispersion plots characterize the degree of particle processing
that the component subpopulations in the distribution have experienced. The weight percent
ACCEPTED MANUSCRIPT
versus dispersion plots show subpopulation particle processing trends that reflect the extent to
which each data point represents the overall component distribution.
We use these plots to address our study questions. We compare the SFT parameter
distribution trends observed (1) for three samples within the fallout lithofacies in order to assess
the influence of variations in initial component distributions on SFT results (Fig. 6), (2) for a
single PDC flow unit over changing distance from source to compare SFT results with those
obtained using conventional PDC study methods (Fig. 7), and (3) across lateral facies variations
that occur throughout multiple flow units to evaluate and constrain the ability of SFT analysis to
reconstruct flow boundary conditions and emplacement mechanisms as indicated by fabric
studies and deposit structures (Figs. 8-10). An objective analysis of the data trends is presented
below in sections 4.2.1 Fallout Data, 4.2.2 Travel Distance Data, and 4.2.3 Lithofacies
Variation Data; interpretations are presented in 5. Discussion subsections 5.1 Fallout, 5.2 Travel
Distance, and 5.3 Lithofacies Variation.
4.2.1 Fallout Data
We plot the SFT parameters describing the fallout samples separately from the other
lithofacies to examine how the same transport process affects parameter values of samples with
varied component distributions. We collected three MSH fallout samples, each with a distinctly
different relative component distribution (Table 2; grain size and componentry data courtesy of
Benjamin Andrews, Smithsonian Institute). Sample B1_a was produced during the morning
phase of the eruption; samples B3_b and B3_c were produced during the afternoon phase (B1
and B3 correlate with the fall characterization of Andrews and Gardner, 2009).
SFT descriptive parameters are plotted for the pumice, lithic, and crystal components of
each sample (Fig. 6a-i). The first row of plots (Fig. 6a, d, g) represents the parameter
ACCEPTED MANUSCRIPT
distributions of pumice subpopulations, the second row (Fig. 6b, e, h) represents the distributions
of lithic subpopulations, and the third row (Fig. 6c, f, i) represents the distributions of crystal
subpopulations. Mode versus weight percent (Fig. 6a-c), mode versus dispersion (Fig. 6d-f), and
weight percent versus dispersion (Fig. 6g-i) are plotted for each component. Multiple
subpopulation points represent the component distribution of a single sample; for example, the
pumice distribution of sample B1_a is characterized by four subpopulations, which translate to
four sample points on the pumice component plots (Fig. 6a-c).
Mode versus weight % plots: We observe that despite significant differences in the
component distributions of the three fallout samples (Table 2), the SFT parameters consistently
display the same trends. The only exceptions to the sample clusters occur for weight percent
values of subpopulations within samples that have a dominant component; for example, the B1_a
subpopulations with high pumice weight percent values (Fig. 6a), and the B1_a and B3_c
subpopulations with high lithic weight percent values (Fig. 6b).
Mode versus dispersion plots: The fallout samples display high average dispersion
values for the coarse- and fine-grained subpopulations, with most points plotting between -0.4
and 0. However, there is an abrupt decrease in dispersion to values as low as -0.9 for the middle
grain sizes. The trend is most apparent in the pumice and lithic components, for which the
decrease in dispersion values occurs between -2 and 1 ɸ (Fig. 6d, e), and is present to a lesser
degree in the crystal component data spread, for which the decrease in dispersion values occurs
between -1 and 3 ɸ (Fig. 6f).
Weight % versus dispersion plots: All fallout samples show a general trend of decreasing
dispersion values with increasing subpopulation weight percent (Fig. 6g-i). The outliers to this
trend in the fallout distributions are the consequence of greater weight percent values for
ACCEPTED MANUSCRIPT
subpopulations describing dominant sample components (e.g., Fig. 6g for pumice, Fig. 6h for
lithics). This trend also occurs in the SFT parameters of the other MSH lithofacies regardless of
distance from source, and is discussed in greater detail in the following sections.
4.2.2 Travel Distance Data
To examine the impact of travel distance on PDC deposit SFT characteristics, we
compare the parameter values for samples taken from the Unit III massive lapilli tuff (mLT)
lithofacies at proximal (<5.25 km), medial (5.25-7.25 km), and distal (>7.25 km) outcrop
locations. SFT parameter data are plotted in the same format as that presented for the fall
deposits (Fig. 7a-i). Multiple Unit III mLT samples were taken at each outcrop location and
distance from source. As such, though individual samples may still be characterized by multiple
subpopulations, the subpopulation points in the plots represent the component distribution of
multiple samples for each outcrop distance.
Mode versus weight % plots: No significant changes are observed in the mode versus
weight percent data for the pumice or lithic components with distance from source (Fig. 7a, b).
The crystal component, however, shows a notable increase in weight percent between 1 Φ and 2
Φ, which correlates with the dominant MSH crystal size. There is also a more extensive
distribution of the finest crystal sizes for medial and distal locations (Fig. 7c).
Mode versus dispersion plots: The pumice subpopulations in the mode versus dispersion
plots show a general increase in dispersion with decreasing grain size at all outcrop locations
(Fig. 7d). In contrast, the crystal subpopulations exhibit a moderate decrease in dispersion
values for the smaller grain sizes, again at all outcrop locations (Fig. 7f). No changes in
dispersion values as a function of grain size are observed for the lithic subpopulations (Fig. 7e).

ACCEPTED MANUSCRIPT
We do not observe significant trends in the mode versus dispersion data for the pumice
subpopulations with distance from source (Fig. 7d). The range of dispersion values for the lithic
subpopulations increases with distance from source, from ~-0.9 to -0.7 for the proximal and
medial locations to ~-0.9 to -0.2 for the distal locations; the average lithic dispersion value is also
highest at the most distal locations (Fig. 7e). Similar to the lithic component, we observe the
greatest crystal subpopulation dispersion ranges for the distal samples, and the highest average
crystal dispersion for the distal samples relative to the proximal and medial crystal samples (Fig.
7f).
Weight % versus dispersion plots: Similar to the trend observed in the fallout data plots,
all Unit III mLT components show a distinct decrease in dispersion values with increasing
subpopulation weight percent for all outcrop locations (Fig. 7g-i). This trend is most apparent
for the lithic component, for which dispersion values range from ~-0.95 to -0.2 when weight
fractions are less than 10%, but are limited to ~-0.95 to -0.8 when weight fractions are greater
than 10% (Fig. 7h). A wide dispersion range for low weight fractions is also noted for the
pumice component, but due to the consistently low weight percent of pumice subpopulations in
the mLT the trend is not developed in the greater weight fractions (Fig. 7g). The crystal
component displays the same general trend as the lithics, but a secondary cluster of
subpopulations characterized by both greater weight fractions and higher dispersion values is
also present (e.g., dispersion values from -0.8 to -0.6 for subpopulation weight percent >10%;
Fig. 7i).
4.2.3 Lithofacies Variation Data
We examine the SFT parameter distributions for a variety of lithofacies to determine the
extent to which parameter values reflect flow boundary conditions and emplacement processes as

ACCEPTED MANUSCRIPT
they are interpreted based on the previous work conducted on the extensive MSH deposit
exposures (e.g., Bendana et al., 2012; Pollock and Brand, 2012; Pollock 2013; Brand et al., in
review). We examine massive lapilli tuff (mLT), massive tuff breccia (mlBr), stratified lapilli
tuff (sLT), and pumice lens (lensP) lithofacies (Fig. 3; Table 1), as well as the proximal cross-
stratified deposit (xsLT; Rowley et al., 1985; Beeson, 1987; Bendana et al., 2012) and the fallout
samples studied in Fig. 6. The larger quantity of samples and component subpopulations results
in graphical distributions that are significantly more complex for the lithofacies variation plots
than for the fallout or travel distance plots. We plot the parameter data in the same format as that
used to present the fall deposits and distance from source plots, but we separate the lithofacies
plot columns into three figures in order to simplify the data spreads. As such, Fig. 8 plots mode
versus weight percent for the three components, Fig. 9 plots mode versus dispersion for all three
components, and Fig. 10 plots weight fraction versus dispersion for all three components. Data
series are identified by lithofacies in the plot legend. As in the travel distance plots, the
subpopulation clusters represent multiple samples of each lithofacies rather than a single
lithofacies sample.
Mode versus weight % plots: The dominant components of the lensP and mlBr
lithofacies (e.g., pumice in the lensP, lithics in the mlBr) display similar SFT parameter trends, in
that the dominant component in the larger to medial size classes has greater weight percent
values and broader dispersions for both lithofacies (Fig. 8a, b). We also observe diminished
weight fractions of the non-dominant components in the lensP and mlBr for all size classes
relative to the other lithofacies. The mode versus weight percent plot representing the crystal
component further reveals that though the MSH pumice clasts are rich in crystals, the crystal
component for the pumice lenses has low weight percent values relative to the other lithofacies
ACCEPTED MANUSCRIPT
in this study (Fig. 8c). The low crystal weight percent is most notable near the average crystal
size (~1-2 ɸ ), where the other lithofacies experience a peak in the crystal weight fraction.
Finally, we observe that the SFT parameter distribution of the MSH sLT (observed and sampled
at outcrop AD-3, Fig. 3), which grades laterally into mLT, is almost identical to the parameter
distributions of all mLT samples (e.g., Fig. 8a-c).
Mode versus dispersion plots: We consider both the full range (from lowest dispersion
value to highest for a given lithofacies) and most populated zone of subpopulation points when
comparing the dispersion values exhibited across the different subpopulations for the MSH
lithofacies. We use box plots in order to statistically simplify and describe the trends observed in
the complex mode versus dispersion data produced by the SFT physical modeling. The box plots
depict the dispersion range and most populated zone of dispersion data points (statistically
constrained between the 1st and 3
rd quartile) for each lithofacies, as overlain on the mode versus
dispersion plots (Fig. 9). We note that there are too few xsLT subpopulations to produce accurate
quartile dispersion values, and as such plot the dispersion range with no quartile box for this
lithofacies. Most lithofacies occupy a fairly broad range of dispersion for all components.
However, several significant differences between the component distributions and individual
lithofacies are noted when both the quartile region and dispersion range data are examined.
The pumice component subpopulations of the mLT, mlBr, sLT, and lensP lithofacies are
notably similar for both the full and quartile dispersion ranges, for all grain sizes (Fig. 9a). The
entire dispersion spread for each of these lithofacies ranges from ~-0.9 to -0.4, and the quartile
zone extends from ~-0.85 to -0.65. The pumice subpopulations of the xsLT also occupy the same
data range. In comparison, the fallout lithofacies exhibits a more extended overall range (-0.82
to -0.03), and much higher dispersion values within the concentrated zone (-0.625 to -0.24) for

ACCEPTED MANUSCRIPT
the pumice component. A decrease in the dispersion values at the medial grain sizes for the
pumice subpopulations, similar to the dip observed for the fallout samples (Fig. 6d-f), occurs for
the mLT, mlBr, and lensP lithofacies between -4.5 to -1 Φ (Fig. 9a). This trend is not noted in
the more dense lithofacies components.
The dispersion ranges of the lithic and crystal component distributions show more
significant changes across the different lithofacies (Fig. 9b-c). The mLT, mlBr, and sLT
subpopulations have similar concentrated dispersion ranges (~-0.9 to -0.6 or -0.7). The
concentrated range for the lensP lithofacies encompasses slightly higher dispersion values (-0.82
to -0.6474), and the dispersion values characterizing the fallout quartile zone are significantly
greater than the other lithofacies (-0.77 to -0.24). For the lithic and crystal component
subpopulations, we observe that the range of dispersion values characterizing the quartile zone is
generally the most broad for the mLT lithofacies (-0.89 to -0.6675 for lithics, Fig. 9b; -0.885 to -
0.635 for crystals, Fig. 9c), and the most limited for the mlBr lithofacies (-0.9375 to -0.885 for
lithics, Fig. 9b; -0.91 to -0.7725 for crystals, Fig. 9c). We also note that the crystal component
subpopulations have the highest overall dispersion values for all lithofacies (~-0.8 to -0.2 for
crystals, compared with ~-0.95 to -0.7 for lithics and -0.9 to -0.65 for pumice; Fig. 9a-c).
Weight % versus dispersion plots: The trend of decreasing dispersion values with
increasing subpopulation weight percent observed for the fallout and Unit III mLT samples is
present for each component, for all of the MSH lithofacies (weight fraction versus dispersion
plots, Fig. 10). The trend is least developed in the pumice component (Fig. 10a). For the pumice
subpopulations, dispersion values range from ~-0.98 to -0.1 for all lithofacies when weight
fractions are less than 10%, but weight percent values are rarely greater than 6 or 7% so any
trend with increasing weight percent is not developed. The outlying points in the pumice
ACCEPTED MANUSCRIPT
component plots are from samples with high pumice content (e.g., lensP and the pumice-rich
fallout sample; Table 2).
The lithic component expresses the trend of decreasing dispersion with increasing
subpopulation weight percent most distinctly for all lithofacies (Fig. 10b). Dispersion values
range from ~-0.99 to -0.2 for weight fractions less than 10%, and the dispersion range is limited
to ~-0.99 to -0.7 or less when weight fractions are greater than 10%. There are only three
outlying points in the lithic component plot, all from the fallout samples with significantly high
lithic contents (Table 2).
Again, both the general trend of decreasing dispersion values with increasing
subpopulation weight percent and the secondary cluster of subpopulations exhibiting greater
weight fractions and higher dispersion values characterize the crystal subpopulations for all MSH
lithofacies (Fig. 10c). Dispersion values range from ~-0.95 to -0.4 when subpopulation weight
percent values are greater than 10% in the crystal component, though the range decreases to ~-
0.9 to -0.7 for crystal subpopulations with weight percent greater than 25%.
5. Discussion
Different PDC particle transport mechanisms have been shown to produce unique size-
density distributions at the outcrop scale, enabling the reconstruction of parent current processes
using physically-based SFT model functions and descriptive parameters (e.g., Wohletz, 1989;
Orsi et al., 1992; Wohletz and Raymond, 1993; Wohletz and Brown, 1995; Wohletz et al., 1995;
Wohletz, 1998; Taddeucci and Palladino, 2002). We interpret the SFT data trends described
above in terms of particle transport mechanisms and depositional conditions, and examine the
extent to which the deposit information provided using SFT analysis coincides with the field
observations and interpretations made based on the excellent MSH deposit exposures (e.g.,
ACCEPTED MANUSCRIPT
Pollock and Brand, 2012; Pollock 2013; Brand et al., in review). Our evaluation of the SFT
results for the fallout, travel distance, and lithofacies comparison studies within the context of
broader MSH field observations allows us to further define and reinforce the capabilities of SFT
analysis when applied to pyroclastic deposits, and to develop a more complete understanding of
PDC dynamics based on the detailed particle size-density trends characterized by the SFT
parameters.
5.1 Fallout
The same SFT parameter trends are observed for the fallout samples despite the
differences in initial ash fall componentry and grain size distributions (Table 2). This suggests
that the SFT approach strongly reflects particle transport mechanisms, and that the general SFT
parameter distributions are (to some degree) independent from the specific component
distributions of individual pyroclastic samples. We note that the pumice subpopulation outliers
for sample B1_a (e.g., Fig. 6a, g) and lithic outliers for sample B3_c (e.g., Fig. 6b, h) certainly
reflect the higher initial weight percent values of these components within each fallout sample.
However, the pumice outliers in B1_a may also reflect density variations in the individual
pumice clasts that our density study does not account for.
The decrease in dispersion values in the middle size range for all components suggests
more poorly-sorted and less processed subpopulations relative to the coarser and finer grain
sizes. Previous work by Durant et al. (2009) applied SFT analysis to MSH fallout deposits at
distances ~100 to 700 km from source and observed ash particle aggregation at these locations,
which results in substantially increased particle processing and high (>0) dispersion values for
the relevant grain sizes. Particle aggregation was not noted in the proximal fallout sample
locations examined in our study, and we observe that fragmentation mechanisms do not impact

ACCEPTED MANUSCRIPT
MSH component subpopulations as ubiquitously as individual transport processes. As such,
because the decrease in dispersion occurs for all components in the middle grain sizes it likely
relates to a transport process rather than aggregation or fragmentation mechanisms. The higher
dispersion values for the finer and coarser grain sizes may reflect that the particles comprising
these subpopulations are more influenced by suspension or turbulent drag, while the decreased
dispersion values in the middle size range likely reflect ballistic transport with limited turbulence
or drag effects.
5.2 Travel Distance
Conventional grain size and fabric studies reveal limited change within the Unit III mLT
lithofacies with distance from source. There is little decrease in median grain size or increase in
degree of sorting with distance, and the unit has a relatively high quantity of fine ash for the
MSH mLT lithofacies at all locations across the pumice plain. As previously interpreted, the lack
of fines depletion or pumice lenses, random (rather than concentrated) distribution of lithic
blocks, and absence of conventional fining or sorting trends with distance from source suggests
that Unit III was deposited from a highly concentrated current with suppressed density
segregation and elutriation. The lack of significant change in the mode versus weight percent
SFT parameter distributions for the pumice and lithic components more specifically indicates
that there was little change in the Unit III grain size distributions for these components during
transport. However, the detailed examination provided by the analysis of additional SFT
parameters and PDC components reveals changes in the Unit III particle characteristics that are
not observed in the conventional grain size and fabric data, and indicates that size-density
segregation did occur within the current during transport.
ACCEPTED MANUSCRIPT
In their study of pyroclastic particle size-density relationships, Taddeucci and Palladino
(2002) find that the SFT parameters describing the crystal subpopulations are better indicators of
particle emplacement processes than the pumice or lithic subpopulations, and contend that this is
due to the initial homogeneity of crystal size and density relative to the pumice and lithic
components. For the MSH deposits, we are able to elucidate emplacement and transport
information from the pumice and lithic subpopulations as well as the crystal subpopulations.
However, we note that the greater size-density constraints on the crystal component may allow
us to isolate the SFT parameter distributions and resulting interpretations from the influence of
complex initial particle distributions such as those characterizing the pumice and lithics.
The weight percent increase in the crystal component subpopulations around 1 Φ reflects
the initial size constraints on the crystal component. The dominant crystal size from the May 18,
1980 magma is ~1 Φ, resulting in an increased weight percent of the ~1 Φ crystal subpopulations
(Fig. 7c). The greater number of relatively fine-grained crystal subpopulations at the medial and
distal outcrop locations is a consequence of crystal fracturing and fragmentation during transport.
For all Unit III outcrop locations, the smaller grain sizes of the pumice component have
higher dispersion values (Fig. 7d), while the larger grain sizes of the crystal component have
lower dispersion values (Fig. 7f). The trend in the pumice component reflects a transport or
fragmentation mechanism that processes smaller grain sizes to a greater degree than the larger
grain sizes, regardless of deposit distance from source. The trend of better sorting for larger
crystal sizes is consistent with the aforementioned initial size range of intact crystals. Crystal
size is limited by the degree of crystal growth (reflected as crystal aggregation in the SFT
program) as well as the degree of crystal fragmentation or break-up during transport. Other than
necessarily occupying smaller size bins than the parent crystals, crystal fragments do not have
ACCEPTED MANUSCRIPT
initial size constraints that influence the component distribution. As such, the larger crystal grain
sizes (made up of primarily whole crystals) are more constrained and processed, while the
smaller crystal grain sizes (made up of primarily crystal fragments) are not constrained and are
relatively poorly processed.
The higher average dispersion values observed for the lithic and crystal components at
distal outcrop locations relative to the proximal and medial distributions suggests that these
components were notably influenced by segregation and processing mechanisms with distance
from source, possibly as a result of their greater densities. Additionally, the greater dispersion
ranges for the lithics and crystals at distal locations indicate that these denser components
experienced more complex processing mechanisms during transport (Fig. 7e, f).
5.3 Lithofacies Variation
Stratigraphic analysis and the study of lithofacies architectures provides valuable
information and limits on local PDC flow boundary processes and deposit emplacement
mechanisms (e.g., Walker, 1971; Sparks, 1976; Valentine et al., 1992; Wohletz, 1998; Branney
and Kokelaar, 2002; Taddeucci and Palladino, 2002; Sulpizio et al., 2008). Previous studies at
MSH have been able to constrain PDC flow boundary conditions with distance from source, over
a variety of substrate and surface roughness conditions (Pollock and Brand, 2012; Brand et al., in
review). The application of SFT methodology to the well-constrained MSH PDC deposits
allows us to examine how SFT parameters reflect current processes and flow boundaries.
Furthermore, when we consider both the deposit characteristics and the detailed particle
distribution analysis that SFT provides, we are able to make significant interpretations regarding
regional PDC sedimentation regimes.
ACCEPTED MANUSCRIPT
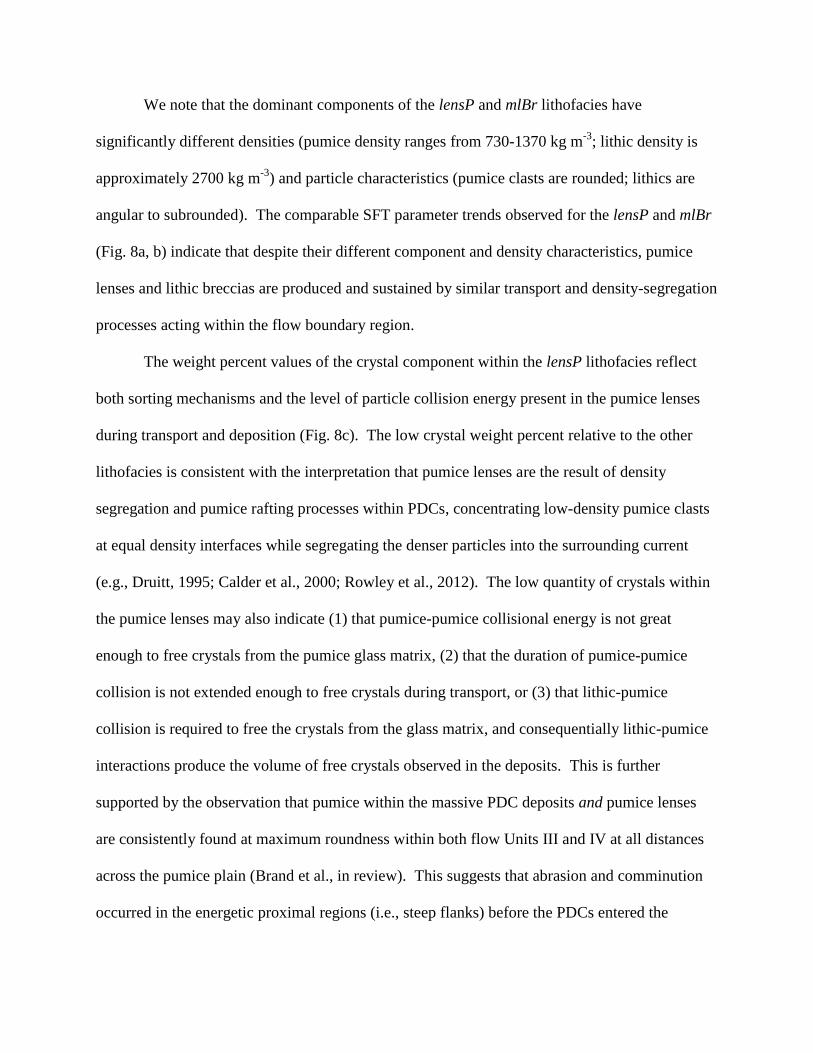
We note that the dominant components of the lensP and mlBr lithofacies have
significantly different densities (pumice density ranges from 730-1370 kg m-3
; lithic density is
approximately 2700 kg m-3
) and particle characteristics (pumice clasts are rounded; lithics are
angular to subrounded). The comparable SFT parameter trends observed for the lensP and mlBr
(Fig. 8a, b) indicate that despite their different component and density characteristics, pumice
lenses and lithic breccias are produced and sustained by similar transport and density-segregation
processes acting within the flow boundary region.
The weight percent values of the crystal component within the lensP lithofacies reflect
both sorting mechanisms and the level of particle collision energy present in the pumice lenses
during transport and deposition (Fig. 8c). The low crystal weight percent relative to the other
lithofacies is consistent with the interpretation that pumice lenses are the result of density
segregation and pumice rafting processes within PDCs, concentrating low-density pumice clasts
at equal density interfaces while segregating the denser particles into the surrounding current
(e.g., Druitt, 1995; Calder et al., 2000; Rowley et al., 2012). The low quantity of crystals within
the pumice lenses may also indicate (1) that pumice-pumice collisional energy is not great
enough to free crystals from the pumice glass matrix, (2) that the duration of pumice-pumice
collision is not extended enough to free crystals during transport, or (3) that lithic-pumice
collision is required to free the crystals from the glass matrix, and consequentially lithic-pumice
interactions produce the volume of free crystals observed in the deposits. This is further
supported by the observation that pumice within the massive PDC deposits and pumice lenses
are consistently found at maximum roundness within both flow Units III and IV at all distances
across the pumice plain (Brand et al., in review). This suggests that abrasion and comminution
occurred in the energetic proximal regions (i.e., steep flanks) before the PDCs entered the
ACCEPTED MANUSCRIPT
pumice plain consistent with the findings of Manga et al. (2010), and that even though the
currents were likely concentrated and particle-particle collisions important, particle collisional
energy was not sufficient to break the pumice because the pumice is not observed to decrease in
roundness.
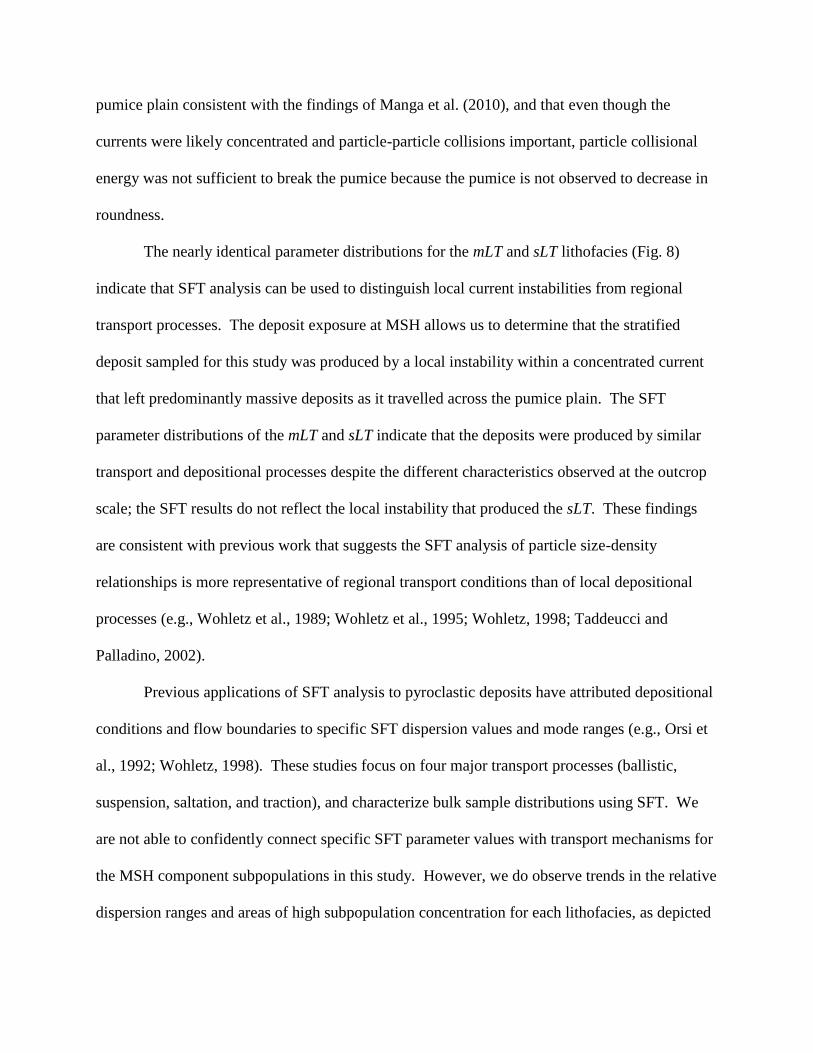
The nearly identical parameter distributions for the mLT and sLT lithofacies (Fig. 8)
indicate that SFT analysis can be used to distinguish local current instabilities from regional
transport processes. The deposit exposure at MSH allows us to determine that the stratified
deposit sampled for this study was produced by a local instability within a concentrated current
that left predominantly massive deposits as it travelled across the pumice plain. The SFT
parameter distributions of the mLT and sLT indicate that the deposits were produced by similar
transport and depositional processes despite the different characteristics observed at the outcrop
scale; the SFT results do not reflect the local instability that produced the sLT. These findings
are consistent with previous work that suggests the SFT analysis of particle size-density
relationships is more representative of regional transport conditions than of local depositional
processes (e.g., Wohletz et al., 1989; Wohletz et al., 1995; Wohletz, 1998; Taddeucci and
Palladino, 2002).
Previous applications of SFT analysis to pyroclastic deposits have attributed depositional
conditions and flow boundaries to specific SFT dispersion values and mode ranges (e.g., Orsi et
al., 1992; Wohletz, 1998). These studies focus on four major transport processes (ballistic,
suspension, saltation, and traction), and characterize bulk sample distributions using SFT. We
are not able to confidently connect specific SFT parameter values with transport mechanisms for
the MSH component subpopulations in this study. However, we do observe trends in the relative
dispersion ranges and areas of high subpopulation concentration for each lithofacies, as depicted

ACCEPTED MANUSCRIPT
in the box plots in Fig. 9 (high subpopulation concentration is statistically defined as the zone
between the 1st and 3
rd quartile for individual lithofacies) and interpreted below. We note that
most of our observations are consistent with expectations based on the emplacement mechanisms
indicated by deposit characteristics.
The higher dispersion values for the fallout lithofacies for the pumice, lithic, and crystal
components (Fig. 9) indicate that all of the components are more thoroughly processed and better
sorted relative to the components of the other lithofacies. This is expected since fallout samples
are the product of suspension sedimentation processes, as opposed to the other lithofacies which
are produced by dilute or concentrated PDCs. These MSH SFT parameter results are consistent
with established trends in pyroclastic deposits (e.g., Walker, 1971; Sparks et al., 1973; Sheridan
et al., 1987; Branney and Kokelaar, 2002; Taddeucci and Palladino, 2002). The lithic and crystal
subpopulations within the lensP lithofacies demonstrate the next highest dispersion values after
the fallout samples (Fig. 9b, c). The high dispersion values indicate better sorting and more
complete processing of the dense components within the lensP, consistent with previous
interpretations of lensP density segregation processes (e.g., Druitt, 1995; Calder et al., 2000).
The mlBr subpopulations consistently have the lowest dispersion values and most limited
dispersion range, data that indicates the mlBr is the most poorly-sorted and least processed of the
MSH lithofacies (Fig. 9a-c). This suggests that once the particles are segregated into a
concentrated zone of lithics, further processing, sorting, and segregation are inhibited. We note
that the breccia in our study was transported from the vent rather than locally entrained, and as
such the poor sorting and processing is not a result of limited particle travel distance.
The PDC conditions that result in the decrease in pumice subpopulation dispersion values
at the medial grain sizes for the mLT, mlBr, and lensP lithofacies (Fig. 9a) are likely the same as

ACCEPTED MANUSCRIPT
the conditions producing the trend in all components within the fallout lithofacies (discussed in
5.1 Fallout, Fig. 6d-f). As such, the decreased suspension or turbulent drag effects that we
interpret to be responsible for the dip in dispersion values in the middle size range occur
throughout a wide range of transport regimes.
The trend of decreasing dispersion values with increasing subpopulation weight percent
for all PDC deposit components (Fig. 10a-c) reflects a process that occurs for all lithofacies,
regardless of distance from source. The smaller subpopulations (e.g., those that occupy lesser
distribution weight percent) have broader ranges of dispersion values; that is, the smaller
subpopulations undergo a greater variety of transport or fragmentation processes. This is
plausible in that there may be a large number of minor transport or fragmentation mechanisms
influencing the particles within the current, but major mechanisms affecting a greater quantity of
current components are more limited.
For the lithofacies variation plots, the only outliers in the decreasing dispersion with
increasing weight percent trend occur for subpopulations representing the dominant component
of a sample or lithofacies, and reflect the greater weight percent of that dominant component
(Fig. 10a-c). The outliers have higher dispersion values for larger weight percent than the
general trend, which reflects greater particle processing. This is consistent with what is expected
for particle processing: if there is a dominant component in a current, it undergoes a greater
degree of processing within that current than the components that do not occupy such a large
percent of the PDC solid fraction.
As we mention regarding the fallout and travel distance plots, the lithic and crystal
components are more influenced by the transport mechanism and parameter relationship that
produces the decreasing dispersion with increasing subpopulation weight percent trend than the
ACCEPTED MANUSCRIPT
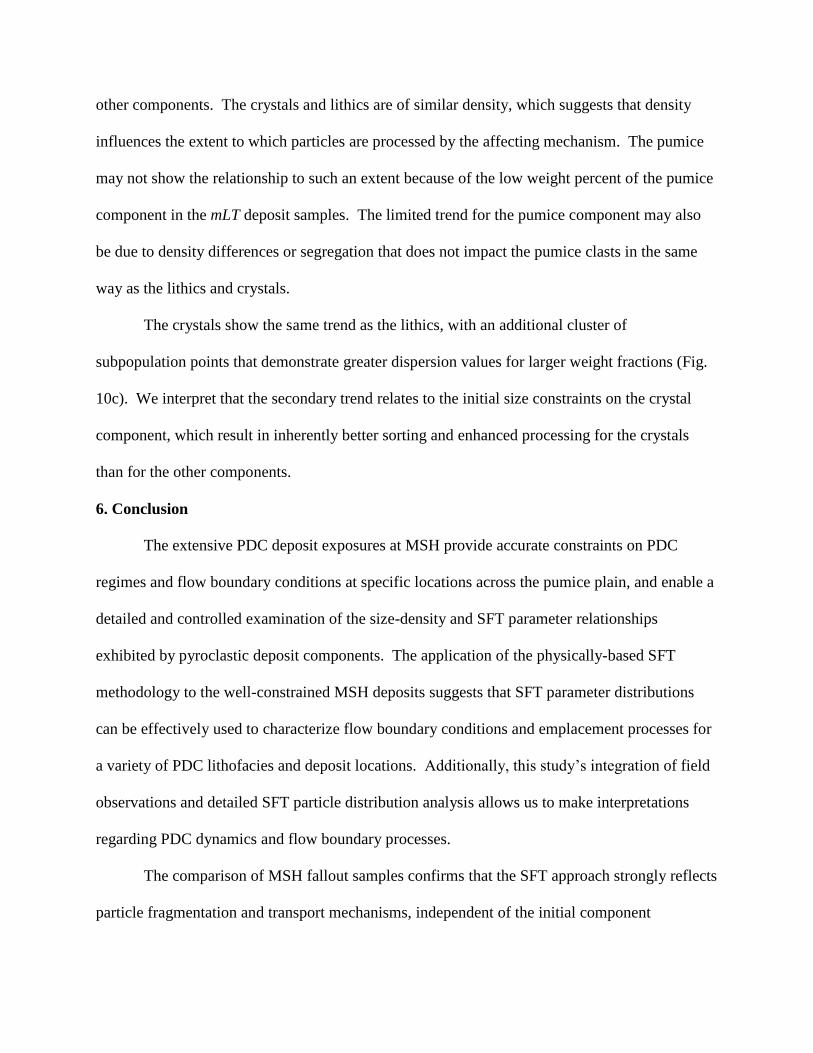
other components. The crystals and lithics are of similar density, which suggests that density
influences the extent to which particles are processed by the affecting mechanism. The pumice
may not show the relationship to such an extent because of the low weight percent of the pumice
component in the mLT deposit samples. The limited trend for the pumice component may also
be due to density differences or segregation that does not impact the pumice clasts in the same
way as the lithics and crystals.
The crystals show the same trend as the lithics, with an additional cluster of
subpopulation points that demonstrate greater dispersion values for larger weight fractions (Fig.
10c). We interpret that the secondary trend relates to the initial size constraints on the crystal
component, which result in inherently better sorting and enhanced processing for the crystals
than for the other components.
6. Conclusion
The extensive PDC deposit exposures at MSH provide accurate constraints on PDC
regimes and flow boundary conditions at specific locations across the pumice plain, and enable a
detailed and controlled examination of the size-density and SFT parameter relationships
exhibited by pyroclastic deposit components. The application of the physically-based SFT
methodology to the well-constrained MSH deposits suggests that SFT parameter distributions
can be effectively used to characterize flow boundary conditions and emplacement processes for
a variety of PDC lithofacies and deposit locations. Additionally, this study’s integration of field
observations and detailed SFT particle distribution analysis allows us to make interpretations
regarding PDC dynamics and flow boundary processes.
The comparison of MSH fallout samples confirms that the SFT approach strongly reflects
particle fragmentation and transport mechanisms, independent of the initial component
ACCEPTED MANUSCRIPT
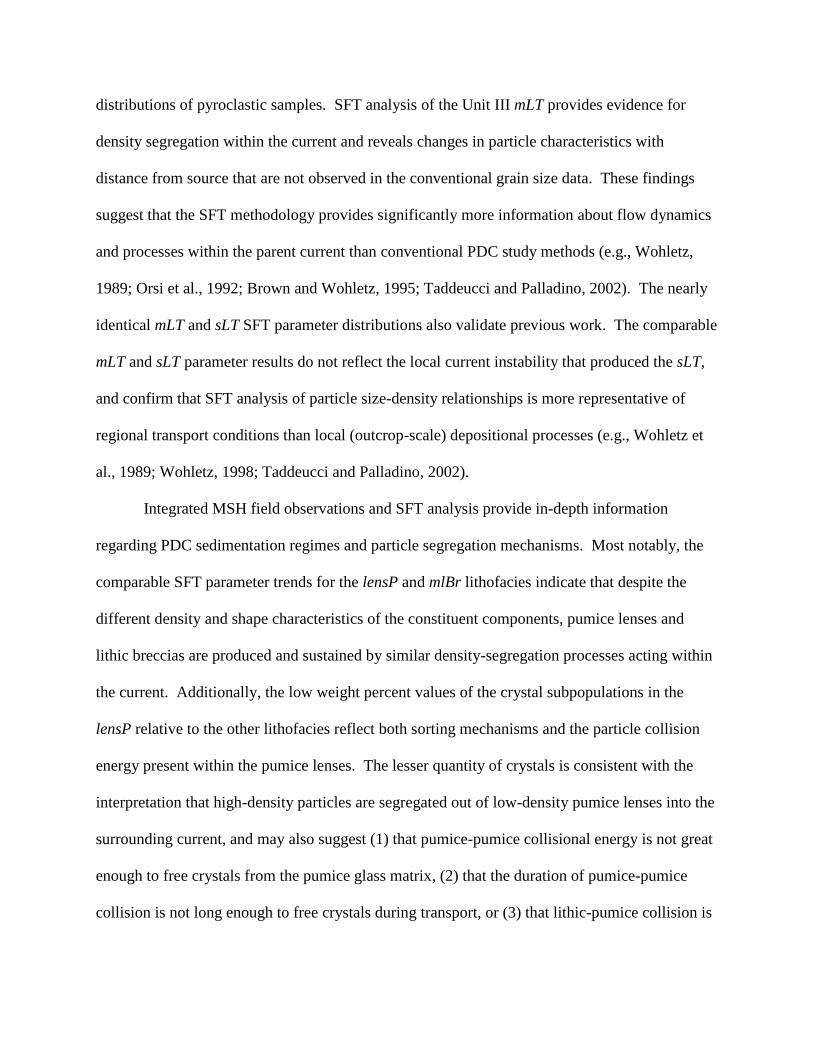
distributions of pyroclastic samples. SFT analysis of the Unit III mLT provides evidence for
density segregation within the current and reveals changes in particle characteristics with
distance from source that are not observed in the conventional grain size data. These findings
suggest that the SFT methodology provides significantly more information about flow dynamics
and processes within the parent current than conventional PDC study methods (e.g., Wohletz,
1989; Orsi et al., 1992; Brown and Wohletz, 1995; Taddeucci and Palladino, 2002). The nearly
identical mLT and sLT SFT parameter distributions also validate previous work. The comparable
mLT and sLT parameter results do not reflect the local current instability that produced the sLT,
and confirm that SFT analysis of particle size-density relationships is more representative of
regional transport conditions than local (outcrop-scale) depositional processes (e.g., Wohletz et
al., 1989; Wohletz, 1998; Taddeucci and Palladino, 2002).
Integrated MSH field observations and SFT analysis provide in-depth information
regarding PDC sedimentation regimes and particle segregation mechanisms. Most notably, the
comparable SFT parameter trends for the lensP and mlBr lithofacies indicate that despite the
different density and shape characteristics of the constituent components, pumice lenses and
lithic breccias are produced and sustained by similar density-segregation processes acting within
the current. Additionally, the low weight percent values of the crystal subpopulations in the
lensP relative to the other lithofacies reflect both sorting mechanisms and the particle collision
energy present within the pumice lenses. The lesser quantity of crystals is consistent with the
interpretation that high-density particles are segregated out of low-density pumice lenses into the
surrounding current, and may also suggest (1) that pumice-pumice collisional energy is not great
enough to free crystals from the pumice glass matrix, (2) that the duration of pumice-pumice
collision is not long enough to free crystals during transport, or (3) that lithic-pumice collision is
ACCEPTED MANUSCRIPT
necessary to free crystals from the glass matrix and produce the volume of free crystals observed
in the deposits (Druitt, 1995; Calder et al., 2000; Rowley et al., 2012).
The relative dispersion ranges and areas of concentrated dispersion data points for each
lithofacies do show processing trends that are consistent with expectations based on the
emplacement mechanisms indicated by deposit characteristics (e.g., Walker, 1971; Branney and
Kokelaar, 2002). Additionally, the trend of decreasing dispersion values with increasing
subpopulation weight percent observed for all PDC deposit components is consistent with
intuitive expectations for particle processing mechanisms: there may be a number of minor
transport or fragmentation mechanisms that influence lesser, lower weight percent
subpopulations, but the mechanisms affecting greater weight percent of current components are
more limited, resulting in a narrower range of dispersion values and decreased overall
processing.
The size-density and SFT parameter relationships we observe at MSH can be used to
effectively characterize regional transport processes, and when combined with field observations
the SFT data provides valuable information about PDC segregation and particle processing
mechanisms. This study further defines and reinforces the capabilities of SFT analysis when
applied to pyroclastic deposits, and demonstrates that SFT methodology has the potential to
constrain regional flow boundary conditions at field sites where outcrop exposures are limited.
ACCEPTED MANUSCRIPT
References
Allen, S.R., 2001. Reconstruction of a major caldera-forming eruption from pyroclastic deposit
characteristics: Kos Plateau Tuff, eastern Aegean Sea. Journal of Volcanology and Geothermal
Research 105, 141-162.
Andrews, B.J., Gardner, J.E., 2009. Turbulent dynamics of the 18 May 1980 Mount St. Helens
eruption column. Geology 37, 895-898.
Beeson, D.L., 1987. Proximal Flank Facies of the May 18, 1980 Ignimbrite: Mount St Helens,
Washington. MS Thesis, University of Texas at Arlington.
Bendana, S., Brand, B.D., Self, S., Dufek, J., 2012. Effects of slope on the dynamics of dilute
pyroclastic density currents from May 18th, 1980 Mt. St. Helens eruption. American
Geophysical Union Annual Meeting, Abstract V41B-2778.
Bourdier, J.L., Abdurachman, E.K., 2001. Decoupling of small-volume pyroclastic flows and
related hazards at Merapi volcano, Indonesia. Bulletin of Volcanology 63, 309-325.
Brand, B.D., Mackaman-Lofland, C., Pollock, N., Bendana, S., Dawson, B., Wichgers, P., in
review. Pyroclastic Density Current Dynamics – Mt St Helens. Journal of Volcanology and
Geothermal Research.
Branney, M.J., Kokelaar, B.P., 2002. Pyroclastic density currents and the sedimentation of
ignimbrites. Memoir - Geological Society of London 27 (143).
Brown, W.K., Wohletz, K.H., 1995. Derivation of the Weibull distribution based on physical
principles and its connection to the Rosin-Rammler and lognormal distributions. Journal of
Applied Physics 78, 2758-2763.
Burgisser, A., Bergantz, G.W., 2002. Reconciling pyroclastic flow and surge: The multiphase
physics of pyroclastic density currents. Earth Planet Sci. Lett. 202, 405-418.
Calder, E.S., Sparks, R.S.J., Gardeweg, M.C., 2000. Erosion, transport and segregation of
pumice in pyroclastic flows inferred from ignimbrite at Lascar Volcano, Chile. Journal of
Volcanology and Geothermal Research 104, 201-235.
Christiansen, R.L., Peterson, D.W., 1981. Chronology of the 1980 eruptive activity. In: Lipman,
P.O., Mullineaux, D.R. (Eds.), The 1980 eruptions of Mount St. Helens, Washington. US
Geological Survey Professional Paper 1250, 17-30.
Criswell, C.W., 1987. Chronology and pyroclastic stratigraphy of the May 18, 1980 eruption of
Mount St. Helens, Washington. Journal of Geophysical Research 92, 10237-10266.
Dellino, P., De Astis, G., La Volpe, L., Mele, D., Sulpizio, R., 2011. Quantitative hazard
assessment of phreatomagmatic eruptions at Vulcano (Aeolian Islands, Southern Italy) as
ACCEPTED MANUSCRIPT
obtained by combining stratigraphy, event statistics and physical modeling. Journal of
Volcanology and Geothermal Research 201, 364-384.
Druitt, T.H., 1995. Settling behavior of concentrated dispersions and some volcanological
applications. Journal of Volcanology and Geothermal Research 65, 27-39.
Durant, A.J., Rose, W.I., Sarna-Sojcicki, A.M., Carey, S., Volentik, A.C.M., 2009.
Hydrometeor-enhanced tephra sedimentation: constraints from the 18 May 1980 eruption of Mt.
St. Helens. Journal of Geophysical Research 114, B03204.
Fisher, R.V., 1990. Transport and deposition of a pyroclastic surge across an area of high relief:
The 18 May 1980 eruption of Mount St. Helens, Washington. Geological Society of America,
Bulletin 102, 1038-1054.
Francis, P., 1993. Volcanoes – A planetary perspective. Oxford University Press Inc., New York.
Giordano, G., 1998. The effects of paleotopography on lithic distribution and facies associations
of small volume ignimbrites: the WTT Cupa (Roccamonfina volcano, Italy). Journal of
Volcanology and Geothermal Research 87, 255-273.
Kieffer, S.W., 1981. Fluid dynamics of the May 18 blast at Mount St. Helens. In: Lipman, P.O.,
Mullineaux, D.R. (Eds.) The 1980 eruptions of Mount St. Helens, Washington – US Geological
Survey Professional Paper 1250, 379-400.
Kuntz, M.A., Rowley, P.D., MacLeod, N.S., Reynolds, R.L., McBroome, L.A., Kaplan, A.M.,
Lidke, D.J., 1981. Petrography and particle-size distribution of pyroclastic-flow, ash-cloud, and
surge deposits. In: Lipman, P.O., Mullineaux, D.R. (Eds.), The 1980 eruptions of Mount St.
Helens, Washington. US Geological Survey Professional Paper 1250, 525-539.
Orsi, G., Gallo, G., Heiken, G., Wohletz, K., Yu, E., Bonani, G., 1992. A comprehensive study
of pumice formation and dispersal: the Cretaio Tephra of Ischia (Italy). Journal of Volcanology
and Geothermal Research 53, 329-354.
Pollock, N., Brand, B., 2012. Investigation into the erosive capacity of pyroclastic density
currents at Mount Saint Helens, Washington (USA). American Geophysical Union Annual
Meeting, Abstract V54C-01.
Pollock, N., 2013. Field evidence for substrate entrainment by pyroclastic density currents and
its effect on downstream dynamics at Mount St. Helens, Washington (USA). M.S. Thesis,
University of Washington.
Roche, O., 2012. Depositional processes and gas pore pressure in pyroclastic flows: an
experimental perspective. Bulletin of Volcanology 74, 1807-1820.
Rowley, P., Kokelaar, P., Menzies, M., Waltham, D., 2012. Shear-derived mixing in dense
granular flow. Journal of Sedimentary Research 81, 874-884.
ACCEPTED MANUSCRIPT
Rowley, P.D., Kuntz, M.A., MacLeod, N.S., 1981. Pyroclastic-flow deposits. US Geological
Survey Professional Paper 250, 489-512.
Rowley, P.D., Macleod, N.S., Kuntz, M.A., Kaplan, A.M., 1985. Proximal bedded deposits
related to pyroclastic flows of May 18, 1980, Mount St Helens, Washington. Geological Society
of America Bulletin 96, 1373-1383.
Sheridan, M.F., Wohletz, K.H., Dehn, J., 1987. Discrimination of grain-size subpopulations in
pyroclastic deposits. Geology 15, 367-370.
Sparks, R.S.J., 1976. Grain size variations in ignimbrites and implications for the transport of
pyroclastic flows. Sedimentology 23, 147-188.
Sparks, R.S.J., Bursik, M.I., Carey, S.N., Gilbert, J.S., Glaze, L.S., Sigurdsson, H., Woods,
A.W., 1997. Volcanic Plumes. John Wiley, Chichester.
Sparks, R.S.J., Self, S., Walker, G.P.L., 1973. Products of ignimbrite eruptions. Geology 1, 115-
118.
Sulpizio, R., De Rosa, R., Donato, P., 2008. The influence of variable topography on the
depositional behavior of pyroclastic density currents: The examples of the Upper Pollara
eruption (Salina Island, southern Italy). Journal of Volcanology and Geothermal Research 175,
3367-385.
Taddeucci, J., Palladino, D.M., 2002. Particle size-density relationships in pyroclastic deposits:
inferences for emplacement processes. Bulletin of Volcanology 64, 273-284.
Taddeucci, J., Wohletz, K.H., 2001. Temporal evolution of the Minoan eruption (Santorini,
Greece), as recorded by its Plinian fall and interlayered ash flow deposits. Journal of
Volcanology and Geothermal Research 109, 301–319.
Valentine, G.A., 1998. Damage to structures by pyroclastic flows and surges, inferred from
nuclear weapons effects. Journal of Volcanology and Geothermal Research 87, 117-140.
Valentine, G.A., Wohletz, K.H., Kieffer, S.W., 1992. Effects of topography on facies and
compositional zonation in caldera-related ignimbrites. Geological Society of America Bulletin
104,154-165.
Walker, G.P.L., 1983. Ignimbrite types and ignimbrite problems. Journal of Volcanology and
Geothermal Research 17, 65-88.
Walker, G.P.L., 1971. Grain-size characteristics of pyroclastic deposits. Geology 79, 696-714.
ACCEPTED MANUSCRIPT
Wohletz, K.H., 1998. Pyroclastic surges and compressible two-phase flow. In: Freundt, A., Rosi,
M. (Eds.), From magma to tephra – modelling physical processes of explosive volcanic
eruptions. Developments in Volcanology, Elsevier, 247-312.
Wohletz, K., Brown, W., 1995. Particulate size distributions and sequential
fragmentation/transport theory. In: Theofanous, A., Akiyama, M. (Eds.), Intense multiphase
interactions. Proceedings of US (NSF) Japan (JSPS) Joint Seminar, Santa Barbara CA. June 8-13
1995, 235-241.
Wohletz, K., Orsi, G., de Vita, S., 1995. Eruptive mechanisms of the Neapolitan Yellow Tuff
interpreted from stratigraphic, chemical, and granulometric data. Journal of Volcanology and
Geothermal Research 67, 263-290.
Wohletz, K.H., Sheridan, M.F., Brown, W.K., 1989. Particle-size distributions and the sequential
fragmentation / transport theory applied to volcanic ash. Journal of Geophysical Research 94,
15703-15721.
Wohletz, K.H., Raymond, R., 1993. Atmospheric dust dispersal analyzed by granulometry of the
Misers Gold event. Journal of Geophysical Research 98, 557-566.
ACCEPTED MANUSCRIPT
List of Figures
Figure 1: LiDAR image of the Mt. St. Helens crater and pumice plain. The regions highlighted
purple indicate pre-1980 eruption topography, and the regions highlighted yellow indicate
exposed debris avalanche hummock deposits. Red arrows indicate dominant flow direction for
Units III and IV as interpreted based on field observations and deposit characteristics. Outcrop
names and locations are indicated; drainages and outcrops correlate with those described in
Brand et al. (in review).
Figure 2: Generalized stratigraphic column for the four major PDC flow units produced during
the May 18th
, 1980 Mt. St. Helens eruption. Histograms provide example grain size distribution
(GSD) and componentry data for massive lapilli tuff (mLT), lithic breccia (mlBr), stratified lapilli
tuff (sLT), and pumice lens (lensP) samples obtained from outcrop AD-3.
Figure 3: (a) Photograph of the AD-3 outcrop, PDC travel distance estimated to be ~7.18 km
from source. (b) Sketch of the AD-3 outcrop with lithofacies, depositional features, and flow
units outlined and labeled. (c) Close-up photograph of the erosional lithic levees on the north
side of the outcrop; (d) sketch of the levee features with lithofacies and flow units denoted.
Boxes indicate sample locations for this study.
Figure 4: (a) Decomposition of a combined grain size distribution (mLT sample from Fig. 3) into
individual component distributions. (b) SFT analysis fits cubic spline curves to the component
distributions, and then (c) characterizes the spline curves using a series of data subpopulations.
ACCEPTED MANUSCRIPT
Figure 5: Increasing values of the dispersion parameter used in SFT analysis. Values near -1
produce coarse, flat model distributions and reflect a lesser degree of particle processing, while
greater dispersion values result in distributions that are peaked and fine-skewed, and reflect more
advanced particle processing. Modeled after Wohletz et al. (1989) and Taddeucci and Palladino
(2002).
Figure 6: SFT descriptive parameter data for the ash fall samples (ash fall sample relative
componentry provided in Table 2; grain size and componentry data courtesy of Benjamin
Andrews). The first row of plots (a, d, g) represents the parameter distributions of pumice
subpopulations, the second row (b, e, h) represents the distributions of lithic subpopulations, and
the third row (c, f, i) represents the distributions of crystal subpopulations. We plot mode versus
weight percent (mode measured in phi; a-c), mode versus dispersion (d-f), and weight percent
versus dispersion (g-i) for each component. Multiple subpopulation points represent the
component distribution of a single sample.
Figure 7: SFT descriptive parameter data for the Unit III mLT lithofacies at proximal (<5.25 km),
medial (5.25-7.25 km), and distal (>7.25 km) outcrop locations. The data are plotted in the same
format as that used to present the ash fall data (ash fall SFT data presented in Fig. 6). For the
travel distance plots, subpopulation points represent the component distributions of multiple
samples for each outcrop distance. Outlying subpopulations that occupy very low (<1-2%) of
the sample component distributions are circled.

ACCEPTED MANUSCRIPT
Figure 8: Mode versus weight percent SFT data for the different MSH lithofacies (mLT, mlBr,
sLT, lensP, xsLT, and ash fall); data series are identified by lithofacies. The upper plot represents
the pumice component (a), the middle represents the lithics (b), and the lower represents the
crystals (c). The subpopulation clusters represent multiple samples of each lithofacies.
Figure 9: Mode versus dispersion SFT data for the different MSH lithofacies (mLT, mlBr, sLT,
lensP, xsLT, and ash fall); data series are identified by lithofacies. The upper plot represents the
pumice component (a), the middle represents the lithics (b), and the lower represents the crystals
(c). The subpopulation clusters represent multiple samples of each lithofacies. Box plots depict
the dispersion range and most populated zone (statistically constrained between the 1st and 3
rd
quartile) for each lithofacies; there are too few xsLT subpopulations to produce accurate quartile
dispersion values so only the dispersion range is depicted.
Figure 10: Dispersion versus weight percent SFT data for the different MSH lithofacies (mLT,
mlBr, sLT, lensP, xsLT, and ash fall); data series are identified by lithofacies. The upper plot
represents the pumice component (a), the middle represents the lithics (b), and the lower
represents the crystals (c). The subpopulation clusters represent multiple samples of each
lithofacies.
ACCEPTED MANUSCRIPT
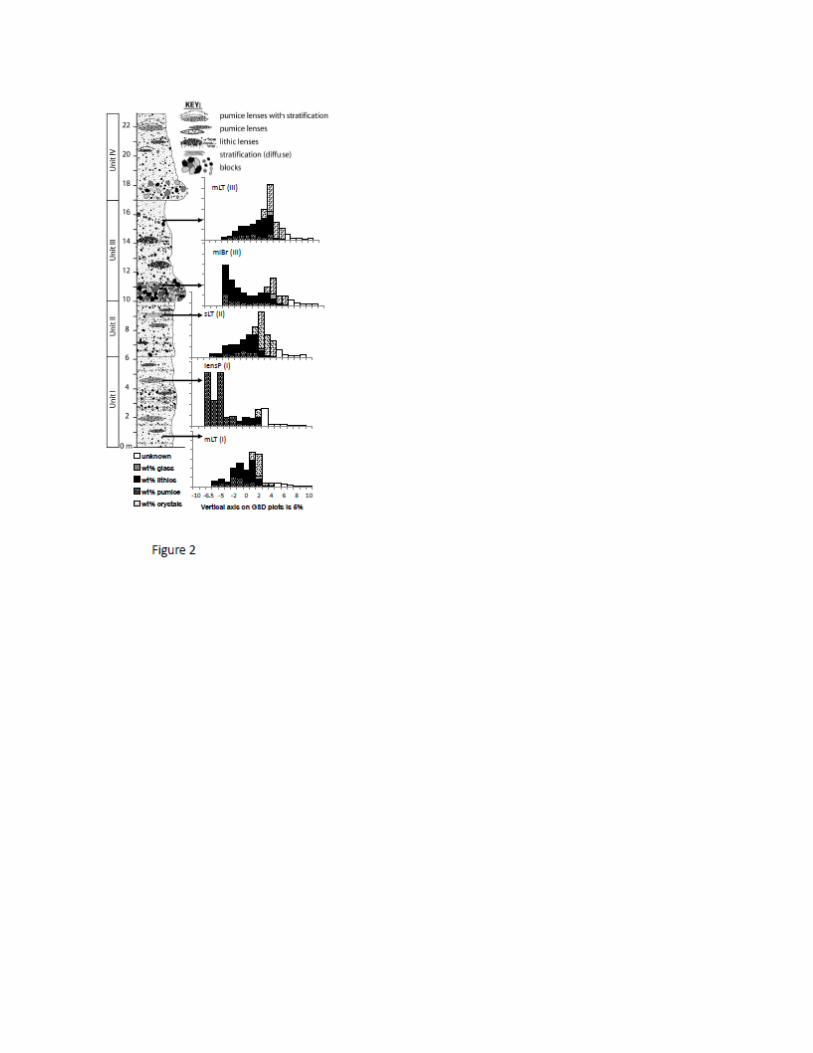
ACCEPTED MANUSCRIPT
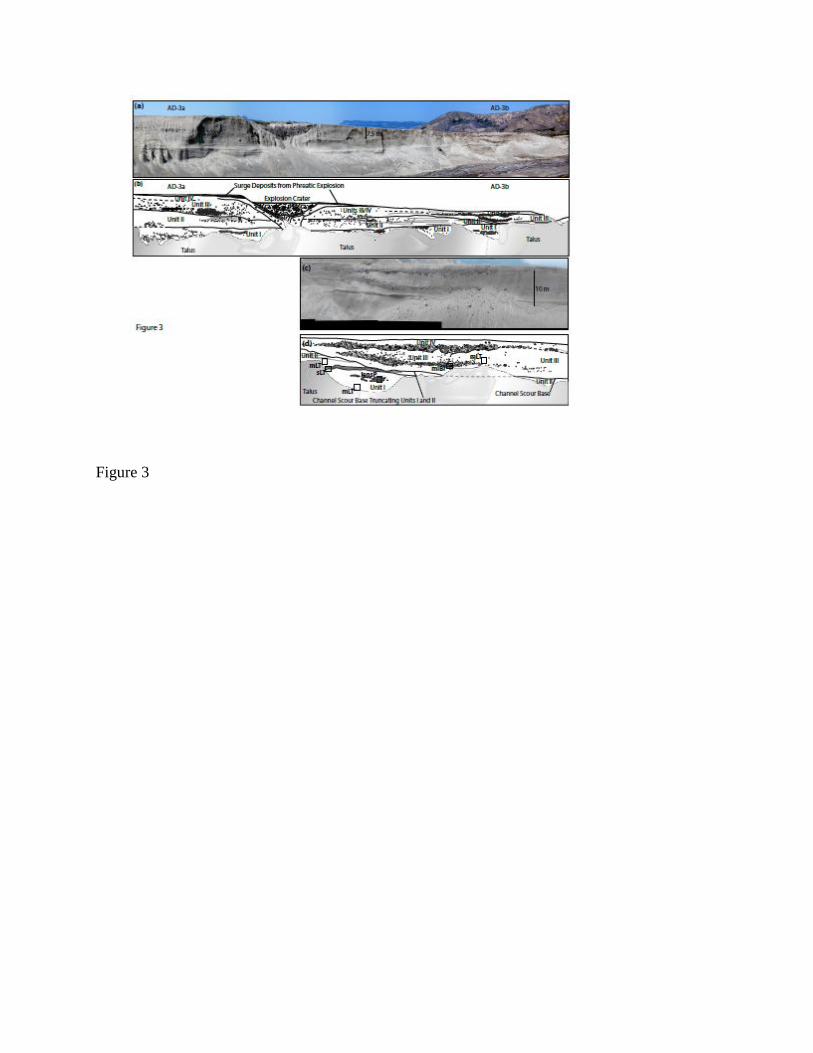
ACCEPTED MANUSCRIPT
Figure 3
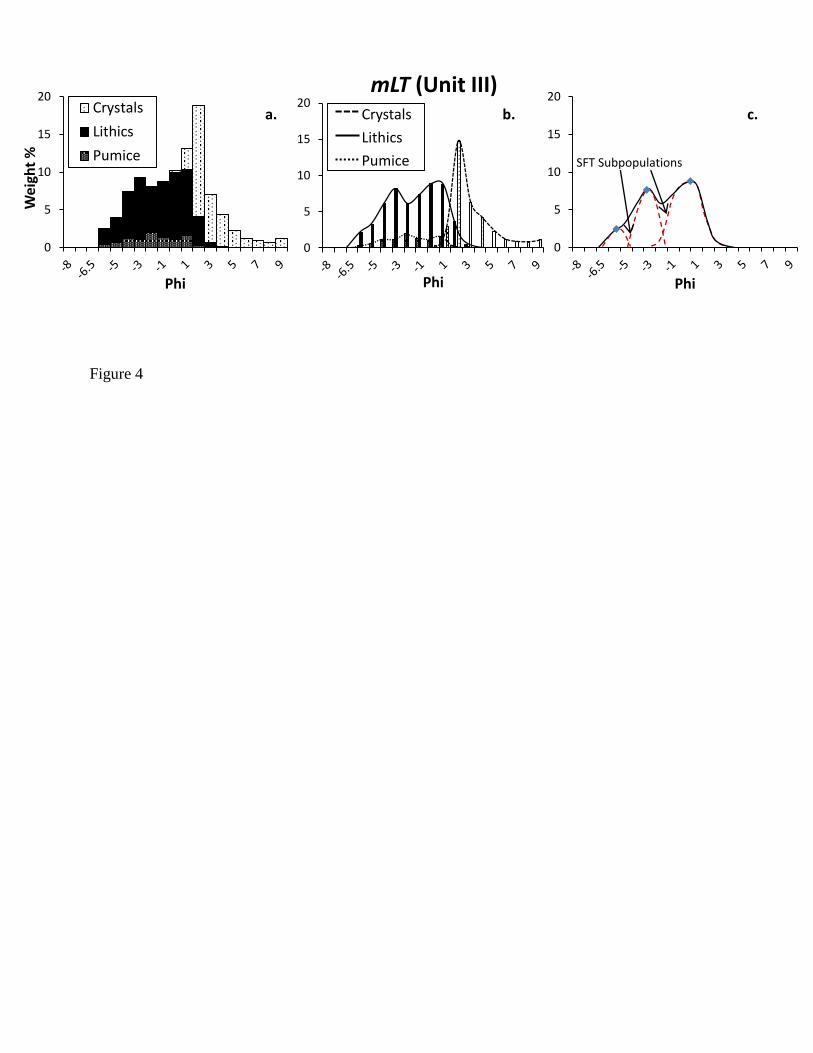
ACCEPTED MANUSCRIPT
Figure 4
0
5
10
15
20
Wei
ght
%
Phi
Crystals
Lithics
Pumice
0
5
10
15
20
Phi
mLT (Unit III)
0
5
10
15
20
Phi
Crystals
Lithics
Pumice SFT Subpopulations
a. c.b.
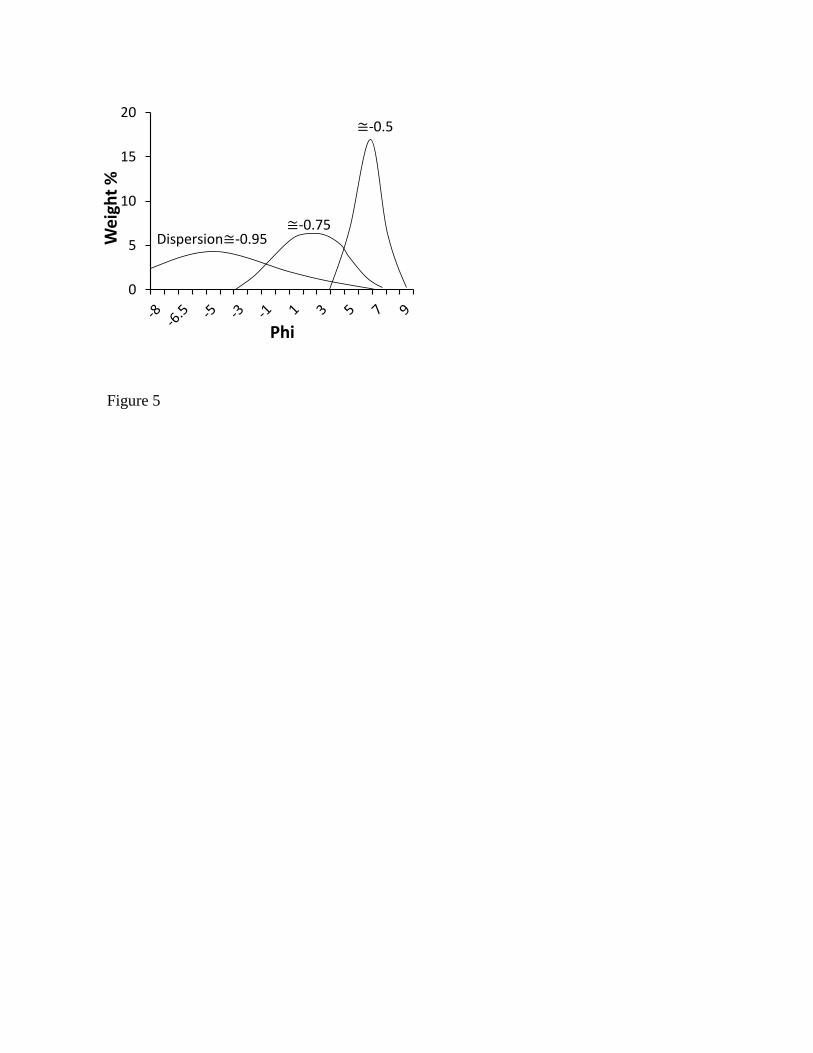
ACCEPTED MANUSCRIPT
Figure 5
0
5
10
15
20W
eigh
t %
Phi
Dispersion≅-0.95≅-0.75
≅-0.5
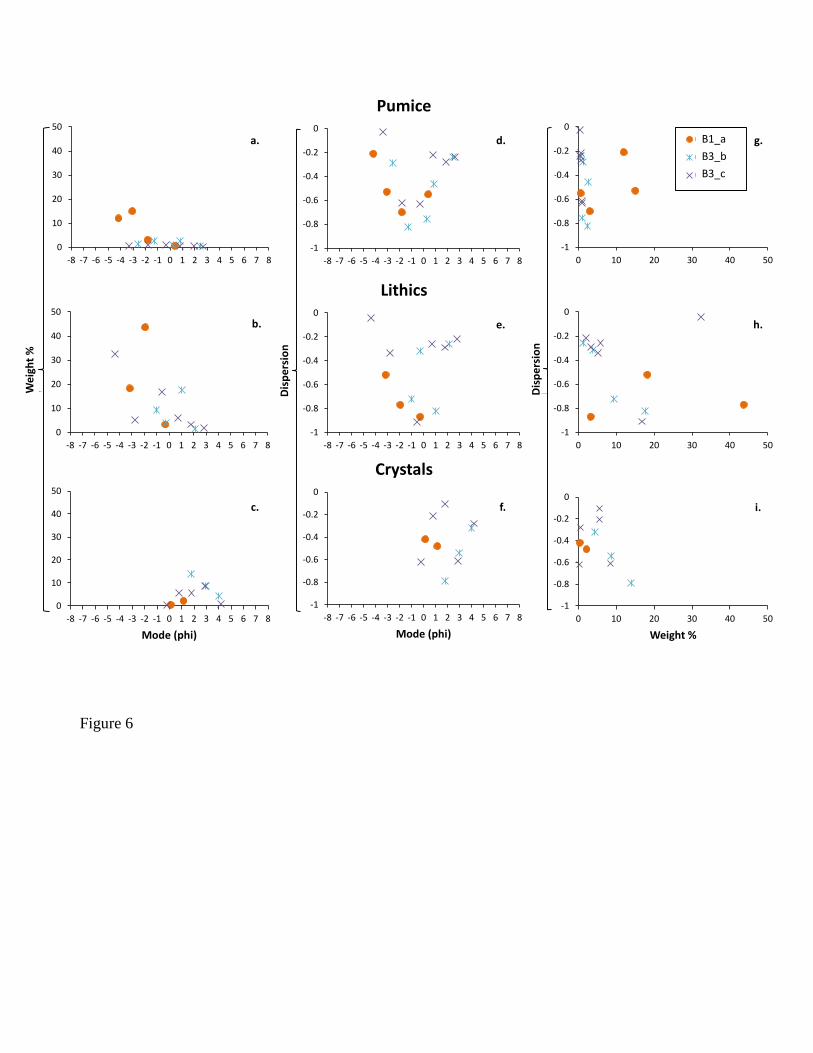
ACCEPTED MANUSCRIPT
Figure 6
0
10
20
30
40
50
-8 -7 -6 -5 -4 -3 -2 -1 0 1 2 3 4 5 6 7 8
We
igh
t %
-1
-0.8
-0.6
-0.4
-0.2
0
-8 -7 -6 -5 -4 -3 -2 -1 0 1 2 3 4 5 6 7 8
Dis
pe
rsio
n
Pumice
-1
-0.8
-0.6
-0.4
-0.2
0
0 10 20 30 40 50
Dis
pe
rsio
n
06MSH12D - B1
06MSH28B - B3
06MSH28C - B3
0
10
20
30
40
50
-8 -7 -6 -5 -4 -3 -2 -1 0 1 2 3 4 5 6 7 8
We
igh
t %
-1
-0.8
-0.6
-0.4
-0.2
0
-8 -7 -6 -5 -4 -3 -2 -1 0 1 2 3 4 5 6 7 8
Dis
pe
rsio
nLithics
-1
-0.8
-0.6
-0.4
-0.2
0
0 10 20 30 40 50
Dis
pe
rsio
n
0
10
20
30
40
50
-8 -7 -6 -5 -4 -3 -2 -1 0 1 2 3 4 5 6 7 8
We
igh
t %
Mode (phi)
-1
-0.8
-0.6
-0.4
-0.2
0
-8 -7 -6 -5 -4 -3 -2 -1 0 1 2 3 4 5 6 7 8
Dis
pe
rsio
n
Mode (phi)
Crystals
-1
-0.8
-0.6
-0.4
-0.2
0
0 10 20 30 40 50
Dis
pe
rsio
n
Weight %
We
igh
t %
Dis
per
sio
n
Dis
per
sio
n
B1_a
B3_b
B3_c
a. g.
f.
e.
d.
c.
b.
i.
h.
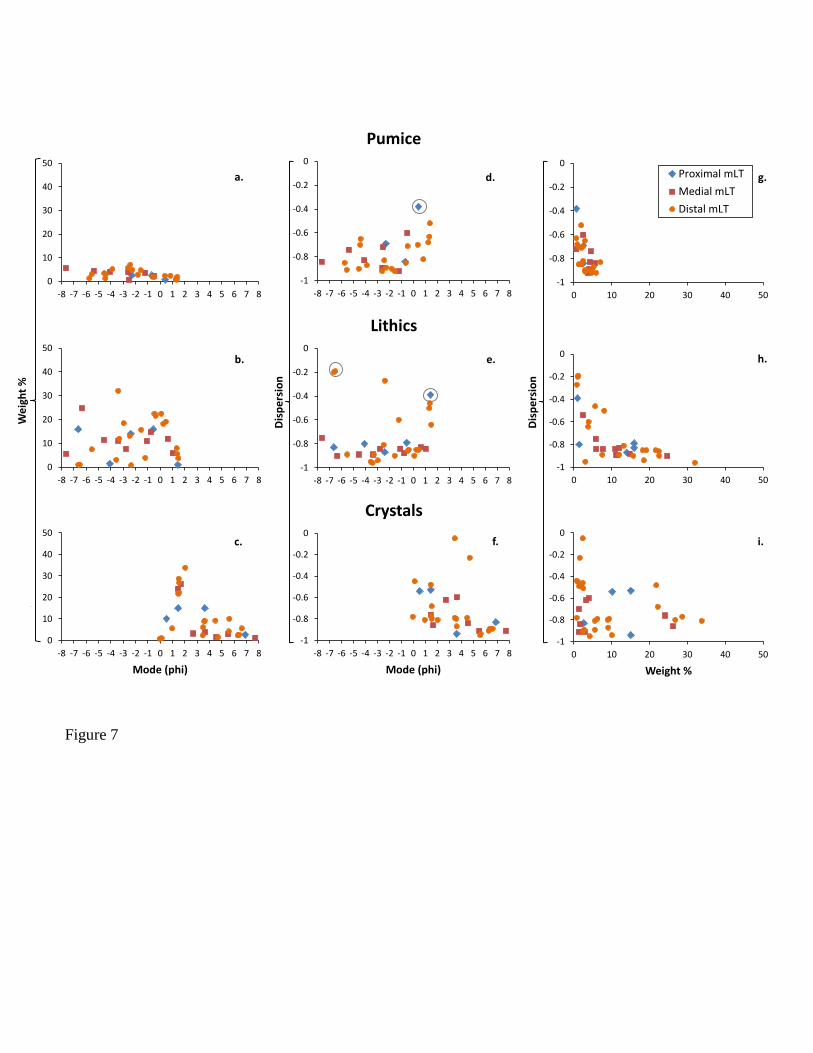
ACCEPTED MANUSCRIPT
Figure 7
0
10
20
30
40
50
-8 -7 -6 -5 -4 -3 -2 -1 0 1 2 3 4 5 6 7 8
We
igh
t %
-1
-0.8
-0.6
-0.4
-0.2
0
-8 -7 -6 -5 -4 -3 -2 -1 0 1 2 3 4 5 6 7 8D
isp
ers
ion
Pumice
-1
-0.8
-0.6
-0.4
-0.2
0
0 10 20 30 40 50
Dis
pe
rsio
n
Proximal mLT
Medial mLT
Distal mLT
0
10
20
30
40
50
-8 -7 -6 -5 -4 -3 -2 -1 0 1 2 3 4 5 6 7 8
We
igh
t %
-1
-0.8
-0.6
-0.4
-0.2
0
-8 -7 -6 -5 -4 -3 -2 -1 0 1 2 3 4 5 6 7 8
Dis
pe
rsio
n
Lithics
-1
-0.8
-0.6
-0.4
-0.2
0
0 10 20 30 40 50
Dis
pe
rsio
n
0
10
20
30
40
50
-8 -7 -6 -5 -4 -3 -2 -1 0 1 2 3 4 5 6 7 8
We
igh
t %
Mode (phi)
-1
-0.8
-0.6
-0.4
-0.2
0
-8 -7 -6 -5 -4 -3 -2 -1 0 1 2 3 4 5 6 7 8
Dis
pe
rsio
n
Mode (phi)
Crystals
-1
-0.8
-0.6
-0.4
-0.2
0
0 10 20 30 40 50
Dis
pe
rsio
n
Weight %
Wei
ght
%
Dis
per
sio
n
Dis
per
sio
n
a. g.
f.
e.
d.
c.
b.
i.
h.
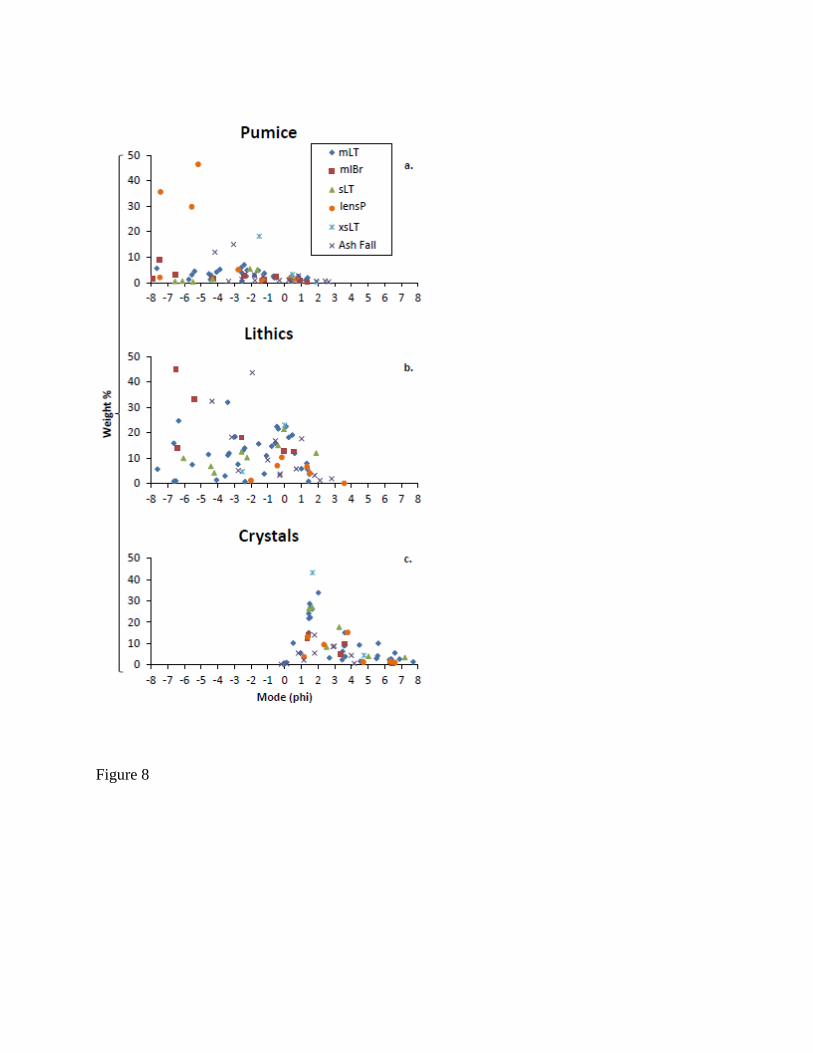
ACCEPTED MANUSCRIPT
Figure 8
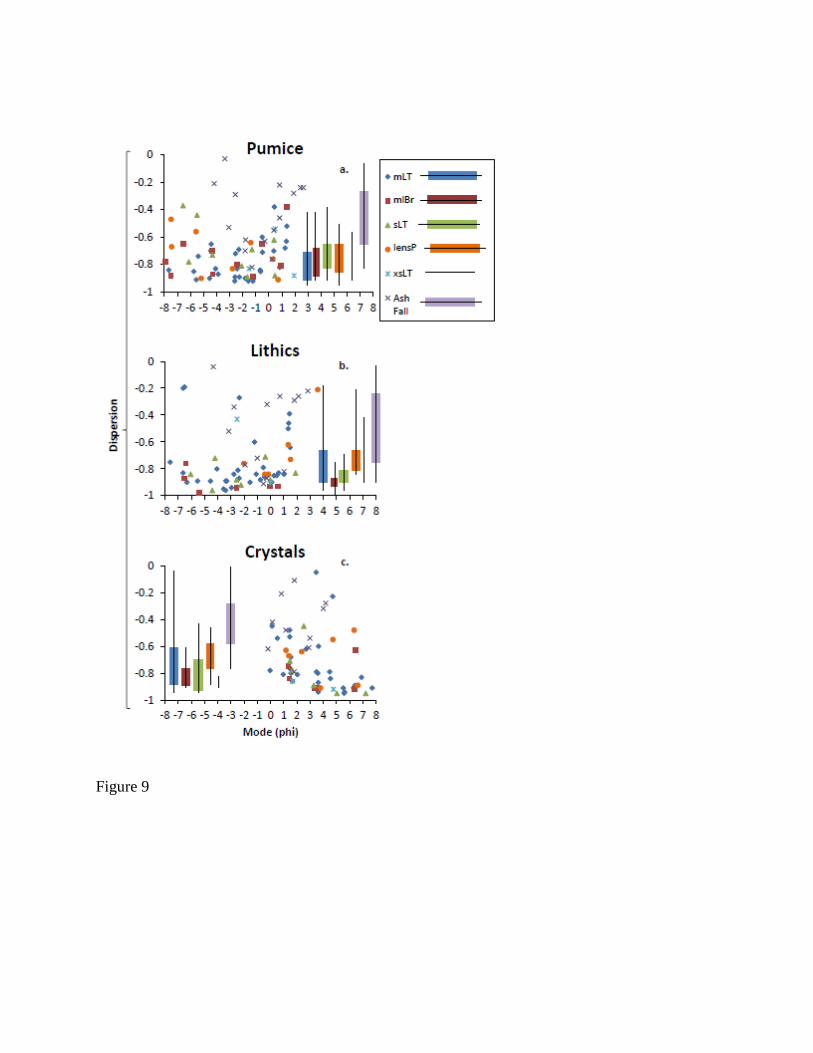
ACCEPTED MANUSCRIPT
Figure 9
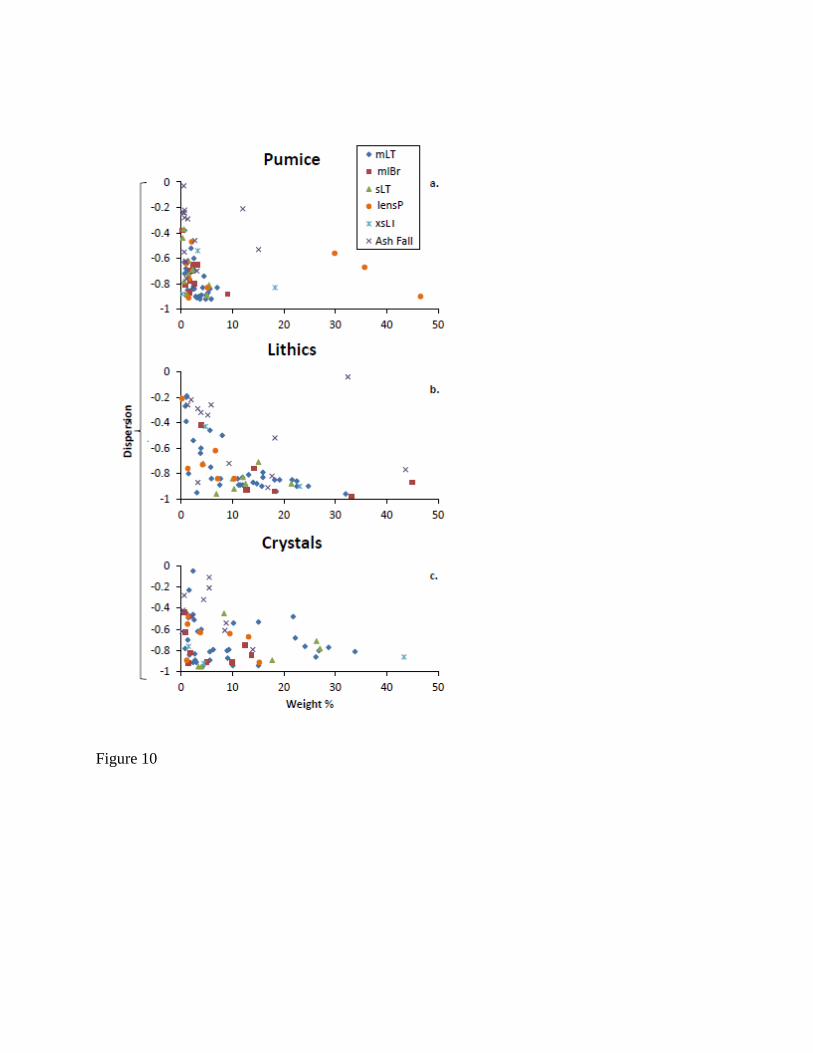
ACCEPTED MANUSCRIPT
Figure 10
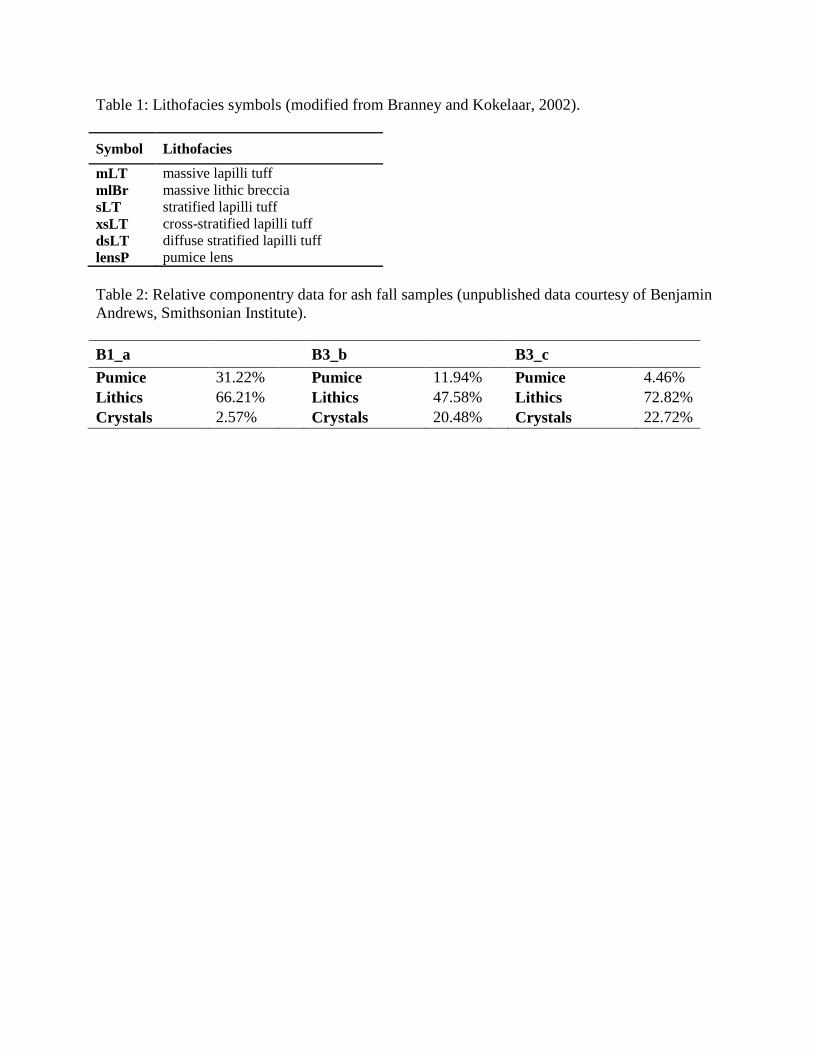
ACCEPTED MANUSCRIPT
Table 1: Lithofacies symbols (modified from Branney and Kokelaar, 2002).
Symbol Lithofacies
mLT massive lapilli tuff
mlBr massive lithic breccia
sLT stratified lapilli tuff
xsLT cross-stratified lapilli tuff
dsLT diffuse stratified lapilli tuff
lensP pumice lens
Table 2: Relative componentry data for ash fall samples (unpublished data courtesy of Benjamin
Andrews, Smithsonian Institute).
B1_a B3_b B3_c
Pumice 31.22% Pumice 11.94% Pumice 4.46%
Lithics 66.21% Lithics 47.58% Lithics 72.82%
Crystals 2.57% Crystals 20.48% Crystals 22.72%

ACCEPTED MANUSCRIPT
Research highlights
SFT analysis reflects particle fragmentation and transport mechanisms regardless of variations in initial component distributions.
SFT component modeling reveals changes in particle characteristics that are not directly observable in grain size and fabric data.
SFT parameters are more sensitive to regional transport conditions than local (outcrop-scale) depositional processes.
The particle processing trends produced using SFT are consistent with trends inferred from lithofacies architectures.
Integrated field observations and SFT results suggest comparable size-density segregation
processes for lithic concentrations and pumice lenses.