serug - gis & travel demand modeling in the southeast: an ...€¦ · serug - gis & travel...
TRANSCRIPT

2007 SERUG Conference
2007 SERUG Conference
Douglas W. Lynch, GISP
Presented By:
GIS & Travel Demand Modeling in the Southeast:An Analytical Approach with .NET GIS Customization
Jacksonville, FL

2007 SERUG Conference
Traffic Nightmare – Guess Where It Is?

2007 SERUG Conference
• Forecasts future traffic conditions based upon population, employment growth, land use, and roadway/transit network.
• Evaluates performance of system improvements.
• Meets urban transportation planning requirements.
• Quantifies and geographically locates system deficiencies using GIS.
Overview of Travel Demand Modeling
2007 SERUG Conference
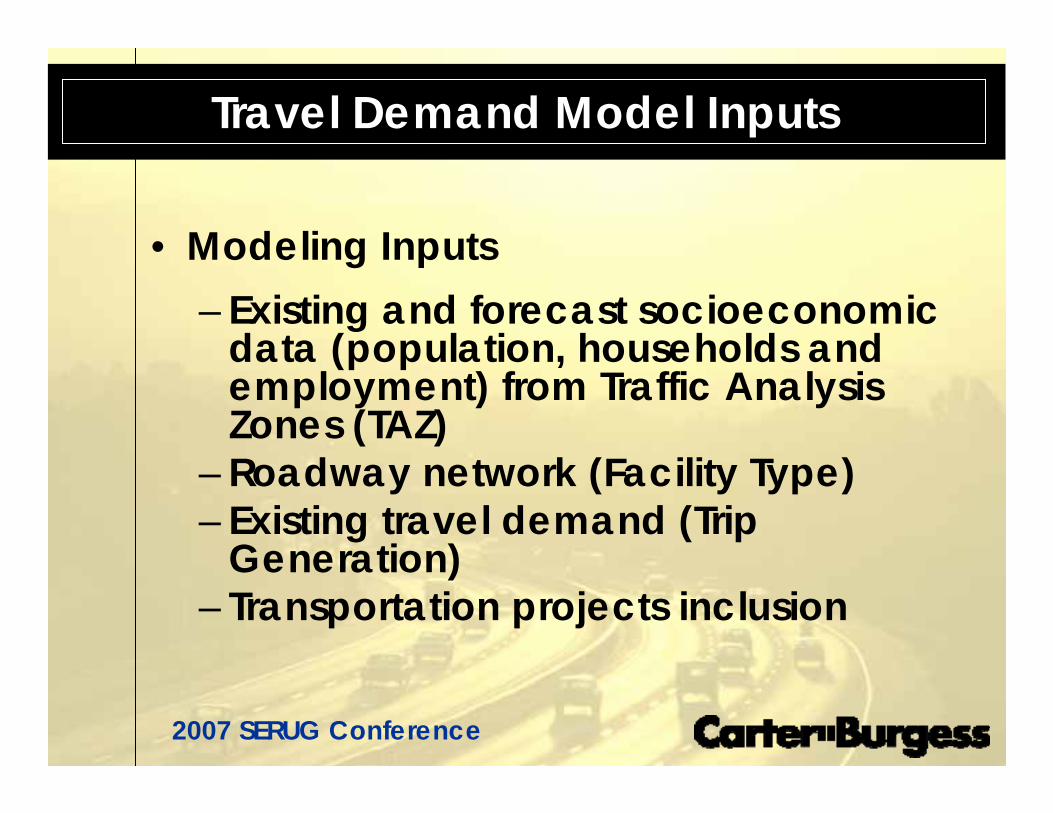
• Modeling Inputs– Existing and forecast socioeconomic
data (population, households and employment) from Traffic Analysis Zones (TAZ)
– Roadway network (Facility Type)– Existing travel demand (Trip
Generation)– Transportation projects inclusion
Travel Demand Model Inputs

2007 SERUG Conference
• Modeling outputs– Daily or PM peak system-wide future
travel demand– Congested roadways (V/C Ratio/LOS)– Total volume and capacity– System usage-Vehicle Hours Traveled
(VHT)– Travel Time Index (TTI)
Travel Demand Model Outputs

2007 SERUG Conference
Inputs: Facility Types and SE Data (TAZ)
TAZ (Traffic Analysis Zone) Boundary
Population Change #
Employment Change #
TAZ ID#
Model Network (Facility Type)

2007 SERUG Conference
TRIP GENERATION TRIP DISTRIBUTION
MODE CHOICEASSIGNMENT
GIS Analysis (ArcGIS)
Travel Demand Model Process Overview
TP+, TRANPLAN, TransCAD, Viper, Cube, QRS II
LOS DistributionNeeds IdentificationDetailed Mapping
Popular Travel Demand Software:

2007 SERUG Conference
TRIP GENERATION
Travel Demand Model Process
-Number of trips generated by TAZ.-Socioeconomic (SE) data is input.-Trip production and trip attraction are output.

2007 SERUG Conference
TRIP DISTRIBUTION
Travel Demand Model Process
-Where the trips are going-Complex algorithms to calculate trip distribution

2007 SERUG Conference
MODE CHOICE
Travel Demand Model Process (Con’t)
-Transportation Choicesa) Drivingb) Transit (Bus)c) Bicycled) Walking

2007 SERUG Conference
ASSIGNMENT
Travel Demand Model Process (Con’t)
-Based on origin to destination trips, which network roads will be taken to arrive at final destination

2007 SERUG Conference
The Need for a Travel Demand ModelingTool to Work Seamlessly with ArcGIS for Transportation Planning Purposes
2007 SERUG Conference
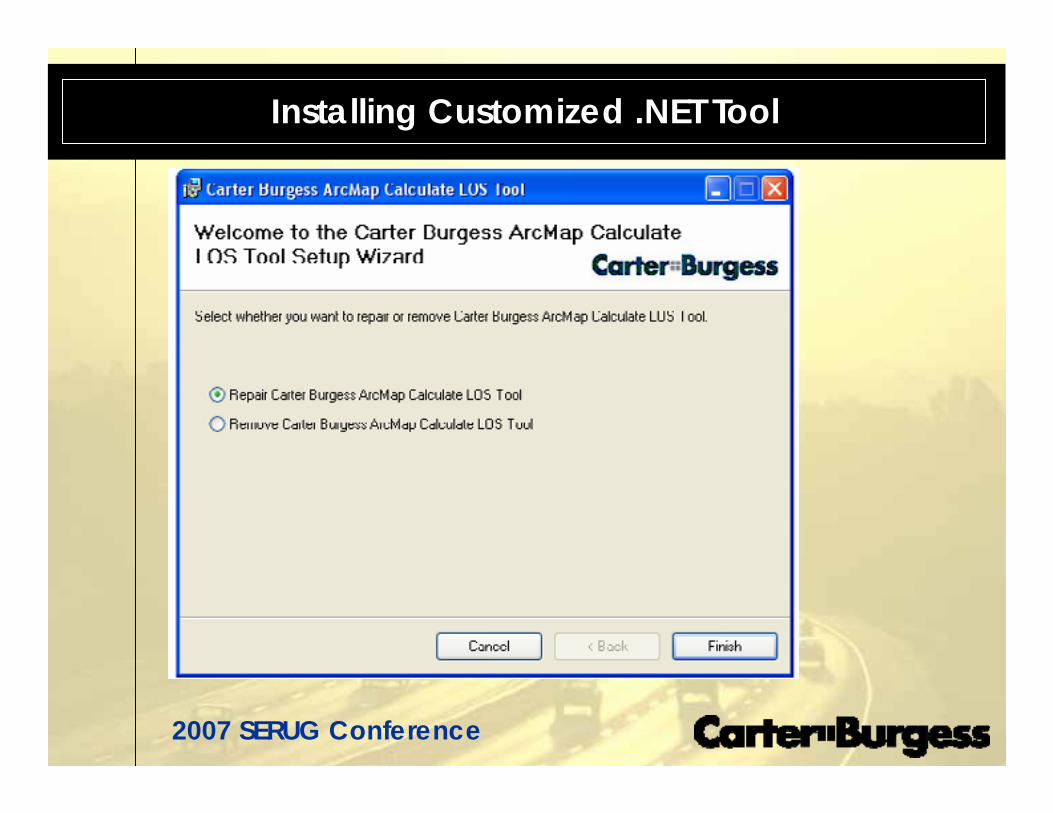
Installing Customized .NET Tool

2007 SERUG Conference
Installing Customized .NET Tool (Con’t)

2007 SERUG Conference
• C# programming
• Microsoft Visual Studio 2005 (For .exe install desktop program)
• ESRI ArcGIS 9.X• ArcObjects COM libraries• Took approximately 2 full days to
complete and test the tool
Software Needed to Create LOS/V Minus C Tool
2007 SERUG Conference
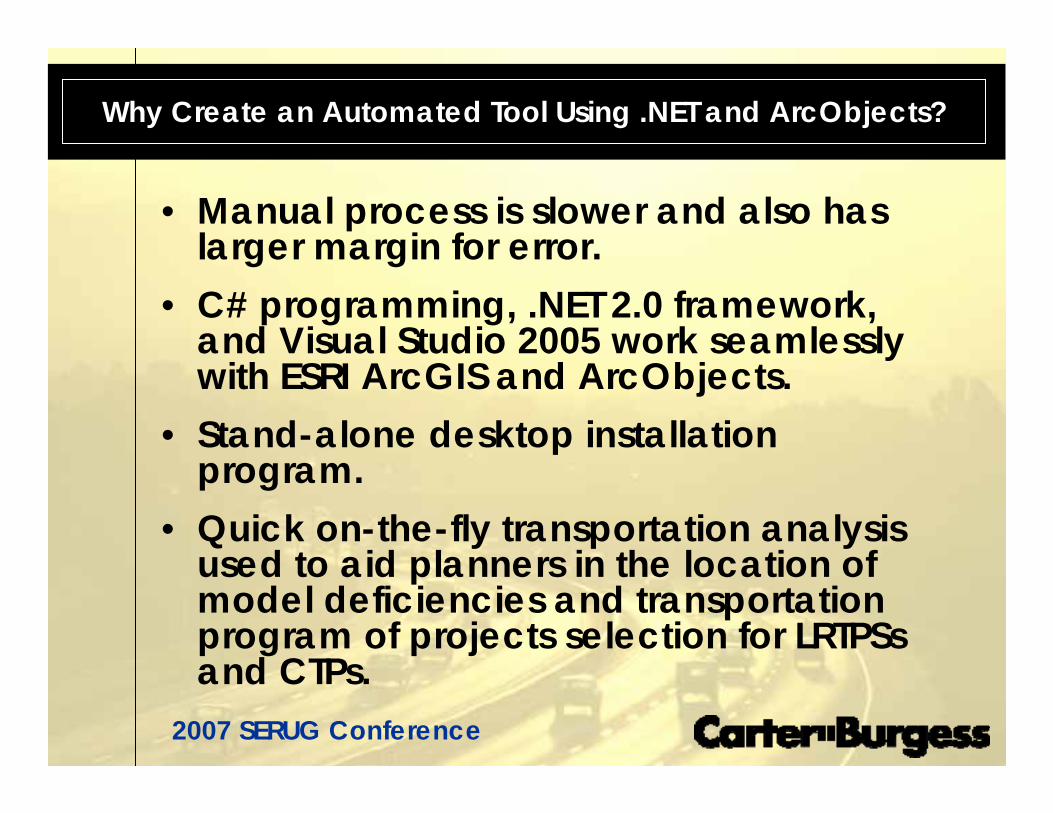
• Manual process is slower and also has larger margin for error.
• C# programming, .NET 2.0 framework, and Visual Studio 2005 work seamlessly with ESRI ArcGIS and ArcObjects.
• Stand-alone desktop installation program.
• Quick on-the-fly transportation analysis used to aid planners in the location of model deficiencies and transportation program of projects selection for LRTPSsand CTPs.
Why Create an Automated Tool Using .NET and ArcObjects?

2007 SERUG Conference
• Export calibrated (loaded) model network file to shapefile.
• Perform LOS and V/C ratio automation.
• Develop needs identification analysis.• Develop detailed LOS maps and needs
identification for referencing.
*Consult safety data if available.
GIS Integration and Automation after Model Calibration
2007 SERUG Conference
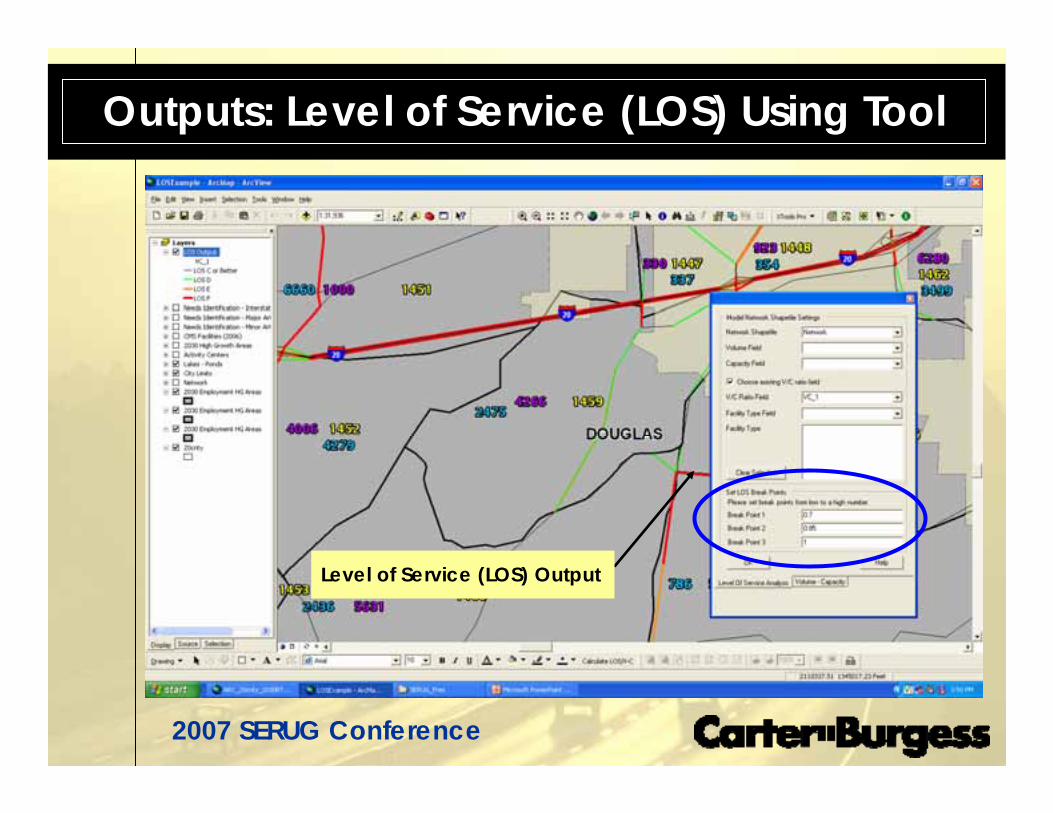
Outputs: Level of Service (LOS) Using Tool
Level of Service (LOS) Output

2007 SERUG Conference
Outputs: Attributes Using Tool

2007 SERUG Conference
Outputs: Volume Minus Capacity Using Tool
Choose Correct Facility Type for V Minus C Analysis
V Minus C Analysis Output
2007 SERUG Conference
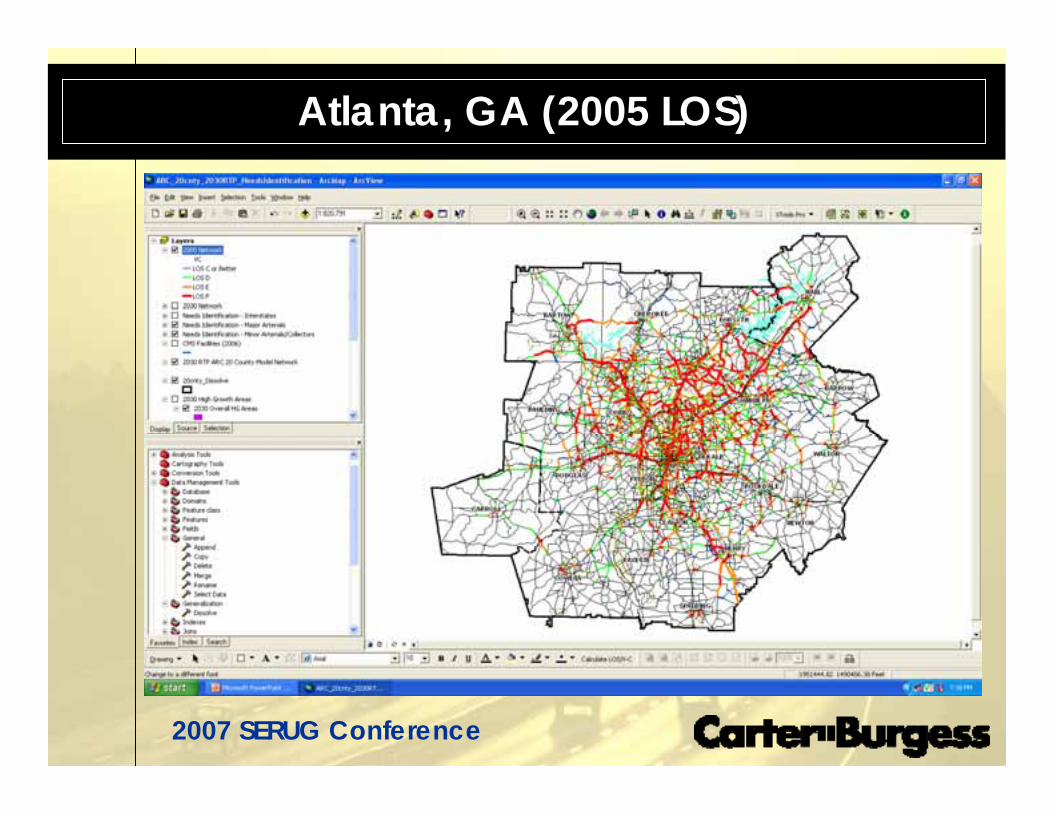
Atlanta, GA (2005 LOS)
2007 SERUG Conference
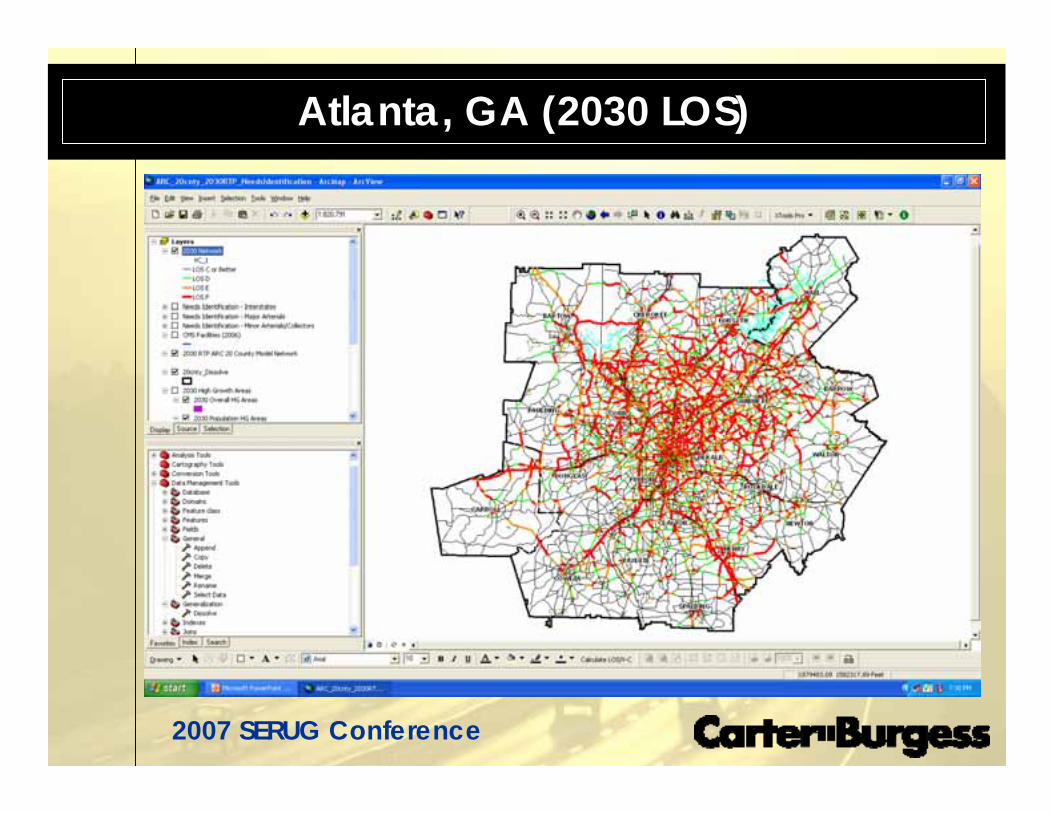
Atlanta, GA (2030 LOS)

2007 SERUG Conference
Atlanta, GA (2030 V Minus C)
2007 SERUG Conference
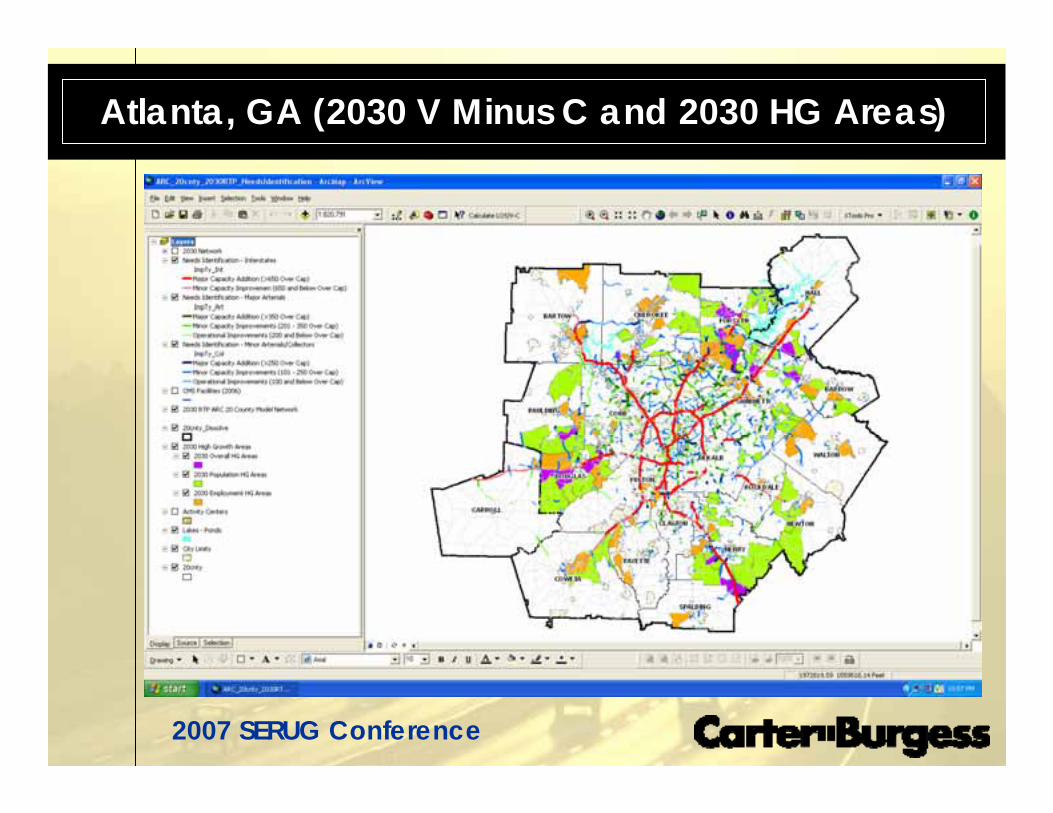
Atlanta, GA (2030 V Minus C and 2030 HG Areas)

2007 SERUG Conference
Chattanooga, TN (2005 LOS)

2007 SERUG Conference
Chattanooga, TN (2030 LOS)

2007 SERUG Conference
Chattanooga, TN (2030 V Minus C)

2007 SERUG Conference
Chattanooga, TN (2030 V Minus C and 2030 HG Areas)
2007 SERUG Conference
LIVE GIS DEMO

2007 SERUG Conference
Douglas W. Lynch, GISP
Presented By:
GIS & Travel Demand Modeling in the Southeast:An Analytical Approach with .NET GIS Customization
(404) 478-3907