service assessment pacific northwest storms of … assessment pacific northwest storms of december...
TRANSCRIPT

Service Assessment
Pacific Northwest Storms of December 1-3, 2007
U.S. DEPARTMENT OF COMMERCE National Oceanic and Atmospheric Administration National Weather Service Silver Spring, Maryland

Cover Photograph: Looking north over Interstate 5 near Chehalis, Washington shortly after the storms of December 1-3, 2007. Permission to use image courtesy of the Washington State Department of Transportation (WSDOT). Photo taken by Jeremy King of the WSDOT.
ii

Service Assessment
Pacific Northwest Storms of December 1-3, 2007 September 2008 National Weather Service John L. Hayes, Assistant Administrator
iii

Preface
From December 1 through December 3, 2007, three potent storm systems moved onshore along the Washington and Oregon coasts. These storms brought snow, hurricane force winds, coastal flooding, heavy rain and avalanches. Heavy rain and rapidly melting snow produced severe flooding. Five river forecast points broke all-time record flood levels. The flooding and avalanches caused eleven fatalities.
Due to the significant effects of the event, the National Oceanic and Atmospheric Administration (NOAA) National Weather Service (NWS) formed a service assessment team to evaluate its performance. The findings and recommendations from this assessment will improve the quality of NWS products and services, and enhance the ability of the NWS to increase public education and awareness regarding issues associated with flash floods, flooding, strong winds and avalanches. The ultimate goal of this report is to help the NWS meet its mission of protecting lives and property and enhancing the national economy.
John L. Hayes Assistant Administrator
for Weather Services September 2008
iv

Table of Contents
PagePreface............................................................................................................................................ iv Service Assessment Team.............................................................................................................. vi Service Assessment Report..............................................................................................................1
1. Executive Summary ...............................................................................................................1 2. Introduction............................................................................................................................7 a. NWS Mission.....................................................................................................................7 b. Purpose and Objectives......................................................................................................7 c. Methodology ......................................................................................................................8 3. Summary of Storms and Damage ..........................................................................................8 4. Findings Recommendations and Best Practices ..................................................................12 4.1 Warning and Forecast Services for Wind ......................................................................12 4.2 Warning and Forecast Services for Precipitation and Flooding ....................................15 4.2.1 Flash Flooding .......................................................................................................19 4.2.2 Snow Water Equivalent .........................................................................................19 4.3 Avalanches.....................................................................................................................20 4.4 Communication and Outreach .......................................................................................21 5. Observational Data..............................................................................................................23 5.1 Marine Buoy Data..........................................................................................................23 5.2 National Weather Service Radar....................................................................................24 6. Summary .............................................................................................................................27
Appendix A Acronyms ...............................................................................................................29 Appendix B Definitions ..............................................................................................................31 Appendix C Fatality Statistics ....................................................................................................32 Appendix D Critical River Stages of Forecast Locations...........................................................33
v
Service Assessment Team
The following NOAA personnel participated on the team:
Joel Lanier Senior Service Hydrologist, WFO Tallahassee, Florida Joe Miketta Warning and Coordination Meteorologist (WCM), WFO
Philadelphia/Mount Holly, New Jersey Mark Moede Lead Forecaster, WFO San Diego, California Matthew Ocana Public Affairs Specialist, NOAA, NWS, Salt Lake City, Utah Charles Paxton Science and Operations Officer (SOO), WFO Tampa, Florida David Reed Team Leader, Hydrologist-in-Charge (HIC), Lower Mississippi
River Forecast Center, New Orleans, Louisiana. Other valuable contributors include: David Caldwell Director Office of Climate, Water, and Weather Services
(OCWWS), Silver Spring, Maryland Jim Hoke Acting OCWWS Director (through January 2008) Wayne Presnell Service Assessment Program Manager, OCWWS Performance
Branch Douglas Young Chief, OCWWS Performance Branch
vi

Service Assessment Report
1. Executive Summary
The mission of NOAA’s National Weather Service is to protect life and property by providing weather, hydrologic, and climate forecasts and warnings for the United States, its territories, adjacent waters and ocean areas. The NWS disseminates centrally produced data, weather products, and guidance to 135 regional and local Weather Forecast Offices and River Forecast Centers. The forecasters at the WFOs and RFCs issue all local forecasts and warnings to the public. The National Centers for Environmental Prediction (NCEP), consisting of 9 prediction centers, provide central guidance, outlooks, and hazardous weather watches and warnings to the NWS organization and the public; additionally, 10 national centers support the day-to-day operations.
A series of three storms affected the Pacific Northwest between December 1 and 3, 2007. Strong storms in this area during the fall and winter are common, but the first two storms left conditions ripe for flooding and the third storm was unusually intense. Significant snowfall occurred at the beginning of the event at the lower elevations of the Coastal Range in Oregon and the Olympic Mountains in Washington. The third and most powerful storm system was fueled by tropical moisture from the remnants of western Pacific Ocean Typhoons Hagibis and Mitag. Heavy rainfall merged with the rapidly melting snow pack to produce record flooding in Western Oregon and Washington. The six hour rainfall amounts were near a 100-year event. The maximum storm total rainfall from official NWS observations measured in Oregon was 14.5 inches at Lees Camp and 17.4 inches at Cushman Dam in Washington.
The final storm also generated hurricane force wind gusts lasting over 30 hours. The peak wind gust from an official observing station was 129 mph at Bay City, Oregon. The long duration and strength of the wind damaged or set adrift four data buoys. However, this loss of information did not cause any negative impacts to users of NWS products and services during this event. In Grays Harbor County, Washington, the long duration of hurricane force winds knocked down hundreds of power poles and thousands of trees across western portions of the county. Travel was blocked by downed trees, and about 90 percent of the customers of the Public Utility District in Grays Harbor lost power. The town of Vernonia, Oregon was completely cut off from communication and transportation due to power losses and flooded roads.
Eleven fatalities were associated with the event, including three in Oregon and eight in Washington. A portion of Interstate 5 near Chehalis, Washington was closed for several days due to flooding and the Washington State Department of Transportation (WSDOT) estimated the closure cost the local economy approximately $4 million per day. Overall, the estimated damage total exceeds $1 billion.
1

As a result of this unusual storm system and the problems it caused, the National Weather Service (NWS) formed a service assessment team to evaluate NWS products and services during the event. In January 2008, the six-member team interviewed NWS employees from the WFOs in Portland and Seattle and the Northwest River Forecast Center (NWRFC) in Portland, as well as critical customers and partners to ascertain facts of the event. The goal of service assessments is to improve the ability of the NWS to protect life and property by implementing recommendations and best practices that improve products and services.
The majority of the NWS customers interviewed indicated the NWS did an excellent job with forecasting and warning the public for this event. All NWS entities (National Centers for Environmental Prediction (NCEP), River Forecast Centers (RFC), and Weather Forecast Offices (WFO)) provided accurate guidance, outlooks, forecasts, and services 5 to 6 days in advance of the storm allowing the public to take appropriate action. As the event drew closer, the NWS continued to provide accurate products and services. Four important data buoys were damaged or set adrift during the storm and one was out of service before the event. By the time these buoys stopped transmitting data; appropriate warnings had already been issued. Though the loss of data had no impact on the initial issuance of warnings, WFOs Seattle and Portland could no longer monitor the marine environment in real-time and update or cancel the warnings based on these observations. The loss of buoy data in the marine areas of responsibility created significant challenges to forecasters in the months following this event as well. Only two of the buoys have been restored as of June 2008.
Important results of service assessment reports are facts, findings,
recommendations for improvement, and best practices. Overall, 10 recommendations have been made based on the team’s findings. These recommendations should address deficiencies, improve NWS performance, and enhance NWS weather safety outreach programs. There were also five best practices identified. See Appendix B of this document for NWS definitions of facts, findings, recommendations, and best practices.
The following are important facts of the assessment.
Four data buoys were damaged or set adrift during the event and an additional
data buoy was out of service shortly before the event started.
The lack of data from these five data buoys created a 300 mile gap in observations over the coastal waters of the Pacific Northwest. NWS forecasters rely heavily on this real-time information in fulfilling their forecast and warning responsibilities.
Replacing and repairing damaged or destroyed buoys is a slow process, and
replacing or repairing these buoys will take several months.
The decrease in real-time observational data over the Pacific Northwest coastal waters created challenges in forecasting and warning for these areas, especially in the months following the event.
2

Both the WFO Seattle and WFO Portland radars are partially blocked by the
terrain features of the Olympic Mountains and the Coastal Range Mountains.
This partial “beam blockage” can lead to underestimated amounts of rainfall and wind speed since the radar is not receiving return information from the entire beam.
Short-term forecasts (6 hours or less) and warnings can suffer as a result of these
inaccurate estimates.
Emergency Management officials of Grays Harbor County, Washington complained the NWS did not provide adequate warning and forecast information to their county for the event and pointed to the “beam blockage” issue with the NWS weather radar (WSR-88D) at WFO Seattle as one reason for the perceived inadequate services.
In the report by the National Research Council (NRC), Toward a New National
Weather Service – Assessment of NEXRAD WSR-88D Coverage, published in 1995, the NRC panel identified areas of potential for degradation in radar detection coverage capability in what is now the current NWS WSR-88D radar network. The Washington and Oregon coasts were not identified as areas of potential for degradation in radar detection coverage capability.
During this event, the WSR-88D radar Storm Total Precipitation figures from
Portland and Seattle (Figure 7) show large sectors of limited total precipitation amounts due to the radar’s bean being blocked by high terrain.
Emergency management officials in Grays Harbor County, an Atmospheric
Sciences professor at the University of Washington, and U.S. Senator Maria Cantwell (WA), have advocated for an installation of weather radar, which in their opinions, would provide better coverage for the coastal areas of southwest Washington and northwest Oregon.
The Appropriations Committee for the Omnibus Bill of Fiscal Year 2008
recognized the need for additional low level weather radar coverage along the coast of southern Washington and northern Oregon. The amended Omnibus Bill provides funding for NOAA and the NWS to work with the University of Massachusetts and the National Science Foundation, under the umbrella of the Collaborative Adapting Sensing of the Atmosphere (CASA) program, to determine the feasibility of integrating a number of small-scale Doppler radar technologies into future NWS observing programs.
The CASA team investigating the radar coverage issue is expected to complete
their report in October 2008.
3

The NWS is adding a connection to the Federal Aviation Administration's Air Route Surveillance Radar - Version 4 (ARSR-4) at Makah, Washington, located in the northern coast of Washington. WFO Seattle will be able to use data from this radar by the end of calendar year 2008.
The major findings of the team are:
The Hurricane Force Wind Warnings were more effective in raising awareness
than traditional marine warnings commonly issued during the winter. However, the warnings created some confusion with a fear that an actual hurricane was approaching the coast and would cause hurricane force winds inland. The Hurricane Force Wind Warning can not be used for land areas, only water.
Inconsistencies and unnecessary complexities exist in the operational software
used in preparing hydrologic products.
The Warning Generation (Warngen) software used to create severe weather warnings does not draw accurate polygons at land/water interfaces.
Avalanches caused the most fatalities (5) during this event.
Major urban and small stream flooding occurred west of the Cascade divide,
especially in Kings County and the Seattle Metro area. Small streams rose rapidly and local officials were surprised by the amount and intensity of the rainfall and how quickly the small streams rose. This flooding had characteristics of classical flash flooding.
The amount of water in the snow pack could not be estimated accurately due to the lack of snow observations in the Coastal Range Mountains and Olympic Mountains and different methods of estimating Snow Water Equivalent (SWE) used by the National Operational Hydrologic Remote Sensing Center (NOHRSC) and NWRFC.
The team’s recommendations are:
The NWS should allow Extreme Wind Warnings to be issued in association with
extra-tropical storms which produce hurricane force (> 74 mph) winds over land.
The NWS should correct the problems with the RiverPro software.
The preparation of Outlooks, Flood Warnings, Flood Statements, and Areal Flood Warnings should be combined into a single software application in the upcoming version of the Advanced Weather Interactive Processing System (AWIPS II).
NWRwaves should be modified to automatically prepare a major flood warning
and activate the Emergency Alert System (EAS) Tone Alert for broadcast.
4
Advanced Hydrologic Prediction System (AHPS) web services should be
modified to recognize when a primary data source is missing for an extended period. When this occurs, a secondary data source should be used automatically, and a message should be sent to the WFO.
The next generation of Warngen should draw more accurate polygons with regard
to land/water interfaces and include more accurate and higher resolution maps.
The NWS should work closely with the Northwest Avalanche Center (NWAC) to increase outreach and education on the dangers of avalanches and the methods of dissemination for Avalanche Warnings.
The NWRFC and WFOs Portland and Seattle should use data from this flood
event to evaluate if Flash Flood Guidance (FFG) would have improved products and services.
The NWS should continue to work with its partners to enhance and expand the
data collection networks in areas where snowfall is important to SWE. A collaborative effort is needed to merge the best features of various methods for estimating SWE.
The best practices identified by the team are:
The Ocean Prediction Center (OPC) utilized ocean surface vector wind estimates
from the Quikscat satellite to ascertain which meteorological models were properly simulating the storms that struck the Pacific Northwest. Ocean Surface wind estimates from QuikSCAT are available in Advanced Weather Interactive Processing System (AWIPS). AWIPS is a technologically advanced information processing, display, and telecommunications system used by the NWS. They can be used to supplement wind observation over large bodies of water where actual wind observations are sparse.
WFOs Portland and Seattle issued High Surf Warnings instead of High Surf
Advisories. NWS warnings indicate a more serious threat than advisories. The High Surf Warnings increased awareness of the serious threat of high surf associated with this event.
NWRFC used the Graphical Forecast Editor (GFE) as an effective analysis tool to
facilitate collaboration between the RFC and WFOs. The GFE is a graphical on-screen editor that allows forecasts to create detailed graphical depictions of coming weather, while at the same time creating a numerical database of weather information ("grids") representing the same forecast. This was the first time any RFC utilized the GFE to prepare forecast precipitation, temperatures, and freezing levels for inclusion in RFC forecast models. These procedures worked well with no errors or problems.
5

All major Flood Warnings issued for sites in Washington and Oregon activate
EAS/Tone Alert for NWR. This policy was established at local user requests. Local officials said this was very effective during the storms.
The web conference allowed the WFOs to disseminate information on the event to
many more people than traditional conference calls. Since most agencies had several representatives including public works and the local law enforcement, it is estimated that over 500 people participated in these briefings. This information was used by decision makers in planning and preparation for the event.
6

2. Introduction
2.1 NWS Mission
The mission of NOAA’s National Weather Service is to protect life and property by providing weather, hydrologic, and climate forecasts and warnings for the United States, its territories, adjacent waters and ocean areas. The NWS disseminates centrally produced data, weather products, and guidance to 135 regional and local Weather Forecast Offices and River Forecast Centers. The forecasters at the WFOs and RFCs issue all local forecasts and warnings to the public and interface with local emergency managers and state and local governments to promote community awareness and understanding of local climates, forecasts, and weather events.
The NWS is also comprised of six regional headquarters and one national headquarters, which provide policy and guidance to the WFOs and RFCs. The National Centers for Environmental Prediction (NCEP), consisting of 9 prediction centers, provide central guidance, outlooks, and hazardous weather watches and warnings to the NWS organization and the public; additionally, 10 national centers support the day-to-day operations of the NWS.
2.2 Purpose of Assessment Report The NWS conducts service assessments of significant weather-related events that
result in at least one fatality, numerous injuries requiring hospitalization, extensive property damage, widespread media interest, or an unusual level of scrutiny of NWS operations by the media, emergency management community, or elected officials. Service Assessments evaluate the NWS performance and ensure the effectiveness of NWS products and services in meeting the mission. The goal of service assessments is to improve the ability of the NWS to protect life and property by implementing recommendations and best practices that improve products and services.
The purpose of this document is to present the findings and recommendations resulting from the service assessment evaluation of NWS performance during the winter storms of December 1 through 3, 2007, in the Pacific Northwest. The storms brought prolonged strong winds, heavy rain, and major flooding to the region, which resulted in loss of life and property, and severely affected transportation and commerce.
The objectives of this service assessment are to identify significant findings and issue recommendations and best practices related to the following key areas:
• Effectiveness of NWS internal and external coordination/collaboration • Effectiveness of NWS information dissemination • Effectiveness of NWS office procedures • Effectiveness of NWS severe weather awareness activities
7

Overall, the team issued 10 recommendations based on their evaluation and findings. These recommendations should address deficiencies, improve NWS performance, and enhance NWS weather safety outreach programs. The team also identified four best practices.
2.3 Methodology
The NWS formed an assessment team on January 7, 2008 consisting of employees from regional and headquarters offices. The team conducted interviews with staff from WFOs in Seattle, Washington and Portland, Oregon, in addition to the Northwest River Forecast Center (NWRFC) in Portland, Oregon. These offices had primary responsibility for providing forecasts and warnings to the citizens and emergency managers of the affected areas. The team also interviewed emergency managers, the media, and the public, and assessed the damaged areas. The team evaluated the products and services issued by the WFOs and NWRFC, as well as the central guidance issued from these NWS national centers: Storm Prediction Center (SPC), Ocean Prediction Center (OPC), and the Hydrometeorological Prediction Center (HPC).
Upon completion of the interviews and evaluations, the team discussed and agreed upon the significant findings and recommendations to improve effectiveness of NWS products and services. After a series of internal reviews, the service assessment was approved and signed by the NOAA Assistant Administrator for Weather Services and issued to the American Public.
3. Summary of Storms and Damage
Three storms affected the Pacific Northwest between December 1 and 3, 2007. The third and strongest storm was fueled by remnants of Pacific Typhoons Hagibis and Mitag. Heavy rainfall and rapidly melting snow produced record flooding in western Oregon and Washington. The maximum storm total rainfall measured in Oregon was 14.5 inches at Lees Camp, and in Washington it was 17.4 inches at Cushman Dam. Ten observing locations monitored by the NWS and U.S. Geological Survey (USGS) experienced record flooding. The worst flooding was near Chehalis, Washington where a portion of Interstate 5, the major thoroughfare between Portland and Seattle, was covered by 10 feet of water. That 20 mile stretch of Interstate 5 was closed for several days and, the closure cost the local economy $4 million per day, according to the Washington Department of Transportation.
The storm generated hurricane force wind gusts that persisted for more than 30
hours with a peak wind gust of 129 miles per hour (mph) at Bay City, Oregon. A deep surface low with a minimum pressure of 952 millibars (mb) combined with a strong low level jet stream off the coast to produce the hurricane force wind gusts. The long duration and strength of the wind, combined with the heavy surf over the coastal waters, damaged or set adrift four data buoys. Appropriate warnings had already been issued by the time these buoys stopped transmitting data. With the lack of real-time observations
8

over the coastal waters, WFOs Seattle and Portland could no longer monitor the marine environment and update or cancel the warnings based on these observations.
The long duration of the strong winds also knocked out power to millions of
customers across the two states. The timber industry suffered massive loss from felled trees. Travel was blocked by downed trees, and about 90 percent of the customers of the Public Utility District in Grays Harbor lost power. The town of Vernonia, Oregon was completely cut off from communication and transportation due to power losses and flooded roads.
Eleven fatalities were associated with the event, including 3 in Oregon and 8 in Washington. The majority of the fatalities (5) were caused by avalanches. Preliminary total damage estimates exceed $1 billion.
The first storm arrived on December 1, creating heavy snow in the Oregon Coastal Range, the Olympic Mountains, and the Cascades. The second storm arrived on Sunday morning December 2, producing several inches of rain at the lower elevations and snow at the higher elevations. Two-day snow accumulations ranged from 2-6 inches in the Coastal Range, and 12-20 inches in the Cascades.
Sunday evening, December 2, the third and strongest storm arrived and affected
the area through Monday, December 3. A warm, moist tropical air-mass (from the remnants of Typhoons Hagibis and Mitag) associated with this final storm surged inland ahead of a cold front (Figure 1). Surface temperatures rose 30°F in less than 2 hours Sunday evening. Figure 1. Surface pressure and fronts analysis and satellite imagery for 1800 Universal Coordinated Time (UTC) Monday, December 3, 2007. Issued by the Hydro-meteorological Prediction Center at 1940 UTC December 3, 2007.
9

In the Oregon Coastal Range, rapid warming melted the snowpack, which had the water equivalent of 9 inches of rain, in less than 24 hours. Heavy rainfall occurred from mid-day Sunday December 2 through mid-day Monday December 3.
Hurricane force wind gusts battered the coast for nearly 30 hours from early
Sunday morning, December 2 through midday Monday, December 3. Sustained winds of 60 to 70 mph with gusts over 100 mph were reported from the central Oregon Coast northward to southwest Washington. The high winds downed or snapped thousands of trees along the coastal range, causing significant property damage with widespread power and communication outages lasting several days.
The hurricane force wind gusts also generated seas of 40-50 feet Sunday and Monday with peak waves of almost 70 feet. The gigantic waves crashed onshore for nearly 2 days with beach damage and erosion. Large rocks and boulders were cast onto Highway 101 near Cape Disappointment. Data Buoy 46050, reported winds to 64 knots and seas of 48 feet at 1:50 a.m. PST, Monday, December 3 before its data was lost. At the coast, winds gusted in excess of 100 mph, with a peak wind of 129 mph at Bay City, Oregon at 2:00 a.m. PST, on December 3 (Table 1 and Figure 2).
Wind speed (mph) Location
129 mph (Dec 3, 2:00 a.m.) Bay City, OR 125 mph (Dec 3, 1:00 a.m.) Lincoln City, OR 114 mph (Dec 3, 4:00 a.m.) Cape Meares, OR 113 mph (Dec 3, 3:00 a.m.) Cape Blanco, OR 104 mph (Dec 3, 8:00 a.m.) Rockaway Beach, OR 104 mph (Dec 3, 7:00 a.m.) Cape Disappointment, WA 93 mph (Dec 3, 5:00 a.m.) Destruction Island, WA 86 mph (Dec 3, 7:00 a.m.) Tatoosh Island, WA 81 mph (Dec 3, 7:00 a.m.) Hoquiam, WA
Table 1: Peak Wind Gusts from official observing stations in the Pacific Northwest associated with the storms of December 1-3, 2007
Figure 2: Peak wind gusts (mph) for December 2-4, 2007, for areas of Washington and Oregon affected by the storms. See insert above for more information. Image is from the article, Great Coastal Gale of Dec 1-3, 2007 by Wolf Read.
10
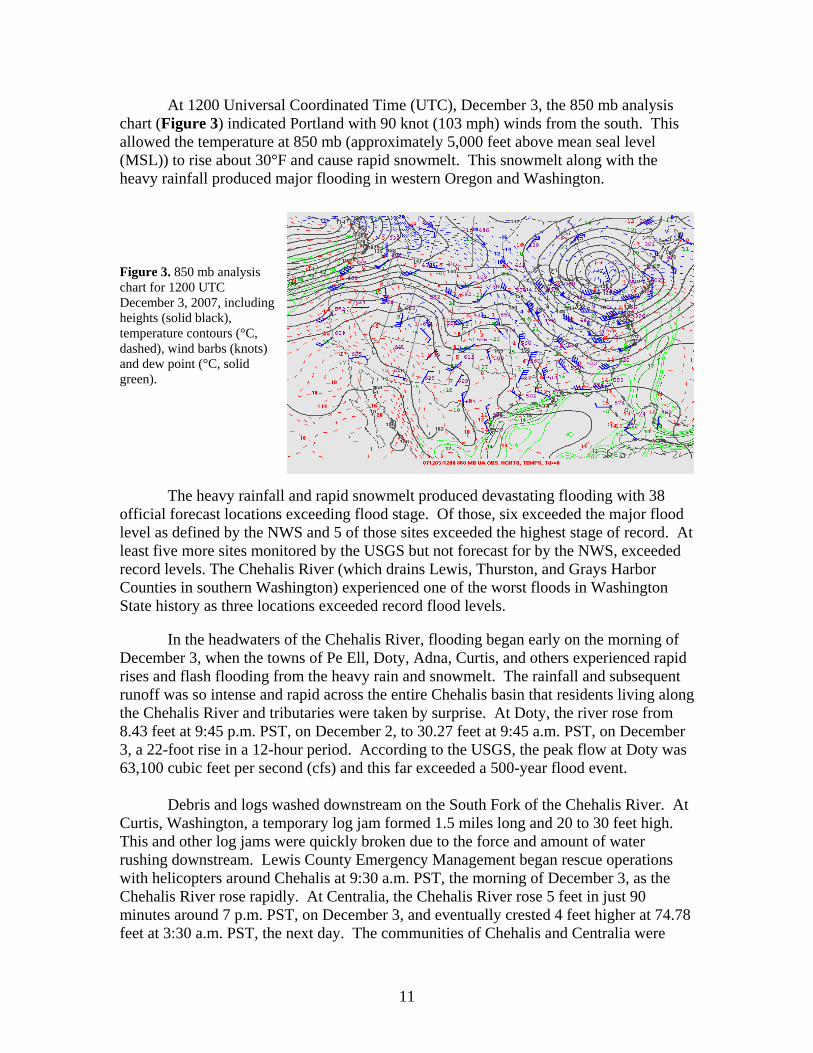
At 1200 Universal Coordinated Time (UTC), December 3, the 850 mb analysis chart (Figure 3) indicated Portland with 90 knot (103 mph) winds from the south. This allowed the temperature at 850 mb (approximately 5,000 feet above mean seal level (MSL)) to rise about 30°F and cause rapid snowmelt. This snowmelt along with the heavy rainfall produced major flooding in western Oregon and Washington.
Figure 3. 850 mb analysis chart for 1200 UTC December 3, 2007, including heights (solid black), temperature contours (°C, dashed), wind barbs (knots) and dew point (°C, solid green).
The heavy rainfall and rapid snowmelt produced devastating flooding with 38
official forecast locations exceeding flood stage. Of those, six exceeded the major flood level as defined by the NWS and 5 of those sites exceeded the highest stage of record. At least five more sites monitored by the USGS but not forecast for by the NWS, exceeded record levels. The Chehalis River (which drains Lewis, Thurston, and Grays Harbor Counties in southern Washington) experienced one of the worst floods in Washington State history as three locations exceeded record flood levels.
In the headwaters of the Chehalis River, flooding began early on the morning of December 3, when the towns of Pe Ell, Doty, Adna, Curtis, and others experienced rapid rises and flash flooding from the heavy rain and snowmelt. The rainfall and subsequent runoff was so intense and rapid across the entire Chehalis basin that residents living along the Chehalis River and tributaries were taken by surprise. At Doty, the river rose from 8.43 feet at 9:45 p.m. PST, on December 2, to 30.27 feet at 9:45 a.m. PST, on December 3, a 22-foot rise in a 12-hour period. According to the USGS, the peak flow at Doty was 63,100 cubic feet per second (cfs) and this far exceeded a 500-year flood event.
Debris and logs washed downstream on the South Fork of the Chehalis River. At Curtis, Washington, a temporary log jam formed 1.5 miles long and 20 to 30 feet high. This and other log jams were quickly broken due to the force and amount of water rushing downstream. Lewis County Emergency Management began rescue operations with helicopters around Chehalis at 9:30 a.m. PST, the morning of December 3, as the Chehalis River rose rapidly. At Centralia, the Chehalis River rose 5 feet in just 90 minutes around 7 p.m. PST, on December 3, and eventually crested 4 feet higher at 74.78 feet at 3:30 a.m. PST, the next day. The communities of Chehalis and Centralia were
11
inundated and Interstate 5 was completely submerged under 10 feet of water. One half of the town of Chehalis was destroyed. In Mason County, Washington, three levees on the Skohomish River failed, allowing water to spread out across the valley. Even with the levee breaks spreading water over a larger area, the river still reached a record 18.1 feet.
4. Findings, Recommendations, and Best Practices
4.1 Warning and Forecast Services for Wind
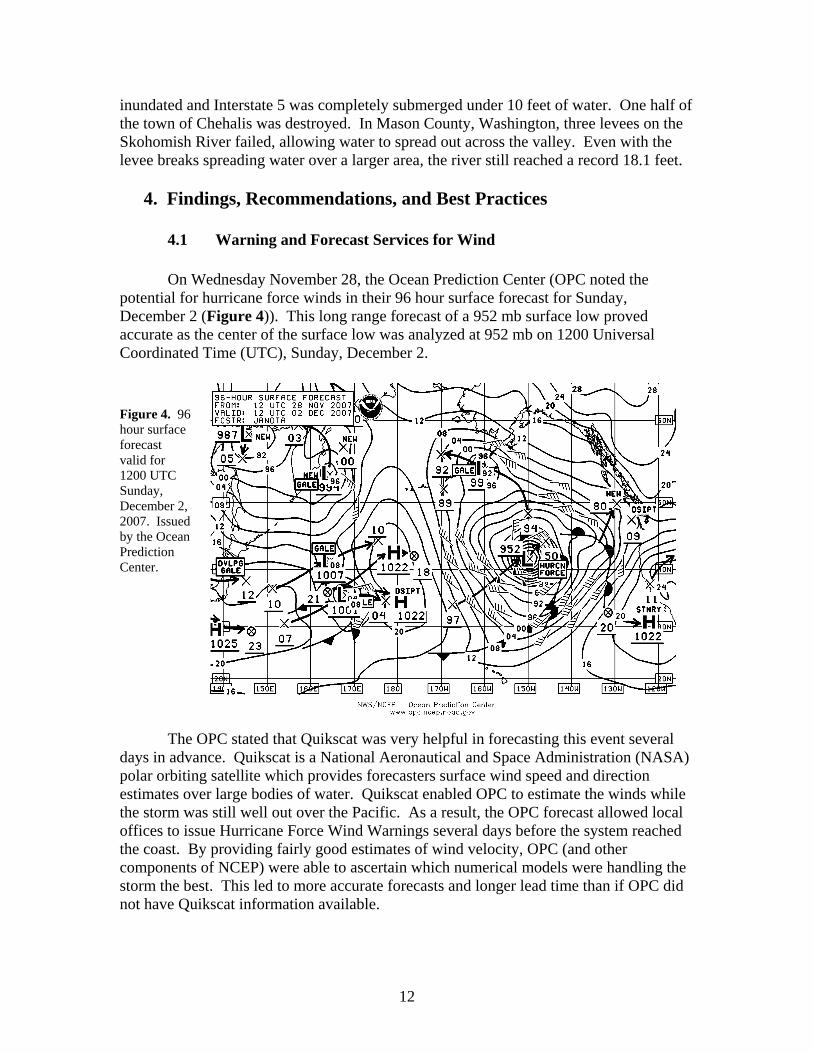
On Wednesday November 28, the Ocean Prediction Center (OPC noted the potential for hurricane force winds in their 96 hour surface forecast for Sunday, December 2 (Figure 4)). This long range forecast of a 952 mb surface low proved accurate as the center of the surface low was analyzed at 952 mb on 1200 Universal Coordinated Time (UTC), Sunday, December 2. Figure 4. 96 hour surface forecast valid for 1200 UTC Sunday, December 2, 2007. Issued by the Ocean Prediction Center.
The OPC stated that Quikscat was very helpful in forecasting this event several
days in advance. Quikscat is a National Aeronautical and Space Administration (NASA) polar orbiting satellite which provides forecasters surface wind speed and direction estimates over large bodies of water. Quikscat enabled OPC to estimate the winds while the storm was still well out over the Pacific. As a result, the OPC forecast allowed local offices to issue Hurricane Force Wind Warnings several days before the system reached the coast. By providing fairly good estimates of wind velocity, OPC (and other components of NCEP) were able to ascertain which numerical models were handling the storm the best. This led to more accurate forecasts and longer lead time than if OPC did not have Quikscat information available.
12
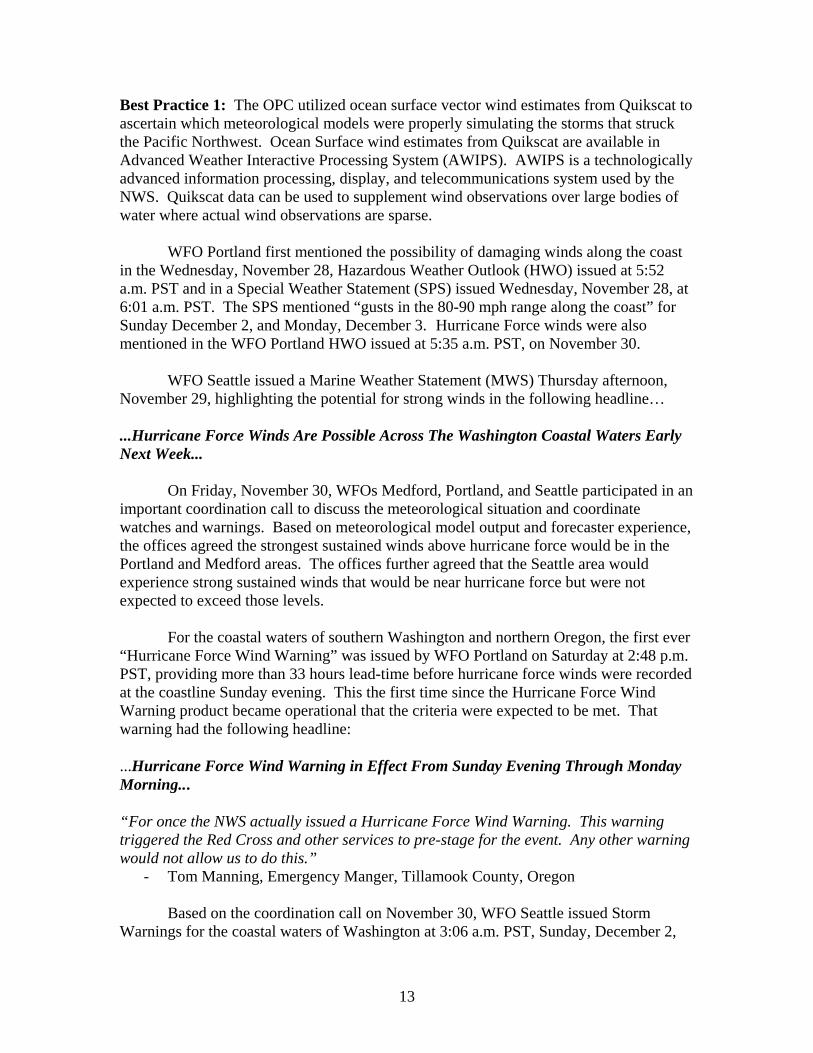
Best Practice 1: The OPC utilized ocean surface vector wind estimates from Quikscat to ascertain which meteorological models were properly simulating the storms that struck the Pacific Northwest. Ocean Surface wind estimates from Quikscat are available in Advanced Weather Interactive Processing System (AWIPS). AWIPS is a technologically advanced information processing, display, and telecommunications system used by the NWS. Quikscat data can be used to supplement wind observations over large bodies of water where actual wind observations are sparse.
WFO Portland first mentioned the possibility of damaging winds along the coast in the Wednesday, November 28, Hazardous Weather Outlook (HWO) issued at 5:52 a.m. PST and in a Special Weather Statement (SPS) issued Wednesday, November 28, at 6:01 a.m. PST. The SPS mentioned “gusts in the 80-90 mph range along the coast” for Sunday December 2, and Monday, December 3. Hurricane Force winds were also mentioned in the WFO Portland HWO issued at 5:35 a.m. PST, on November 30.
WFO Seattle issued a Marine Weather Statement (MWS) Thursday afternoon, November 29, highlighting the potential for strong winds in the following headline… ...Hurricane Force Winds Are Possible Across The Washington Coastal Waters Early Next Week...
On Friday, November 30, WFOs Medford, Portland, and Seattle participated in an important coordination call to discuss the meteorological situation and coordinate watches and warnings. Based on meteorological model output and forecaster experience, the offices agreed the strongest sustained winds above hurricane force would be in the Portland and Medford areas. The offices further agreed that the Seattle area would experience strong sustained winds that would be near hurricane force but were not expected to exceed those levels.
For the coastal waters of southern Washington and northern Oregon, the first ever “Hurricane Force Wind Warning” was issued by WFO Portland on Saturday at 2:48 p.m. PST, providing more than 33 hours lead-time before hurricane force winds were recorded at the coastline Sunday evening. This the first time since the Hurricane Force Wind Warning product became operational that the criteria were expected to be met. That warning had the following headline:
...Hurricane Force Wind Warning in Effect From Sunday Evening Through Monday Morning...
“For once the NWS actually issued a Hurricane Force Wind Warning. This warning triggered the Red Cross and other services to pre-stage for the event. Any other warning would not allow us to do this.”
- Tom Manning, Emergency Manger, Tillamook County, Oregon
Based on the coordination call on November 30, WFO Seattle issued Storm Warnings for the coastal waters of Washington at 3:06 a.m. PST, Sunday, December 2,
13
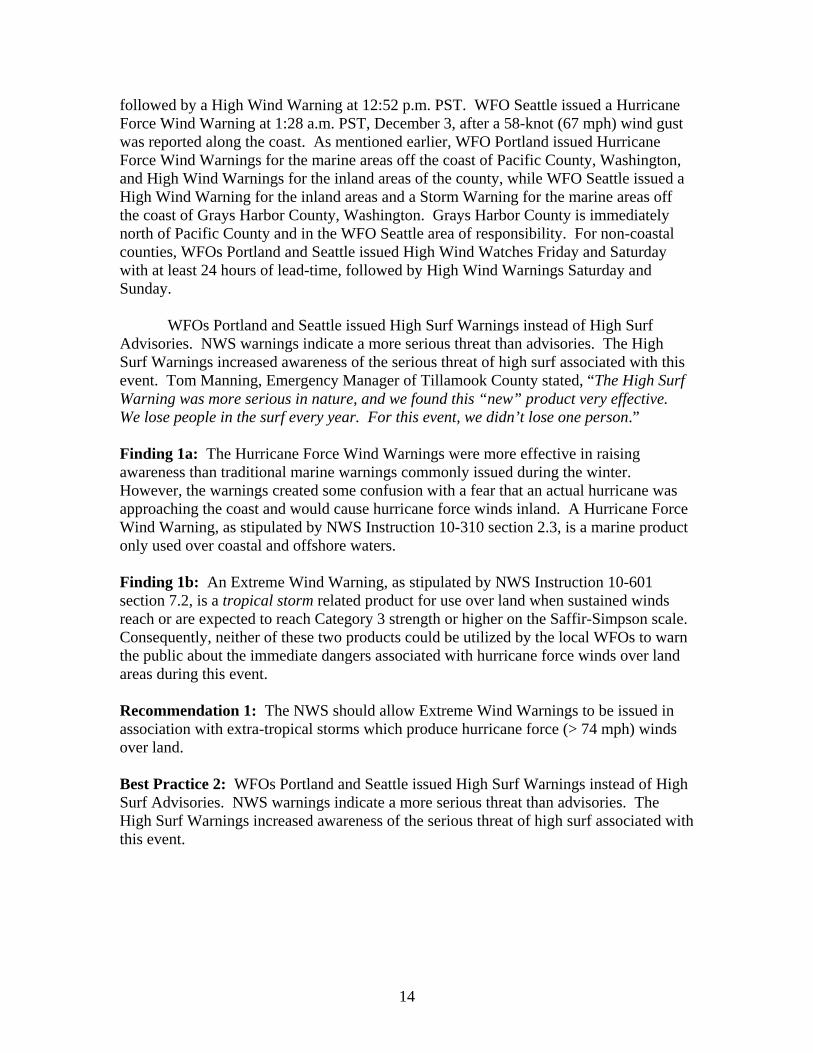
followed by a High Wind Warning at 12:52 p.m. PST. WFO Seattle issued a Hurricane Force Wind Warning at 1:28 a.m. PST, December 3, after a 58-knot (67 mph) wind gust was reported along the coast. As mentioned earlier, WFO Portland issued Hurricane Force Wind Warnings for the marine areas off the coast of Pacific County, Washington, and High Wind Warnings for the inland areas of the county, while WFO Seattle issued a High Wind Warning for the inland areas and a Storm Warning for the marine areas off the coast of Grays Harbor County, Washington. Grays Harbor County is immediately north of Pacific County and in the WFO Seattle area of responsibility. For non-coastal counties, WFOs Portland and Seattle issued High Wind Watches Friday and Saturday with at least 24 hours of lead-time, followed by High Wind Warnings Saturday and Sunday.
WFOs Portland and Seattle issued High Surf Warnings instead of High Surf
Advisories. NWS warnings indicate a more serious threat than advisories. The High Surf Warnings increased awareness of the serious threat of high surf associated with this event. Tom Manning, Emergency Manager of Tillamook County stated, “The High Surf Warning was more serious in nature, and we found this “new” product very effective. We lose people in the surf every year. For this event, we didn’t lose one person.” Finding 1a: The Hurricane Force Wind Warnings were more effective in raising awareness than traditional marine warnings commonly issued during the winter. However, the warnings created some confusion with a fear that an actual hurricane was approaching the coast and would cause hurricane force winds inland. A Hurricane Force Wind Warning, as stipulated by NWS Instruction 10-310 section 2.3, is a marine product only used over coastal and offshore waters. Finding 1b: An Extreme Wind Warning, as stipulated by NWS Instruction 10-601 section 7.2, is a tropical storm related product for use over land when sustained winds reach or are expected to reach Category 3 strength or higher on the Saffir-Simpson scale. Consequently, neither of these two products could be utilized by the local WFOs to warn the public about the immediate dangers associated with hurricane force winds over land areas during this event. Recommendation 1: The NWS should allow Extreme Wind Warnings to be issued in association with extra-tropical storms which produce hurricane force (> 74 mph) winds over land. Best Practice 2: WFOs Portland and Seattle issued High Surf Warnings instead of High Surf Advisories. NWS warnings indicate a more serious threat than advisories. The High Surf Warnings increased awareness of the serious threat of high surf associated with this event.
14
4.2 Warning and Forecast Services for Precipitation and Flooding
The NWS provided information on the potential for heavy rainfall and flooding several days in advance with all offices recognizing the flooding threat early. The NWRFC noted the potential for early December heavy rainfall in their November 24, Hydromet Discussion. The HPC’s Extended Forecast Discussion issued on November 29 discussed the likelihood of 4-9 inches of rainfall from Vancouver Island, Canada to northern California between December 2 and 3. The Hydrometeorological Prediction Center (HPC) also issued excessive rainfall forecasts which accurately indicated the areas that would receive the heaviest rainfall. Although initial precipitation forecasts indicated the potential for heavy rain several days in advance, they failed to capture the intensity and magnitude in the areas where the most rainfall occurred. In some cases, observed precipitation amounts were double the amounts forecast by the HPC and NWRFC.
Forecasts and warnings for precipitation and flooding issued by all three WFOs, the NWRFC, and the HPC captured the likelihood for heavy snow, rain, and flooding. Initial outlook and watch statements underestimated the amount of warming at the surface and at cloud level (temperatures rose about 30°F at the surface and at cloud level in 2 hours Sunday evening, December 2) and this resulted in less snowfall and more rain than forecast. The rain falling on melting snow led to more significant flooding; however, forecasts and warnings issued by all offices were quickly adapted to reflect developing conditions indicated by observations.
Significant lead time was provided for the heavy snow. The average lead time of the Winter Storm Warnings issued by WFOs Seattle and Portland was 26 hours, which exceeds the national Government Performance Results Act (GPRA) goal for Winter Storm Warning of 15 hours. Special Weather Statements issued during the event properly reflected the short-term situation and were greatly appreciated by partners and customers. Precipitation outlooks and forecasts issued by the WFOs Portland and Seattle on November 30 accurately indicated the areas which would eventually receive the greatest amounts of rain but the estimates for the amount of rain and intensity of the rainfall were low. On November 30, both offices forecast rainfall amounts generally between 5-7 inches for the Olympics and Cascades Mountains with lower amounts in the lower elevations. Each office indicated there was potential for urban and small stream flooding for many of the populated areas and that the greatest chance for river flooding was for low elevation rivers on the south and west facing slopes of the Olympic Mountains, especially the Chehalis River and Skokomish River. On December 1, both WFOs began to issue Flood Watches for areas of their respective county warning areas with the greatest potential for flooding. By then, each office realized the third storm would be much stronger and would bring more rain than forecast the day before. The offices indicated that a total of 8-14 inches of rain could fall in the Olympic Mountains on Sunday December 2, and Monday December 3. They also
15

stated all rivers flowing off the Olympics could flood Monday with some reaching record flood stages.
WFOs Portland and Seattle issued a total of over 130 hydrologic outlooks, watches, and warnings to the public. WFO Seattle issued over 100 flood forecasts for this event, along with numerous Areal Flood Warning and Watches. A Flood Watch was in effect at 3:48 p.m. PST, Saturday, December 1, 2007, a full 30 hours before flash flooding was first reported in western Washington. Flood Warnings were issued at 9:08 p.m. PST, for certain rivers, including the Chehalis River at Centralia and near Grand Mound. The NWRFC issued a total of 231 flood forecasts including 28 forecasts for major flooding and 12 forecasts for record river levels (See Appendix B for definitions of flood severity levels).
After a review of the products issued from the WFOs, HPC, and the NWRFC, the team concluded that the underestimation of rainfall in the initial forecasts did not have significant negative impacts on precipitation and flooding products issued later. Forecasting record events is extremely difficult and the forecasts and outlooks adequately captured the threat of snowmelt, heavy rain, and flooding before the first storm came ashore on December 1.
Best Practice 3: NWRFC used the Graphical Forecast Editor (GFE) as an effective analysis tool to facilitate collaboration between the RFC and WFOs. The GFE is a graphical on-screen editor that allows forecasters to create detailed graphical depictions of coming weather, while at the same time creating a numerical database of weather information representing the same forecast. This was the first time any RFC utilized the GFE to prepare forecast precipitation, temperatures, and freezing levels for inclusion in RFC forecast models. These procedures worked well with no errors or problems.
When WFOs Portland and Seattle issued Flood Warnings for the rivers to reach
“major” levels, these warnings activated EAS/Tone Alerts for NOAA Weather Radio (NWR). Interviews indicated that people who routinely use NWR find this feature extremely beneficial since it heightens the awareness of the forecasts and conveys more urgency than warnings that do not activate tone alert. Best Practice 4: All major Flood Warnings issued for sites in Washington and Oregon activated EAS/Tone Alerts for NWR. This policy was established at local user requests. Local officials said this was very effective during the storms. Finding 2a: The RiverPro software is used to prepare Flood Warnings and Flood Statements. Inappropriate summary descriptions are created within the RiverPro software if products from the RFC neglect to include a crest forecast (highest water level at a measuring station during a flood or runoff event), or if the crest forecasts are only assigned to synoptic times. Fast responding rivers generate hydrograph curves that are incompatible with gross synoptic crest times. An inordinate amount of time is required by the forecasters adjusting the hydrograph so that correct summary verbiage is created in the narrative section of the forecast. It is important RFCs issue specific crest forecasts
16

with crest times based on the hydrograph curve, not the nearest convenient synoptic time. Finding 2b: During this event, Flood Statement products created using RiverPro software contained codes denoting if this was a continuation or an extension of an existing Flood Warning. As observations were received, RiverPro often incorrectly designated the statement as an extension of the warning when the statement was a continuation of the warning. Extra headlines were generated by the Valid Time Event Code (VTEC) system because of this. In these cases, the WFO forecaster had to manually edit the headlines of this product to correct the error. Recommendation 2: The NWS should correct the problems with the RiverPro software noted in Findings 2a and 2b. Finding 3: To issue the full suite of hydrologic products at the WFO, the staff must use: (1) Graphical Hazards Generator (GHG) software to prepare outlooks and watches; (2) RiverPro software for River Flood Warnings and Statements; and (3) Warning Generation software (Warngen) for Areal Flood Warnings. This requires the staff to be proficient in all three sets of software. The Service Hydrologist must be knowledgeable in all three programs, must maintain each set of files to run the program, and keep the staff trained. Operation of three sets of software to issue these products is inefficient and time consuming. Recommendation 3: The preparation of Outlooks, Flood Warnings, Flood Statements, and Areal Flood Warnings should be combined into a single software application in AWIPS II (a major revision of the AWIPS currently used by the NWS) in order to improve forecaster efficiency. (The NWS has formed an integrated work team which will look into combining the issuance of three hydrologic products into a single software application. The solution will likely not be operational until 2010, after AWIPS II implementation). Finding 4: WFOs Seattle and Portland prepared major flood forecasts using RiverPro and then formatted the product for transmission on NWR using software called NWRwaves. The WFOs manually edited the product in NWRwaves to activate the EAS/Tone Alert. This process is tedious, time consuming, and can be prone to errors. Recommendation 4: NWRwaves should be modified to automatically prepare a major flood warning and activate the EAS/Tone Alert for broadcast. This will take less time to disseminate and reduces the potential for errors. Finding 5: For Advanced Hydrometeorological Prediction Service (AHPS) sites with multiple transmission methods (satellite transmission or telephone telemetry) of observed data in hydrographs, the WFO must select the primary data source for display. When telephone lines were lost, some of these sites that used telephone telemetry as the primary data source showed missing data when the data was not missing and available to forecasters. Forecasters assumed this data was not available.
17

Recommendation 5: AHPS web services should be modified to recognize when a primary data source is missing for an extended period. When this occurs, a secondary data source should be used automatically, and a message should be sent to the WFO. This message should notify forecasters that the data is available via the secondary data source.
WFO Seattle staff used Warngen software to prepare Storm-Based Warnings for land areas, inland bays, and the Pacific Ocean near the coastline. Storm-Based Warnings are polygons drawn by forecasters to define the specific geographic area imminently threatened by the severe weather. These warnings usually do not encompass both marine areas and land areas. To have forecasts accurately represent the appropriate areas, land areas or water bodies, WFO Seattle forecasters drew complex polygons which mainly followed the coastline. When marine warnings were issued, the office drew polygons that approximated the coastline so that those marine warnings were only valid over water areas. This process made for more detailed warnings, but increased the amount of time necessary to prepare the warning.
Figure 5. Land/water interfaces as drawn in Warngen polygons for the WFO Seattle County Warning Area (CWA).
Finding 6: The Warngen software does not adequately draw the land/water interface for Storm-Based Warnings. When a polygon is drawn by a forecaster, Warngen automatically hatches the land/water interface, respective to the type of warning. Then, Warngen calculates those polygon points for the text warning. Figure 5 shows the crude rendition of the land/water interface in the Warngen polygon. Land areas are clipped and water areas are included. In areas where many bays and islands exist, forecasters could lose lead time trying to improve the areal outline. Additionally, when the polygon is plotted on another interface, the land and water interfaces often do not match.
18

Recommendation 6: The next generation of the Warngen software should draw more accurate polygons with regard to land/water interfaces and include more accurate and higher resolution maps.
4.2.1 Flash Flooding
WFOs Seattle and Portland, in addition to the NWRFC, do not consider areas west of the Cascade Divide to be susceptible to flash flooding. As a result, this is one of the few areas of the country that does not have gridded flash flood guidance (FFG). Without gridded FFG, use of the AWIPS Flash Flood Monitoring Program is severely handicapped since forecasters are unable to link antecedent basin conditions with storm precipitation in order to determine the flash flood risk. During this event, the rapid flooding west of the Cascade divide had characteristics of classical flash flooding. In fact, a Mason County, Washington emergency manager stated they were “…blindsided by the storm and by the speed with which the river rose.” Fact: Small streams that rise rapidly after heavy rainfall are characteristic of flash flooding. Because this type of flooding rarely occurs in areas west of the Cascade Divide, there is no flash flood guidance for those areas. Finding 7: During this event, major urban and small stream flooding occurred west of the Cascade divide, especially in Kings County and the Seattle Metro area. Small streams rose rapidly and local officials were surprised by the amount and intensity of the rainfall and how quickly the small streams rose. This flooding had characteristics of classical flash flooding. Recommendation 7: The NWRFC and WFOs Portland and Seattle should use data from this flood event to evaluate if FFG would have improved products and services; evaluate using the Site Specific Hydrologic Prediction System (SSHPS); and evaluate if using the Flash Flood Monitoring and Prediction software in AWIPS would have improved services.
4.2.2 Snow Water Equivalent Estimates
Good estimates of snow water equivalent (SWE) are required to make accurate flood forecasts in the mountains. The NWS’ National Operational Hydrologic Remote Sensing Center (NOHRSC) provides estimates of SWE from a combination of satellite and air observations. NWRFC uses a technique developed through a collaborative effort with other RFCs, other federal agencies, and private industry to estimate SWE.
The amount of water available in the snowpack for melting is highly variable in this area. Factors that affect the amount of snow during a storm and accumulating snowpack include elevation, temperature, wind direction, and the orientation of the mountain slope (windward or leeward side of a mountain). Only two sites in the Oregon Coastal Range and one site in the Olympic Mountains have SWE measurements. With
19

just three data collection sites along the coastal ranges, accurate estimates of SWE in the snow pack is not possible.
SWE played a key role during this event when the rains compounded by snow
melt exacerbated stream flow flooding. The lack of SWE gauging compels the NWRFC forecast system to be reliant on a formal snow update process to carry out SWE analysis. The NWRFC updated and validated the snow model states using the NWRFC snow update procedures immediately prior to the event. The NWRFC did not use the estimates from the NOHRSC due to differences in opinion on science and validation issues with the current snow water equivalent estimation technique of the NOHRSC. Finding 8: Good estimates of snow water equivalent (SWE) are required to make accurate flood forecasts in the mountains. SWE of the snowpack in the Coastal Range Mountains and Olympic Mountains was not estimated accurately during this event due to the lack of snow observations and different methods of estimating SWE used by the NOHRSC and the NWRFC. As a result, initial flood forecasts underestimated the amount and intensity of stream flow flooding. Recommendation 8a: The NWS should continue to work with its partners to enhance and expand the data collection networks in areas where there are limited snow observations. Recommendation 8b: The NWS should merge the best features of the various procedures for Snow Water Equivalent estimations and provide a single method for use across the entire organization. 4.3 Avalanches
Avalanches were the leading cause of fatalities (5) during the event. Two hikers and three snow boarders died in two separate incidents in the Cascade Mountains. Warnings and information about avalanches in this area are provided by the Northwest Weather and Avalanche Center (NWAC). The NWAC is a part of the U.S. Forest Service and a valuable partner to the NWS. The NWS provides office space, computer/internet access, weather data, and dissemination services to the NWAC.
The NWAC is staffed by three forecasters who provide detailed forecasts for 72 hours in the future. Forecasts are automatically sent to AWIPS, posted on the NWAC and NWS websites, highlighted on the warning page of the Seattle website, broadcast over NWR, distributed to local officials over the National Warning System, and highlighted in the Seattle Area Forecast Discussion (AFD). The NWAC operates a network of 44 data sites of hourly precipitation, snow depth, temperature, wind, and relative humidity, the most comprehensive data network of its kind in the United States. Most stations are automatically linked to the NWAC web site to provide the public with real-time weather and avalanche data.
20

Mark Moore, the NWAC Director said “Our warning (Avalanche Warning) that day likely saved many more lives.” The Avalanche Warning was issued at 9 a.m. PST, Sunday, December 2, for the Olympic and Cascade Mountains and Mount Hood, Oregon. The NWAC also issued an Avalanche Watch on November 30 and December 1. The avalanche fatalities are estimated to have occurred on December 2 as there were no witnesses. Three of the bodies were not recovered until June 2008. Avalanche forecasts are an integral part of the warning product suite in western Washington. Communicating updated forecasts to those already out in remote avalanche prone areas is challenging. Education and outreach are also an important part of the process.
Finding 9: Despite two Avalanche Watches and a timely Avalanche Warning issued by the NWAC, most of the fatalities in this event were caused by avalanches. Recommendation 9: The NWS should work closely with the NWAC to increase outreach and education on the dangers of avalanches and the methods of disseminating Avalanche Warnings to remote avalanche prone areas.
4.4 Communication and Outreach
On Friday morning November 30, WFOs Portland and Seattle each hosted web conferences to relay critical weather information to local and state emergency managers and representatives of local utility companies (Best practice from the May 4-10, 2003 Service Assessment). About 40 agencies participated on the call hosted by WFO Seattle, and almost 90 participated on the WFO Portland call. WFO Seattle posted the conference presentation on their website.
Best Practice 5: The web conference allowed the WFOs to disseminate information on the event to many more people than traditional conference calls. Since most agencies had several representatives including public works and the local law enforcement, it is estimated that over 500 people participated in these briefings. This information was used by decision makers in planning and preparation for the event.
According to interviews with emergency management in Grays Harbor County, Washington, they were expecting a more routine storm (wind gusts of 40-60 mph) despite forecasts, outlooks, and briefings from WFO Seattle which mentioned the possibility of a period of hurricane force wind gusts. As a result, the county emergency management did not make any extra preparations beyond their normal actions. Grays Harbor County emergency management did not attend the web conference call on November 30 and this could be a reason for their limited preparation. A representative of the Grays Harbor Public Utility District, however, was able to attend the web conference call.
Lewis County, Washington emergency management officials commented they did
not receive any NWS information indicating the potential for heavy rain and/or flooding prior to leaving their office on Friday, November 30, or during the 24-hour period from Saturday morning to Sunday morning. WFO Seattle issued timely and appropriate warnings, outlooks, and forecasts for Lewis County during this event and the office was
21

not aware of any dissemination problems which would prevent Lewis County from receiving these products.
Watch and warning products from local offices (such as WFO Seattle) are
disseminated via terrestrial and satellite methods to multiple locations. The primary system for disseminating forecast and warning products is the NOAA Weather Wire Service (NWWS), a system that performs both the collection and dissemination of data via satellite with terrestrial backup methods in place. NWS products are relayed to the Washington State Police facility in Tumwater where software automatically posts information pertaining to the state of Washington on A Central Computerized Enforcement Service System (ACCESS), a law enforcement telecommunications system. Most county law enforcement offices with ACCESS are the 911 centers, which receive NWS information via ACCESS and are responsible for relaying the information to the Emergency Management office (by hand, fax, phone, etc.). With this style of transmission, someone has to be physically present to receive the information relayed by the law enforcement office and if it is a weekend or holiday (most of the significant weather occurred over the weekend) the offices are not staffed. The Washington Emergency Management Division (EMD) does relay initial watches and warnings to the counties, but not updates or statements. Lewis County received the NWS watches and warnings issued on Friday November 30, but no personnel were available to receive the updates and statements and additional watches and warnings issued on Saturday December 1 through Sunday morning December 2.
WFO Seattle is working closely with the Washington State EMD to ensure that
NWS products are available to all counties in a dependable and timely manner through the state ACCESS system. Many local Emergency Managers have also utilized electronic notification systems created by the NWS. WFO Seattle is encouraging the Washington State EMD to install an automated system to relay NWS forecasts and warnings to their counties, eliminating the possibility of decision makers not receiving critical data and products. WFO Seattle is also working with the local emergency management agencies to ensure they can obtain needed products on the NWS websites, including AHPS, in addition to Washington’s ACCESS system.
The Portland and Seattle WFOs communicated in real time with Emergency Management and media partners during this event. They did not use the Internet-based chat system, IEMChat, which is popular among many NWS offices and is available to all NWS offices. IEMChat allows for real-time communication between NWS meteorologists, emergency managers, and the media via instant messaging. Based on a finding and recommendation from the Tornadoes in Southern Alabama and Georgia on March 1, 2007 service assessment report, the NWS has created a team to work on the implementation of IEMChat in all NWS offices.
22
5. Observational Data 5.1 Marine Data Buoys
The long duration and strength of the wind, combined with the heavy surf over the coastal waters, damaged or set adrift four data buoys. By the time these buoys stopped transmitting data; appropriate warnings had already been issued. Though the loss of data had no impact on the initial issuance of warnings, WFOs Seattle and Portland could no longer monitor the marine environment in real-time and update or cancel the warnings based on these observations.
Short-term (forecasts for 6 hours or less) products depend on observed real-time data. As mentioned earlier, emergency officials from Grays Harbor County complained of inadequate services from the NWS during this event that caused them to not make appropriate preparations for the event’s magnitude. With the data from the buoys not available, WFO Seattle could not provide updates to warnings or short-term products for their marine area of responsibility, which includes coastal areas of Grays Harbor County and this was one of their complaints.
With an additional data buoy out of service since November 24, 2007, there was a gap of over 300 miles in the coastal waters of the Pacific Northwest where no observations were available. This decrease in the observations available to forecasters created challenges in forecasting and warning for the coastal waters, especially in the months following this event.
As of June 2008, only two of these five buoys had been replaced. Replacing or repairing the three remaining buoys will take several months. Replacing and repairing damaged or destroyed buoys is a slow process as it usually takes several months for repair technicians to obtain time on a ship that can transport them to the buoy site. Since NOAA ships require a fee for ship time, the NDBC typically schedules repair trips with the U.S. Coast Guard (USCG). This can lengthen the process due to the priorities of the USCG changing and not allowing repair technicians to use their ships during the scheduled time. The repair process is further complicated by high seas, remote buoy locations, and limited spare buoys at the NDBC.
Fact: Four data buoys were damaged or set adrift during the event and an additional data buoy was out of service shortly before the event started.
Fact: The lack of data from these five data buoys created a 300 mile gap in observations over the coastal waters of the Pacific Northwest. NWS forecasters rely heavily on this real-time information in fulfilling their forecast and warning responsibilities.
Fact: Replacing and repairing damaged or destroyed buoys is a slow process, and replacing or repairing these buoys will take several months.
23

Fact: The decrease in real-time observational data over the Pacific Northwest coastal waters has created challenges in forecasting and warning for these areas, especially in the months following the event.
5.2 National Weather Service Radar
Both the Seattle and Portland WSR-88D radar sites are situated in areas that provide adequate coverage directly to the most densely populated areas. However, sampling capabilities of both radars are partially blocked by the terrain features of the Olympic Mountains and the Coastal Range Mountains. This “beam blockage” is most noticeable in the northwest quadrant of the WFO Portland radar (affects coverage along the northwest coast of Oregon and adjacent coastal waters) and the west central and southwest portions of the WFO Seattle radar (affects coverage along central and southwest coast of Washington and adjacent coastal waters).
Partial “beam blockage” can lead to underestimated amounts of rainfall and wind
speed since the radar is not receiving return information from the entire beam. There are some claims that the radar coverage is inadequate along the southern coast of Washington and northern coast of Oregon. Short-term forecasts and warnings can suffer as a result of these inaccurate estimates. Emergency Management officials of Grays Harbor County, Washington complained the NWS did not provide adequate warning and forecast information to their county for the event and pointed to the “beam blockage” issue with the Seattle WSR-88D radar as one reason for the perceived inadequate services. In their opinion, improved radar coverage along the southwest Washington coast would allow WFO Seattle to provide them the necessary updates. Grays Harbor County is in the area of WSR-88D coverage partially blocked by the mountains (Figure 6). WFO Seattle issued appropriate warnings and forecasts for Grays Harbor County with adequate lead time during the event. The long-term (3 days or longer) forecasts and outlooks from all NWS offices indicated the significance of this event 5-6 days in advance. Long-term forecasts and outlooks are not affected by local radar.
In the report by the National Research Council (NRC), Toward a New National Weather Service – Assessment of NEXRAD WSR-88D Coverage, published in 1995, the NRC panel identified areas of potential for degradation in radar detection coverage capability in what is now the current NWS WSR-88D radar network. The Washington and Oregon coasts were not identified as areas of potential for degradation in radar detection coverage capability. The potential problems with the radar coverage along the central and southwest coast of Washington and northwest coast of Oregon were detailed in a 1999 article in the American Meteorological Society’s publication, Bulletin of the American Meteorological Society. The article was written by Professors Kenneth J. Westrick, Clifford F. Mass, and Brian A. Colle of the University Of Washington Department Of Atmospheric Sciences. The article mentions a similar catastrophic flood event caused by very heavy, persistent rains and melting snow during February 1996, where radar estimates in the heaviest precipitation regions were less than 50 percent of the rain gauge values.
24

Figure 6. Coverage of the National Weather Service radars in Seattle, Washington (top center) and in Portland, Oregon (center) at 3-km, approximately 10,000 ft, above mean sea level. Solid areas indicate adequate coverage by the radar. Hatched areas indicate substantial blockage of the radar’s beam. Blank areas indicate no coverage. © Copyright [American Meteorological
1999]
ociety (AMS).
the southwest coast of Washington and northwest coast of regon were much higher.
e
most) counties
e identified.
S During this event, the WSR-88D Storm Total Precipitation figures from Portland and Seattle of the December 2007 event (Figure 7) show large sectors of limitedtotal precipitation amounts due to terrain blocking partially the radar’s beam. Observedprecipitation amounts along O Figure 7: Storm Total Precipitation December 1-3, 2007 from the WFO Seattle WSR-88D. The southwest sampling area of the radar has thgreatest blockage from terrain. Grays Harbor (northernmost) andPacific (southern
ar
25

Senators Patty Murray (WA), Maria Cantwell (WA), and Congressman Norman Dicks (6th District WA) have expressed their concern on this potential radar problem to the NWS. Senator Cantwell has publically advocated for weather radar to be installed along the southern Washington coast. The Appropriations Committee for the Omnibus Bill of Fiscal Year 2008 recognized the need for additional low level weather radar coverage along the coast of southern Washington and northern Oregon. The amended Omnibus Bill provides funding for NOAA and the NWS to work with the University of Massachusetts and the National Science Foundation, under the umbrella of the Collaborative Adapting Sensing of the Atmosphere (CASA) program, to determine the feasibility of integrating a number of small-scale Doppler radar technologies into future NWS observing programs. The CASA team visited WFO Seattle in June 2008 to discuss the radar coverage issue. The team is expected to complete their report in October 2008. The NWS is adding a connection to the Federal Aviation Administration's Air Route Surveillance Radar - Version 4 (ARSR-4) at Makah, Washington, located in the northern coast of Washington. WFO Seattle will be able to use data from this radar by the end of calendar year 2008. Fact: Both the WFO Seattle and WFO Portland radars are partially blocked by the terrain features of the Olympic Mountains and the Coastal Range Mountains. Fact: This partial “beam blockage” can lead to underestimated amounts of rainfall and wind speed since the radar is not receiving return information from the entire beam. Fact: Short-term forecasts and warnings can suffer as a result of these inaccurate estimates. Fact: Emergency Management officials of Grays Harbor County, Washington complained the NWS did not provide adequate warning and forecast information to their county for the event and pointed to the “beam blockage” issue with the Seattle WSR-88D radar as one reason for the perceived inadequate services. Fact: In the report by the National Research Council (NRC), Toward a New National Weather Service – Assessment of NEXRAD WSR-88D Coverage, published in 1995, the NRC panel identified areas of potential for degradation in radar detection coverage capability in what is now the current NWS WSR-88D radar network. The Washington and Oregon coasts were not identified as areas of potential for degradation in radar detection coverage capability. Fact: During this event, the WSR-88D radar Storm Total Precipitation figures from Portland and Seattle (Figure 7) show large sectors of limited total precipitation amounts due to the radar’s bean being blocked by high terrain.
26
Fact: Emergency management officials in Grays Harbor County, an Atmospheric Sciences professor at the University of Washington, and U.S. Senator Maria Cantwell (WA), have advocated for an installation of weather radar, which in their opinions, would provide better coverage for the coastal areas of southwest Washington and northwest Oregon. Fact: The Appropriations Committee for the Omnibus Bill of Fiscal Year 2008 recognized the need for additional low level weather radar coverage along the coast of southern Washington and northern Oregon. The amended Omnibus Bill provides funding for NOAA and the NWS to work with the University of Massachusetts and the National Science Foundation, under the umbrella of the Collaborative Adapting Sensing of the Atmosphere (CASA) program, to determine the feasibility of integrating a number of small-scale Doppler radar technologies into future NWS observing programs. Fact: The CASA team investigating the radar coverage issue is expected to complete their report in October 2008. Fact: The NWS is adding a connection to the Federal Aviation Administration's Air Route Surveillance Radar - Version 4 (ARSR-4) at Makah, Washington, located in the northern coast of Washington. WFO Seattle will be able to use data from this radar by the end of calendar year 2008.
6. Summary
Three powerful storms moved onshore of the Pacific Northwest between December 1 and 3, 2007, causing tremendous flooding and hurricane force wind gusts along the coast and inland. The resulting damage has been called one of the worst natural disasters in Washington’s history. Areas of northwest Oregon were significantly impacted as well. Overall, there were 11 fatalities associated with the event (5 from avalanches) and it is estimated the damage total exceeds $1 billion.
Evaluation of services and products during this event showed some technological challenges existed. There were also challenges with lost data from important buoys (set adrift or damaged by the storms), partial radar beam blockage of the WFO Seattle and WFO Portland radars due to high terrain, and dissemination due to extensive power outages. Despite these challenges, the overall NWS performance for its users and partners was excellent. Appropriate outlooks, wind warnings, and flood warnings were issued well in advance and disseminated in a timely manner, allowing for proper planning and decision making by partners and the public.
The majority of the NWS customers interviewed indicated the NWS did an excellent job with forecasting and warning the public for this event. NWS offices provided outlooks of the hazardous weather potential 5 to 6 days in advance of the storm allowing the public to take appropriate action. While the operational software used in issuing meteorological and hydrologic products and missing data buoys provided some challenges, the WFOs were nevertheless able to issue appropriate products in a timely
27

manner. The OPC accurately forecast the track and intensity of the third storm several days in advance. Forecasts of the rainfall amounts indicated the potential for widespread flooding but underestimated the amount of warming associated with the storm. This warming led to more rain than expected falling and the melting of snow already on the ground, which in turn led to more flooding than originally anticipated. The NWS provided excellent (as indicated by the users and partners interviewed) products and services pertaining to the damaging wind gusts.
28

Appendix A
Acronyms ACCESS A Central Computerized Enforcement Service System AFD Area Forecast Discussion AHPS Advanced Hydrologic Prediction Service ARSR-4 Federal Aviation Administration's Air Route Surveillance Radar Version 4 AWIPS Advanced Weather Interactive Processing System CASA Collaborative Adapting Sensing of the Atmosphere Program cfs Cubic Feet per Second CWA County Warning Area EAS Emergency Alert System EMD Emergency Management Division FFG Flash Flood Guidance GFE Graphical Forecast Editor GHG Graphical Hazards Generator GPRA Government Performance Results Act of 1993 HIC Hydrologist-In-Charge HPC Hydrometeorological Prediction Center HWO Hazardous Weather Outlook IEM Iowa Environmental Mesonet mb Millibar mph Miles per hour MSL Mean Sea Level NASA National Aeronautical and Space Administration NCEP National Centers for Environmental Prediction NOAA National Oceanic and Atmospheric Administration NOHRSC National Operational Hydrologic Remote Sensing Center NRC National Research Council NWAC Northwest Weather and Avalanche Center NWR NOAA Weather Radio All Hazards NWRFC Northwest River Forecast Center NWRwaves Formatter for NOAA Weather Radio products NWS National Weather Service NWWS NOAA Weather Wire Service OCWWS Office of Climate, Water and Weather Services OPC Ocean Prediction Center PST Pacific Standard Time Quikscat Quick Scatterometer RFC River Forecast Center RiverPro Software used to issue NWS Flood products SOO Science and Operations Officer SPC Storm Prediction Center SSHPS Site Specific Hydrological Prediction System SWE Snow Water Equivalent
29
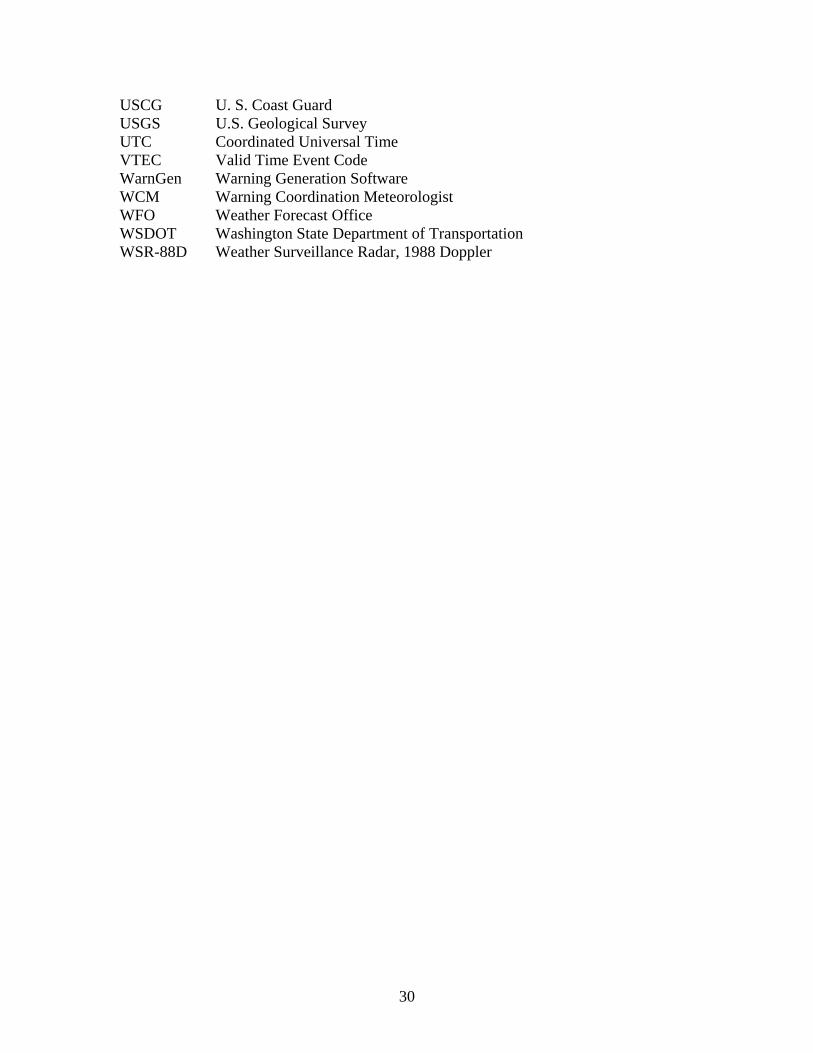
USCG U. S. Coast Guard USGS U.S. Geological Survey UTC Coordinated Universal Time VTEC Valid Time Event Code WarnGen Warning Generation Software WCM Warning Coordination Meteorologist WFO Weather Forecast Office WSDOT Washington State Department of Transportation WSR-88D Weather Surveillance Radar, 1988 Doppler
30

Appendix B
Definitions
Fact, Finding, Recommendation, and Best Practice Fact - A statement that describes something important learned from the assessment for which no action is necessary. Facts are not numbered, but often lead to recommendations. Finding - A statement that describes something important learned from the assessment for which an action may be necessary. Findings are numbered in ascending order and are associated with a specific recommendation or action. Recommendation - A specific course of action based on an associated finding, which should improve NWS operations and services. Not all recommendations may be achievable, but they are important to document. If the affected office(s) and the Office of Climate, Water, and Weather Services (OCWWS) determine a recommendation will improve NWS operations and/or services, and it is achievable, the recommendation will likely become an action. Recommendations should be clear, specific, and measurable.
Best Practice - An activity or procedure that has produced outstanding results during a particular situation which could be used to improve effectiveness and/or efficiency throughout the organization in similar situations. No action is required.
Flood Severity Levels
The NWS categorizes flood severity using the following definitions: Minor Flooding – Minimal or no property damage, but possibly some public threat or inconvenience. Moderate Flooding – Some inundation of structures and roads near the stream. Some evacuations of people and/or transfer of property to higher elevations are necessary. Major Flooding – Extensive inundation of structures and roads with significant evacuations of people and/or transfer of property to higher elevations. Record Flooding – Flooding which equals or exceeds the highest stage or discharge at a given site during the period of record keeping.
31
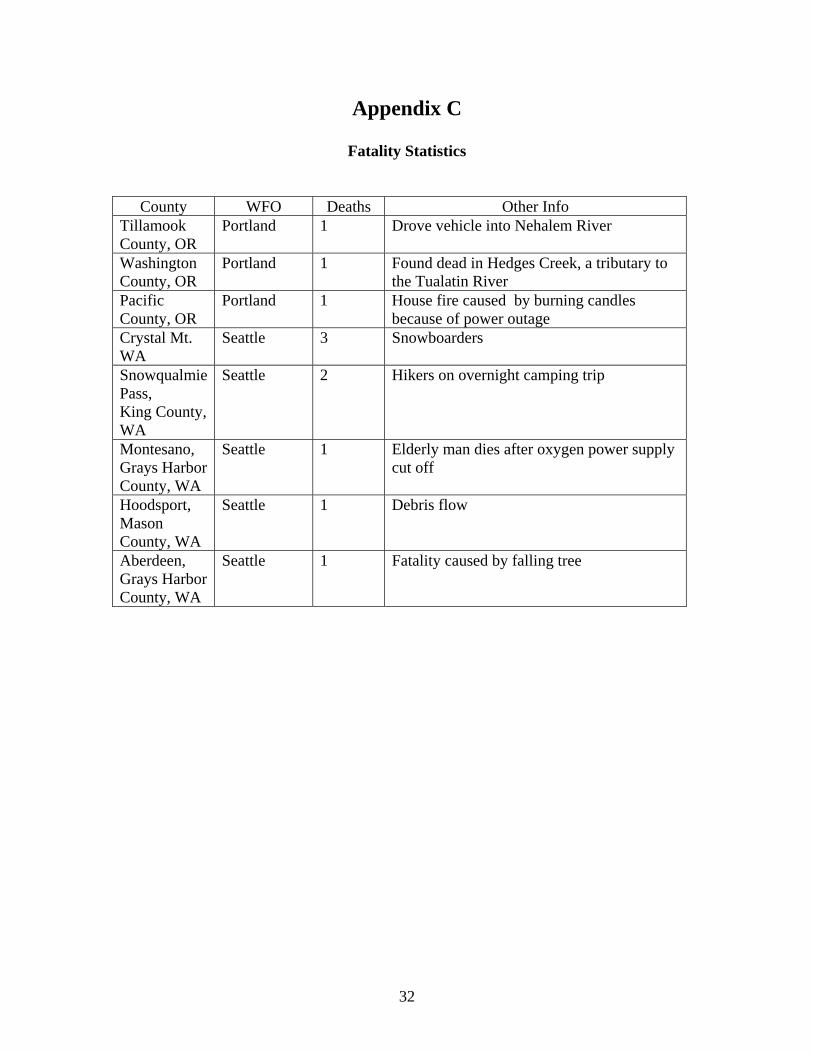
Appendix C
Fatality Statistics
County WFO Deaths Other Info Tillamook County, OR
Portland 1 Drove vehicle into Nehalem River
Washington County, OR
Portland 1 Found dead in Hedges Creek, a tributary to the Tualatin River
Pacific County, OR
Portland 1 House fire caused by burning candles because of power outage
Crystal Mt. WA
Seattle 3 Snowboarders
Snowqualmie Pass, King County, WA
Seattle 2 Hikers on overnight camping trip
Montesano, Grays Harbor County, WA
Seattle 1 Elderly man dies after oxygen power supply cut off
Hoodsport, Mason County, WA
Seattle 1 Debris flow
Aberdeen, Grays Harbor County, WA
Seattle 1 Fatality caused by falling tree
32

Appendix D
Critical River Stages of Forecast Locations Portland Service Area Flood Major Flood Flood of Event Peak
Forecast Point NWSID Stage(ft) Stage (ft) Record (ft) Stage (ft) Time of Peak
(UTC) Marys River near Philomath PHIO3 20.0 20.7 21.10 21.02 12/4 05:00 Luckiamute River near Suver SUVO3 27.0 32 34.52 29.02 12/4 17:00 South Yamhill at McMinnville MCMO3 50.0 59.0 59.33 55.95 12/4 23:45 Tualatin River near Dilley DLLO3 17.5 19.5 19.34 19.03 12/4 05:15 Tualatin River at Farmington FRMO3 32.0 34.0 37.20 32.66 12/6 02:30 Johnson Creek at Sycamore SYCO3 11.0 14.0 15.30 11.92 12/3 18:30 Clackamas River at Estacada ESTO3 20.0 25.0 30.36 20.38 12/4 08:00 Siuslaw River near Mapleton MPLO3 18.0 28.0 30.21 21.47 12/4 05:30 Alsea River near Tidewater TIDO3 18.0 23.0 29.50 21.81 12/4 05:30 Siletz River at Siletz SILO3 16.0 25.0 31.60 19.22 12/3 22:30 Nestucca River near Beaver BEAO3 18.0 21.0 23.40 18.86 12/3 20:00 Wilson River near Tillamook TLMO3 12.0 19.0 22.84 20.45 12/3 19:30 Nehalem River near Foss FSSO3 14.0 24.0 29.56 24.44 12/3 19:30 Willapa River near Willapa WILW1 21.0 24.0 27.28 26.65 12/4 00:45 Naselle River near Naselle NASW1 15.5 17.0 19.26 14.74 12/3 16:30 Cowlitz River at Kelso KELW1 21.5 26.5 29.50 21.6 12/4 00:15 Trask River at Tillamook TRA03 16.5 22.0 23.20 20.80 12/3 18:00 Grays River near Rosberg GRRW1 12.0 16.0 N/A 16.50 12/3 20:30 Seattle Service Area Chehalis River near Centralia CENW1 65.0 72.0 74.31 74.78 12/4 11:30 Chehalis River Grand Mound CGMW1 14.0 17.0 19.98 20.23 12/4 18:00 Chehalis River near Porter CRPW1 21.0 25.0 25.22 26.05 12/5 08:00 Satsop River near Satsop SATW1 34.0 38.0 38.90 36.63 12/4 03:30 Puyallup River near Orting ORTW1 4,500 cfs 16,000 cfs 18,300 cfs 5,525 cfs 12/4 02:15 Nisqually River near National NISW1 10.0 11.9 12.83 11.29 12/4 01:15 Deschutes River near Rainier DSRW1 11.0 15.0 17.01 13.64 12/4 04:00 Skokomish River near Potlatch SRPW1 16.0 16.8 17.75 18.12 12/3 22:30 Elwha River at McDonald Bridge ELWW1 20.0 23.0 24.20 24.65 12/3 23:30 Skykomish River near Gold Bar GLBW1 15.0 19.0 23.94 16.82 12/4 02:00 Snoqualmie River near Snoqualmie SQUW1 20,000 cfs 41,000 cfs 78,800 cfs 23,050 cfs 12/4 04:30 Tolt River near Carnation TOLW1 4,500 cfs 7,000 cfs 17,400 cfs 6,370 cfs 12/3 21:45 Snoqualmie River near Carnation CRNW1 54.0 58.0 61.17 56.99 12/4 18:00 Snohomish River near Monroe MROW1 15.0 17.0 25.30 16.32 12/4 15:30 Snohomish River at Snohomish SNAW1 25.0 29.0 33.50 27.87 12/4 22:00 S.F. Stillaguamish near Granite Falls GFLW1 14.0 18.0 22.82 14.97 12/4 02:00 Stillaguamish near Arlington ARLW1 14.0 19.0 21.06 15.18 12/4 05:39 Skagit River near Concrete CONW1 28.0 32.5 42.21 30.56 12/4 17:75 Bogachiel River near La Push BOGW1 37.0 41.0 42.61 41.32 12/4 01:45 Issaquah Creek ISSW1 10.5 11.5 13.50 11.12 12/3 22:20
33