service delivery and budget implementation …€¦ · creating a platform for growth, human...
TRANSCRIPT
SERVICE DELIVERY
AND BUDGET
IMPLEMENTATION
PLAN
2013 / 2014

Table of Contents
No. Description
Page
1. Mayor’s Approval 1
2. Introduction
2.1 Legislative Framework
2.2 Components of the SDBIP
2.3 Strategic Direction and Planning Cycle
2.4 SDBIP Cycle
2
3
3
6
3. The Budget Process
3.1 Background to the Budget Process
3.2 Capital Budget Process
3.3 Operating Budget Process
3.4 Public Participation Process
3.5 Monitoring of the Implementation of the SDBIP
3.6 General
7
8
8
8
9
9
4. The Budget for 2013 / 2014
4.1 The Capital Budget
4.2 The Operating Budget
4.3 Budget Breakdown in terms of the IDP
10
11
12
5. Monthly Projections of Revenue to be Collected for each
Source
15
6. Monthly Projections of Expenditure and Revenue for each Vote 16
7. Quarterly Projections of Service Delivery Targets and
Performance Indicators for each Vote
19
8. Detailed Capital Budget Broken Down by Ward over 3 Years 59
8.1 Areas Comprising Wards 77

2
���� ������������
����� ������� �� ���� �������� �� ��� ������� ���� �������� ��������� �� � �� ��������������������������������������������������������������������� !"#!$��������������%����� ����������&� ��������������� �� � ����������� �� �� �������� ��������� �� � �� �������������������������������������'���������������(���������)�������(����������*��&���()(*���*���+�%�,-���� "�%�������������������� ������ �������������������������������������������������������������� �
����.� ����������������������%��������������������������������������������������������������� ���� ��������� .� ���%� ��� �� ��� �/������� �� ���� �.0������� �� ���� ����&� ���'�������.��� �������� ����� ����� .�� ���������� � ��� ���� ��������� ����%� ��� ����� �� ����������� �����������������������'��������� ������������������������������������ ����1��������������������������������������%�
�
������������ !"#!$����������������������������������������������������/��������������2����.� ���� �� � ������� ������� � ��� ���� ����������� �� .� ���� ��� �������� ���� ������������������������.������2���3���������� �����������������������&�.������������������������������ �� ������� ����������� ��������� ��� ������ ����������� �� � ����� �� ����� ������������������������������ �'���������������4������������������������� !"#!$�
�������������%����
���� ������ ���� ���� ���� �/�������&� �������� �� � ���� ���������� ��� ������ �������������������������.������������������������������������������ ����������������%���
�
�
�� ��� ��������������������������������!�������()(*� ������������������� ������ ������������� �.����������������������������������������������,"�!�����������������������������������������3� ����������
��������� �����������.� ������ ������������� �����5���������0�����������������������51���������������������.���������� &�.�������6��� ������������������������ ����������/��� ������.�&������.��������� ����������������� �������������� ���������������'������6��� ������������������������������.��������.� &��� ������ �������������������������.�����������������������������������,$�!����%���
���� ()(*� ��'����� ����� �������������� ������� �� �������� ��������� �� � �� ������������������� ����� �������� �� �� ��������� ��������� ����������� ����� ��� ������ �����.� ������� ����������������� ���� �.����������������������������������������������� ������ ������ ��������� ������������� ����� ��������%� ��� ����� �� �������� ,"� �!��������� �� ����()(*&���������������.��������� �.������(������������������������������7� ������������������������.� ���%���
�
�
�
�
3
����� ���������������������� ��8�� (����������0���������9����������.��2������� ����������������
8�� (����������0���������:/��� �������� �9���������������;����8�� <��������� ���0������� �� ����������������� ������� �� � ����������� �� ������� ���
�����;����8�� ������� �2��������� ����������������.��=�� ������"�>����
�
����� � !�����"� ��#�����������$���������%��������������������������& ���� '(�
�������������������������� ����������.� ���� ����������������������������2���?��.���������
����� �������������������������%�����2�������������������������������������������������������������������������������������%���������������������.�������2������������� ���� ���� ��� ���������� .��� ����� �� ����� ��� �� ��������� ������������ ����� ���� ������� .�� �� ���� ���� �������� ��� �������������� ������ ������ ���%� )����������&� �������������� �� ��� ��� �������� �������� �� � ����� ���� ���� .�� �������� � ������������������������������������ ��� ��������%���
��
������ !�����"� ��#�����������)*�����������$���������������+����& ����� ,- .(�
�������������������0������������������� ��/��� ������������������������������������ ��� ���������������� �������� ���� ���������� ���� ������ ����.� ���%� ���� ������ ��� �������������� ���������������0���������������� ���� ������ ������0�������.�������%�=�������������� .� ���� ���0������� ������� ������&� ��� �� ����� ��� ���� ��� �������� �� ��/��� ������ ���� ����� ��� �� ��� ��� ����� ������� ��������� �������� �� .� ���� ���0��������������������%�
��
����/� 0������"� ��#����������� ���������������"� 1���������� ����������� ���������� ����
� �����+����& ���� 2-'.(�
����������������� ���������� ��'��������1���������������.���������������.0��������������������������� ����������������� ��������� �������������������%��������������������� ������� ����� �����%� �������� �������� ������� ������� ��� ���� ������ �� � ��� �� � ��
������� .����� ����� � � ��� ���� ���������� �� � ����� �� ���� � ������ �� .������� ���.����������%����������������������� �.��+���������������3�()(*�2��������+�%�!"������������4��������������� ������������������� �������%�
�
�����3� ��������������������������1�����4�����& ����'2-5,(�
������������ ��������� �������������� ���0���� ����������� ���0���� ���������� �� �
���������� ������������������ ���� ���������������� %�*� ��������������������0�����������������������������.������2������?���.���%������ ������������ ������ �� ��� ���������� ���������� ��� ������ �������� �� � ��������������������#���������������� �������%�
�
�
��/�� ����������������������� ���������"�����
*�������������.�����������@���������������������)��������� �@��)�&� ���&������&������������(������������������(����� �*������9���������� ��������������.�����
���������������������������������������������� �������.��%�

4
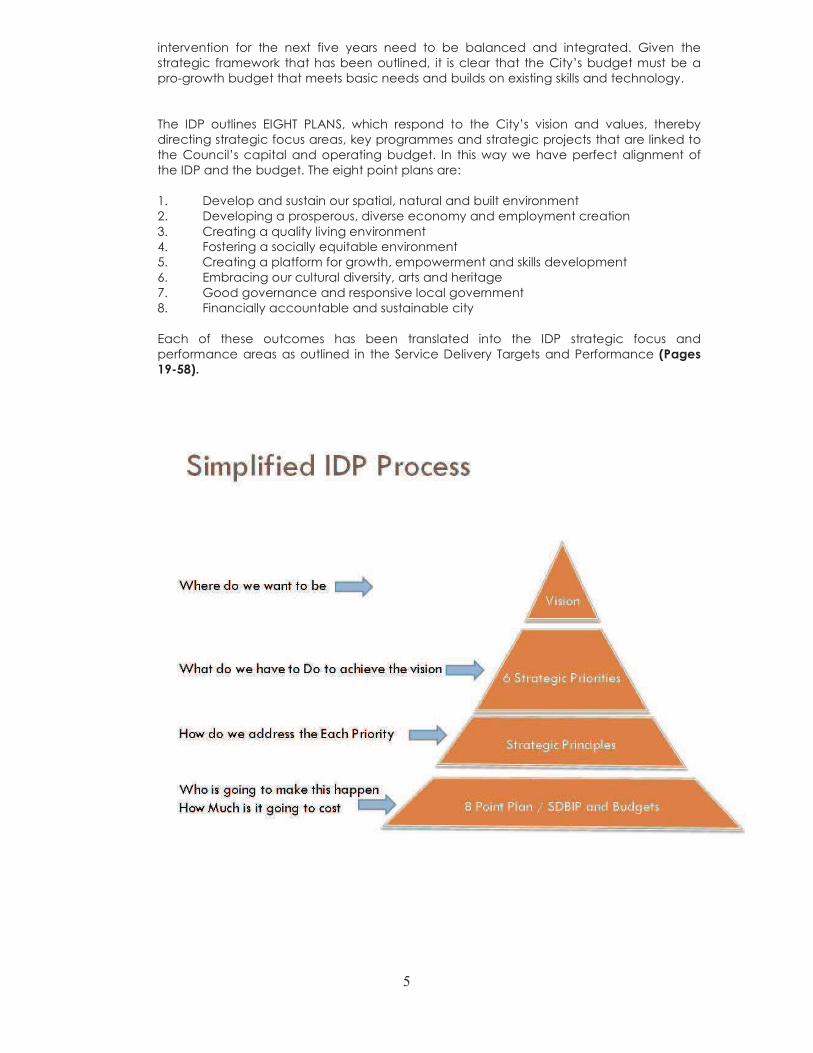
����� ()(*� �������� �������� ���� �������� �� ���� ������ ��� ����� �� ��� �� ��� �� ��������
�'������������������������������������������������������������������������������ ������������� ��� ��������������������������� ���� %����������������������������3�������� !"#!$� �� ����� ���������2���3�@��)&� ���������� ������� ����� !"#!$���������� ����������������� ������5�
����
�)$+��)��)��+)$4�67���8�9)1��! �)7161�:7��$6!);:$<��
�
�
�
�
�
�
����
��������@��)�������������������������������������������������������(�����������������������/�������������%� ��������������������������� " ������&�����@��)����������������������������������� ��� �� ������/� ������������ ���������� ������ ���� ����� ����� ��� � ��� .��
� ��� �.������������������ ������������5��!%�� @��������������������� ���������������%�� �������������.����������� ��������"%�� A��������������������$%�� @���������������������� ������ �����������,%�� ������� � ��������������������� �.��A�;�#�*����-%�� :/������������������.������������������������ �����B%�� C�������.��� ��������������������7% ���������&����������&������ ������������������������������ ������ �� ���� @��)� �� ��� �������� �� .������� .������� �������� .���� ��� &���������������������������� � ������������������������ ��������������.����������
�����%� ��� ��� ����� ��� �������� ���� � � " � �����&� ����� ������ ��������� ���� ����� ��
�1����
�=/=�+���������"�
������������ ����������
�� �
�� �$������ �������
�= /> 3�
�����
�= /> 3��= '> ,�
/�4�����
���� �
6�����"�
30 Years
'�4�����
6�����"��
5
������������� ��� ���� ��/�� ���� ����� ��� � ��� .�� .������ � �� � ��������� %� D����� ������������� ��������� ��������.����������� &� ��� �������� ����� ����2���3�.� ��������.�������1�������.� ��������������.������� ��� �.��� �����/������������� �����������%������� ���� �������� :�DA�� �@*+�&� ������ ����� � ��� ���� 2���3� ������ �� � �����&� �����.�� ��������������������������&����������������� �������������0������������������ ��������2������3� ���������� �����������.� ���%� ��� ����������������������� ���������������������� �����.� ���%�������������������������5���!%�� ���������� �����������������&����������� �.������������������%�� ���������������������&� ���������������� ���������������������
"%�� 2����������'��������������������������$%�� )�������������������'����.���������������,%�� 2���������������������������&��������������� ������ �����������-%�� :�.�������������������� �������&������� �����������B%�� D�� �������������� ���������������������������7% )�������������������.����� �������.��������
�:���� �� ����� �������� ��� .���� �������� � ����� ���� ���� ��������� ���� �� �������������������������� � ��� ��������������������� ��������� ������������ & ����� 2-'.(���
�
�
�
��
�
�
�
�
�
�

6
���� ������������������������ ����������������������������������������.�����5��
• @���������������• ������� ����������������������• )������������ �• )���������������.������� �����.���������
�
�
��3�� ���� ��"�����
������������������������������������������&�������������������������5�
�
�
�������?�
���������������������������������������� ������� &����.����.�� ��������������������
����%� ������ ������ � ������� �%�%� �������� ��� ���&� ����.������ �� ��������� �� �����������������&���������������� � ��������������%�
�
�������������?�
���������������������������������� ��� ��.�'����������������������� ����0����������� ��/�� ,� ����� .�� � ��� �����&� ����������� �� � ��������� ���&� �������� ����3�������������� �������������������� � ��������������� ����%�
��1�%����?�
����������� �� ��.�� ������ ���� ���� ������ �.� ����.�����2������%�2���������������� �������������� �� � ������� ��� �� ���� ������� ���� ������ �� ���� ��������.� ���� ���������� � ������ �����&� ����������� �� � ��������� ������ ��� ������� ���� ���� ���� ��� � ��� ������������������� �������%�
��6������?�
����� (����� �������� ���� ������ ��� ������ ����� �7� ��� ����� ���� � ������� �� ����(�����������3�.� ���%�
�
� %�������?�
������ ���� ����������� ����.������ �����.���� ����2������3���.���%�
�
�
��������������@�!�������������$��������?�
���������0������������������ ��� �'�����������������������������%��(� 1����������������� ���������������������������������&����� �������������� � &��������������.���
�� �� ���� �.��2������%��
�

7
�������������� �� ����� ������������
���
�
/�� 1�������� ����������
/� ��� ��������������������� ����������� �������
�����.� ��������������������������������������������������������������� ���������� ������ ��� � ����������� �� � ��������.�����%� ���� ������ �������� ���� �������� �� ������� ��������� ����� ���� 2���� ���� � ������ ��� �� ��� �������� ����������� ����������%� ����
.� �������������.�������2����������������� ����������� ������ �������������� ��� �������.� ������������%�
�������������������!,�������()(*&���������������������/������������������������� � ��������*��&��������/��� �������������������������������� �.� ������ ������������������������ ������� ����������� � ��� ���� ������� ����� ��� ��� ������� � .� ���%� ���� ()(*�������.�� ������� ����� ���� 2������� ���� ��� ����� ��������� ����� �������� ��� �������.� ������������������������.����������������������������������%�*���������.� ��������������� ����������������������� � �������� ��� ����.� ��������� ��������� ���������������� ��/��� ����������������� ��� ������� ������������������������������%��
�����������(�����������3��� ���#� ��������� ������������������ ������9������������ ���
����� !"#!$�������������������� ���������� ������������� �������������*������ !�������� E������ ����� ��� ������ ���� )������������� � ����9�����F%� ���� ������.�������� � �.��� � ��������� ��� ���� ���� �� � .� ���� ������������ �����%� ���� ����� ���� �� ����������.��������������� ������������.�������������������� �������������������� �����.� ��������� ���.�������.������ �.� ���%��
�����+����������������()(*�2��������+�3�--��� �-B������ � ���� ������������������ ������������������������.� ���� ������������������������������ !"#!$�(� ���������9��������� �:/��� ����������������(�9:)�%�

8
�
/����� ������������� �������
����������������������������������� ������������������������� ������ ��� �������������� �� ���� ��������� � ������������ ����� �����%� ���� �������� .� ���� �� ����� ����� ������
�������� � ��� ������ ���� ������� ��������� ���0���� ��� ���� ���%� ���� ���� ����� �� ���� 2��������� ���� ��� ���� (�:)� ����������� � !"#!$� ������� � ��� ����� �.��������� ��� ���� ����������%�*������������������������ � ������G���.����� �+����.���� !��������������������.� ��������������4� &�.������ ��� ������� ����2������3����%�
����������������������������������� ��������������������� �����������������.� ���5�
�• ���� � !"#!$� �������� .� ���� �� ������� � ��� ���� �������� ����� (�:)� ��� .����
�� �����.���• *������ �������� ���������� ��������'��������������������������• *���� �� ������ �� � (��������� �������� )��������� (� ������ �� � �����
���� ��������'��������������������������
• �� ��������.�������� ��������• *����������� �������.�������� �
��/�/��� :�������������� ���������
��������������������������������������������.� ��������� ����G���.���� !���������.� ������������������ ���������� �� ���������������������� ����.� ������������� ������� ���� � !"#!$� .� ���� ������� � ��� ���� �������� (�9:)� ����� � �� � ��� ���.������������ �������������������������.� ������������ ���������������.���� ������������ ������ � .��%� ���������� .� ���� ����������� �.��� � �/��� ������ ���������������� ��� ���� ����������.�������� ����G���%��� ������������������������ ������
�������������%�*�� ������������&�.� �����������&�.� �������������� � ��������������������G����������� ���������������������� ���� %�����������������������.����� ��������� ������� �������������� %��
��������� )�.������ � !"� ���.�������� ����� ��� � ��� ���� .� ���� ����� ���� ������� 2������
A�� ��� � ������ ����������������� ��������� ����.� ������ � �� ������ ���� ������ ����� ��������������������������������������� ���������.�����������.� ��������������� ��������������.��������%��)����������&�����2����(����������� ���H�C�D:��@:IDG�@*3����)�.������������������������������������ �����������%�������������������������������������������� ������� ����� ������������������&�������������� ����������������������������%�
����
/�3��� %���� ������������� �������
������ ��.������� ���������.� ������ ���������� �������������.��2�����������7�(������ !"���� ������ �.���/���������.����������� ����.� ���� ����� ��� ��� ������������4��%�;������
��.���� �������������� �� � ���������� �������������������� ����� ��� ��� � ��� ���������������������� �� � �.������ ���� ��� � ���������&� ��� ���&� ����������������4�����&�������4� �.������� �������������� �����������%�
�
��

9
��� ����� �� ���� (��������� ������ *��� �� � ��� ���0�������� ����� ���� (��������� )�������(����������*��&���.�������������������.� ������������ ������ ���J��!��*������ !"���������� �����������������������%�2��������������� ����� ������� ������� ����.� ����.������������������ ������������������������������.� ���%���������������������� �����������.� ���������������� �.��2�����������K�(���� !"%�
��
�/�'�� !������������������������������������������� �
�
�� �������������������.0������#��������������������������������.��������� �������������&�
� '��������&��� 1������� ��������.�������������������()(*%���� *��������������������'�������������������� ��������()(*��������5��
�
• (�������.� ����������������������B!��• <�������������������������,���• (� 1�����.� ������ ����������������������������B���• *����������������������!�!��
���
�/�,�� 9�������
�
�
������ !"#!$������� �� ������������������ ��� �.�� ��������������(�����������%�=����� ���������� �������� �������� ����� ����������� �� ����� �� ������� ��� ������ ��� � .�� +���������������&� ��� ���������������������� ���������� ������������������.������� ���������������� �������� �� � ���� '������� �� ����������� �������� � �������� ��� �� �������� � .��%�:���������� ���������� �� ������ ������� �������� � ������ ���� � K#! � ��������� ����%������������������.����������������������� ��� ���� ����&� ���� ������� ��� �������������������� �����%� ����� �� ���� �������� ��� ���� ��.� .�� � ����� ����� �� ����������� ��� ��� ������� ��&� ������� ���������� ���0���� ����� ����� �� ��1������� � �� ��������� ��� ���� G������������� �������� � �� � �� ��� ���� ����������� (����������
�����%�:�� ������������������������������������������.������� � ����������������� � ������� ���� ������ ����� ����� .���� .����� ��� ������ ������ ��� �� ��� ����������&��� ���������������������������������������� ������.����� %���
������
�����

10
���������������� ���������� �������������� �������������� �������������� ����������������������������������������� �����������������������������������������������2������ ������������ !"#!$����������� �������������������� �.��2�����������K�(���� !"5
2013 / 2014 BUDGET
Operating
R 28 056.3m
Capital
R 5432.1m
���������������� ����������������������������������������������������
����
TOTAL BUDGET R 33 488.4M

11
���������������� ��������������������������������������������������������
����
����
WHERE THE MONEY COMES FROM
(Rm)
R 129.1
R 14215.9
R 5007.9
R5543.1
R 1822.8
R 444.3
R 393.7
R 366.9
R 132.6
0 2000 4000 6000 8000 10000 12000 14000 16000
Service Charges
Assessment Rates
Grants & Subsidies
Fuel Levy
Other Income
Rental of Facilities & Equipment
Interest on Investment
Fines, Licences & Permits
Penalties & Collection Charges
TOTAL OPERATING BUDGET R 28 056.3m����
����
����
����
����
HOW THE MONEY WILL BE USED
R 17104.2
R 5600.9
R 2252.8
R 1323.3
R 933.7
R 460.7
R 380.7
0 2000 4000 6000 8000 10000 12000 14000 16000 18000
Human Settlements & Infrastructure
Finance
Community and Emergency Services
Office of the City Manager
Economic Development & Planning
Governance
Corporate & Human Resources
TOTAL OPERATING BUDGET R 28 056.3m
����
IDP SCHEDULE
AND GRAPHS
Operating Budget *
Budget Year Budget Year +1 Budget Year +2 Budget Year Budget Year +1 Budget Year +2
2013/14 2014/15 2015/16 2013/14 2014/15 2015/16
STRATEGIC OBJECTIVE GOAL Budget Budget Budget Budget Budget Budget
R'000 R'000 R'000 R'000 R'000 R'000
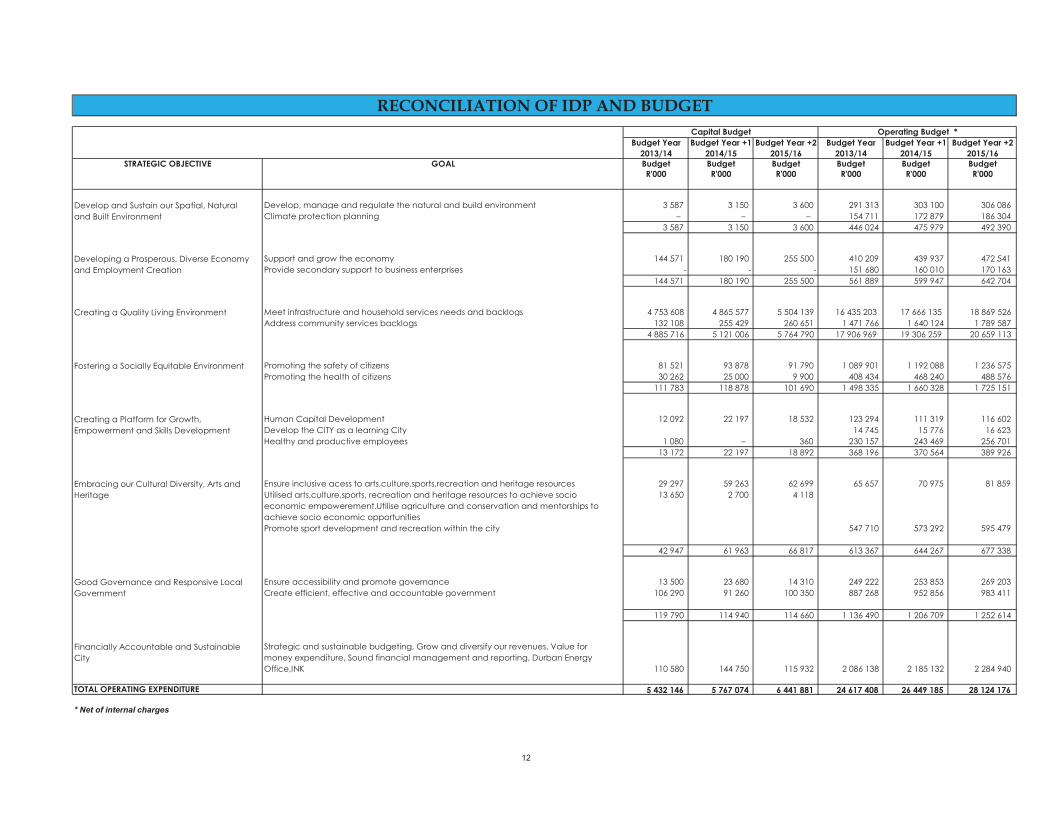
Develop and Sustain our Spatial, Natural Develop, manage and regulate the natural and build environment 3 587 3 150 3 600 291 313 303 100 306 086
and Built Environment Climate protection planning – – – 154 711 172 879 186 304
3 587 3 150 3 600 446 024 475 979 492 390
Developing a Prosperous, Diverse Economy Support and grow the economy 144 571 180 190 255 500 410 209 439 937 472 541
and Employment Creation Provide secondary support to business enterprises - - - 151 680 160 010 170 163
144 571 180 190 255 500 561 889 599 947 642 704
Creating a Quality Living Environment Meet infrastructure and household services needs and backlogs 4 753 608 4 865 577 5 504 139 16 435 203 17 666 135 18 869 526
Address community services backlogs 132 108 255 429 260 651 1 471 766 1 640 124 1 789 587
4 885 716 5 121 006 5 764 790 17 906 969 19 306 259 20 659 113
Fostering a Socially Equitable Environment Promoting the safety of citizens 81 521 93 878 91 790 1 089 901 1 192 088 1 236 575
Promoting the health of citizens 30 262 25 000 9 900 408 434 468 240 488 576
111 783 118 878 101 690 1 498 335 1 660 328 1 725 151
Creating a Platform for Growth, Human Capital Development 12 092 22 197 18 532 123 294 111 319 116 602
Empowerment and Skills Development Develop the CITY as a learning City 14 745 15 776 16 623
Healthy and productive employees 1 080 – 360 230 157 243 469 256 701
13 172 22 197 18 892 368 196 370 564 389 926
Embracing our Cultural Diversity, Arts and Ensure inclusive acess to arts,culture,sports,recreation and heritage resources 29 297 59 263 62 699 65 657 70 975 81 859
Heritage Utilised arts,culture,sports, recreation and heritage resources to achieve socio 13 650 2 700 4 118
economic empowerement.Utilise agriculture and conservation and mentorships to
achieve socio economic opportunities
Promote sport development and recreation within the city 547 710 573 292 595 479
42 947 61 963 66 817 613 367 644 267 677 338
Good Governance and Responsive Local Ensure accessibility and promote governance 13 500 23 680 14 310 249 222 253 853 269 203
Government Create efficient, effective and accountable government 106 290 91 260 100 350 887 268 952 856 983 411
119 790 114 940 114 660 1 136 490 1 206 709 1 252 614
Financially Accountable and Sustainable Strategic and sustainable budgeting, Grow and diversify our revenues, Value for
City money expenditure, Sound financial management and reporting, Durban Energy
Office,INK 110 580 144 750 115 932 2 086 138 2 185 132 2 284 940
TOTAL OPERATING EXPENDITURE 5 432 146 5 767 074 6 441 881 24 617 408 26 449 185 28 124 176
* Net of internal charges
Capital Budget
RECONCILIATION OF IDP AND BUDGET
12
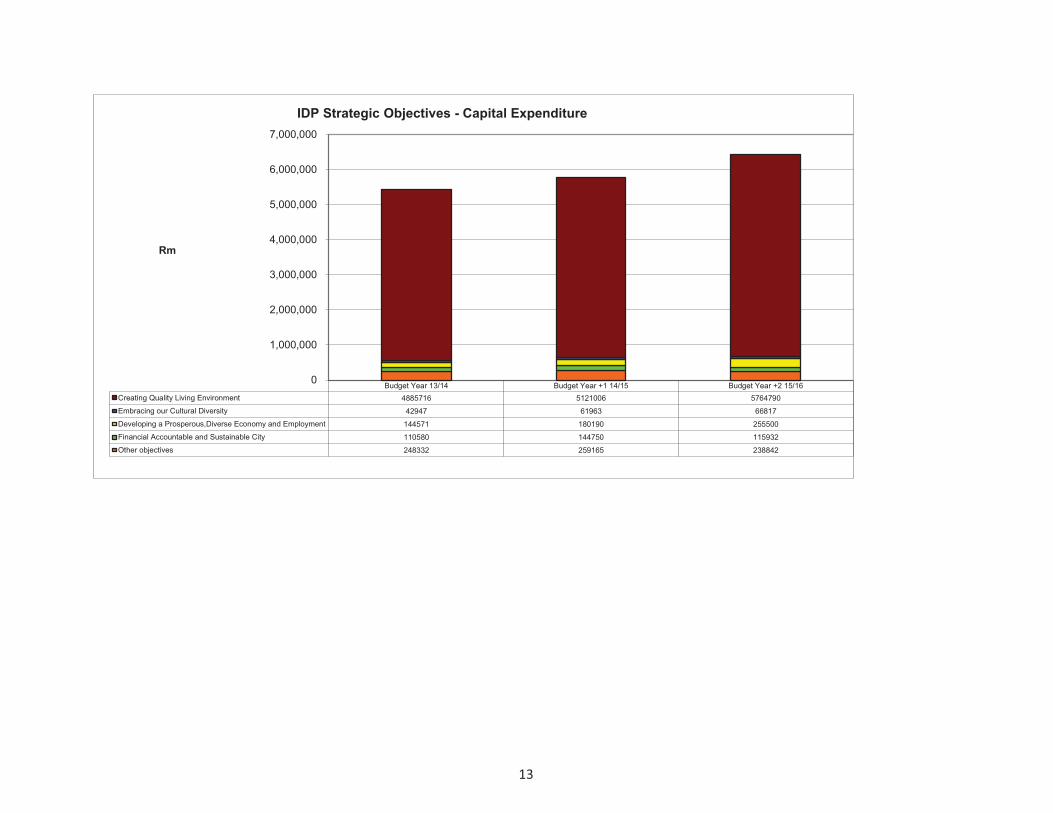
Budget Year 13/14 Budget Year +1 14/15 Budget Year +2 15/16
Creating Quality Living Environment 4885716 5121006 5764790
Embracing our Cultural Diversity 42947 61963 66817
Developing a Prosperous,Diverse Economy and Employment 144571 180190 255500
Financial Accountable and Sustainable City 110580 144750 115932
Other objectives 248332 259165 238842
0
1,000,000
2,000,000
3,000,000
4,000,000
5,000,000
6,000,000
7,000,000
Rm
IDP Strategic Objectives - Capital Expenditure
13

Budget Year 13/14 Budget Year +1 14/15 Budget Year +2 15/16
Creating Quality Living Environment 17906969 19306259 20659113
Financial Accountable and Sustainable City 2086138 2185132 2284940
Developing a Prosperous,Diverse Economy and Employment 920555 984467 1049882
Fostering a Socially Equitable Environment 1498335 1660328 1725151
Good Governance and Responsive Local Government 1136490 1206709 1252614
Develop and Sustain our Spatial,Natural and Bulit Environment 446024 475979 492390
Creating a Platform for Growth, Empowerment and Skills Dev 368196 370564 389926
Embracing our Cultural Diversity,art and heritage 613367 644267 677338
0
5,000,000
10,000,000
15,000,000
20,000,000
25,000,000
30,000,000
Rm
IDP Strategic Objectives - Operating Expenditure
14

BUDGETS 2013 / 2014
(SCHEDULES)

REVENUE SOURCE JULY 13 AUGUST 13 SEPTEMBER 13 OCTOBER 13 NOVEMBER 13 DECEMBER 13 JANUARY 14 FEBRUARY 14 MARCH 14 APRIL 14 MAY 14 JUNE 14 TOTAL
R'000 R'000 R'000 R'000 R'000 R'000 R'000 R'000 R'000 R'000 R'000 R'000 R'000
Property Rates 296,827 408,367 356,370 734,295 419,153 416,003 344,401 340,600 211,261 350,423 370,273 759,934 5 007 906
Penalties Imposed and Collection Charges on Rates 12,598 11,733 12,628 (2,840) 2,757 7,571 9,725 13,009 17,587 19,084 5,215 20,016 129 085
Service Charges - Electricity 1,108,920 757,397 814,516 833,606 826,959 778,498 801,707 806,464 897,885 844,309 944,647 597,596 10 012 505
Service Charges - Water 178,524 213,896 216,239 209,693 201,030 204,800 245,226 257,194 248,571 243,673 249,577 355,826 2 824 247
Service Charges - Sanitation 53,736 59,067 61,165 58,620 52,996 58,367 64,119 76,131 61,086 45,712 65,044 75,139 731 182
Service Charges - Refuse 38,408 38,035 38,887 39,493 39,416 40,203 38,020 38,963 37,730 41,669 37,147 33,172 461 142
Service Charges - Other 11,811 15,913 11,035 13,350 19,925 16,820 16,631 25,865 13,411 12,592 12,982 16,589 186 924
Rental of Facilities and Equipment 42,017 24,373 32,444 32,384 42,336 35,125 24,087 38,088 42,164 22,800 41,590 16,284 393 693
Interest Earned - External Investments 22,446 21,576 30,426 21,175 21,177 32,838 22,079 23,318 25,994 23,848 17,510 104,481 366 870
Interest Earned - Outstanding Debtors 9,717 10,077 10,618 9,518 8,978 10,098 14,980 7,216 7,000 7,206 9,916 (1,464) 103 859
Fines 4,279 9,305 10,878 6,592 5,969 22,821 10,000 12,031 8,253 6,684 7,319 4,031 108 163
Licences and Permits 171 7,040 3,413 4,087 3,723 2,989 3,278 3,784 2,180 1,988 2,055 (10,303) 24 406
Agency Services 665 800 730 678 1,108 1,060 1,047 800 909 1,010 1,200 2,051 12 058
Transfers Recognised - Operational 792,262 25,330 63,499 34,341 (26,102) 581,356 85,117 135,685 (27,750) 175,541 99,093 421,265 2 359 637
Other Revenue 16,128 607,394 81,084 69,108 28,627 528,978 347,120 19,154 90,508 126,967 61,844 140,054 2 116 966
Gain on Disposal of Property, Plant and Equipment – 245 10 116 12,066 (1,858) 1,013 (354) 818 53 914 21,208 34 231
TOTAL DIRECT OPERATING INCOME 2 588 507 2 210 549 1 743 944 2 064 217 1 660 118 2 735 669 2 028 550 1 797 950 1 637 607 1 923 558 1 926 326 2 555 879 24 872 874
MONTHLY PROJECTIONS BY REVENUE SOURCE
15

OUPUT UNIT OPEX CAPEX REVENUE OPEX CAPEX REVENUE OPEX CAPEX REVENUE
R'000 R'000 R'000 R'000 R'000 R'000 R'000 R'000 R'000
Vote 1 - Office of the City Manager 51,765 6,521 4,233 62,387 7,190 8,715 52,726 12,205 6,525
Vote 2 - Finance 381,932 4,313 1,162,889 106,327 4,755 1,017,109 172,367 8,072 483,081
Vote 3 - Governance 23,569 527 224 32,515 581 209 28,752 986 129
Vote 4 - Corporate and Human Resources 18,509 397 – 18,661 437 (5,428) 20,661 742 –
Vote 5 - Economic Development & Planning 41,964 6,127 3,499 15,664 6,756 5,541 34,344 11,468 3,422
Vote 6 - Community and Emergency Services 168,571 8,459 7,312 180,800 9,328 18,186 186,065 15,836 4,437
Vote 7 - Human Settlements and Infrastructure 223,568 134,174 435,689 352,107 147,936 188,076 572,045 251,148 234,416
Vote 8 - Electricity 879,532 22,183 1,131,178 857,393 24,501 779,157 581,604 41,595 844,534
Vote 9 - Water 198,322 29,033 185,217 220,683 32,010 229,391 294,297 54,343 236,393
Vote 10 - Formal Housing 6,023 – 2,651 8,538 – 13,250 7,123 – 5,427
Vote 11 - Markets 2,212 119 5,599 3,108 132 6,380 3,386 223 5,499
Vote 12 - Airport 293 – 234 (448) – 843 971 – 550
– – –
1 996 258 211 853 2 938 725 1 857 736 233 626 2 261 428 1 954 343 396 618 1 824 414
OUPUT UNIT OPEX CAPEX REVENUE OPEX CAPEX REVENUE OPEX CAPEX REVENUE
R'000 R'000 R'000 R'000 R'000 R'000 R'000 R'000 R'000
Vote 1 - Office of the City Manager 46,754 9,698 3,747 361,350 10,701 2,267 382,637 12,189 2,282
Vote 2 - Finance 137,443 6,414 469,911 182,602 7,077 490,899 125,569 8,061 1,179,256
Vote 3 - Governance 29,826 783 1,214 33,619 864 960 37,132 984 126
Vote 4 - Corporate and Human Resources 19,720 590 – 30,607 651 – 19,640 741 –
Vote 5 - Economic Development & Planning 61,408 9,112 12,148 58,763 10,054 4,715 61,278 11,452 7,562
Vote 6 - Community and Emergency Services 198,744 12,582 12,190 304,487 13,883 11,443 198,012 15,814 109,318
Vote 7 - Human Settlements and Infrastructure 499,597 199,542 404,632 475,754 220,184 179,503 273,797 250,804 496,014
Vote 8 - Electricity 574,276 33,048 853,143 599,972 36,467 845,548 548,364 41,538 799,667
Vote 9 - Water 241,946 43,177 396,550 268,054 47,644 227,242 366,060 54,269 233,319
Vote 10 - Formal Housing 7,665 – 11,041 7,201 – 6,185 7,114 – 3,663
Vote 11 - Markets 3,190 177 188 4,025 196 3,097 3,096 223 12,952
Vote 12 - Airport 286 – 355 455 – 769 796 – 340
– – –
1 820 855 315 123 2 165 119 2 326 888 347 721 1 772 629 2 023 494 396 075 2 844 498
* Net of internal charges
MONTHLY PROJECTIONS OF REVENUE AND EXPENDITURE BY VOTE *
JULY 13 AUGUST 13 SEPTEMBER 13
OCTOBER 13 NOVEMBER 13 DECEMBER 13
16

OUPUT UNIT OPEX CAPEX REVENUE OPEX CAPEX REVENUE OPEX CAPEX REVENUE
R'000 R'000 R'000 R'000 R'000 R'000 R'000 R'000 R'000
Vote 1 - Office of the City Manager 303,183 6,688 2,030 64,823 14,195 115,969 66,200 10,851 3,944
Vote 2 - Finance 138,896 4,423 714,251 240,694 9,388 401,222 181,603 7,177 446,606
Vote 3 - Governance 35,363 540 458 29,613 1,146 409 27,930 876 372
Vote 4 - Corporate and Human Resources 21,441 407 9,180 20,230 863 50 25,181 660 1,560
Vote 5 - Economic Development & Planning 27,267 6,284 5,500 29,043 13,338 6,046 36,493 10,196 5,378
Vote 6 - Community and Emergency Services 217,892 8,677 13,280 211,385 18,417 15,376 193,633 14,080 11,561
Vote 7 - Human Settlements and Infrastructure 295,641 137,615 206,992 413,707 292,088 262,960 308,593 223,281 327,546
Vote 8 - Electricity 565,327 22,792 791,120 583,155 48,291 849,913 664,556 36,915 803,564
Vote 9 - Water 237,328 29,777 371,727 329,116 63,202 254,409 227,628 48,314 256,562
Vote 10 - Formal Housing 5,997 – 6,812 6,869 – 4,170 318,167 – 3,671
Vote 11 - Markets 4,754 122 7,429 1,655 260 13,477 3,799 199 5,326
Vote 12 - Airport 532 – 678 239 – 571 443 – 487
– – –
1 853 620 217 325 2 129 457 1 930 530 461 188 1 924 570 2 054 228 352 549 1 866 576
OUPUT UNIT OPEX CAPEX REVENUE OPEX CAPEX REVENUE OPEX CAPEX REVENUE
R'000 R'000 R'000 R'000 R'000 R'000 R'000 R'000 R'000
Vote 1 - Office of the City Manager 69,060 12,205 4,030 72,858 16,720 3,487 ( 210 399) (19,686) 8 261
Vote 2 - Finance 139,360 8,072 591,316 204,691 11,058 708,244 150 466 31,770 915 971
Vote 3 - Governance 79,137 986 380 30,739 1,350 329 72 508 3,877 1 039
Vote 4 - Corporate and Human Resources 76,269 742 1,594 27,714 1,017 1,379 82 078 2,923 20 864
Vote 5 - Economic Development & Planning 138,070 11,468 5,628 40,164 15,710 4,060 325 837 115,132 51 434
Vote 6 - Community and Emergency Services 201,999 15,836 11,815 213,107 21,693 10,221 ( 21 865) 60,049 84 047
Vote 7 - Human Settlements and Infrastructure 320,864 251,148 455,910 339,730 344,038 239,697 118 450 988,422 1 035 446
Vote 8 - Electricity 800,810 41,522 821,228 994,800 56,880 749,027 1 450 960 163,066 1 114 364
Vote 9 - Water 237,463 54,343 262,202 250,521 74,443 226,838 567 087 213,875 708 797
Vote 10 - Formal Housing 7,239 – 3,751 7,637 – 3,245 ( 18 475) – 269 060
Vote 11 - Markets 3,963 223 5,443 4,181 306 4,709 19 113 880 2 273
Vote 12 - Airport 463 – 497 488 – 430 2 366 – 1 872
– – – – –
2 074 699 396 545 2 163 796 2 186 630 543 215 1 951 667 2 538 128 1 560 308 4 213 428
* Net of internal charges
MONTHLY PROJECTIONS OF REVENUE AND EXPENDITURE BY VOTE *
JANUARY 14 FEBRUARY 14 MARCH 14
APRIL 14 MAY 14 JUNE 14
17
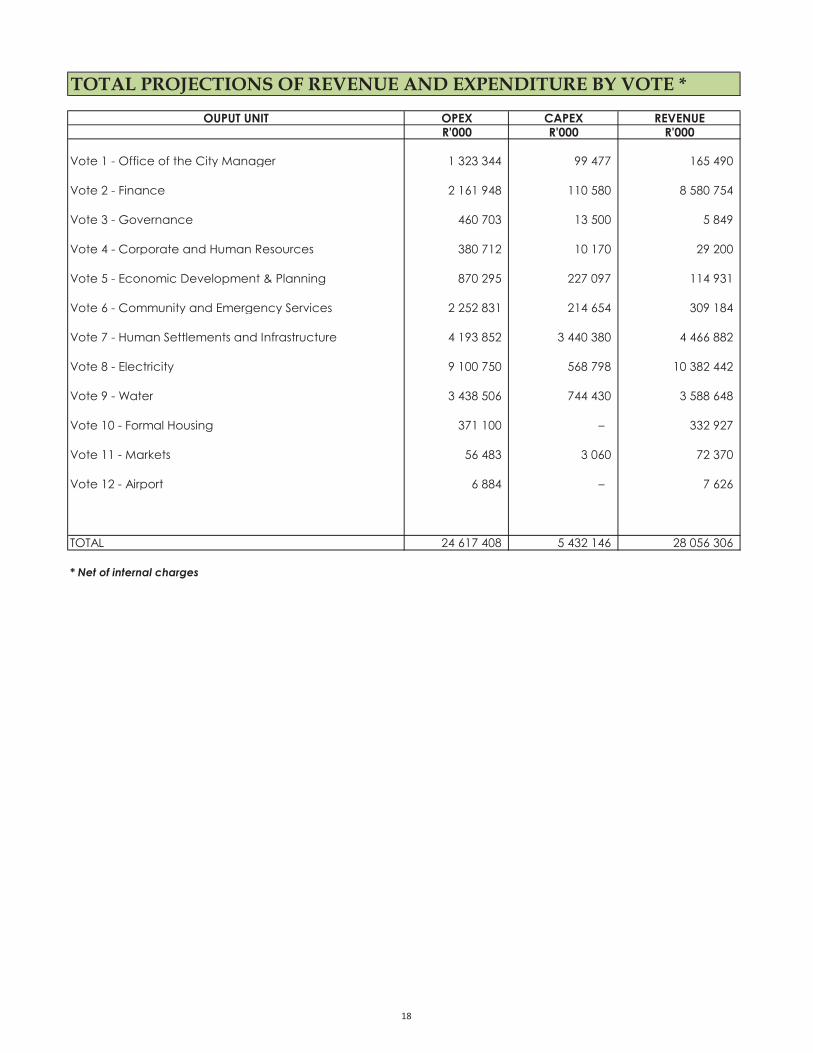
OUPUT UNIT OPEX CAPEX REVENUE
R'000 R'000 R'000
Vote 1 - Office of the City Manager 1 323 344 99 477 165 490
Vote 2 - Finance 2 161 948 110 580 8 580 754
Vote 3 - Governance 460 703 13 500 5 849
Vote 4 - Corporate and Human Resources 380 712 10 170 29 200
Vote 5 - Economic Development & Planning 870 295 227 097 114 931
Vote 6 - Community and Emergency Services 2 252 831 214 654 309 184
Vote 7 - Human Settlements and Infrastructure 4 193 852 3 440 380 4 466 882
Vote 8 - Electricity 9 100 750 568 798 10 382 442
Vote 9 - Water 3 438 506 744 430 3 588 648
Vote 10 - Formal Housing 371 100 – 332 927
Vote 11 - Markets 56 483 3 060 72 370
Vote 12 - Airport 6 884 – 7 626
TOTAL 24 617 408 5 432 146 28 056 306
* Net of internal charges
TOTAL PROJECTIONS OF REVENUE AND EXPENDITURE BY VOTE *
18

SERVICE DELIVERY
TARGETS AND
PERFORMANCE

Plan 1: Develop and Sustain our Spatial, Natural and Built Environment
Plan Owner: Soobs Moonsammy
National KPA Strategic Focus
Area
Programme Programme Driver Project Project Manager Sub Project Sub Project
Manager
Unit Of
Measure
Annual Target Q1 Target -
Sept 2013
Q2 Target -
Dec 2013
Q3 Target -
Mar 2014
Q4 Target -
June 2014
Rand value of capital
budget allocation (at
project level)
R 3 587 000
Rand value of operating
budget allocation (at
project level)
R 446 024 000
5 1.1. Develop and
Implement a sustainable
and integrated spatial
planning system
Lihle Phewa 1.1.1. Spatial Development
Framework Review
Helene Epstein % SDF 13/14 annual review
completed and submitted to
Council
25% 50% 75% 100% R 0.00 R 0
1.1.2. Review of Spatial
Development Plans x4 (North,
Central, South, West)
Helene Epstein % Review of SDPs complete and
submitted to Council
25% 50% 75% 100% R 0.00 R 0
1.1.3. Preparation of Local
Area Plans [a) Northern Rural
Corridor LAP, b) Mpumalanga
LAP & c) South Illovo]
Lihle Phewa 1.1.3.1 Preparation of Local
Area Plans - Northern Rural
Corridor LAP
Thandiswa
Mfazwe
% a) Draft Northern Rural
Corridor Conceptual
Framework complete
25% 50% 75% 100% R 0.00 R 850,000
1.1.3.2 Preparation of Local
Area Plans - Mpumalanga LAP
Thandiswa
Mfazwe
% b) Draft Mpumalanga
Conceptual Framework
complete
25% 50% 75% 100% R 0.00
1.1.3.3 Preparation of Local
Area Plans - South Illovo]
Zakhi Mkhize % c) Draft LAP complete 25% 50% 75% 100% R 0.00
1.1.4. Preparation of
Functional Area Plans (Ottawa
R102 FAP & Land Use Scheme)
Lekha Allopi % Draft Ottawa R102 FAP &
Land Use Framework
complete
25% 50% 75% 100% R 0.00 R 750,000
1.1.5. Initiation of Special
Projects [a) Rural
Development Strategy, b)
Southern Public Transport
Corridor densification
Framework & c) kwaMashu
A/Duffs Rd Thembalihle Urban
Regeneration Plan Phase 2]
Lihle Phewa 1.1.5.1 Initiation of Special
Projects - Rural Development
Strategy
Thandiswa
Mfazwe
% a) Rural Development
Situational Analysis complete
25% 50% 75% 100% R 0.00 R 500,000
1.1.5.2 Initiation of Special
Projects - Southern Public
Transport Corridor
densification Framework
Zakhi Mkhize % b) Draft densification
framework & Action plan
complete
25% 50% 75% 100% R 0.00 R 1,842,000
1.1.5.3 Initiation of Special
Projects - kwaMashu A/Duffs
Rd Thembalihle Urban
Regeneration Plan Phase 2]
Thandiswa
Mfazwe
% c) Draft Urban Regeneration
Plan complete
25% 50% 75% 100% R 0.00
1.1.6. Preparation of Land Use
Management Framework &
Scheme (Cliffdale)
Lekha Allopi % Cliffdale draft Land Use
Framework & Scheme
complete
25% 50% 75% 100% R 0.00 R 750,000
1.1.7. Development
Assessment (External
applications : PDA 90 days,
Ordinance 60 days,
Relaxations 30 days))
Lekha Allopi % 70% of all PDA & Ordinance
applications received are
dealt within stipulated
turnaround time.
100% 100% 100% 100% R 0.00 R 0
19

Plan 1: Develop and Sustain our Spatial, Natural and Built Environment
Plan Owner: Soobs Moonsammy
National KPA Strategic Focus
Area
Programme Programme Driver Project Project Manager Sub Project Sub Project
Manager
Unit Of
Measure
Annual Target Q1 Target -
Sept 2013
Q2 Target -
Dec 2013
Q3 Target -
Mar 2014
Q4 Target -
June 2014
Rand value of capital
budget allocation (at
project level)
R 3 587 000
Rand value of operating
budget allocation (at
project level)
R 446 024 000
1.1.8. Development
Assessment (eThekwini
Housing Planning Approvals :
Pre-screening 60days, Less
Formal Township
Establishment Act (LEFTEA)
applications 180days, Planning
& Development Act
applications 120days)
Sbu Ndebele % 70% of all applications
received are dealt within
stipulated turnaround time.
100% 100% 100% 100% R 0.00 R 0
1.1.9 Policy Development :
Investigate Planning
hindrances to Econ Growth &
Job Creation in eThekwini)
Nuthan Maharaj % Investigative Report &
Recommendations complete
25% 50% 75% 100% R 0.00 R 300,000
1.2 Ensure the long term
sustainability of the
natural resource base
Debra Roberts R 29,468,011
1.2.1 D'MOSS (Durban
Metropolitan Open Space
System) and Finescale
Systematic Conservation
Planning (SCP)
Richard Boon 1.2.1.1 Publish and maintain
D'MOSS and the finescale
Systematic Conservation Plan.
Cameron
McLean
% 1. Map and update
vegetation and land class
layers. 2. Update process
layers. 3. Create an
ecological infrastructure
layer. 4. Update cost surface
layer. 5. Update species data-
sets. 6. Produce SCP output
map. 7. Complete
biodiversity sector plan for
review. 8. Integrate SCP and
D'MOSS and initiate Council
approval processes. 9.
D'MOSS incorporated into the
hierarchy of municipal spatial
plans as required.
25 50 75 100
1.2.2 Large scale programmes
for implementation of
biodiversity and climate
protection, and for green job
creation
Errol Douwes 1.2.2.1 Working for
Ecosystems
Errol Douwes % Implement Working for
Ecosystems
25 50 75 100
Errol Douwes 1.2.2.2 Working on Fire Errol Douwes % Implement Working on Fire 25 50 75 100
Errol Douwes 1.2.2.3 Community
Reforestation Programmes
Errol Douwes % Implement Community
Reforestation Programmes
25 50 75 100 R 13,529,070
1.2.3 Targeted
implementation tools for
sustaining and enhancing
biodiversity
Errol Douwes 1.2.3.1 Invasive Alien Strategy
& Implementation
Errol Douwes % 1) Update, and implement
relevant items, from the IAS
Strategy and Action Plan. 2)
Continue to roll out training
for Invasive Alien Plant
control within the eThekwini
Municipality. 3) Survey IAPs
on managed areas.
25 50 75 100
Richard Boon 1.2.3.2 Biodiversity
stewardship
Lyle Ground % 1. Complete draft
implementation framework
including incentives, site
selection, programme and
budget. 2. Implement and
monitor the stewardship plan
in two pilot areas
25 50 75 100
20

Plan 1: Develop and Sustain our Spatial, Natural and Built Environment
Plan Owner: Soobs Moonsammy
National KPA Strategic Focus
Area
Programme Programme Driver Project Project Manager Sub Project Sub Project
Manager
Unit Of
Measure
Annual Target Q1 Target -
Sept 2013
Q2 Target -
Dec 2013
Q3 Target -
Mar 2014
Q4 Target -
June 2014
Rand value of capital
budget allocation (at
project level)
R 3 587 000
Rand value of operating
budget allocation (at
project level)
R 446 024 000
Richard Boon 1.2.3.3 Natural reserve
proclamations
Natasha
Govender
1. Finalise proclamation of
Roosefontein NR 2. Complete
proclamation of Paradise
Valley NR subject to EKZNW
timelines. 3. Finalise reserve
boundaries, zonation, survey,
management plans, and legal
documents for remaining
eight nature reserves. 4.
Initiate proclamation process
for municipal-owned portions
of Krantzkloof NR
25 50 75 100
Richard Boon 1.2.3.4 Giba Special Rating
Area
Lyle Ground % 1. Complete construction of
staff quarters in the
precinct. 2. Complete land
acquisition in the precinct.
3. Continue management
activities. 4. Meet municipal
requirements for SRAs. 5.
Apply for extension of
municipal co-funding.
25 50 75 100
Richard Boon 1.2.3.5 Environmental town
planning initiatives
Gerald Clarke % Continue with court review
process, which has moved to
the Supreme Court of Appeal
and is likely to advance to
the Constitutional Court, and
make input as and when
required.
25 50 75 100
1.2.4 Land Acquisition and
rezoning to secure critical
environmental assets
Richard Boon 1.2.4.1 Acquire land
identified for possible
acquisition
Natasha
Govender
% Select sites for acquisition
and obtain authority and
purchase land. 100% of
budget spent by the end of
the financial year.
25 50 75 100 R 3,587,000
1.2.5 Regular state of
biodiversity reporting
Richard Boon 1.2.5.1 Annual State of
Biodiversity report produced
Natasha
Govender
% Production of annual State of
Biodiversity report.
Submission of data to the
Cities Biodiversity Index.
40 100 100 100
1.2.6 Communicating with
biodiversity stakeholders
Richard Boon 1.2.6.1 Biodiversity Forum Natasha
Govender
% Ensure Biodiversity Forum
continues to meet regularly.
Host two Parks/EPCPD
meetings annually.
25 50 75 100
1.2.7 Biodiversity impact
assessment of development
applications
Chumisa Thengwa % Scorecard target met in all
categories of applications.
25 50 75 100
1.2.8 Ensure compliance of
municipal infrastructure
projects with the
Environmental Impact
Assessment (EIA) legislation.
Chumisa Thengwa % Ongoing compliance of
municipal projects with EIA
legislation.
25 50 75 100
1.2.9 Establish an effective
compliance and enforcement
function to protect key
biodiversity and ecosystem
goods and services.
Chumisa Thengwa 1.2.9.1 Ensure complaints are
handled within specified time
frames (7 days)
Chumisa
Thengwa
% 1)All complaints addressed
within specified time frames.
25 50 75 100
Chumisa Thengwa 1.2.9.2 Take required
enforcement action
Chumisa
Thengwa
% 2)Enforcement action taken
as required
25 50 75 100
21

Plan 1: Develop and Sustain our Spatial, Natural and Built Environment
Plan Owner: Soobs Moonsammy
National KPA Strategic Focus
Area
Programme Programme Driver Project Project Manager Sub Project Sub Project
Manager
Unit Of
Measure
Annual Target Q1 Target -
Sept 2013
Q2 Target -
Dec 2013
Q3 Target -
Mar 2014
Q4 Target -
June 2014
Rand value of capital
budget allocation (at
project level)
R 3 587 000
Rand value of operating
budget allocation (at
project level)
R 446 024 000
1.2.10 Influence city planning
to address environmental
sustainability
Joanne Boulle 1.2.10.1 Safe Operating Space
Study
Joanne
Boulle
% (1) Develop conceptual
framework for study (2)
Collect relevant data (3)
Begin implementation of the
study
25 50 75 100
1.2.10.2 Facilitate the
coordination of environmental
sectors in the municipality
Joanne
Boulle
% (1) To engage with the Head:
Sustainable City Initiatives
post in a relevant way and
(2) to continue to convene
the environmental sectors
around key issues
25 50 75 100
1.2.11 Investigate and test
environmental sustainability
approaches, policies and tools
Joanne Boulle 1.2.11.1 uMhlangane Climate
Change Adaptation Project
Joanne
Boulle
% (1) To refine the conceptual
framework for the
uMhlangane project; (2) To
maintain the climate change
partnership with Bremen;
(3)To coordinate BMZ funding
for the departments involved
in the project and (4) to
develop and maximise the
social learning value of the
project in relevant ways
25 50 75 100
1.2.12 Build capacity and
support for environmental
sustainability issues through
communication and education
Joanne Boulle 1.2.12.1 'The Campaign' Joanne
Boulle
% (1) To refine and develop an
implementation plan for 'The
Campaign' and (2) To
implement at least 2
campaign 'events'
25 50 75 100
Joanne Boulle 1.2.12.2 Broad
communication, education
and public awareness
activities
Joanne
Boulle
% (1) Continue to implement
EPCPD newsletter and
website (2) Craft a relevant
'way forward' in relation to
community champions (3)
Pilot the implementation of
ICLEI Future Leaders
Programme
25 50 75 100
1.3. Manage and regulate
the built environment
Musa Mbhele R 103,370,550
1.3.1 Meet scorecard
stipulated processing time
frames for applications
Richard Holgate % All applications submitted
are on target in terms of the
National Building Regulations
(30 days for applications less
than 500m²) and 60 days
applications greater than
500m²
100 100 100 100
Musa Mbhele 1.3.2 Meet legislated and
score card timeframes for
Building Inspectorate
functions
Daniels Pentasaib % All inspection requests and
application for completion/
occupation certificates are
attended to within
statutory/score card time
frames (48 hours for all
inspections and Occupational
certificates)
100 100 100 100
Musa Mbhele 1.3. 3 Enhancement of turn
around times for dealing with
enforcement cases
Abdull Domingo % Attend to all enforcement
cases within scorecard
timeframes (21 days)
100 100 100 100
Musa Mbhele 1.3.4 Meet stipulated time
frames for advertising signage
applications
Ntombi Maema % 90% of all applications meet
stipulated time frames
(temporary 2 days and
permanent 21 days)
100 100 100 100
22

Plan 1: Develop and Sustain our Spatial, Natural and Built Environment
Plan Owner: Soobs Moonsammy
National KPA Strategic Focus
Area
Programme Programme Driver Project Project Manager Sub Project Sub Project
Manager
Unit Of
Measure
Annual Target Q1 Target -
Sept 2013
Q2 Target -
Dec 2013
Q3 Target -
Mar 2014
Q4 Target -
June 2014
Rand value of capital
budget allocation (at
project level)
R 3 587 000
Rand value of operating
budget allocation (at
project level)
R 446 024 000
Musa Mbhele 1.3.5 Enhance signage
opportunities on Council
owned assets
Ntombi Maema % Monitoring of contracts and
tenders (public transport
shelters, taxi ranks,
billboards, poster holders,
newspaper headline holders
and better buildings
program)
100 100 100 100
1.4. Develop and
implement a Municipal
Climate Protection
Programme
Debra Roberts 1.4.1 Implementation of the
Durban Adaptation Charter
(DAC).
Sean O'Donoghue % Develop a work programme
with local & international
partners
25 50 75 100
1.4.2 Development of the
Durban Climate Change
Strategy
Sean O'Donoghue % Successful delivery against
agreed work programme.
25 50 75 100
SUB-TOTAL R 3,587,000 R 151,359,631
GENERAL SUPPORT SERVICES - R 294,664,369
TOTAL R 3,587,000 R 446,024,000
23

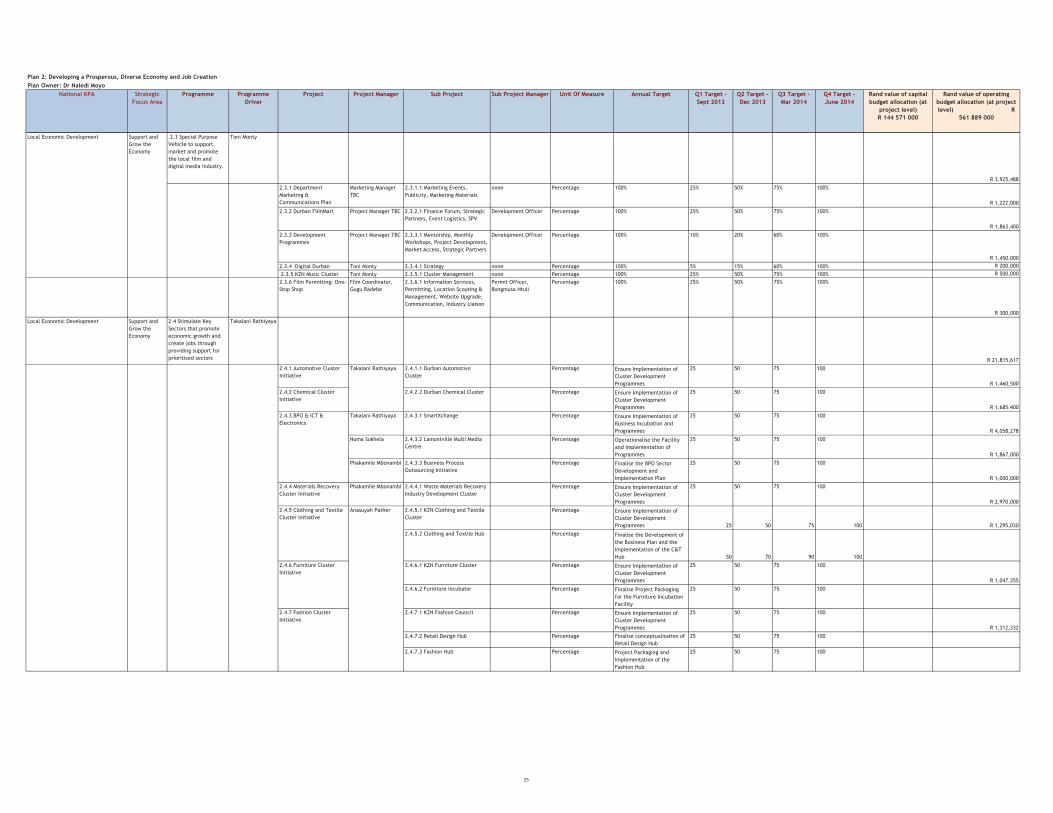
Plan 2: Developing a Prosperous, Diverse Economy and Job Creation
Plan Owner: Dr Naledi Moyo
National KPA Strategic
Focus Area
Programme Programme
Driver
Project Project Manager Sub Project Sub Project Manager Unit Of Measure Annual Target Q1 Target -
Sept 2013
Q2 Target -
Dec 2013
Q3 Target -
Mar 2014
Q4 Target -
June 2014
Rand value of capital
budget allocation (at
project level)
R 144 571 000
Rand value of operating
budget allocation (at project
level) R
561 889 000
Local Economic Development (LED) Economic
Leadership,
Marketing and
Monitoring
2.1 Lobbying and
providing strategic
support
Ajiv Maharaj 2.1.1 Investigating catalytic
economic interventions
Ajiv Maharaj
R 2,705,726
2.1.1.1 Special Economic Zones
(SEZ)
Ajiv Maharaj %age 1. Input into national process
2. Concept report on new
proposal
10% 20% 50% 100%
R 2,200,000
2.1.1.2 Feasibility Study into the
establishment of a World trade
Centre
Aurelia Albert %age Feasibility report 5% 15% 25% 100%
2.1.1.3 Port expansion research Ajiv Maharaj %age Research outputs 5% 10% 25% 100%
2.1.1.4 Industrial Land Strategy
and implementation plan
Ajiv Maharaj %age Strategy document and
management tool
25% 50% 75% 100%
2.2 Provide Economic
Intelligence and a
Strategic Economic
Framework R 2,705,726
2.2.1 Providing a strategic
economic framework
Ajiv Maharaj 2.2.1.1 Economic Development
and Job Creation Strategy
Ajiv Maharaj %age Strategy Adopted 100% 100% 100% 100%
R 800,000
2.2.1.2 Economic Development
Plan
Ajiv Maharaj %age Final Report 25% 75% 100% 100%
2.2.1.3 Sector research/ Strategy:
Tourism
Aurelia Albert %age Tourism Strategy 50% 75% 100% 100%
2.2.1.4 Sector research/ strategy:
Green Economy implementation
plan
Caili forrest %age Report 5% 20% 50% 100%
2.2.1.5 Sector research/ Strategy:
Innovation
Aurelia Albert %age Report on approach to
promote innovation in
industry
25% 75% 100% 100%
2.2.1.6 Spatial research/
Strategy: Economic Spatial Plan
Ajiv Maharaj %age Report on economic spatial
plan
10% 40% 80% 100%
2.2.1.7 LED Planning:
Participative Economic Action
Planning
Jabulani Msomi %age Planning reports completed 20% 60% 80% 100%
2.2.2 Provide economic
intelligence
Ajiv Maharaj 2.2.2.1 Quarterly EDGE
Publications
Aurelia Albert %age 4 EDGE newsletter type
publications
25% 50% 75% 100%
R 1,100,000
2.2.2.2 Quarterly EDGE Seminars/
events
Aurelia Albert %age 4 EDGE economic
intelligence events
25% 50% 75% 100%
2.2.2.3 Research papers Aurelia Albert %age 4 research papers on key
topical economic issues
25% 50% 75% 100%
2.2.2.4 Economic intelligence dvd
(on the local economy)
Ajiv Maharaj %age Development of a multi-
media economic overview of
the local economy
5% 10% 50% 100%
2.2.2.5 Investment research and
strategy
Caili forrest %age Reports updated quarterly
and interdepartmental
meetings to manage risk
25% 50% 75% 100%
2.2.2.6 Monitoring and
evaluation: Job Monitoring System
Caili forrest %age Monitoring system in
operation
10% 40% 60% 100%
2.2.2.7 Monitoring and
evaluation: Impact studies for 2
projects
Denny Thaver %age 2 reports focussed on 2 key
projects
25% 50% 75% 100%
2.2.2.8 Socio-economic research:
Annual Economic Review
Denny Thaver %age Report 5% 10% 75% 100%
2.2.2.9 Annual update of Reports:
Treasury, IDP, and ad hoc
requests for Economic updates
Denny Thaver % 1 Annual report for Treasury
and quarterly
IDP/SDBIP/Scorecard Updates
20% 60% 80% 100%
2.2.2.10 Virginia Airport Denny Thaver %age oversight function and
operational contracts
25% 50% 75% 100%
R 7,626,318
24
Plan 2: Developing a Prosperous, Diverse Economy and Job Creation
Plan Owner: Dr Naledi Moyo
National KPA Strategic
Focus Area
Programme Programme
Driver
Project Project Manager Sub Project Sub Project Manager Unit Of Measure Annual Target Q1 Target -
Sept 2013
Q2 Target -
Dec 2013
Q3 Target -
Mar 2014
Q4 Target -
June 2014
Rand value of capital
budget allocation (at
project level)
R 144 571 000
Rand value of operating
budget allocation (at project
level) R
561 889 000
Local Economic Development Support and
Grow the
Economy
2.3 Special Purpose
Vehicle to support,
market and promote
the local film and
digital media industry.
Toni Monty
R 3,925,488
2.3.1 Department
Marketing &
Communications Plan
Marketing Manager
TBC
2.3.1.1 Marketing Events,
Publicity, Marketing Materials
none Percentage 100% 25% 50% 75% 100%
R 1,222,000
2.3.2 Durban FilmMart Project Manager TBC 2.3.2.1 Finance Forum, Strategic
Partners, Event Logistics, SPV
Development Officer Percentage 100% 25% 50% 75% 100%
R 1,863,400
2.3.3 Development
Programmes
Project Manager TBC 2.3.3.1 Mentorship, Monthly
Workshops, Project Development,
Market Access, Strategic Partners
Development Officer Percentage 100% 10% 20% 60% 100%
R 1,450,000
2.3.4 Digital Durban Toni Monty 2.3.4.1 Strategy none Percentage 100% 5% 15% 60% 100% R 200,000
2.3.5 KZN Music Cluster Toni Monty 2.3.5.1 Cluster Management none Percentage 100% 25% 50% 75% 100% R 500,000
2.3.6 Film Permitting: One-
Stop Shop
Film Coordinator,
Gugu Radebe
2.3.6.1 Information Services,
Permitting, Location Scouting &
Management, Website Upgrade,
Communication, Industry Liaison
Permit Officer,
Bongmusa Ntuli
Percentage 100% 25% 50% 75% 100%
R 300,000
Local Economic Development Support and
Grow the
Economy
2.4 Stimulate Key
Sectors that promote
economic growth and
create jobs through
providing support for
prioritized sectors
Takalani Rathiyaya
R 21,815,617
2.4.1 Automotive Cluster
Initiative
Takalani Rathiyaya 2.4.1.1 Durban Automotive
Cluster
Percentage Ensure Implementation of
Cluster Development
Programmes
25 50 75 100
R 1,460,500
2.4.2 Chemical Cluster
Initiative
2.4.2.2 Durban Chemical Cluster Percentage Ensure Implementation of
Cluster Development
Programmes
25 50 75 100
R 1,685,400
2.4.3 BPO & ICT &
Electronics
Takalani Rathiyaya 2.4.3.1 SmartXchange Percentage Ensure Implementation of
Business Incubation and
Programmes
25 50 75 100
R 4,058,278
Noma Sokhela 2.4.3.2 Lamontville Multi Media
Centre
Percentage Operationalise the Facility
and Implementation of
Programmes
25 50 75 100
R 1,867,000
Phakamile Mbonambi 2.4.3.3 Business Process
Outsourcing Initiative
Percentage Finalise the BPO Sector
Development and
Implementation Plan
25 50 75 100
R 1,000,000
2.4.4 Materials Recovery
Cluster Initiative
Phakamile Mbonambi 2.4.4.1 Waste Materials Recovery
Industry Development Cluster
Percentage Ensure Implementation of
Cluster Development
Programmes
25 50 75 100
R 2,970,000
2.4.5 Clothing and Textile
Cluster Initiative
Anasuyah Pather 2.4.5.1 KZN Clothing and Textile
Cluster
Percentage Ensure Implementation of
Cluster Development
Programmes 25 50 75 100 R 1,295,030
2.4.5.2 Clothing and Textile Hub Percentage Finalise the Development of
the Business Plan and the
Implementation of the C&T
Hub 50 70 90 100
2.4.6 Furniture Cluster
Initiative
2.4.6.1 KZN Furniture Cluster Percentage Ensure Implementation of
Cluster Development
Programmes
25 50 75 100
R 1,047,355
2.4.6.2 Furniture Incubator Percentage Finalise Project Packaging
for the Furniture Incubation
Facility
25 50 75 100
2.4.7 Fashion Cluster
Initiative
2.4.7.1 KZN Fashion Council Percentage Ensure Implementation of
Cluster Development
Programmes
25 50 75 100
R 1,312,332
2.4.7.2 Retail Design Hub Percentage Finalise conceptualisation of
Retail Design Hub
25 50 75 100
2.4.7.3 Fashion Hub Percentage Project Packaging and
Implementation of the
Fashion Hub
25 50 75 100
25

Plan 2: Developing a Prosperous, Diverse Economy and Job Creation
Plan Owner: Dr Naledi Moyo
National KPA Strategic
Focus Area
Programme Programme
Driver
Project Project Manager Sub Project Sub Project Manager Unit Of Measure Annual Target Q1 Target -
Sept 2013
Q2 Target -
Dec 2013
Q3 Target -
Mar 2014
Q4 Target -
June 2014
Rand value of capital
budget allocation (at
project level)
R 144 571 000
Rand value of operating
budget allocation (at project
level) R
561 889 000
2.4.8 Maritime Cluster
Initiative
Noma Sokhela 2.4.8.1 eThekwini Maritime
Cluster
Percentage Ensure Implementation of
Cluster Development
Programmes 25 50 75 100 R 2,000,000
2.4.8.2 AIVP Conference Percentage Facilitate for the
Appointment of the PCO and
Provide Support 60 100 100 100
2.4.9 Strategic Initiatives Noma Sokhela 2.4.9.1 Innovation and
Technology
Percentage Finalisation of the Innovation
Strategy 50 75 85 100 R 1,000,000
Noma Sokhela 2.4.9.2 Industrial Design Institute Percentage Finalise the Industrial Design
Project Packaging 25 50 75 100 R 1,000,000
2.4.10 Agri Processing
Initiative
Phakamile Mbonambi 2.4.10.1 Edamame Soya Bean
Initiative
Percentage Ensure Implementation of
Edamame Development
Initiative
25 50 75 100
R 1,500,000
2.4.10.2 Cottonland Mushroom
Project
Percentage
Facilitate Land Acquisition
and Appoint Service Provider
to Manage Operations
25 50 75 100
R 550,000
2.4.11 Green Economy Gary Cullen 2.4.11.1 Durban Green Corridor Percentage
Ensure implementation of
the Eco-Tourism Programmes
25 50 75 100
R 2,167,000
Phakamile Mbonambi 2.4.11.2 Waste Value Chain
Analysis
Percentage Complete Research and
Disseminate Findings to
broader Stakeholders 30 60 80 100 R 700,000
2.4.12 Trade / Export
Development
Takalani Rathiyaya Percentage Develop export development
framework
25 50 75 100
2.4.13 Cluster CEO's Forum Takalani Rathiyaya 2.4.13.1 Cluster Leadership
engagement Forum
Percentage
Ensure information sharing
and implementation of joint
initiatives
25 50 75 100
Jannie Pieterson 2.4.14 Expanded Public
Works Programme
Balan Govender 2.4.14.1 The number of work
opportunities (i.e. 230 person
days - FTES) created through the
municipal capital and operating
budget per line dept. this year.
Sbu Chamane Number 6800 680 2040 4080 6800
2.4.15 Community Gardens Balan Govender 2.4.15.1 The number of
community gardens provided with
infrastructural and agricultural
support”
Mlindi Linda Number 80 0 5 30 80
Local Economic Development (LED) Support and
Grow the
Economy
2.5 Special Purpose
Vehicle to drive Durban
investment facilitation
and promotion to local
& foreign Business
Russell Curtis
R 6,543,560
2.5.1 Best Practice City
Commission Review &
Implementation
Ndumiso Mlambo 2.5.1.1 BPCC (1999) Review &
new 2013 Commission
Recommendations
Ndumiso Mlambo % 100% completion of BPCC
Review & Recommendations
Report, plus Council adoption
thereof
50% 75% 100% 100%
R 3,150,000
2.5.1.2 Implement Commission
Recommendations & Support
Commission + Council oversight
Implementation of BPCC
Recommendations plus
support the oversight &
Council Reporting
0% 0% 20% 40%
2.5.2 Investment Promotion
and Marketing
Farah Goolam 2.5.2.1 Investment Marketing Plan
Update/Expansion
Farah Goolam % 100% Accepted definition
Investment Marketing Plan
75% 100% 100% 100%
R 2,600,000
2.5.2.2 Advertising Full Investment Marketing
budget spent;
25% 50% 75% 100%
2.5.2.3 Media Liaison, Monitoring
& Research
Update fullest Press Contact
List & engage all; Impact &
Investments monitored via
Media
50% 75% 100% 100%
2.5.2.4 Investment Promotion &
Business Events
1 Qtrly event with partners;
2 Conf./Exhib participations.
2 own initiated
projects/events.
25% 50% 75% 100%
2.5.2.5 Audio Visual / PowerPoint
Presentations/ Publications
Packaged eThekwini Mktg
products & platforms in hard
& "soft" formats, plus full
stock / use of Partner
materials. Distribution in
place plus to key
Stakeholders quarterly
75% 100% 100% 100%
26

Plan 2: Developing a Prosperous, Diverse Economy and Job Creation
Plan Owner: Dr Naledi Moyo
National KPA Strategic
Focus Area
Programme Programme
Driver
Project Project Manager Sub Project Sub Project Manager Unit Of Measure Annual Target Q1 Target -
Sept 2013
Q2 Target -
Dec 2013
Q3 Target -
Mar 2014
Q4 Target -
June 2014
Rand value of capital
budget allocation (at
project level)
R 144 571 000
Rand value of operating
budget allocation (at project
level) R
561 889 000
2.5.2.6 Investor Engagements &
Communications
Provide support & service to
in-bound FDI Delegations +
"Walk-ins" minimum 4 per
year. bodies.
25% 50% 75% 100%
2.5.3 Local Business
Support
Afika Mawande
Ndima
2.5.3.1 BR&E Program Roll-out Afika Mawande Ndima % Support & complete BR&E
PIPLOA Feedback Report +
Event; Area Action Team
interventions launched and
capacitated.
50% 75% 100% 100%
R 480,000
2.5.3.2 Organised Business
Structure Partnerships
4 structures engaged Qtrly. 4
Partner Program
participations. 2 own
initiated projects/events.
25% 50% 75% 100%
2.5.3.3 Key Client Aftercare &
Engagement
Implement Business
Engagement Strategy &
Action Plan doc, plus report
quarterly.
30% 60% 90% 100%
2.5.3.4 Flagship Investment
Project Support
Facilitate & promote min 4
flagship projects via DCM's
Forum & Policy "Deal Team"
25% 50% 75% 100%
2.5.4 Foreign Investor
Attraction & Support
Thembelihle
Phumzile Ndlovu
2.5.4.1 FDI for Development Thembelihle Phumzile
Ndlovu
% Obtain >R250m FDI
Investment including SMME /
BEE Companies participation.
25% 50% 75% 100%
R 210,000
2.5.4.2 Foreign Investor
Information Services
Develop & maintain
Information pack regarding
Doing business in Durban &
distrib. for FDI's
50% 75% 100% 100%
2.5.4.3 Targeted Investment for
Specific Sector/Clusters Support
Ensure foreign investment
opportunity created for min
2 of the 5 priority sectors /
Clusters, in partnership with
E.D. Programs Dept.
25% 50% 75% 100%
2.5.4.4 Targeted FDI Strategy &
Action Plan
100% completion of FDI
Strategy & Action Plan
Report, plus implementation
thereof underway in
partnership with TISA (Dti) &
TIKZN
0% 25% 50% 75%
2.5.5 Investment
Development
TBA 2.5.5.1 Creating and facilitating
new investments in both
previously disadvantaged and
currently constrained areas
(economically & infrastructurally)
TBA % Identify & develop 2 projects
to facilitate investment in
selected HDI &/or priority
infrastructure areas. Subject
to HR availability
20% 40% 60% 80%
R 135,000
2.5.5.2 Identifying and packaging
new investment opportunities in
the manufacturing, Green
Economy & services sectors
Identify & develop 3 projects
where opportunities exist for
SMMEs and BEE. Subject to
HR availability
20% 40% 60% 80%
Local Economic Development Support and
Grow the
Economy
2.6 Facilitating Nodal
Development (LED)
Themba Msomi
R 13,094,000 R 12,248,595
27

Plan 2: Developing a Prosperous, Diverse Economy and Job Creation
Plan Owner: Dr Naledi Moyo
National KPA Strategic
Focus Area
Programme Programme
Driver
Project Project Manager Sub Project Sub Project Manager Unit Of Measure Annual Target Q1 Target -
Sept 2013
Q2 Target -
Dec 2013
Q3 Target -
Mar 2014
Q4 Target -
June 2014
Rand value of capital
budget allocation (at
project level)
R 144 571 000
Rand value of operating
budget allocation (at project
level) R
561 889 000
2.6.1 Hammarsdale: Shezi
road upgrade
Peter Gilmore Percentage 100% Achievements of
Projects
25 50 75 100
R 7,400,000
2.6.2 Hammarsdale: MR
385 upgrade
Percentage 100% Achievements of
Projects
25 50 75 100
R 500,000
2.6.3 Hammarsdale: Kelly
road Street Trading
Shelters upgrade
Percentage 100% Achievements of
Projects
25 50 75 100
R 2,500,000
2.6.4 Illovu Auto Supplier
Park establishment
Percentage 100% Achievements of
Projects
25 50 75 100
R 2,000,000
2.6.5 KwaNdengezi Public
Realm upgrade
Percentage 100% Achievements of
Projects
25 50 75 100
R 1,300,000
2.6.6 Cornubia link rd
construction
Steven Angelos Percentage 100% Achievements of
Projects
25 50 75 100
R 9,500,000
2.6.7 Tongaat uShukela
drive
Percentage 100% Achievements of
Projects
25 50 75 100
R 2,100,000
2.6.8 Umhlanga: Chartwell
drive servitudes
Percentage 100% Achievements of
Projects
25 50 75 100
R 500,000
2.6.9 Priority Node:
Umkhomaas
Theresa Subban Percentage 100% Achievements of
Projects
25 50 75 100
R 5,500,000
2.6.10 Chatsworth Florence
Nightengale
Percentage 100% Achievements of
Projects
25 50 75 100
R 7,000,000
2.6.11 Kingsway tourism:
Warner Beach
Percentage 100% Achievements of
Projects
25 50 75 100
R 1,500,000
2.6.12 Bluff beaches Master
plan
Percentage 100% Achievements of
Projects
25 50 75 100
2.6.13 Umhlanga Life guard
Tower
Percentage 100% Achievements of
Projects
25 50 75 100
R 2,800,000
2.6.14 Umlazi:
KwaMnyandu Pavement
Vuyo Jayiya Percentage 100% Achievements of
Projects
25 50 75 100
R 8,500,000
2.6.15 Umlazi: Ezimbuzini
Street trading facilities
Percentage 100% Achievements of
Projects
25 50 75 100
R 5,000,000
2.6.16 Isipingo: Completion
of Phase 1 & 2 construction
Percentage 100% Achievements of
Projects
25 50 75 100
R 12,800,000
2.6.17 Westville CBD
upgrade
Nkululeko Mkhize Percentage 100% Achievements of
Projects
25 50 75 100
R 7,394,000
2.6.18 Pinetown: Hill street
phase 1 construction
Percentage 100% Achievements of
Projects
25 50 75 100
2.6.19 Clermont: Zazi
street land acquisition
Percentage 100% Achievements of
Projects
25 50 75 100
R 1,900,000
2.6.20 Umgababa: Ablution
facilities
Percentage 100% Achievements of
Projects
25 50 75 100
R 4,200,000
2.6.21 Umgababa Private
sector leverage
Percentage 100% Achievements of
Projects
25 50 75 100
2.6.22 KwaNozaza Land
Alienation
Percentage 100% Achievements of
Projects
25 50 75 100
2.6.23 KwaMashu Lindelani
node planning
Lennard Baars Percentage 100% Achievements of
Projects
25 50 75 100
2.6.24 Ntuzuma Westrich
node development
Percentage 100% Achievements of
Projects
25 50 75 100
R 400,000
2.6.25 KwaMashu Town
Centre Erf 1256
Percentage 100% Achievements of
Projects
25 50 75 100
2.6.26 Warwick: MMD & Job
Opportunity Centre
Percentage 100% Achievements of
Projects
25 50 75 100
R 1,000,000
2.6.27 KwaMashu Furniture
Incubator
Percentage 100% Achievements of
Projects
25 50 75 100
R 3,000,000
2.6.28 Sustainable
Livelihoods
Geoff Griffiths Percentage 100% Achievements of
Projects
25 50 75 100
2.6.29 Tourism: Pixley ka
Seme study, Intathakusa
retreat, 1000 Hills Tourism
Percentage 100% Achievements of
Projects
25 50 75 100
R 5,700,000
2.6.30 LIV Village Percentage 100% Achievements of
Projects
25 50 75 100
2.6.31 Township 2nd access
program
Percentage 100% Achievements of
Projects
25 50 75 100
28

Plan 2: Developing a Prosperous, Diverse Economy and Job Creation
Plan Owner: Dr Naledi Moyo
National KPA Strategic
Focus Area
Programme Programme
Driver
Project Project Manager Sub Project Sub Project Manager Unit Of Measure Annual Target Q1 Target -
Sept 2013
Q2 Target -
Dec 2013
Q3 Target -
Mar 2014
Q4 Target -
June 2014
Rand value of capital
budget allocation (at
project level)
R 144 571 000
Rand value of operating
budget allocation (at project
level) R
561 889 000
Local Economic Development (LED) Support and
Grow the
2.7 Strategic Projects
for 2013 and Beyond
Gary Kimber
R 81,314,357
2.7.1 Kings Park MM
Stadium Precinct
Gary Kimber n/a n/a Percentage 100% 0 10 50 100
R 5,400,000 -
2.7.2 Community
Development Project
Mike Andrews n/a n/a Percentage 100% 20 50 75 100
-
2.7.3 Victoria Embankment Mike Andrews n/a n/a Percentage 100% 0 10 50 100
R 3,600,000 -
2.7.4 Moses Mabhida
Stadium Capex
Gary Kimber n/a n/a Percentage 100% 20 50 75 100
R 10,000,000 -
2.7.5 Point Mike Andrews n/a n/a Percentage 100% 5 30 75 100 R 11,700,000 -
2.7.6 Centrum Site Mike Andrews n/a n/a Percentage 100% 0 10 50 100 R 2,850,000 -
2.7.7 Land Packaging Mike Andrews n/a n/a Percentage 100% 0 10 50 100 R 225,000 -
2.7.8 Natal Command Site Mike Andrews n/a n/a Percentage 100% 0 10 50 100
R 225,000 -
2.7.9 Moses Mabhida
Stadium Operations
Gary Kimber n/a n/a Percentage 100% 25 50 75 100
- R 78,103,800
2.7.10 Top Gear Festival Gary Kimber n/a n/a Percentage 100% 0 0 0 100 - R 10,000,000
2.7.11 Beachfront
Landscaping Maint
Mike Andrews n/a n/a Percentage 100% 25 50 75 100
- R 7,000,000
2.7.12 Beachfront Elect
Maint
Mike Andrews n/a n/a Percentage 100% 25 50 75 100
- R 1,750,000
2.7.13 Beachfront Security Mike Andrews n/a n/a Percentage 100% 25 50 75 100
- R 5,761,520
Local Economic Development (LED) Support and
Grow the
Economy
2.8 SMME Development Philip Sithole
R 1,597
2.8.1 Provide Business
Support to the Co-
operatives
Siyabonga Luthuli n/a n/a Percentage 100% 20 30 50 100
R 4,151,438
2.8.2 Durban Business Fair Siyabonga Luthuli n/a n/a Percentage 100% 40 70 80 100R 13,026,000
2.8.3 Retail Siyabonga Luthuli n/a n/a Percentage 100% 20 50 80 100 R 2,000,024
2.8.4 Rural and Township
Development
Siyabonga Luthuli n/a n/a Percentage 100% 25 50 75 100R 2,666,295
Durban Fashion Fair Sindi Shangase n/a n/a Percentage 100% 60 80 90 100 R 7,497,065
2.8.5 Sister Cities
Programme
Sindi Shangase n/a n/a Percentage 100% 20 40 70 100R 1,333,027
2.8.6 Arts and Craft Sector
Development
Sindi Shangase n/a n/a Percentage 100% 25 50 75 100R 1,599,777
2.8.7 Facilitation Business
linkages and support to
enterprise
Floyd Ngcobo n/a n/a Percentage 100% 15 30 70 100
R 2,488,542
2.8.8 Access to information
Empowerment Workshops
Ntombithini Ngcobo n/a n/a Percentage 100% 40 60 80 100
R 1,599,777
2.8.9 Ink Construction
Incubation Program
Ntombithini Ngcobo n/a n/a Percentage 100% 30 40 70 100R 3,869,453
2.8.10 Access to finance Ntombithini Ngcobo n/a n/a Percentage 100% 15 30 70 100R 500,000
2.8.11 Construction
Development Program
Ntombithini Ngcobo n/a n/a Percentage 100% 25 40 75 100R 2,000,024
2.8.12 Tourism Enterprise
Development
Nelisa Mshengu n/a n/a Percentage 100% 20 40 75 100R 3,999,322
2.8.13 Women
Empowerment Programme
Khosi Sithole n/a n/a Percentage 100% 40 60 80 100
R 2,772,947
2.8.14 Facilitate
Manufacturing
Development programme
Khosi Sithole n/a n/a Percentage 100% 15 40 70 100
R 1,333,027
2.8.15 Facilitate public-
private partnerships
(Strategic Partnerships)
Anneline Chetty n/a n/a Percentage 100% 20 50 70 100
R 500,000
2.9 MANAGING THE
INFORMAL ECONOMY
2.9.1 Provide infrastructure
support and development
to informal trade
Micheal Hlangu n/a n/a Percentage 100% 30 50 80 100
R 2,322,000 R 65,328,972
29

Plan 2: Developing a Prosperous, Diverse Economy and Job Creation
Plan Owner: Dr Naledi Moyo
National KPA Strategic
Focus Area
Programme Programme
Driver
Project Project Manager Sub Project Sub Project Manager Unit Of Measure Annual Target Q1 Target -
Sept 2013
Q2 Target -
Dec 2013
Q3 Target -
Mar 2014
Q4 Target -
June 2014
Rand value of capital
budget allocation (at
project level)
R 144 571 000
Rand value of operating
budget allocation (at project
level) R
561 889 000
2.10 SUPPORT AND
GROW THE TOURISM
SECTOR
2.10.1 Provide
management and
marketing support of
Strategic Events
Winile Mntungwa &
Vivienne Holden
n/a n/a Percentage 100 25 50 75 100
2.10.2 Ensure brand
positioning of Durban brand
and improve brand
awareness
Dumi Mbatha n/a n/a Percentage 100 10 40 75 100
R 15,194,788
2.10.3 Marketing the
destination on National and
International platforms
Dumi Mbatha n/a n/a Percentage 100 25 50 75 100
R 60,779,154
2.10.4 Provide advisory and
information services to
product owners and visitors
Patrick Masinga n/a n/a Percentage 100 25 50 75 100
R 11,771,935
2.10.5 Ensure
competitiveness through
gathering business
intelligence and improving
product quality
Anneline Chetty n/a n/a Percentage 100 25 50 75 100
R 3,001,500
2.11 SUPPORT AND
GROW THE FRESH
Philip Sithole 2.11.1 Provision and
Maintenance of
Andre Young 2.11.1.1 Replacement of gutters Tony Naidoo % 100% 20 45 75 100 R 300,000
2.11.1.2 Maintenance of
Refrigeration and Air-conditioning
plants
Tony Naidoo % 100% 25 50 75 100 R 2,252,000
2.11.1.3 General Maintenance Tony Naidoo % 100% 25 50 75 100 R 7,653,030
2.11.2 Enhancement of
Facility
Andre Young 2.11.2.1 Replacement of fan coil
units
Tony Naidoo % 100% 10 35 70 100R 1,250,000
2.11.2.2 Replacement of
Compressor
Tony Naidoo % 100% 10 35 70 100R 1,000,000
2.11.3 Market Trading Jason Moonsamy 2.11.3.1 Sales floor operations Headman Jwara % 100% 25 50 75 100 R 3,773,110
2.11.3.2 Real time trading
platform
Thiren Misthry % 100% 24 48 76 100 R 1,989,000
2.11.4 Provision of Support Jason Moonsamy 2.11.4.1 Marketing Andre Young % 100% 25 50 75 100 R 1,734,981
2.11.4.2 Provision of Ripening and
Cold Storage service
Tony Naidoo % 100% 25 50 75 100 R 3,128,650
2.11.4.3 Security Service Headman Jwara % 100% 25 50 75 100 R 7,091,236
2.11.4.4Administrative and
Systems Control support
Amarasen Govender % 100% 25 50 75 100 R 811,000 R 42,828,327
TOTAL R 144,571,000 R 561,889,000
30

Plan 3: Creating a Quality Living Environment
Plan Owner: Sibusiso Sithole
National KPA Strategic
Focus Area
Programme Program
me
Driver
Project Project
Manager
Sub Project Sub Project Manager Annual
Target
Q1 Target -
Sept 2013
Q2 Target -
Dec 2013
Q3 Target -
Mar 2014
Q4 Target -
June 2014
Rand value of capital
budget allocation (at
project level)
R 4 885 716 000
Rand value of operating budget
allocation (at project level)
R 17 906 969 000
Basic service deliveryM
eet
infr
ast
ructu
re a
nd
house
hold
serv
ice
needs
and
backlo
gs
3.1. New Integrated
housing
development and
interim servicing of
informal settlements
Dumisani
Shoba
3.1.1. Upgrading
informal
settlements,
relocations and
greenfield
projects.
Lungi
Gcabashe
3.1.1.1. The number of consumer
units receiving fully subsidised
HOUSING
Dumisani Shoba 7200 1100 2900 5000 7200 R 739,000,000 R 100,000,000
3.2. Rental and Gap
housing strategy
Dumisani
Shoba
3.2.1. Hostel
management
Yunus Sacoor 3.2.1.1. New family units Yunus Sacoor 100 20 50 70 100 R 50,000,000 R 258,000,000
3.2.2. Rental stock
rationalisation
strategy
Yunus Sacoor 3.2.2.1. Sale of Council rental stock Yunus Sacoor 600 100 300 400 600
Vis Moodley 3.2.2.2. Upgrade & refurbishment of
units in R293, ex-own affairs,&
Lamontville.
Vis Moodley 2900 574 1304 2024 2900 R 280,000,000
3.3. Address
Infrastructure
Chris
Hardy
3.3.1. Address
Service Backlogs
Chris Hardy 3.3.1.1. An updated proxy indigent
register
Ken Breetzke 100 0 0 50 100
3.3.1.2. Built Environment
Performance Plan
Ken Breetzke 100 0 0 80 100
3.3.1.3. The number of consumer
units provided with access to a
FREE basic level of potable WATER
either by means of a yard supply
households (ground tank or metered
flow limiter connected to a yard
tap) or, for informal settlements, by
a standpipe within 200m.
Frank Stevens 1000 100 300 500 1000 R 18,450,000 R 1,845,000
3.3.1.4. The number of consumer
units provided with access to a
FREE basic level of SANITATION by
means of a UD toilet, an existing VIP
or, for informal settlements, by
means of a toilet/ablution block
within 200m.
Frank Stevens 16200 2000 4000 8,000 16200 R 311,000,000 R 28,034,100
3.3.1.5. The number of consumer
units provided with new prepaid
ELECTRICITY connections captured
including housing and rural
consumer units
Jay Kalichurun 12000 3000 6000 9000 12000 R 50,000,000
31

Plan 3: Creating a Quality Living Environment
Plan Owner: Sibusiso Sithole
National KPA Strategic
Focus Area
Programme Program
me
Driver
Project Project
Manager
Sub Project Sub Project Manager Annual
Target
Q1 Target -
Sept 2013
Q2 Target -
Dec 2013
Q3 Target -
Mar 2014
Q4 Target -
June 2014
Rand value of capital
budget allocation (at
project level)
R 4 885 716 000
Rand value of operating budget
allocation (at project level)
R 17 906 969 000
3.3.1.6. The number of consumer
units provided with new
conventional ELECTRICITY
connections (this year)
Jay Kalichurun 1000 250 500 750 1000 R 15,000,000
3.3.1.7. The number of consumer
units collecting FREE basic
ELECTRICITY (65kWh/month).
Deena Govender 85000 85000 85000 85000 85000 R 71,951,000
3.3.1.8. The number of additional
consumer units provided with a
once/week, kerb-side REFUSE
removal service
Raymond Rampersad 170 100 110 120 170 R 54,820
3.3.1.9. The % of municipal landfills
in compliance with the
Environmental Conservation Act.
Raymond Rampersad 100 100 100 100 100
3.3.1.10. The number of properties
below the eThekwini defined level
of service provided with STORM
WATER solutions .
Randeer Kasserchun 440 80 180 260 440 R 54,000,000 R 20,400,000
3.3.1.11. The number of km of
SIDEWALK constructed.
Roy Gooden 9.1 0 3 6 9.1 R 5,681,000
3.3.1.12. The km of unsurfaced
ROAD converted to surfaced
Roy Gooden 10.1 0 1 3.9 10.1 R 70,480,000
3.3.1.13 The number of km of roads
maintained by Zibambele
contractors
Mark Tomlinson 2400 2400 2400 2400 2400 R 75,000,000
3.3.1.14 The number of km of
streams maintained by Zibambele
contractors
Mark Tomlinson 150 150 150 150 150 R 15,000,000
3.3.1.15 The number of km of
higher order routes covered by an
all inclusive, integrated contract
Mark Tomlinson 400 400 400 400 400 R 36,000,000
3.3.1.16. The number of PUBLIC
TRANSPORT RANKS constructed
Carlos Esteves 2 0 0 0 2 R 3,000,000
3.4. Infrastructure
asset management
Jannie
Pietersen
3.4.1. Establish an
Asset Management
Plan
David Lievaart 3.4.1.1. Integrated Asset
Management Plan Level 1
Lawrence Palmer 100 50 100 100 100 R 50,000
3.4.1.2. Integrated Infrastructure
Asset Management Plan Level 2 -
Water & Sanitation
Lawrence Palmer 50 40 44 47 50 R 500,000
32

Plan 3: Creating a Quality Living Environment
Plan Owner: Sibusiso Sithole
National KPA Strategic
Focus Area
Programme Program
me
Driver
Project Project
Manager
Sub Project Sub Project Manager Annual
Target
Q1 Target -
Sept 2013
Q2 Target -
Dec 2013
Q3 Target -
Mar 2014
Q4 Target -
June 2014
Rand value of capital
budget allocation (at
project level)
R 4 885 716 000
Rand value of operating budget
allocation (at project level)
R 17 906 969 000
3.4.1.3. Integrated Infrastructure
Asset Management Plan Level 2 -
Electricity
Lawrence Palmer 60 50 54 57 60 R 500,000
3.4.1.4. Integrated Infrastructure
Asset Management Plan Level 2 -
Roads Provision
Lawrence Palmer 50 40 44 47 50 R 200,000
3.4.1.5. Integrated Infrastructure
Asset Management Plan Level 2 -
CSCM
Lawrence Palmer 50 40 44 47 50 R 500,000
3.4.1.6. Integrated Infrastructure
Asset Management Plan Level 2 -
Solid Waste
Lawrence Palmer 50 40 44 47 50 R 200,000
3.4.1.7. Integrated Infrastructure
Asset Management Plans Level 2 -
ETA
Lawrence Palmer 50 40 44 47 50 R 50,000
3.4.1.8. Integrated Infrastructure
Asset Management Pan Level 2 -
Architecture
Lawrence Palmer 50 40 44 47 50 R 100,000
3.4.1.9. Integrated Infrastructure
Asset Management Plan Level 2 -
Parks & Leisure
Lawrence Palmer 50 40 44 47 50 R 50,000
3.4.1.10. Integrated Infrastructure
Asset Management Plan Level 2 -
Bridges & Retaining Walls
Lawrence Palmer 55 40 45 50 55 R 50,000
3.4.1.11. Integrated Infrastructure
Asset Management Plan Level 2 -
Information Services
Lawrence Palmer 50 40 44 47 50 R 50,000
3.4.1.12. Integrated Infrastructure
Asset Management Plan Level 2 -
Fleet
Lawrence Palmer 50 40 44 47 50 R 20,000
3.4.1.13. Integrated Infrastructure
Asset Management Plan Level 2 -
uShaka
Lawrence Palmer 50 40 44 47 50 R 200,000
3.4.1.14. Integrated Infrastructure
Asset Management Plan Level 2 - ICC
Lawrence Palmer 50 40 44 47 50 R 200,000
33
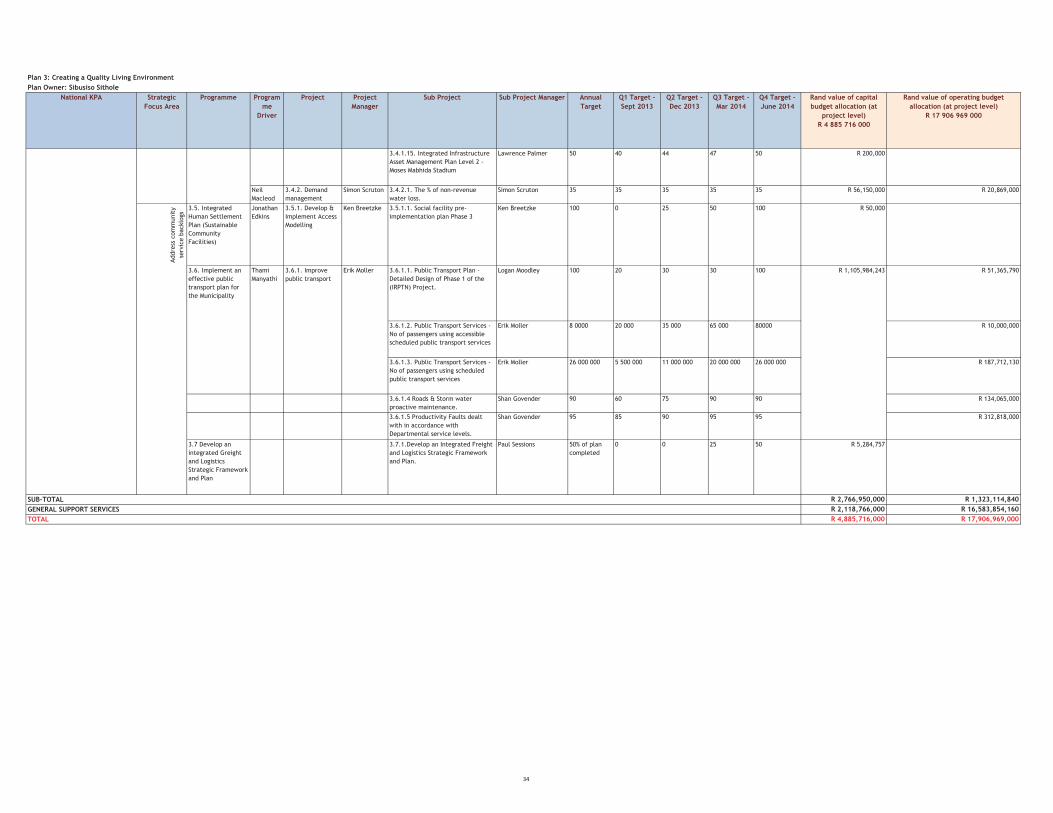
Plan 3: Creating a Quality Living Environment
Plan Owner: Sibusiso Sithole
National KPA Strategic
Focus Area
Programme Program
me
Driver
Project Project
Manager
Sub Project Sub Project Manager Annual
Target
Q1 Target -
Sept 2013
Q2 Target -
Dec 2013
Q3 Target -
Mar 2014
Q4 Target -
June 2014
Rand value of capital
budget allocation (at
project level)
R 4 885 716 000
Rand value of operating budget
allocation (at project level)
R 17 906 969 000
3.4.1.15. Integrated Infrastructure
Asset Management Plan Level 2 -
Moses Mabhida Stadium
Lawrence Palmer 50 40 44 47 50 R 200,000
Neil
Macleod
3.4.2. Demand
management
Simon Scruton 3.4.2.1. The % of non-revenue
water loss.
Simon Scruton 35 35 35 35 35 R 56,150,000 R 20,869,000
Addre
ss c
om
munit
y
serv
ice b
acklo
gs
3.5. Integrated
Human Settlement
Plan (Sustainable
Community
Facilities)
Jonathan
Edkins
3.5.1. Develop &
Implement Access
Modelling
Ken Breetzke 3.5.1.1. Social facility pre-
implementation plan Phase 3
Ken Breetzke 100 0 25 50 100 R 50,000
3.6. Implement an
effective public
transport plan for
the Municipality
Thami
Manyathi
3.6.1. Improve
public transport
Erik Moller 3.6.1.1. Public Transport Plan -
Detailed Design of Phase 1 of the
(IRPTN) Project.
Logan Moodley 100 20 30 30 100 R 1,105,984,243 R 51,365,790
3.6.1.2. Public Transport Services -
No of passengers using accessible
scheduled public transport services
Erik Moller 8 0000 20 000 35 000 65 000 80000 R 10,000,000
3.6.1.3. Public Transport Services -
No of passengers using scheduled
public transport services
Erik Moller 26 000 000 5 500 000 11 000 000 20 000 000 26 000 000 R 187,712,130
3.6.1.4 Roads & Storm water
proactive maintenance.
Shan Govender 90 60 75 90 90 R 134,065,000
3.6.1.5 Productivity Faults dealt
with in accordance with
Departmental service levels.
Shan Govender 95 85 90 95 95 R 312,818,000
3.7 Develop an
integrated Greight
and Logistics
Strategic Framework
and Plan
3.7.1.Develop an Integrated Freight
and Logistics Strategic Framework
and Plan.
Paul Sessions 50% of plan
completed
0 0 25 50 R 5,284,757
SUB-TOTAL R 2,766,950,000 R 1,323,114,840
GENERAL SUPPORT SERVICES R 2,118,766,000 R 16,583,854,160
TOTAL R 4,885,716,000 R 17,906,969,000
34

Plan 4: Fostering a Socially Equitable Environment
Plan Owner: Dr Musa Gumede
National Key Performance Areas Strategic
Focus Area
Programme Programme
Driver
Project Project Manager Unit Of
Measure
Annual Target Q1 - Sep Q2 - Dec Q3 - Mar Q4 - Jun Rand value of
capital budget
allocation (at
project level)
R 111 783 000
Rand value of operating
budget allocation (at
project level)
R 1 498 335 000Basi
c S
erv
ice
Delivery
Promoting the
safety of citizens
4.1. Compliance with
National Road traffic Act
and Municipal Bylaws
E Nzama 4.1.1. Develop and
execute Crime
Prevention Plan in
partnership with South
African Police Force
Director Kay Naidoo % 100%
implementation of
Plan
30 60 90 100
4.1.2. Plan and
implement the traffic
management plan
Director Derreck Sawoni % 100%
implementation of
Plan
30 50 80 100
4.1.3. Plan and
implement Regional
Bylaw Plans (5 Regions)
Director Steve Edwards % 100%
implementation of
Plan
30 50 80 100
4.1.3.1 Refurbishment
of Police Stations.
Steve Middleton % 100%
implementation of
Plan
30 50 80 100
R 2,277,000
4.1.3.2 Operational Metro Police - Deputy
Heads
% 100%
implementation of
Plan
30 50 80 100
R 628,514,623
4.1.4. Improvements to
intersections and/or
road sections
Eugene Naidoo Number 2 0.00 0.00 0.00 2
4.1.5. Traffic calming
residential streets
Eugene Naidoo Number 50 0.00 0.00 0.00 50
R 6,372,052
4.1.6. Road Safety
Awareness Campaign
Ashok Nansook Number 20 Programmes 2 10 12 20
4.1.7. Conduct road
safety audits.
Ashok Nansook Number 10 Locations 2 4 6 10
4.2. Implement the
Social, Situational,
Crime Prevention
strategies and urban
safety management of
the built environment
throughout EMA
Martin Xaba 4.2.1. Profiling of bad
buildings
Hoosen Moolla Number 10 2 5 8 10
4.2.2. Facilitate the
serving of
contravention notices
on building owners
Hoosen Moolla Number 5 1 2 4 5
35

Plan 4: Fostering a Socially Equitable Environment
Plan Owner: Dr Musa Gumede
National Key Performance Areas Strategic
Focus Area
Programme Programme
Driver
Project Project Manager Unit Of
Measure
Annual Target Q1 - Sep Q2 - Dec Q3 - Mar Q4 - Jun Rand value of
capital budget
allocation (at
project level)
R 111 783 000
Rand value of operating
budget allocation (at
project level)
R 1 498 335 000
4.2.3. Close down
buildings and
rehabilitation of
buildings
Hoosen Moolla Number 5 1 2 4 5
R 3,531,700
4.2.3.1 Safer Cities
Operational
Martin Xaba % 100%
implementation of
Plan
30 50 80 100
R 15,630,541
4.2.4. Plan and
execute activities
relating to effective
policing
Nomusa Shembe Number 25 8 13 21 25
4.2.5. Plan and
execute activities
relating to crime
prevention awareness
Nomusa Shembe Number 40 10 20 30 40
R 2,752,000
4.2.6. Plan and
execute activities
relating to
development of safety
plans and establishing
schools and community
safety forums
Nomusa Shembe Number 40 10 20 30 40
4.3. Promoting safety of
communities within the
EMA in support of
emergency and essential
services
Vincent Ngubane 4.3.1. Develop and
implement a business
continuity plan to
provide uninterrupted
access to emergency
services
Allan Pillay % 100% 10% 25% 50% 100%
R 3,342,696
4.3.2. Roll out CCTV
for strategic areas (5
year rollout plan)
Lumi Marcu % 100%
implementation of
Plan
30 50 80 100
R 34,200,000 R 17,833,694
4.3.2.1 CCTV
Opearional
Lumi Marcu % 100% 10.00 25% 100.00 100.00
R 15,736,588
36

Plan 4: Fostering a Socially Equitable Environment
Plan Owner: Dr Musa Gumede
National Key Performance Areas Strategic
Focus Area
Programme Programme
Driver
Project Project Manager Unit Of
Measure
Annual Target Q1 - Sep Q2 - Dec Q3 - Mar Q4 - Jun Rand value of
capital budget
allocation (at
project level)
R 111 783 000
Rand value of operating
budget allocation (at
project level)
R 1 498 335 000
4.3.3. Establishment of
a Disaster Management
Advisory Forum and
approved terms of
reference for 2
technical task teams
Wilfred
Mkhwanazi
% 100% 25.00 50.00 75.00 100.00
4.3.4. Establish,
implement and
approve a corporate
disaster management
plan
Wilfred
Mkhwanazi
% 100% 10.00 25% 100.00 100.00
4.3.5. Educate and
create awareness in
identified high risk
informal settlements
Wilfred
Mkhwanazi
Number 20 5.00 10.00 15.00 20.00
R 3,000,000
4.3.5.1 Disaster
Operational
Wilfred
Mkhwanazi
% 100%
implementation of
Plan
30 50 80 100
R 15,736,588
4.3.5.2 Emergency
Control Operational
Vincent Ngubane % 100%
implementation of
Plan
30 50 80 100
R 28,661,917
4.4. To reduce the
incidence and severity of
fire and other
emergencies
Mark Te Water 4.4.1. Manage vehicle
fleet to adequately
protect risks within
area of jurisdiction
Lance Ravidutt % 100% 0.00 0.00 0.00 100.00
R 2,700,000 R 45,969,283
4.4.2. Host educational
school visits to Fire and
Emergency service
Headquarters
Enock Mchunu Number 150 20 40 100 150
4.4.3. Conduct Fire
safety Education in
schools in the EMA
Alex Gloster Number 120 30 60 90 120
4.4.4. Erect bases from
which to deliver fire
and emergency
services to
inadequately protected
areas in the Western
and Southern regions
of the EMA
Lance Ravidutt % (2 bases - 1
southern and
1 western)
100% 50% 75% 100% 100%
R 24,515,000
37

Plan 4: Fostering a Socially Equitable Environment
Plan Owner: Dr Musa Gumede
National Key Performance Areas Strategic
Focus Area
Programme Programme
Driver
Project Project Manager Unit Of
Measure
Annual Target Q1 - Sep Q2 - Dec Q3 - Mar Q4 - Jun Rand value of
capital budget
allocation (at
project level)
R 111 783 000
Rand value of operating
budget allocation (at
project level)
R 1 498 335 000
4.4.5. Complete Phase
2 of the Ethekwini Fire
Training Centre
Alex Gloster % 100% 5 15 80 100
R 6,975,000
4.4.6. Conduct a
comprehensive Fire
Safety Inspection of all
high risk occupancies
at least once in every
12 month period
Senior Manager:
Fire Safety
Number 200 50 100 150 200
R 882,000
4.4.7. Appoint a
competent service
provider to extract and
correlate historical
statistical data on
which strategic
decisions affecting the
units targeted
outcomes can be
realized
Mark Te Water % 100 30 70 90 100
R 900,000
4.4.7.1Fire &
Emergency Operational
Mark Te Water % 100%
implementation of
Plan
30 50 80 100
R 206,960,737
4.5. Ensure the safety
and security of
municipal councillors,
officials and municipal
assets
Dumisani Bhengu 4.5.1. Plan and
execute protection
services for councillors
and employees
Dumisani Bhengu % 100% 25.00 50.00 75.00 100.00
4.5.1.1 Security
Management new
facility
Dumisani Bhengu % 100% 25.00 50.00 75.00 100.00
R 9,972,000
38

Plan 4: Fostering a Socially Equitable Environment
Plan Owner: Dr Musa Gumede
National Key Performance Areas Strategic
Focus Area
Programme Programme
Driver
Project Project Manager Unit Of
Measure
Annual Target Q1 - Sep Q2 - Dec Q3 - Mar Q4 - Jun Rand value of
capital budget
allocation (at
project level)
R 111 783 000
Rand value of operating
budget allocation (at
project level)
R 1 498 335 000
4.5.3. Reduction in the
number of
contraventions in
terms of the Security
Management
Framework or
Reduction of the
Deficiency Ratio
Develop the Human
Resources capacity and
capability.
Dumisani Bhengu Number 45 450 375 250 45
4.5.2. Implementation
of the Municipal Land
Invasion Policy for all
reports received
Dumisani Bhengu % 100% 25.00 50.00 75.00 100.00
R 13,428,400
4.5.2.1 Security
Management
Operational
Dumisani Bhengu % 100% 25.00 50.00 75.00 100.00
R 39,786,326
Promote the
Health of
Citizens
4.6 Accountable
effective & efficient
administration
Dr. Gxagxisa 4.6.1 Develop a
standardised record
management System
Dolly Nkosi Percent 100 0 30 70 100
4.7 Mass mobilisation for
better health
4.7.1 Establish and
implement school
health services
Busi Grootboom Number 3 0 1 2 3
4.7.2 Establish and
implement ward based
outreach PHC teams
Busi Grootboom Number 3 0 1 2 3
4.7.2.1 Clinic Projects. Busi Grootboom Percent 100%
implementation of
Plan
30 60 90 100
R 28,912,000
4.7.3 Operation
Sukuma Sakhe
Zinhle Buthelezi Percent 80 80 80 80 80
4.8 Provide services of
high quality in line with
set norms and standards
4.8.1 Improve
operational efficiency
in clinics
Vijay Naidoo Percent 95 75 80 90 95
4.8.2 Improve clinic
compliance National
Core Standards (NCS)
Zinhle Buthelezi Number 59 5 5 5 59
4.9 Enhance
Environmental Health
Service Delivery
4.9.1 Develop a 5 year
air quality
management plan
(AQMP)
Neil Larrat Number 1 0 0 0 1
R 1,350,000 R 18,143,326
4.9.2 Conduct a
benzene study in one
high risk area.
Neil Larrat Number 1 0 0 0 1
4.9.3 Institute a
hearing conservation
programme in the taxi
industry
Neil Larrat Number 1 0 0 0 1
39

Plan 4: Fostering a Socially Equitable Environment
Plan Owner: Dr Musa Gumede
National Key Performance Areas Strategic
Focus Area
Programme Programme
Driver
Project Project Manager Unit Of
Measure
Annual Target Q1 - Sep Q2 - Dec Q3 - Mar Q4 - Jun Rand value of
capital budget
allocation (at
project level)
R 111 783 000
Rand value of operating
budget allocation (at
project level)
R 1 498 335 000
4.10 Reduce burden of
HIV and AIDS and TB
4.10.1 Initiate 25000
HIV positive eligible
clients on ARVs
Dr Ngomane Number 25,000 5000 10000 18000 25000
R 2,895,652
4.10.2 Improve TB
programme
performance
Dr Ngomane Percent 77 75 76 76 77
4.11 Early provision of
basic antenatal care for
pregnant women
4.11.1 Increase the
percentage of
pregnant women
visiting clinic in the
first trimester of
pregnancy
Vijay Naidoo Percent 40 33 35 37 40
4.12 Strengthen disease
surveillance and vector
control services
4.12.1 Institute a
Sexually Transmitted
Infection Surveillance
Programme
Dr Ayo Number 1 0 0 0 1
4.12.2 Reduce rodent
infestation in the EMA
Dr Ayo Number 7 0 0 2 4
4.12.2.1 Health
Operational
Dr. Gxagxisa Number 7 0 0 2 4
R 429,138,877
TOTAL R 111,783,000 R 1,498,335,000
40

Plan 5: Creating a Platform for Growth, Empowerment and Skills Development
Plan Owner: Dumisile Nene
National Key Performance Area Strategic
Focus Area
Programme Programme
Driver
Project Project Manager Unit Of Measure Annual Target Q1 Target -
Sept 2013
Q2 Target -
Dec 2013
Q3 Target -
Mar 2014
Q4 Target -
June 2014
Rand value of
capital budget
allocation (at
project level)
R 13 172 000
Rand value of
operating budget
allocation (at project
level)
R 368 196 000
Munic
ipal
Inst
ituti
onal
Develo
pm
ent
and
Tra
nsf
orm
ati
on
Hum
an c
apit
al
develo
pm
ent
5.1. Establishing a credible
institutional mechanism for
skills planning
Head: Skills
Development
5.1.1. Establish a multi-
stakeholder forum that
addresses the skills needs
and training provision for
economic sectors within the
EMA
Head: Skills Development Percentage Concept document
approved, draft MOA's
20.00 50.00 70.00 100 R 300,000
5.1.2. Establish a multi-unit
forum within eThekwini
Municipality that addresses
employees skills needs and
training provision.
Head: Skills Development Percentage Concept document
approved, signed MOA's
20.00 50.00 70.00 100 R 100,000
5.2. Increasing
occupationally-directed
learning opportunities in
the workplace
Head: Skills
Development
5.2.1. Establish and
maintain programmes to
provide access to
Learnerships, Skills
programmes, Apprentice-
ships & Scarce Skills
Thomas Mketelwa Percentage 6 interventions
established and
implemented
20.00 40.00 80.00 100 R 6,127,611
5.3. Addressing access to
occupationally -directed
programmes through the
Co-operative Education
Policy
5.3.1. Establish and
maintain programmes to
provide access to In-service
Training, Internships and
Work Experience
Thomas Mketelwa Percentage Continue implementing
3 co-operative
education programmes
50.00 70.00 90.00 100 R 16,874,240
5.4. Addressing the low
level of youth and adult
language and numeracy
skills
Head: Skills
Development
5.4.1. Facilitate the
provision of language,
literacy and numeracy skills
to employees
Mandla Mthethwa Percentage 7 programmes 30.00 50.00 80.00 100 R 4,088,000
5.4.2. Facilitate the
provision of Adult Education
& Training for community
members in line with DoE
plans
Thomas Mketelwa Percentage Maintenance of 4
existing centres and
establishment of 4 new
centers
50.00 60.00 90.00 100 R 138,260
5.5. Encouraging better use
of workplace-based skills
development
Head: Skills
Development
5.5.1. Facilitate and co-
ordinate the Workplace
Skills planning in the
municipality
Head: Skills Development Percentage Annual Workplace
Skills Plan & Annual
Training Report
10.00 30.00 70.00 100 R 6,705,541
5.5.2. Credible and quality
worker skills development,
education and training
programmes
Head: Skills Development Percentage Co-ordintaion and
facilitation of training
interventions reflected
in the WSP
25.00 50.00 75.00 100 R 16,174,250
5.6. Encouraging and
supporting cooperatives,
small enterprises, worker
initiated, NGO and
community training
initiatives
Head: Skills
Development
5.6.1. Support relevant Unit
initiatives with NGO,
community and worker-
initiated skills development
and training programmes
Thomas Mketelwa Percentage 10 Programmes 30.00 40.00 80.00 100 R 502,500
5.7. Increasing public
sector capacity for
improved service delivery
and supporting the building
of a developmental state
Head: Skills
Development
5.7.1. Develop and
implement a skills plan for
Councillors
Belinda Mhlongo Percentage Skills Plan for
Councillors Developed
10.00 35.00 70.00 100.00 * R 3,238,278
41

Plan 5: Creating a Platform for Growth, Empowerment and Skills Development
Plan Owner: Dumisile Nene
National Key Performance Area Strategic
Focus Area
Programme Programme
Driver
Project Project Manager Unit Of Measure Annual Target Q1 Target -
Sept 2013
Q2 Target -
Dec 2013
Q3 Target -
Mar 2014
Q4 Target -
June 2014
Rand value of
capital budget
allocation (at
project level)
R 13 172 000
Rand value of
operating budget
allocation (at project
level)
R 368 196 000
5.7.2. Develop and
implement a skills plan for
Ward Committees
Hlengiwe Twala Percentage Skills Plan for Ward
Committees Developed
10.00 35.00 70.00 100 R 2,104,878
5.8. Building career and
vocational guidance
Head: Skills
Development
5.8.1. Provide resources to
support career and
vocational guidance
Thomas Mketelwa Percentage Support 3 Career
development
exhibitions
40.00 50.00 80.00 100 R 240,000
Develo
p
the C
ity a
s
a learn
ing
Cit
y
5.9. Develop the City as a
Smart City
Jacquie Subban 5.9.1. Promote a digitally
inclusive city
Emmanuel Pillay Percentage 20 Municipal Offices
connected via Fibre
network
25.00 50.00 75.00 100.00 R 5,130,000
5.10. Improve knowledge
management in the
Municipality
Jacquie Subban 5.10.1. MILE Capacity
Enhancement Project
Sogen Moodley Number Hosting of 4
management seminars
and 4 Master Classes &
1 Cllr Seminar
2.00 4.00 5.00 9.00 R 3,331,886
5.10.2. MILE Municipal
Technical Support Project
Number Successful Technical
Support of Two African
municipalities
0.00 0.00 1.00 2.00
5.10.3. Academic
Collaboration Project
Number Hosting of 2 Joint Built
Envt Seminars & 4
Guest Lectures
1.00 2.00 4.00 6.00
5.10.4. Internal Municipal
Knowledge Management
Project
Number At least ONE new MILE
publication
successfully launched
and FOUR CoPs
1.00 2.00 3.00 5.00 R 530,000
5.10.5. Learning
Partnerships Facilitation
Number Publication of FOUR
Learning NOTES from
INTERNATIONAL MILE-
supported learning
events
1.00 2.00 3.00 4.00
Healthy and
Productive
Employees
5.11 Implementation of HR
projects
Pam Matthias 5.11.1 Develop and
implement strategic
intervention to address the
three (3) key outcomes
arising from the Internal
Perception Study.
Pam Matthias Percentage 100% 25 50 75 100 -
5.11.2 Implement the
Succession Planning and
Talent Management
framework
Gideon Vundla Percentage 100% Achievement of
the targets per the
Talent management
and succession
planning project plan
30% 55 80 100 -
5.11.3 Create an integrated
HR system to provide for
accurate and timeous
remuneration of employees
and enable management to
effectively manage their
human resources
Raj Moodley Percentage 100% 15 35 75 100 -
5.11.4 Develop and
implement an electronic
recruitment system that
will provide a professional
and cost effective
recruitment process with
improved turn around time
Cyril Mkhwanazi Percentage 100% 50 100 100 100 - R 477,848
42

Plan 5: Creating a Platform for Growth, Empowerment and Skills Development
Plan Owner: Dumisile Nene
National Key Performance Area Strategic
Focus Area
Programme Programme
Driver
Project Project Manager Unit Of Measure Annual Target Q1 Target -
Sept 2013
Q2 Target -
Dec 2013
Q3 Target -
Mar 2014
Q4 Target -
June 2014
Rand value of
capital budget
allocation (at
project level)
R 13 172 000
Rand value of
operating budget
allocation (at project
level)
R 368 196 000
5.12 To create processes of
employment
transformation through
corrective legislation
Bafana Mkhize 5.12.1 Develop AA measures Bafana Mkhize Percentage AA measures
developed
15% 30% 50% 75%
5.12.2 Create and Develop
EE Committees
Percentage Terms of reference for
the committees
drafted
15% 30% 45% 70%
5.12.3 Implementing EE
profiling System
Percentage EE profiling system
developed
15% 25% 40% 70%
5.12.4 Creating Units EE
Plans Development Process
Percentage EE plans developed 10% 20% 40% 50%
5.12.5 Creating EE statistics
as System of Records
Percentage Quarterly statistics
produced
30% 45% 60% 75%
5.12.6 Creating and
Developing EE Training
Manual
Percentage Draft Manual produced 10% 20% 30% 40%
5.12.7 Developing Disability
Training Module
Percentage Module developed 10% 30% 45% 55%
5.12.8 Develop Council-wide
EE Plan
Percentage Council EE plan
developed
15% 30% 45% 55%
5.13. Reduce new HIV/AIDs
infections in the workplace
Stanley Naraidu 5.13.1. Implementation of a
Municipal-wide Wellness
Programme
Stanley Naraidu Number 80 wellness projects 20 30 50 80
5.13.2. Peer Educator
Training Programme
Number- annual
target
80 peer educators
trained
0 0 0 80
5.13.3. HIV Counselling and
testing programme
Number 80 HIV counselling and
testing projects
20 30 50 80
5.14. Be compliant with
occupational health and
safety legislation
Stanley Naraidu 5.14.1. Occupational Health
Medical Surveillance
Stanley Naraidu Number 10 000 Periodic
Medicals
2500 5000 7500 10000 R 1,080,000
5.14.2. Occupational;
Hygiene Baseline
Assessments
Fathima Suleman Number 48 occupational
hygiene assessments
12 24 36 48
5.14.3. Injury on Duty
Management
Meshack Ndlovu Number Accident prevention
Health and Safety
Inspections
(550)/Audits (340)/
BEE Contractors (100)
247 494 741 988 R 13,064,316
SUB-TOTAL R 6,210,000 R 98,495,691
GENERAL SUPPORT SERVICES R 6,962,000 R 269,700,309
TOTAL R 13,172,000 R 368,196,000
R 455,437
R 24,042,646
43
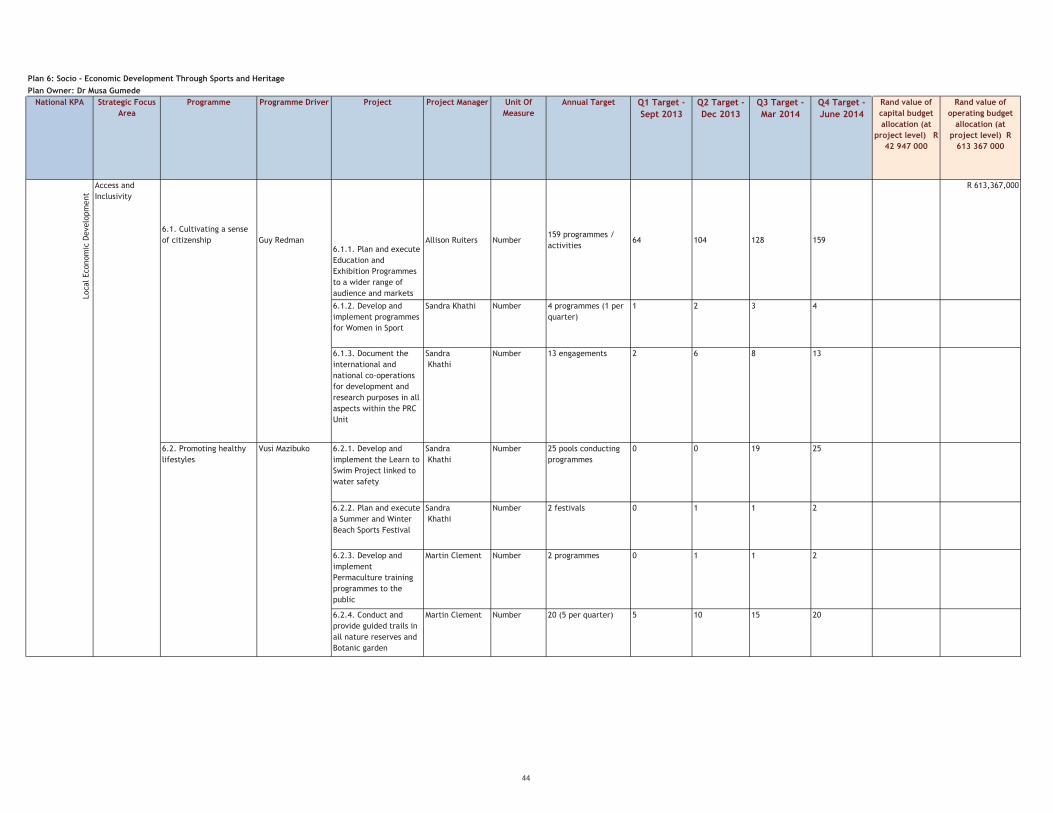
Plan 6: Socio - Economic Development Through Sports and Heritage
Plan Owner: Dr Musa Gumede
National KPA Strategic Focus
Area
Programme Programme Driver Project Project Manager Unit Of
Measure
Annual Target Q1 Target -
Sept 2013
Q2 Target -
Dec 2013
Q3 Target -
Mar 2014
Q4 Target -
June 2014
Rand value of
capital budget
allocation (at
project level) R
42 947 000
Rand value of
operating budget
allocation (at
project level) R
613 367 000
Local Econom
ic D
evelo
pm
ent
Access and
Inclusivity
6.1. Cultivating a sense
of citizenship Guy Redman6.1.1. Plan and execute
Education and
Exhibition Programmes
to a wider range of
audience and markets
Allison Ruiters Number159 programmes /
activities64 104 128 159
R 613,367,000
6.1.2. Develop and
implement programmes
for Women in Sport
Sandra Khathi Number 4 programmes (1 per
quarter)
1 2 3 4
6.1.3. Document the
international and
national co-operations
for development and
research purposes in all
aspects within the PRC
Unit
Sandra
Khathi
Number 13 engagements 2 6 8 13
6.2. Promoting healthy
lifestyles
Vusi Mazibuko 6.2.1. Develop and
implement the Learn to
Swim Project linked to
water safety
Sandra
Khathi
Number 25 pools conducting
programmes
0 0 19 25
6.2.2. Plan and execute
a Summer and Winter
Beach Sports Festival
Sandra
Khathi
Number 2 festivals 0 1 1 2
6.2.3. Develop and
implement
Permaculture training
programmes to the
public
Martin Clement Number 2 programmes 0 1 1 2
6.2.4. Conduct and
provide guided trails in
all nature reserves and
Botanic garden
Martin Clement Number 20 (5 per quarter) 5 10 15 20
44
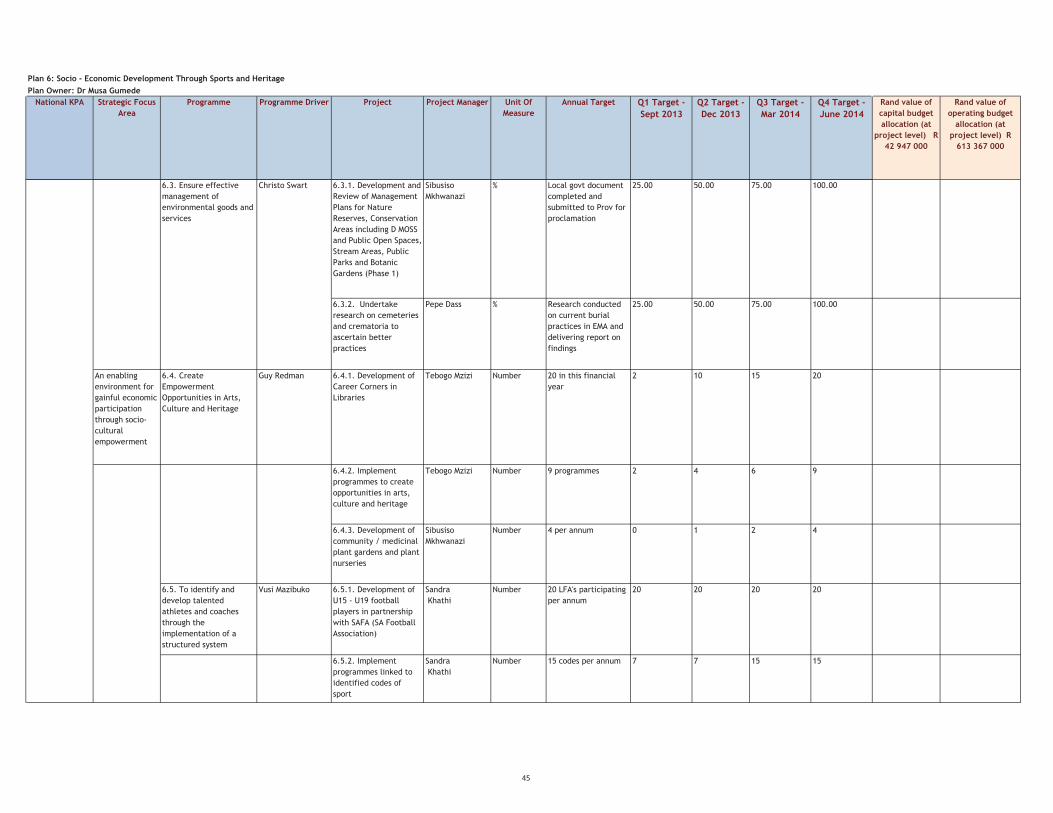
Plan 6: Socio - Economic Development Through Sports and Heritage
Plan Owner: Dr Musa Gumede
National KPA Strategic Focus
Area
Programme Programme Driver Project Project Manager Unit Of
Measure
Annual Target Q1 Target -
Sept 2013
Q2 Target -
Dec 2013
Q3 Target -
Mar 2014
Q4 Target -
June 2014
Rand value of
capital budget
allocation (at
project level) R
42 947 000
Rand value of
operating budget
allocation (at
project level) R
613 367 000
6.3. Ensure effective
management of
environmental goods and
services
Christo Swart 6.3.1. Development and
Review of Management
Plans for Nature
Reserves, Conservation
Areas including D MOSS
and Public Open Spaces,
Stream Areas, Public
Parks and Botanic
Gardens (Phase 1)
Sibusiso
Mkhwanazi
% Local govt document
completed and
submitted to Prov for
proclamation
25.00 50.00 75.00 100.00
6.3.2. Undertake
research on cemeteries
and crematoria to
ascertain better
practices
Pepe Dass % Research conducted
on current burial
practices in EMA and
delivering report on
findings
25.00 50.00 75.00 100.00
An enabling
environment for
gainful economic
participation
through socio-
cultural
empowerment
6.4. Create
Empowerment
Opportunities in Arts,
Culture and Heritage
Guy Redman 6.4.1. Development of
Career Corners in
Libraries
Tebogo Mzizi Number 20 in this financial
year
2 10 15 20
6.4.2. Implement
programmes to create
opportunities in arts,
culture and heritage
Tebogo Mzizi Number 9 programmes 2 4 6 9
6.4.3. Development of
community / medicinal
plant gardens and plant
nurseries
Sibusiso
Mkhwanazi
Number 4 per annum 0 1 2 4
6.5. To identify and
develop talented
athletes and coaches
through the
implementation of a
structured system
Vusi Mazibuko 6.5.1. Development of
U15 - U19 football
players in partnership
with SAFA (SA Football
Association)
Sandra
Khathi
Number 20 LFA's participating
per annum
20 20 20 20
6.5.2. Implement
programmes linked to
identified codes of
sport
Sandra
Khathi
Number 15 codes per annum 7 7 15 15
45
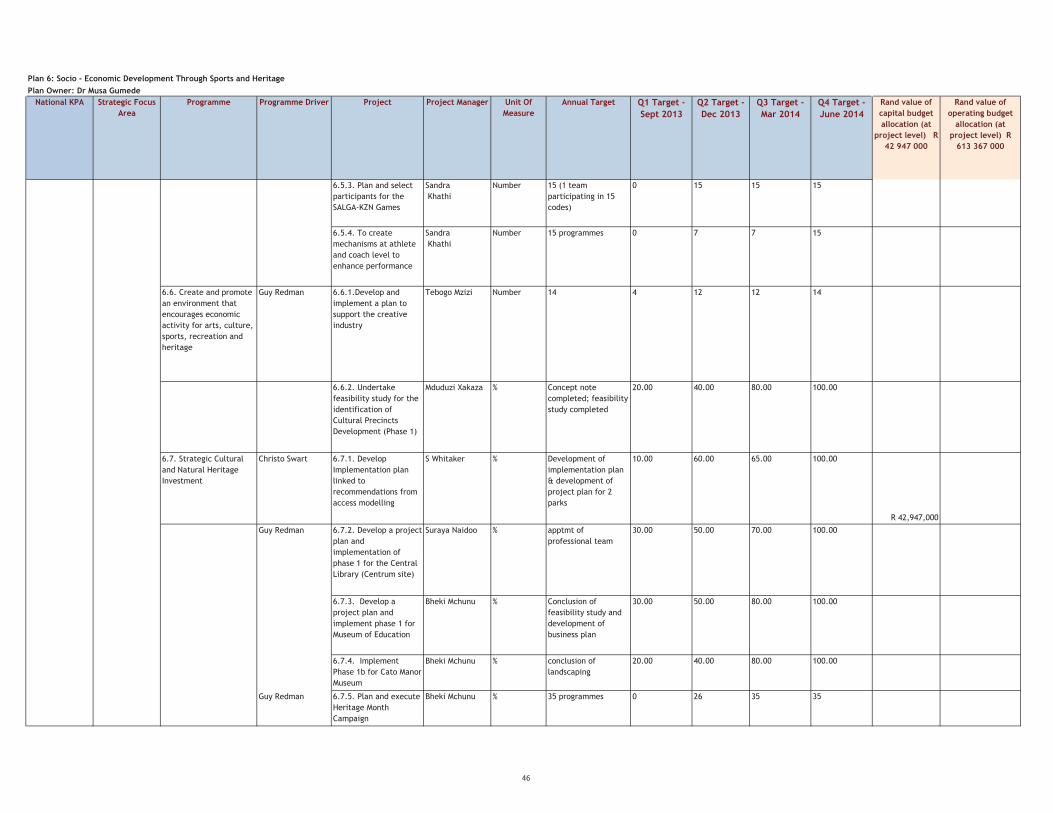
Plan 6: Socio - Economic Development Through Sports and Heritage
Plan Owner: Dr Musa Gumede
National KPA Strategic Focus
Area
Programme Programme Driver Project Project Manager Unit Of
Measure
Annual Target Q1 Target -
Sept 2013
Q2 Target -
Dec 2013
Q3 Target -
Mar 2014
Q4 Target -
June 2014
Rand value of
capital budget
allocation (at
project level) R
42 947 000
Rand value of
operating budget
allocation (at
project level) R
613 367 000
6.5.3. Plan and select
participants for the
SALGA-KZN Games
Sandra
Khathi
Number 15 (1 team
participating in 15
codes)
0 15 15 15
6.5.4. To create
mechanisms at athlete
and coach level to
enhance performance
Sandra
Khathi
Number 15 programmes 0 7 7 15
6.6. Create and promote
an environment that
encourages economic
activity for arts, culture,
sports, recreation and
heritage
Guy Redman 6.6.1.Develop and
implement a plan to
support the creative
industry
Tebogo Mzizi Number 14 4 12 12 14
6.6.2. Undertake
feasibility study for the
identification of
Cultural Precincts
Development (Phase 1)
Mduduzi Xakaza % Concept note
completed; feasibility
study completed
20.00 40.00 80.00 100.00
6.7. Strategic Cultural
and Natural Heritage
Investment
Christo Swart 6.7.1. Develop
Implementation plan
linked to
recommendations from
access modelling
S Whitaker % Development of
implementation plan
& development of
project plan for 2
parks
10.00 60.00 65.00 100.00
R 42,947,000
Guy Redman 6.7.2. Develop a project
plan and
implementation of
phase 1 for the Central
Library (Centrum site)
Suraya Naidoo % apptmt of
professional team
30.00 50.00 70.00 100.00
6.7.3. Develop a
project plan and
implement phase 1 for
Museum of Education
Bheki Mchunu % Conclusion of
feasibility study and
development of
business plan
30.00 50.00 80.00 100.00
6.7.4. Implement
Phase 1b for Cato Manor
Museum
Bheki Mchunu % conclusion of
landscaping
20.00 40.00 80.00 100.00
Guy Redman 6.7.5. Plan and execute
Heritage Month
Campaign
Bheki Mchunu % 35 programmes 0 26 35 35
46

Plan 6: Socio - Economic Development Through Sports and Heritage
Plan Owner: Dr Musa Gumede
National KPA Strategic Focus
Area
Programme Programme Driver Project Project Manager Unit Of
Measure
Annual Target Q1 Target -
Sept 2013
Q2 Target -
Dec 2013
Q3 Target -
Mar 2014
Q4 Target -
June 2014
Rand value of
capital budget
allocation (at
project level) R
42 947 000
Rand value of
operating budget
allocation (at
project level) R
613 367 000
6.7.6. Plan and execute
eThekwini Living
Legends
Bheki Mchunu Number 3 programmes (LL
Awards + 2 MILE
Seminars)
0 1 2 3
6.7.7. Plan and execute
National Liberation
Heritage Route
Bheki Mchunu Number 1 1 1 1 1
6.8 Preservation and
Management of Heritage
Assets
Guy Redman 6.8.1. Developing
collections management
mechanisms to address
the preservation and
management of
heritage assets
Allison Ruiters % 100% 15.00 30.00 70.00 100.00
TOTAL R 42,947,000 R 613,367,000
47
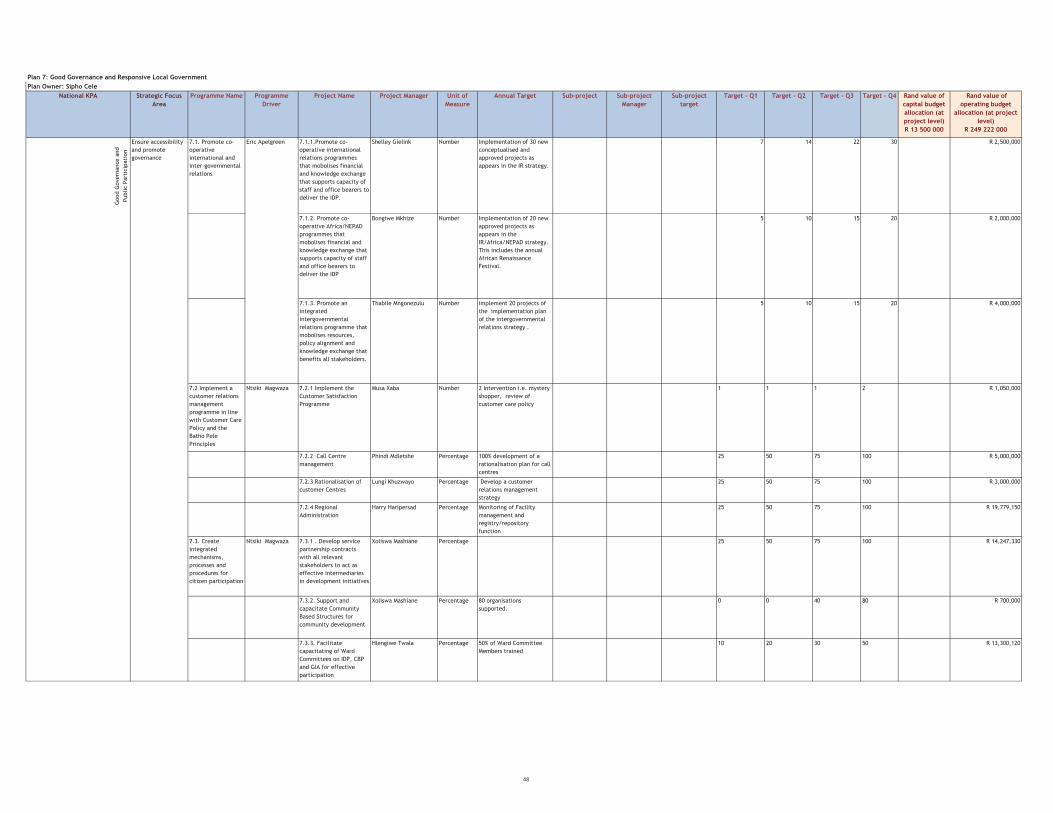
Plan 7: Good Governance and Responsive Local Government
Plan Owner: Sipho Cele
National KPA Strategic Focus
Area
Programme Name Programme
Driver
Project Name Project Manager Unit of
Measure
Annual Target Sub-project Sub-project
Manager
Sub-project
target
Target - Q1 Target - Q2 Target - Q3 Target - Q4 Rand value of
capital budget
allocation (at
project level)
R 13 500 000
Rand value of
operating budget
allocation (at project
level)
R 249 222 000
Good G
overn
ance a
nd
Public P
art
icip
ati
on
Ensure accessibility
and promote
governance
7.1. Promote co-
operative
international and
inter-governmental
relations
Eric Apelgreen 7.1.1.Promote co-
operative international
relations programmes
that mobolises financial
and knowledge exchange
that supports capacity of
staff and office bearers to
deliver the IDP.
Shelley Gielink Number Implementation of 30 new
conceptualised and
approved projects as
appears in the IR strategy.
7 14 22 30 R 2,500,000
7.1.2. Promote co-
operative Africa/NEPAD
programmes that
mobolises financial and
knowledge exchange that
supports capacity of staff
and office bearers to
deliver the IDP
Bongiwe Mkhize Number Implementation of 20 new
approved projects as
appears in the
IR/Africa/NEPAD strategy.
This includes the annual
African Renaissance
Festival.
5 10 15 20 R 2,000,000
7.1.3. Promote an
integrated
intergovernmental
relations programme that
mobolises resources,
policy alignment and
knowledge exchange that
benefits all stakeholders.
Thabile Mngonezulu Number implement 20 projects of
the implementation plan
of the intergovernmental
relations strategy .
5 10 15 20 R 4,000,000
7.2 Implement a
customer relations
management
programme in line
with Customer Care
Policy and the
Batho Pele
Principles
Ntsiki Magwaza 7.2.1 Implement the
Customer Satisfaction
Programme
Musa Xaba Number 2 Intervention i.e. mystery
shopper, review of
customer care policy
1 1 1 2 R 1,050,000
7.2.2 Call Centre
management
Phindi Mdletshe Percentage 100% development of a
rationalisation plan for call
centres
25 50 75 100 R 5,000,000
7.2.3 Rationalisation of
customer Centres
Lungi Khuzwayo Percentage Develop a customer
relations management
strategy
25 50 75 100 R 3,000,000
7.2.4 Regional
Administration
Harry Haripersad Percentage Monitoring of Facility
management and
registry/repository
function
25 50 75 100 R 19,779,150
7.3. Create
integrated
mechanisms,
processes and
procedures for
citizen participation
Ntsiki Magwaza 7.3.1 . Develop service
partnership contracts
with all relevant
stakeholders to act as
effective intermediaries
in development initiatives
Xoliswa Mashiane Percentage 25 50 75 100 R 14,247,330
7.3.2. Support and
capacitate Community
Based Structures for
community development
Xoliswa Mashiane Percentage 80 organisations
supported.
0 0 40 80 R 700,000
7.3.3. Facilitate
capacitating of Ward
Committees on IDP, CBP
and GIA for effective
participation
Hlengiwe Twala Percentage 50% of Ward Committee
Members trained
10 20 30 50 R 13,300,120
48

Plan 7: Good Governance and Responsive Local Government
Plan Owner: Sipho Cele
National KPA Strategic Focus
Area
Programme Name Programme
Driver
Project Name Project Manager Unit of
Measure
Annual Target Sub-project Sub-project
Manager
Sub-project
target
Target - Q1 Target - Q2 Target - Q3 Target - Q4 Rand value of
capital budget
allocation (at
project level)
R 13 500 000
Rand value of
operating budget
allocation (at project
level)
R 249 222 000
7.3.4. Adopt a municipal
wide events policy and
Implement a Municipal
plan for Municipal events
Sharm Maharaj Number Adopt the events policy
and Procedure and
implement 120 approved
events.
30 60 90 120 R 10,717,000
7.3.5. Co-ordinate
development of Ward
Plans to inform the IDP
and Budgeting processes
Hlengiwe Twala Number 50 developed Ward Plans 10 20 30 50 R 10,000,000
7.3.6. Create a platform
for communities to raise
their concerns regarding
government services and
to discuss social related
issues
Hlengiwe Twala 103 War Rooms launched. 40 60 80 103 R 25,300,000
7.3.7. Develop,
implement and support
Vulnerable Groups
Programmes to encourage
participation of
marginalized groups in
the local community,
including youth and
women
Theo Scott Percentage 100% implementation of
projects as per the
business plan
25 50 75 100 R 5,000,000
7.4. Effectively
communicate the
programmes and
policies of the
eThekwini
Municipality to the
full range of
audiences, both
internally and
externally.
Mandla Nsele 7.4.1. Implementation of
communication strategy
and policy
Sindi Mtolo Percentage 100% implementation of
plan
30 60 80 100 R 5,000,000
7.4.2. Maintain existing
and develop new
communication tools
Siphokazi
Mxinwa/Themba
Nyathikazi/ Sindi Mtolo
Number Maintain 9 Tools/Establish
1 New
9 9 9 10 R 7,500,000
7.4.3. Maintain the
Communications
Information resource
Centre (CIRC)
Siphokazi Mxinwa Percentage 100% implementation of
identified tools
100 100 100 100 R 8,000,000
7.4.4. Market the
municipality's
programmes and policies
in terms of the marketing
plan
Sindi Mtolo Percentage Marketing Plan developed
and 100% implemented
30 60 80 100 R 1,300,000
Create an efficient,
effective and
accountable
administration
7.5. Implement
systems, policies,
services and events
that enhance the
interface between
Council,
Administration &
Citizenry
Joseph David 7.5.1. Review, develop
and implement municipal
wide administration
policies and systems
Joseph David Percentage Policies adopted and
implemented
7.5.1.1 Develop
standing operating
procedures to
support Ward
Committees
Belinda Mhlongo Implemented
standing operating
procedures
20% 50% 85% 100% R 22,000,000
49

Plan 7: Good Governance and Responsive Local Government
Plan Owner: Sipho Cele
National KPA Strategic Focus
Area
Programme Name Programme
Driver
Project Name Project Manager Unit of
Measure
Annual Target Sub-project Sub-project
Manager
Sub-project
target
Target - Q1 Target - Q2 Target - Q3 Target - Q4 Rand value of
capital budget
allocation (at
project level)
R 13 500 000
Rand value of
operating budget
allocation (at project
level)
R 249 222 000
Percentage 7.5.1.2 Implement
and monitor
Councillor Support
Policy
Belinda Mhlongo Policy
implemented as
per operational
plan
20% 35% 55% 100% R 30,000,000
Percentage 7.5.1.3 Implement
and monitor
Corporate Gifts
Policy
Daniel Govender Policy
implemented as
per operational
plan
35% 50% 75% 100% R 250,000
Percentage 7.5.1.4 Implement
and monitor City
Stars Policy
Daniel Govender Policy
implemented as
per operational
plan
35% 50% 75% 100%
Percentage 7.5.5 Review
Travel Policy
Betty Moyo Policy submitted
for approval
15% 40% 75% 100% R 316,000
7.5.2. Municipal wide
Records Management
Betty Moyo Percentage Programme developed and
implemented as per
operational plan
20% 35% 65% 100% R 2,250,000
7.5.3. Enhance the
interface between
Council, Administration
and the Citizenry
Joseph David Percentage 100% implementation of
projects as per the
operational plans
7.7.5.1 Develop
and implement
best practice for
the provision of a
secretariat service
to Council and the
Administration
Adele Seheri Implemented
standing operating
procedures
25% 50% 75% 100% R 5,000,000
Percentage 7.5.3.2 Develop
capacity to
enhance the PAIA
Act
Joseph David Host 2 capacity
enhancement
workshops
0% 50% 50% 100% R 30,000,000
Percentage 7.5.3.3 Undertake
a feasibility study
for a new Council
Chamber and allied
facilities
Betty Moyo Feasibility report 15% 25% 65% 100%
Percentage 7.5.3.4 City Hall
Regeneration
Betty Moyo Implement 2
projects as per
operational plan
10% 20% 40% 100% R 11,250,000
7.5.4. Manage Office
Bearers' Programmes
Daniel Govender Percentage 100% implementation of
programmes as per the
operational plan
7.5.4.1 City Stars
Awards Programme
Daniel Govender Evaluation report 30% 40% 65% 100% R 795,000
Percentage 7.5.4.2 Senior
Citizens
Programme
Evaluation report 75% 95% 100% 100% R 15,000,000
Percentage 7.5.4.3 Mayor's
Awards Programme
Evaluation report 90% 100% 100% 100% R 1,102,400
Percentage 7.5.4.4 Disability
Programme
Evaluation report 35% 75% 90% 100%
Percentage 7.5.4.5 Vulnerable
Children
Programme
Evaluation report 35% 75% 90% 100%
Percentage 7.5.4.6 Mayor's
Golf Day
Evaluation report 100% 100% 100% 100% R 1,365,000
Percentage 7.5.4.7 Matric
Awards
Evaluation report 25% 50% 75% 100%
7.5.5. Enhance the
interface between the
Mayor's Office and the
Citizenry
Thabi Mfeka Percentage Establish advice desks as
per the operation plan
10% 20% 60% 100% R 5,000,000
TOTAL R 13,500,000 R 249,222,000
50

Plan 7: Good Governance and Responsive Local Government
Plan Owner: Sibusiso Sithole
National KPA Strategic
Focus Area
Programme Programme
Driver
Project Project
Manager
Unit Of Measure Annual Target Q1 Target - Sept
2013
Q2 Target -
Dec 2013
Q3 Target -
Mar 2014
Q4 Target -
June 2014
Rand value of capital
budget allocation (at
project level) R
106 290 000
Rand value of
operating budget
allocation (at
project level) R
887 268 000G
ood G
overn
ance
and P
ublic
Part
icip
ati
on
Cre
ate
an
eff
icie
nt,
eff
ecti
ve
and a
ccounta
ble
adm
inis
trati
on
7.6. Create a
clean and
accountable
organisation
Nhlanhla
Mthethwa
7.6.1. Provide an
effective forensic
investigative service
Percentage 60% Cases finalised
during the quarter are
finalised within 4
months after receipt
of complaint
60 60 60 60
R 110,300
7.6.2. Provide an
effective ombuds
service
Percentage 60% Cases finalised
during the quarter are
finalised within 4
months after receipt
of complaint
60 60 60 60
R 10,364,983
7.6.3. Implement an
anti-fraud policy and
a response plan in
terms of the Project
Plan
Percentage 60% implementation
of project plan
15 30 45 60
R 20,000
7.6.4. Implement a
code of ethics within
the Municipality in
terms of Project Plan
Percentage 15 Unit Meetings
addressed on the
Code of Ethics and
Code of Good
Administrative
Practice
3 7 11 15
R 50,000
7.6.5. Implement the
policy and response
plan in relation to
Whistle Blowing
Percentage 60% implementation
of project plan
15 30 45 60
R 36,500
7.6.6. Promotion of
Human Rights
throughout the EMA
Percentage Presentation on
human rights to 15
municipal wards
3 7 11 15
R 93,600
7.7. Mobilise to
make the
administration
more effective
Nkosinathi
Mhlongo
7.7.1. Implement the
Enterprise Wide Risk
Management plan in
the Municipality and
Entities
Number Develop and monitor
52 strategic and
operational risk
registers
50(develop and
monitor)
52(develop and
monitor)
52(monitor) 52(monitor)
R 3,881,120
7.7.2. Improve risk
awareness culture
Number 10 training and
awareness sessions
3 5 7 10
R 43,340
7.7.3. Standardise
real time ERM system
Number Implement and rollout
3 Cura system
enhancements
1 2 2 3
R 840,000
51

Plan 7: Good Governance and Responsive Local Government
Plan Owner: Sibusiso Sithole
National KPA Strategic
Focus Area
Programme Programme
Driver
Project Project
Manager
Unit Of Measure Annual Target Q1 Target - Sept
2013
Q2 Target -
Dec 2013
Q3 Target -
Mar 2014
Q4 Target -
June 2014
Rand value of capital
budget allocation (at
project level) R
106 290 000
Rand value of
operating budget
allocation (at
project level) R
887 268 000
7.7.4. Risk
measurement
Number Develop an monitor
key risk indicators on
top 5 risks
5 5 5 5
Phillip Ntsimane 7.7.5. Undertake
Internal Audits in
terms of approved
Audit Plan
Vusi Ndlovu Percentage 100% implementation
of the audits as per
plan15% 30% 70% 100%
R 19,072,935
7.7.6. Undertake
specialised audits as
may be required
Vusi Ndlovu Percentage All requests addressed
100% 100% 100% 100%
R 402,400
7.7.7. To monitor the
implementation of
the recommendations
by management
Vusi Ndlovu Percentage All recommendations
monitored
100% 100% 100% 100%
R 578,800
7.8. Monitor and
evaluate the
performance
processes of the
Municipality
Nirmala Govender 7.8.1 Monitor and
evaluate the
legislated
performance
information for the
Organisation and its
entities
Nevana
Srikissoon
Percentage 100% 20 45 80 100
R 1,898,234
7.8.2. Monitor and
review the Individual
Performance
Management (IPM)
system for senior
management not on
the HR Performance
system.
Sbu Dlamini Percentage 100% 37 53 72 100
R 1,423,675
7.8.3. Implement the
Performance
Management System
for all staff other
than Senior
Management
Sbu Dlamini Percentage 100% 25 50 75 100
R 1,237,556
7.8.4. Compilation of
Annual Report in
compliance with MSA
No.32 of 2000 and
MFMA No.56 of 2003.
Gonie
Dorasamy
Percentage 100% 50 90 99 100
R 1,898,234
52

Plan 7: Good Governance and Responsive Local Government
Plan Owner: Sibusiso Sithole
National KPA Strategic
Focus Area
Programme Programme
Driver
Project Project
Manager
Unit Of Measure Annual Target Q1 Target - Sept
2013
Q2 Target -
Dec 2013
Q3 Target -
Mar 2014
Q4 Target -
June 2014
Rand value of capital
budget allocation (at
project level) R
106 290 000
Rand value of
operating budget
allocation (at
project level) R
887 268 000
7.8.5. Monitor and
evaluate identified
operational areas of
municipal service
delivery
Orisha
Goorbhare
Percentage 100% 19 49 71 100
R 1,423,675
7.8.6. Review and
enhancement of
developed
applications
Rekha Singh Percentage 100% 29 65 88 100
R 1,898,234
7.8.7. Ensure
submission of
disclosure of interest
by all staff
Sbu Dlamini Percentage 100% 56.3 67.5 78.8 100
R 949,117
7.8.8. Analyse
disclosure of interest
data for compliance
Sbu Dlamini Percentage 100% 70 80 90 100
R 500,000
7.9. Create IT
mechanisms to
improve
efficiencies,
effectiveness &
accountability
and eliminate
wastage of
resources
Jacquie Subban 7.9.1. Stabilise ICT
Operations
Percentage Policies, structures,
procedures, templates
and guidelines in
place
20% 50% 80% 100%
R 5,130,000 R 186,820,102
7.9.2. Build enabling
ICT infrastructure
Percentage Reliable network with
broadband capacity,
well run data centres,
data management and
effective seat
management
20% 40% 75% 100%
R 55,503,000 R 44,409,300
7.9.3. Implement
municipal Information
Technology solutions
Percentage Implement 10
programmes that lead
to a more effective
delivery of services
20% 40% 65% 100%
R 26,946,000 R 35,391,600
7.9.4. Develop
municipal Information
Technology services
and information
Percentage Internet and intranet;
E-government
applications
20% 50% 80% 100%
R 9,621,000 R 2,000,000
53

Plan 7: Good Governance and Responsive Local Government
Plan Owner: Sibusiso Sithole
National KPA Strategic
Focus Area
Programme Programme
Driver
Project Project
Manager
Unit Of Measure Annual Target Q1 Target - Sept
2013
Q2 Target -
Dec 2013
Q3 Target -
Mar 2014
Q4 Target -
June 2014
Rand value of capital
budget allocation (at
project level) R
106 290 000
Rand value of
operating budget
allocation (at
project level) R
887 268 000
7.10. Improve
productivity,
efficiency and
effectiveness
throughout the
municipality
Maqhawe
Mthembu
7.10.1. Conduct
productivity
measurement
interventions and
develop standards of
performance
Number 31 projects dealing
with Methods and
Time studies in line
with standard times
5 13 22 31
R 12,554,244
7.10.2. Monitor
productivity for
continuous
improvements
Number Implement 3 projects
to monitor
productivity
0 1 2 3
R 1,214,927
7.10.3. Re-engineer
business processes
Number Implement 9 projects
to improve business
processes
1 3 6 9
R 3,644,781
7.10.4. Eliminate
Wastage of resources
Number 1 project to eliminate
waste
0 0 0 1
R 404,976
7.10.5. Develop
innovative ways of
service delivery
Number 1 innovation project 0 0 0 1
R 404,976
7.10.6. Undertake
strategic planning
projects to produce
outcomes based
organizational
structures
Number Roll out the
restructuring exercise
for 1 Cluster
0 0 0 1
R 404,976
7.10.7. Undertake
change management
interventions
Number 4 interventions
undertaken
1 2 3 4
R 1,619,903
7.10.8. Develop and
implement a values
and culture strategy
for the Municipality
Number Complete roll out of
values and cultures to
1 Cluster
0 0 0 1
R 404,976
SUB-TOTAL R 97,200,000 R 335,997,462
GENERAL SUPPORT SERVICES R 9,090,000 R 551,270,538
TOTAL R 106,290,000 R 887,268,000
54

Plan 8: Financially Accountable and Sustainable City
Plan Owner: Krish Kumar
National KPA Strategic
Focus Area
Programme Programme
Driver
Project Project
Manager
Sub Project Sub Project
Manager
Unit Of
Measure
Annual Target Q3 -
Mar
Actual for
Q3
Q3 Means Of
Verification
Q3 Evidence Target - Q1 Target - Q2 Target - Q3 Target - Q4 Capital budget
R 110 580 000
Operating budget
R 2 086 138 000
Munic
ipal
Fin
ancia
l Via
bilit
y
and M
anagem
ent
Str
ate
gic
and
Sust
ain
able
Budgeti
ng
8.1. Compile and
annually update the
City's Medium Term
Expenditure
Framework
Chris Nagooroo 8.1.1. Co-ordinate and
compile an Operating
Budget which is
sustainable and
affordable to the rate
payer/consumer
Kay Naidoo % Completion by 31
March
100.00 10 30 75 100
R 22,566,429
8.1.2. Co-ordinate and
compile a 3 year Capital
Budget which is
affordable and in line
with the financial
model/strategy
Kay Naidoo % Produce budget in
line with finance
model/strategy
100.00 10 30 75 100
R 8,091,105
8.2. Budget according
to IDP priorities
Chris Nagooroo 8.2.1. Provide support on
city's strategic budgeting
process
Kay Naidoo % Completion by 31
March
100.00 10 30 75 100
8.2.2. Alignment of
operating budget to the
IDP
Kay Naidoo % Operating budget
aligned to the IDP
100.00 10 30 85 100
8.3. Budget for
sustainability
Chris Nagooroo 8.3.1. Refine financial
model and update
projections
Kay Naidoo 8.3.1.1. Long Term Financial
Plan
Kay Naidoo % Review and update
Financial Model
100.00 25 50 100 100
8.3.2. Review Budget
Related Policies
Kay Naidoo 8.3.2.1. Accounting Policy Kay Naidoo % Revised policies
approved by Council
100.00 0 0 0 100
Jay Balwanth 8.3.2.2. Borrowing Framework
Policy and Guidelines
Jay Balwanth % Revised policies
approved by Council
100.00 100.00 Borrowing
Policy
0 0 0 100
Kay Naidoo 8.3.2.3. Budget Policy Kay Naidoo % Revised policies
approved by Council
100.00 100.00 Approved
Budget policy
available on
website
10 50 100 100
Peet Du Plessis 8.3.2.4. Credit Control and
Debt Collection Policy
Peet Du Plessis % Revised policies
approved by Council
100.00 10 50 100 100
Kay Naidoo 8.3.2.5. Funding and Reserves
Policy
Kay Naidoo % Revised policies
approved by Council
100.00 100.00 10 50 100 100
Peet Du Plessis 8.3.2.6. Indigent Policy Peet Du Plessis % 100% 100.00 10 50 100 100
Jay Balwanth 8.3.2.7. Investment
Framework Policy and
Guidelines
Jay Balwanth % 100% 100.00 100.00 Investment
Policy &
Framework
0 0 0 100
Peet Du Plessis 8.3.2.8. Rates Policy Peet Du Plessis % 100% 100.00 10 50 100 100
Kay Naidoo 8.3.2.9. Tariff Policy Kay Naidoo % Revised policies
approved by
Council
100.00 10 50 75 100
Kay Naidoo 8.3.2.10. Asset Management
Policy
Kay Naidoo % Revised policies
approved by Council
100.00 10 50 100 100
8.3.3. Monitoring of key
ratios
Yogeeta Rayan 8.3.3.1. Salaries & Wages as a
% of opex
Yogeeta Rayan % 30% 0.00 30 30 30 30
Yogeeta Rayan 8.3.3.2. Repairs &
Maintenance as a % of opex
Yogeeta Rayan % 7% 0.00 7 7 7 7
Yogeeta Rayan 8.3.3.3. Debt-Equity Ratio Yogeeta Rayan % 1:1 0.00 1:1 (100%)
8.4. Implementation
of Municipal Property
Rates Act
Keith Matthias 8.4.1. Compile
Supplementary Valuation
Rolls
Clive Munien Clive Munien Number 2 Supplementary
Rolls released
1.00 1 1 1 2
R 61,614,508
8.5. Reduce Council
Debts
Peet Du Plessis 8.5.1. Collection of
outstanding debts
Philile
Madonsela
8.5.1.1. % Collection Rate
Bulk Electricity
Philile
Madonsela
% 95% 95.00 95 95 95 95
Philile
Madonsela
8.5.1.2. % Collection Rate
Electricity
Philile
Madonsela
% 95% 95.00 95 95 95 95
Philile
Madonsela
8.5.1.3. % Collection Rate
Water
Philile
Madonsela
% 90% 90.00 90 90 90 90
Philile
Madonsela
8.5.1.4. % Collection Rate
Rates
Philile
Madonsela
% 95% 95.00 95 95 95 95
55

Plan 8: Financially Accountable and Sustainable City
Plan Owner: Krish Kumar
National KPA Strategic
Focus Area
Programme Programme
Driver
Project Project
Manager
Sub Project Sub Project
Manager
Unit Of
Measure
Annual Target Q3 -
Mar
Actual for
Q3
Q3 Means Of
Verification
Q3 Evidence Target - Q1 Target - Q2 Target - Q3 Target - Q4 Capital budget
R 110 580 000
Operating budget
R 2 086 138 000
8.6. Secure property
and property rights
necessary for capital
projects
Keith Matthias 8.6.1 Ensure capital
provision spend
Clive Munien Clive Munien % 100% spend of
capital provisions
35.00 0 5 20 100
R 5,130,000
Gro
w a
nd
div
ers
ify o
ur
revenues
8.7. Management of
Cluster Assets
Similo Mbongwe 8.7.1. Maintenance of
infrastructure and assets
at FMB, CBO and PBO,
including lifts, air-
conditioning, etc
Joy Andrews Joy Andrews % 100 %
Implementation
100.00 100 100 100 100
R 15,750,000 R 1,847,700
8.7.2 Verify all movable
assets for the cluster
Joy Andrews Joy Andrews % All assets verified
and asset registers
updated on a
quarterly basis
25 50 75 100
8.8. Develop and
implement a new
Billing System
Peet Du Plessis 8.8.1. Develop and
implement a new Billing
System
Peet Du Plessis 8.8.1.1. Billing System Peet Du Plessis % RMS Programme
implemented as per
project plan
100.00 30 50 80 100
R 40,000,000 R 53,533,648
8.9. Seek alternative
sources of funding
8.9.1. Borrowing /
Investment optimization
Jay Balwanth 8.9.1.1. External vs. internal
funding exercise
Jay Balwanth % Investment return to
be in line with
average NCD rate
100.00 75.00 100 100 100 100
R 792,705
8.10. Maximise
revenue from Council
properties
Keith Matthias 8.10.1. Grow property
sales income
Keith Matthias Keith Matthias R R15m 11.25 3.5m 7.5m R11m R15m
R 9,726,050
8.10.2. Grow property
lease income
Keith Matthias Keith Matthias R R180m 135.00 R45m R90m R135m R180m
R 28,356,845
Sound
financial
management
& reporting
8.11. Train staff on
the Credit Control &
Debt Management
Policy
Peet Du Plessis 8.11.1. Workshop the
Credit Control & Debt
Management Policy with
staff
% All staff trained 0.00 0 0 100 100
R 375,245,140
8.12. Investment
Management
Jay Balwanth 8.12.1. Review
Investment Policy
Ebrahim Seedat Ebrahim Seedat % Revised policy 0.00 100.00 Investment
Policy &
Framework
0 0 0 100
R 1,585,411
8.12.2. Review borrowing
for implementation of
capital programme
% Benchmark against
prevailing bond
rates
75.00 75.00 ABSA Loan at
indicative rate
of 8,69%
100 100 100 100
R 453,934,026
Administer the Pension
Fund for employees R 6,474,495
8.13. Asset & Liability
Insurance Cover
Jay Balwanth 8.13.1. Review of Self
Insurance Fund
Thulani Ntuli Thulani Ntuli % Timeous settlement
of all claims
75.00 100.00 S I R Policy 100 100 100 100
R 173,718,740
8.14. Deadline
Monitoring
Similo Mbongwe 8.14.1. Maintain and
update deadline
monitoring system
Patrick Chami Patrick Chami % Achievement of all
statutory deadlines
for Treasury Cluster
75.00 100 100 100 100
R 641,202
8.15. Completion of
Financial Statements
Sandile Mnguni 8.15.1. Submit financial
statements in compliance
with MFMA for the
previous financial year
Yogeeta Rayan 8.15.1.1. Submission of
eThekwini's AFS 2012/2013
Yogeeta Rayan % 31-Aug 100.00 100 100 100 100
R 42,349,683
8.15.2. Maintain accurate
and updated asset
register
Zama Cele Zama Cele % Compliant register 75.00 0 0 0 100
R 7,451,904
8.16. Payment of all
creditors and
verification of SCM
procedures
Chris Nagooroo 8.16.1. Systems and
procedures to ensure all
creditors paid within
legislated or contractual
deadlines
Tommy Hunt 8.16.1.1. Verification of SCM
compliance
Tommy Hunt % All creditors paid
within the legislated
time frames or per
their payment terms
100.00 100 100 100 100
R 41,795,826
8.17. Cash Control and
Management
Peet Du
Plessis(Peet to
confirm)
8.17.1. Effective cash
management
Thobeka
Ndwandwe
8.17.1.1. Banking and
reconciliation of cash on a
daily basis
Thobeka
Ndwandwe
% All Council revenue
accounted for
100.00 100 100 100 100
R 121,860,123
8.18 Effective,
efficient and
economical SCM
Themba Shezi 8.18.1 Contracts
Management
Sandile Ngcobo 8.18.1.1 Procurement
Scheduling
Sandile Ngcobo % Implementation of
contracts tracking
and scheduling
within JDE
100 100 100 100
R 47,821,055
56
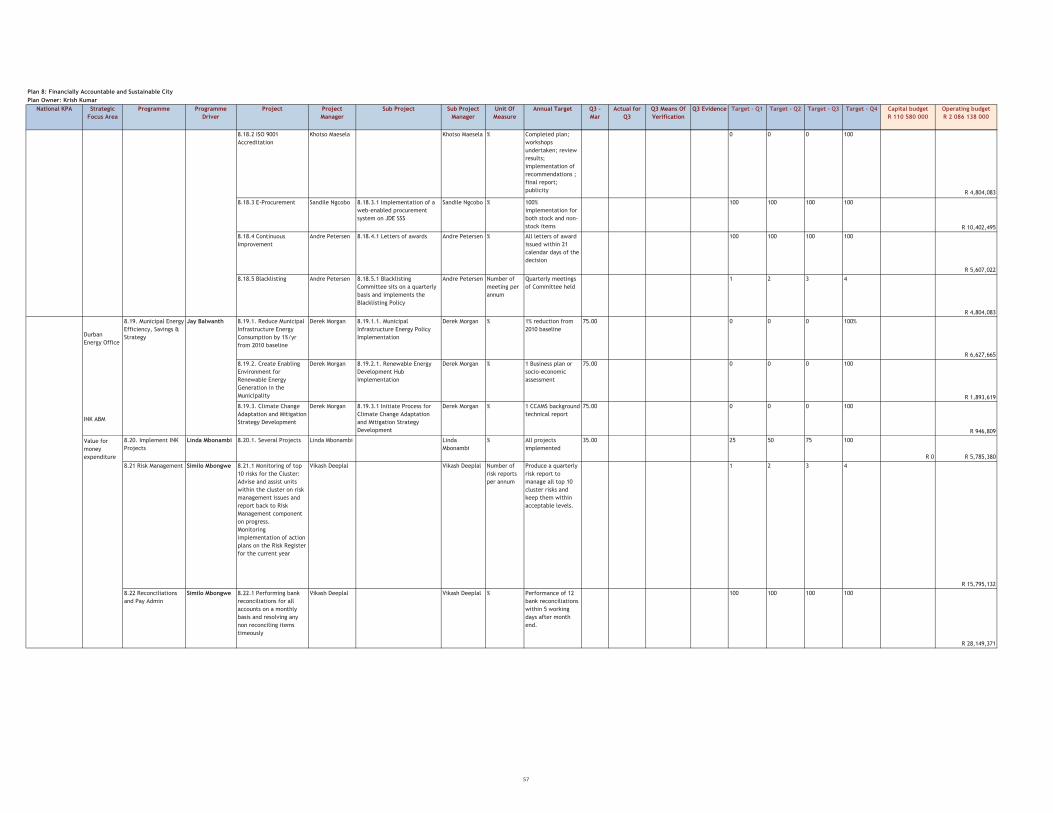
Plan 8: Financially Accountable and Sustainable City
Plan Owner: Krish Kumar
National KPA Strategic
Focus Area
Programme Programme
Driver
Project Project
Manager
Sub Project Sub Project
Manager
Unit Of
Measure
Annual Target Q3 -
Mar
Actual for
Q3
Q3 Means Of
Verification
Q3 Evidence Target - Q1 Target - Q2 Target - Q3 Target - Q4 Capital budget
R 110 580 000
Operating budget
R 2 086 138 000
8.18.2 ISO 9001
Accreditation
Khotso Maesela Khotso Maesela % Completed plan;
workshops
undertaken; review
results;
implementation of
recommendations ;
final report;
publicity
0 0 0 100
R 4,804,083
8.18.3 E-Procurement Sandile Ngcobo 8.18.3.1 Implementation of a
web-enabled procurement
system on JDE SSS
Sandile Ngcobo % 100%
implementation for
both stock and non-
stock items
100 100 100 100
R 10,402,495
8.18.4 Continuous
Improvement
Andre Petersen 8.18.4.1 Letters of awards Andre Petersen % All letters of award
issued within 21
calendar days of the
decision
100 100 100 100
R 5,607,022
8.18.5 Blacklisting Andre Petersen 8.18.5.1 Blacklisting
Committee sits on a quarterly
basis and implements the
Blacklisting Policy
Andre Petersen Number of
meeting per
annum
Quarterly meetings
of Committee held
1 2 3 4
R 4,804,083
Durban
Energy Office
8.19. Municipal Energy
Efficiency, Savings &
Strategy
Jay Balwanth 8.19.1. Reduce Municipal
Infrastructure Energy
Consumption by 1%/yr
from 2010 baseline
Derek Morgan 8.19.1.1. Municipal
Infrastructure Energy Policy
Implementation
Derek Morgan % 1% reduction from
2010 baseline
75.00 0 0 0 100%
R 6,627,665
8.19.2. Create Enabling
Environment for
Renewable Energy
Generation in the
Municipality
Derek Morgan 8.19.2.1. Renewable Energy
Development Hub
Implementation
Derek Morgan % 1 Business plan or
socio-economic
assessment
75.00 0 0 0 100
R 1,893,619
INK ABM
8.19.3. Climate Change
Adaptation and Mitigation
Strategy Development
Derek Morgan 8.19.3.1 Initiate Process for
Climate Change Adaptation
and Mitigation Strategy
Development
Derek Morgan % 1 CCAMS background
technical report
75.00 0 0 0 100
R 946,809
Value for
money
expenditure
8.20. Implement INK
Projects
Linda Mbonambi 8.20.1. Several Projects Linda Mbonambi Linda
Mbonambi
% All projects
implemented
35.00 25 50 75 100
R 0 R 5,785,380
8.21 Risk Management Similo Mbongwe 8.21.1 Monitoring of top
10 risks for the Cluster:
Advise and assist units
within the cluster on risk
management issues and
report back to Risk
Management component
on progress.
Monitoring
implementation of action
plans on the Risk Register
for the current year
Vikash Deeplal Vikash Deeplal Number of
risk reports
per annum
Produce a quarterly
risk report to
manage all top 10
cluster risks and
keep them within
acceptable levels.
1 2 3 4
R 15,795,132
8.22 Reconciliations
and Pay Admin
Similo Mbongwe 8.22.1 Performing bank
reconciliations for all
accounts on a monthly
basis and resolving any
non reconciling items
timeously
Vikash Deeplal Vikash Deeplal % Performance of 12
bank reconciliations
within 5 working
days after month
end.
100 100 100 100
R 28,149,371
57

Plan 8: Financially Accountable and Sustainable City
Plan Owner: Krish Kumar
National KPA Strategic
Focus Area
Programme Programme
Driver
Project Project
Manager
Sub Project Sub Project
Manager
Unit Of
Measure
Annual Target Q3 -
Mar
Actual for
Q3
Q3 Means Of
Verification
Q3 Evidence Target - Q1 Target - Q2 Target - Q3 Target - Q4 Capital budget
R 110 580 000
Operating budget
R 2 086 138 000
8.22.2 Performing payroll
administration duties:
Processing salary
payments and any other
related third party
payment transactions on
time.
Vikash Deeplal Vikash Deeplal Number of
recons
prepared
Perform monthly
Payroll
Reconciliations and
processing all salary
and statutory
payments on time in
line with
policies/legislation.
3 6 9 12
R 5,710,716
8.23 Effective and
efficient processes
Similo Mbongwe 8.23.1 Review of
Standards operating
procedures for Treasury
Cluster
Patrick Chami Patrick Chami Number of
departments
reviewed
4 departments
reviewed in the year
1 2 3 4
R 4,667,278
8.23.2 Undertaking of
Special Projects within
Treasury Cluster - to
improve service delivery
to other units
Patrick Chami Patrick Chami Number of
special
projects
completed
2 special projects to
be completed
within agreed
timeframes
0 1 1 2
R 13,065,560
8.24. Efficient Fleet
Management
Malcolm Joshua 8.24.1. Improve
effectiveness of
operations
Malcolm Joshua 8.24.1.1. Standardization of
vehicle fleet
Malcolm Joshua % 80% of vehicles
purchased in
accordance with the
vehicle replacement
programme
75.00 80% 80 80 80
R 29,000,000
8.24.2 Ensure that the
mechanical workshop
facilities are equipped to
manage the technological
advancements in the
automotive industry
Malcolm Joshua 8.24.2.1 Improvement of
workshops in terms of optimal
utilisation and service delivery
Malcolm Joshua % Upgrade workshop
tools and equipment
aligned to OEM
standards
25% 50 75 100
R 18,900,000
8.24.3 Maximising vehicle
availability to enhance
service delivery
capabilities of the
municipalities
Malcolm Joshua 8.24.3.1 Optimal availability
of fleet vehicles (excluding
buses)
Malcolm Joshua % 90% 90% 90 90 90
R 203,474,100
8.24.3.2 Optimal availability
of bus fleet
Malcolm Joshua % 90% 90% 90 90 90
R 253,478,950
8.24.4. Ensure maximum
utilization of vehicles
Malcolm Joshua 8.24.4.1. To achieve optimal
vehicle utilization and fleet
size
Malcolm Joshua % Conduct ongoing
vehicle utilisation
exercises
75.00 100 100 100 100
R 1,800,000 R 61,519,140
TOTAL R 110,580,000 R 2,086,138,000
58

DETAILED CAPITAL
BUDGET

CAPITAL BUDGET BY CLUSTER 2013 - 2016
Description Project No. Vote No. Ward No. BUDGET 2013/14 BUDGET 2014/15 BUDGET 2015/16
Rm Rm Rm
CAPITAL BUDGETS 5,432.146 5,767.074 6,441.880
HUMAN SETTLEMENTS AND INFRASTRUCTURE 4,753.608 4,865.577 5,504.139
HOUSING 789.306 707.587 1,327.400
NEW HOUSING-DOH (INCL Slums Clearance) 589.306 527.587 846.500
Amaoti - Angola H4001 1.70908.25200 53 8.000 0.000 14.400
Amaoti - Buffer Strip H4001 1.70908.25200 57 2.500 8.587 14.200
Amaoti - Geze'hlekisa H4001 1.70908.25200 53 3.000 10.000 15.000
Amaoti - Geneva H4001 1.70908.25200 57 10.000 12.000 8.600
Amaoti - Geze'hlekisa (Zimbabwe) H4001 1.70908.25200 53,57 10.000 0.000 0.000
Amaoti - Mozambique H4001 1.70908.25200 56,57 10.000 10.000 15.400
Amaoti - Palestine H4001 1.70908.25200 53.59 0.500 6.000 12.600
Amaoti - Tanzania H4001 1.70908.25200 53,57 10.000 10.000 14.400
Amaoti - Zambia H4001 1.70908.25200 57 10.000 10.000 4.600
Amatikwe Ph 2 & 3 H4001 1.70908.25200 56 3.000 10.000 14.600
Belvedere Extension H4001 1.70908.25200 61 15.000 10.000 4.500
Buffelsdraai H4001 1.70908.25200 59 5.000 10.000 12.800
Bux Farm H4001 1.70908.25200 103 1.000 10.000 10.900
Cato Crest Interface H4001 1.70908.25200 29,30,101 3.000 10.000 14.800
Cato Crest Insitu Upgrade H4001 1.70908.25200 30,101 15.000 10.000 10.900
Cato Crest Insitu Upgrade H4001 1.70908.25200 30,101 0.000 0.000 16.800
Chesterville H4001 1.70908.25200 24 10.000 10.000 14.600
Clermont Infill H4001 1.70908.25200 92 3.000 10.000 0.000
Cliffdale P1 H4001 1.70908.25200 103 10.000 10.000 8.400
Congo Ph 2 H4001 1.70908.25200 55,56 3.000 0.000 0.000
Cornubia Ph 1 H4001 1.70908.25200 102 15.000 0.000 0.000
Cornubia Ph 2 H4001 1.70908.25200 102 44.000 80.000 0.000
Cornubia Ph 3 H4001 1.70908.25200 102 0.000 0.000 35.800
Cornubia Ph 4 H4001 1.70908.25200 102 0.000 0.000 40.100
Cottonlands H4001 1.70908.25200 60 3.000 30.000 0.000
Ekwandeni H4001 1.70908.25200 7,91 3.000 0.000 0.000
Emapheleni H4001 1.70908.25200 22 2.900 0.000 0.000
Emaplazini H4001 1.70908.25200 43,44 2.000 0.000 20.000
Etafuleni Ph 1 H4001 1.70908.25200 53,56 15.000 0.000 0.000
Etafuleni Ph2 H4001 1.70908.25200 56 20.000 10.000 20.400
Folweni H4001 1.70908.25200 95,96 3.000 5.000 10.000
Greylands Ph 2 H4001 1.70908.25200 62 3.000 0.000 10.000
Gwalas Farm H4001 1.70908.25200 61 3.000 5.000 5.000
Hammarsdale Ext. H4001 1.70908.25200 4,6,7 3.000 5.000 18.500
Harmony Heights H4001 1.70908.25200 21 3.000 5.000 12.600
Inanda Africa H4001 1.70908.25200 44,55 3.000 10.000 15.000
Inanda Mission Reserve H4001 1.70908.25200 2,3,44,56 10.000 10.000 2.500
Jamaica H4001 1.70908.25200 34 2.500 0.000 0.000
Kenville H4001 1.70908.25200 34 3.000 10.000 10.000
Klaarwater Station H4001 1.70908.25200 16,63 4.500 0.000 0.000
KwaMashu J & K H4001 1.70908.25200 41,45 1.000 5.000 12.600
KwaManzi H4001 1.70908.25200 99 10.000 10.000 12.600
Lindokuhle H4001 1.70908.25200 62 3.000 0.000 0.000
Lovu 1 & 2 H4001 1.70908.25200 98 2.500 0.000 0.000
Lovu 259 H4001 1.70908.25200 98 3.000 0.000 0.000
Lower Langerfontein P2 H4001 1.70908.25200 9 5.000 0.000 0.000
Lower Thornwood Ph 1 H4001 1.70908.25200 13 3.000 0.000 0.000
Lower Thornwood Ph 2 H4001 1.70908.25200 13 10.000 0.000 0.000
Malundi Township H4001 1.70908.25200 99 2.000 10.000 10.000
Matamfana H4001 1.70908.25200 45 1.000 0.000 0.000
Molweni Upper H4001 1.70908.25200 9 3.500 0.000 0.000
Mophela Ph 1 H4001 1.70908.25200 5 2.500 0.000 0.000
Motala Farm H4001 1.70908.25200 61 3.000 0.000 0.000
Mona Sunhills H4001 1.70908.25200 61,62 3.000 20.000 15.000
Mpola Ph 3 H4001 1.70908.25200 15 3.000 0.000 0.000
Namibia Stop 8 H4001 1.70908.25200 44,55,56 3.000 0.000 0.000
Njobokazi H4001 1.70908.25200 7 3.000 0.000 0.000
Ntshongweni Ph 2 H4001 1.70908.25200 7 5.000 0.000 0.000
Ntuzuma C Ph 2 H4001 1.70908.25200 38,45 2.500 0.000 10.000
Redcliffe H4001 1.70908.25200 59,60 3.000 5.000 15.800
Redcliffe Ph 2 H4001 1.70908.25200 60 3.000 10.000 20.600
Richmond Farm A & B H4001 1.70908.25200 38,45 3.000 10.000 10.000
Rietvallei P1B H4001 1.70908.25200 1,4 3.000 0.000 0.000
Sandton Ph 2 H4001 1.70908.25200 12,14 3.000 0.000 0.000
Sandton Ph 4 H4001 1.70908.25200 12 3.000 0.000 0.000
59

CAPITAL BUDGET BY CLUSTER 2013 - 2016
Description Project No. Vote No. Ward No. BUDGET 2013/14 BUDGET 2014/15 BUDGET 2015/16
Rm Rm Rm
Sankontsha H4001 1.70908.25200 5 3.000 5.000 10.000
Sim Place H4001 1.70908.25200 34 3.000 10.000 15.600
Stockville H4001 1.70908.25200 10 3.000 0.000 0.000
Sunnyside Park (KwaManci Ward 96) H4001 1.70908.25200 67,96 2.500 30.000 35.200
Thambo Plaza H4001 1.70908.25200 55,57 15.000 5.000 0.000
Tshelimnyama Ph 4 H4001 1.70908.25200 15 3.000 0.000 0.000
Umbhayi H4001 1.70908.25200 61 3.000 15.000 0.000
Umlazi B10 H4001 1.70908.25200 77,79,82,83 10.000 20.000 0.000
Umlazi B8 H4001 1.70908.25200 80,81,82 13.000 5.000 10.000
Umlazi B8 H4001 1.70908.25200 80,81,82 0.000 0.000 12.500
Umlazi F11 H4001 1.70908.25200 79 3.000 6.000 10.600
Umlazi Infill H4001 1.70908.25200 80,82,83,85,87 5.000 5.000 40.800
Umlazi Infill Ph 2 H4001 1.70908.25200 83,87 3.500 5.000 20.000
Umlazi Infill Ph 3 H4001 1.70908.25200 78,80,85,86,88 0.000 5.000 15.600
Umlazi Infill Ph 4 H4001 1.70908.25200 77 2.500 5.000 12.600
Umlazi Infill Ph 5 H4001 1.70908.25200 80,81,87 2.000 5.000 13.600
Umlazi Infill Ph 5 P5249A 1.70908.25200 80,81,87 0.000 0.000 13.600
Umlazi Infill Ph 3 H4001 1.70908.25200 78,80,85,86,88 3.600 0.000 0.000
Umnini H4001 1.70908.25200 98,99 2.000 0.000 0.000
Woody Glen Ph 1 H4001 1.70908.25200 91 15.000 10.000 14.200
Woody Glen Rural Ph 1 H4001 1.70908.25200 91 2.500 0.000 12.800
Zamani P1B H4001 1.70908.25200 91 2.500 0.000 0.000
Lovu 259 (Platforms & Slabs) + Top Structures P5110 1.70908.25201 98 3.000 0.000 0.000
Welbedaght West (Construction of 56 houses) P5034 1.70908.25202 72 13.000 0.000 0.000
Ntuzuma D Ph 2 & 3 P5168 1.70908.25203 38,43 48.306 0.000 0.000
Etafuleni Phase 1 P5105 1.70908.25204 53,56 60.000 0.000 0.000
Umhlabunzima Ridge P5155 1.70908.25205 22 3.000 0.000 0.000
Tshelimnyama Phase 4 P5077 1.70908.25206 15 3.000 0.000 0.000
Land Acquisitions (Various) H4001 1.70908.25200 Various 0.000 0.000 95.400
HOSTELS Various Various Various 50.000 50.000 95.000
INFRASTRUCTURE Various Various Various 150.000 130.000 385.900
ENGINEERING 686.605 706.185 721.641
ARCHITECTURAL 24.300 30.600 27.900
Office Rationalisation C1347 1.70830.47610 Internal 18.000 24.300 0.000
Access for the Disabled P7362 1.70830.47610 Internal 5.400 5.400 0.000
Computerised project maint. sys. C0610 1.73505.47130 Internal 0.900 0.900 0.000
Inner City Regeneration 0.000 0.000 13.500
Priority Zones strategic development 0.000 0.000 9.000
Development of Old Fort campus 0.000 0.000 4.500
Old fort complex C2219 0.000 0.000 0.900
PROJECT MANAGEMENT UNIT 7.200 4.742 9.000
Integrated Infrastructure Asset P7193 1.72510.49600 Various 7.200 0.000 7.200
East Zone Hub P7371 1.73749.49213 Various 0.000 0.900 0.450
North Hub P7372 1.73749.45213 Various 0.000 1.350 0.450
Central Zone Hub P7373 1.73749.45213 Various 0.000 0.900 0.450
South Zone Hub P7374 1.73749.45213 Various 0.000 1.592 0.450
ROADS 561.688 634.843 644.439
Bellair Road Upgrade - Phase 2 P4149
1.72510.494
00 29,65,101 30.000 40.000 40.000
Northern Areas Road Upgrades P4150
1.72510.493
00 Various 112.500 130.500 81.000
Road Rehabilitation P3965
1.72510.493
00 Various 321.193 370.562 383.381
Phoenix Highway PT Priority P7276
1.72510.494
00 48,49,50,52 0.000 1.800 0.000
Larkspur Road Widening P6152
1.72510.493
00 25 0.239 0.000 0.000
Matheran Road Extension P4951 1.72510.49300 34 0.270 0.000 5.400
Phepheni Road Gravel P4669 1.72510.49300 38 0.000 1.800 0.000
Ekwandeni School Road P4671 1.72510.49300 7 0.000 2.070 0.000
Wandsbeck Road upgrade P7279 1.72510.49400 23,25 0.000 2.700 2.700
Fording bridge upgrade P4673 1.72510.49300 48 0.000 0.180 0.000
Swanvale Pic Road ext P4674 1.72510.49300 49 0.000 0.180 0.000
Deanmore Pic Access P4668 1.72510.49300 50 0.000 0.270 0.000
Shawham Place Turning T P4680 1.72510.49300 52 0.000 0.180 0.000
idube Road P4670 1.72510.49300 55 0.000 0.450 0.000
Honeysuckle Road Ext P4676 1.72510.49300 60 0.000 0.450 0.000
60

CAPITAL BUDGET BY CLUSTER 2013 - 2016
Description Project No. Vote No. Ward No. BUDGET 2013/14 BUDGET 2014/15 BUDGET 2015/16
Rm Rm Rm
Nqabeni Road P4683 1.72510.49300 93 0.000 0.360 0.000
Luganda - Upgrade Gravel roads P4677 1.72510.49300 13 0.000 0.450 0.000
Upgrade TRK 75192 - Sithundu P4679 1.72510.49300 14 0.000 1.080 0.000
Upgrade TRK 75101 P4682 1.72510.49300 14 0.000 0.450 0.000
Upgrade Dubazane Road P4672 1.72510.49300 17 0.000 0.540 0.000
Upgrade Road 47806 P4675 1.72510.49300 17 0.000 0.450 0.000
Upgrade Dua Road and Bheka Pl P4681 1.72510.49300 17 0.000 1.800 0.000
Ext. of Wood Road / Acle Road P4678 1.72510.49300 63 0.000 0.540 0.000
Upgrade Road 47823 P4686 1.72510.49300 17 0.000 0.450 0.000
Ext. Tividale Place Cowies Hill P4667 1.72510.49300 18 0.000 0.450 0.000
D403 Link to Verulam P4867 1.72510.49300 59 0.000 3.600 7.200
D403 Link Road Phase 3 P3518
1.72510.493
00 59 5.400 0.000 0.000
Hendon Road Upgrade P6878
1.72510.493
00 34 0.270 0.000 4.500
Wembley Road Upgrade P6879
1.72510.493
00 34 0.270 0.000 2.700
Vialis Place Widening / Sidewalk P6880
1.72510.493
00 25 0.360 0.000 0.000
Access to Lots 1031-1034 - KwaMashu P6881
1.72510.493
00 45 0.225 0.000 0.000
Widening of Cartmel Road P6882
1.72510.493
00 23 0.270 0.000 0.000
Constantine Road P6883
1.72510.493
00 25 0.900 0.000 0.000
Foreman Road P6884
1.72510.493
00 25 1.350 0.000 0.000
Ext. Dove Place P7296
1.72510.493
00 16 0.000 0.450 0.000
Luxmi Road P6886
1.72510.493
00 58 0.495 0.000 0.000
Kwa Dabeka Bus Routes P4966
1.72510.494
00 19 0.000 5.850 0.000
Glen Eagle Drive P6888
1.72510.493
00 36 0.405 0.000 0.000
Road access Lots 3012-3027 P7297
1.72510.493
00 23 0.000 0.450 0.000
Access Road 83887 P7298
1.72510.493
00 67 0.000 3.600 0.000
Access Road A907 P7299
1.72510.493
00 67 0.000 2.970 0.000
Pelican Terrace P6892
1.72510.493
00 60 0.225 0.000 0.000
Nkonka Road P6893
1.72510.493
00 45 0.900 0.000 0.000
Newlands Express (access to Linela) P6895
1.72510.493
00 37,38 1.620 0.000 0.000
Fisani Road P6896 1.72510.49300 42 0.540 0.000 0.000
Empusheni Road Phase 3 P4962 1.72510.49400 100 9.000 0.000 0.000
KwaDabeka Bus Route Phase 2 P4966 1.72510.49400 19 10.000 0.000 0.000
Access Road 29006- Lower Illovo P4878 1.72510.49400 98 0.000 0.900 0.000
Juniper Road - Umkomaas P4877 1.72510.49400 99 0.000 3.150 0.000
Dzana Road - Magabheni P4698 1.72510.49300 99 0.000 2.250 0.000
Blue Bonnet Crescent P4872 1.72510.49400 71 0.000 1.013 0.000
Minor Road Rd 108726 from Rd 108725 P4699 1.72510.49300 57 0.900 0.000 0.000
Road 910 Widening P4694 1.72510.49300 72 0.000 1.125 0.000
Road 707 Widening P4873 1.72510.49400 73 0.000 2.475 0.000
Access Road Road 1107 P4874 1.72510.49400 78 0.000 1.350 0.000
Nonoti Road P7307 1.72510.49400 1 0.000 3.150 0.000
Masomini Road P7308 1.72510.49400 8 0.000 3.600 0.000
Dryhoek Road P7309 1.72510.49400 3 0.000 3.780 0.000
Bhasobha Road P7310 1.72510.49400 4 0.000 3.420 0.000
Nozisha Access Road P4875 1.72510.49400 84 0.000 1.013 0.000
Upgrade Road 107949 P4160 1.72510.49400 2 0.000 0.900 0.000
Road Upgrade Ward 5 P4167 1.72510.49300 5 0.000 5.625 0.000
Mabuya Road Taxi Route P4697 1.72510.49300 55 2.970 3.600 0.000
Gumtree Avenue Trevenen Rd to Tower Rd (Veru) - new roadP4399 1.72510.49300 58 0.000 1.260 0.000
Route 3.1 Road Upgrade Phase 2 : Congo to D 403P4172 1.72510.49300 57 1.350 7.650 4.500
Upgrading gravel road - TRK 75221 - DassenhoekP6897 1.72510.49400 14 1.800 0.000 0.000
Upgrading gravel road - TRK 75116 - DassenhoekP6898 1.72510.49400 14 2.250 0.000 0.000
Upgrading gravel road - TRK 47057 - Demat P6903 1.72510.49400 17 3.150 0.000 0.000
Funda Rd - St Wendolins Township P6907 1.72510.49400 16,17 0.720 0.000 0.000
61

CAPITAL BUDGET BY CLUSTER 2013 - 2016
Description Project No. Vote No. Ward No. BUDGET 2013/14 BUDGET 2014/15 BUDGET 2015/16
Rm Rm Rm
Motala Rd- Motala Heights P6912 1.72510.49400 15 1.800 0.000 0.000
Access Road : Mphafa Road (Mnyenzane to Josiah Dlamini)P6926 1.72510.49400 78 1.908 0.000 0.000
Access Road : G1334, Inkongozelo, Mhlabunzima, F779P6927 1.72510.49400 79 1.193 0.000 0.000
Access Road B180 P6933 1.72510.49400 80 1.440 0.000 0.000
Access Road : M1297 P6941 1.72510.49400 83 0.855 0.000 0.000
Road 103717 "R" P6946 1.72510.49400 85 1.620 0.000 0.000
Ezimangweni Road P6951 1.72510.49400 93 3.600 0.000 0.000
Access Road to Sewula Pr Sch. Frm M37 P6954 1.72510.49400 67,93 3.420 0.000 0.000
Access Road to Mthombeni Pr Sch. 83803 TRK & 83881 TRKP6955 1.72510.49400 67 3.150 0.000 0.000
Danganya Msebeni Road (83270/83282TRK) P6956 1.72510.49400 99 5.130 0.000 0.000
Dlamini Road Georgedale P6961 1.72510.49300 5 3.150 0.000 0.000
Malangeni Access Road P6962 1.72510.49300 6 3.150 0.000 0.000
Ntshongweni Road P7314 1.72510.49300 7 2.700 0.000 0.000
Access Roads TRK 86011 P3793 1.72510.49300 8 3.150 0.000 0.000
Balito Road P6963 1.72510.49300 9 3.150 0.000 0.000
Stockville Road Upgrade P4042 1.72510.49300 10 1.800 0.000 1.800
Gravel to blacktop P6965 1.72510.49300 38 0.900 0.000 0.000
Gravel to blacktop P6966 1.72510.49300 42 0.900 0.000 0.000Ward 13 - Sukuma low-level crossing
over Umlaas River P7056 1.72510.49300 13 2.700 0.000 0.000
Footpath Ubangalala Ave - Umbondwe P6036 1.72510.49300 45 0.095 0.000 0.000
Shangase Road Sidewalk P6050 1.72510.49300 6 0.000 0.180 0.000
Kenville Road, Ward 34 P6026 1.72510.49400 34 0.090 0.000 0.000
Ubangalala Avenue, Ward 45 P6036 1.72510.49300 45 0.095 0.000 0.000
Colchester Rd Sidewalk P4865 1.72510.49300 51 0.090 0.000 0.000
Everest Rd Sidewalk P4854 1.72510.49300 36 0.090 0.000 0.000
Sidewalks P4850 1.72510.49300 45 0.090 0.000 0.000
Embo Road Sidewalk P4226 1.72510.49300 8 0.000 0.180 0.000
Newlands West Dr. Sidewalk from Westridge to Castlehill Dr., Ward 37P4246 1.72510.49300 37 0.090 0.000 0.000
King Bhekuzulu Rd Sidewalk - Mzomusha Primary SchoolP4249 1.72510.49300 44 0.090 0.000 0.000
D403 Sidewalk P4255 1.72510.49300 53,57,59 0.090 0.000 0.000
Westridge - Taxi Route 108201 Sidewalk P4267 1.72510.49300 37 0.090 0.000 0.000
Ward 53 Sidewalks Phase 1 P4273 1.72510.49300 53 0.180 0.000 0.000
Sidewalks in Ward 44 P4229 1.72510.49300 44 0.000 0.180 0.000
Sidewalks in Ward 53 P4230 1.72510.49300 53 0.000 0.180 0.000
Sidewalks in Ward 54 P4231 1.72510.49300 54 0.000 0.180 0.000
Sidewalks in Ward 55 P4232 1.72510.49300 55 0.000 0.180 0.000
Sidewalks in Ward 56 P4233 1.72510.49300 56 0.000 0.180 0.000
Sidewalks in Ward 57 P4234 1.72510.49300 57 0.000 0.180 0.000
Rydavale Drive Parthenon P4261 1.72510.49300 49 0.000 0.135 0.000
Queenspark Crescent P4809 1.72510.49300 51 0.000 0.135 0.000
Hexham Rd Sidewalk P4810 1.72510.49300 52 0.000 0.180 0.000
Muziwabantu Primary P4811 1.72510.49300 42 0.000 0.135 0.000
Dalmanet and Ingudulu P4812 1.72510.49300 42 0.000 0.180 0.000
Cassia Road Sidewalk P4262 1.72510.49300 23/58/63 0.000 0.180 0.000
Olivine Road P4813 1.72510.49300 60 0.000 0.180 0.000
Desai/Rajendra Street P4814 1.72510.49300 61 0.000 0.180 0.000
Hillhead Drive P4815 1.72510.49300 102 0.000 0.180 0.000
Weaver Crescent - Umhlanga P4816 1.72510.49300 35 0.000 0.225 0.000
Buxton Road - Claredon P4817 1.72510.49300 36 0.000 0.135 0.000
Bungane Road P4818 1.72510.49300 43 0.000 0.180 0.000
Nquthu Road P4819 1.72510.49300 8 0.000 0.180 0.000
Church Road P4820 1.72510.49300 10 0.000 0.090 0.000
Effingham Road P4821 1.72510.49300 34 0.000 0.045 0.000
Hlobane Road P4822 1.72510.49300 46 0.000 0.108 0.000
Camelia Avenue P4824 1.72510.49300 60 0.000 0.162 0.000
Ngidi School Road P4825 1.72510.49300 40 0.000 0.180 0.000
Tafelkop Access Road P4826 1.72510.49300 41 0.000 0.180 0.000
School Access Roads P4827 1.72510.49300 3 0.000 0.180 0.000
Panekeni Access Road P4828 1.72510.49300 4 0.000 0.180 0.000
Sofasonke Road P4829 1.72510.49300 7 0.000 0.180 0.000
Ntuzuma Access Rd from Mr93 to Court house SidewalkP4831 1.72510.49300 54 0.180 0.000 0.000
Oak Avenue P4834 1.72510.49300 97 0.000 0.540 0.000
Garuppa Crescent Sidewalk P4836 1.72510.49300 11 0.180 0.000 0.000
Siyaya Road Sidewalk P4832 1.72510.49300 44,55 0.180 0.000 0.000
Madiba Road Sidewalk P4220 1.72510.49300 54 0.000 0.180 0.000
Kloof Falls Road P4218 1.72510.49300 1 0.000 0.315 0.000
Road 76750STR P4219 1.72510.49300 3 0.000 0.180 0.000
Benares Road Sidewalk P4770 1.72510.49400 103 0.000 0.180 0.000
Thabo Morena Road - Umlazi P4773 1.72510.49400 74,76,80 0.000 0.450 0.000
Marine Road P4774 1.72510.49400 75 0.000 0.450 0.000
Wanda Celke Road P4775 1.72510.49400 93 0.000 0.450 0.000
62

CAPITAL BUDGET BY CLUSTER 2013 - 2016
Description Project No. Vote No. Ward No. BUDGET 2013/14 BUDGET 2014/15 BUDGET 2015/16
Rm Rm Rm
Illovo Beach Road P4780 1.72510.49400 97 0.000 0.180 0.000
Lanes P4784 1.72510.49400 12 0.000 0.270 0.000
Lanes and Footpaths P4776 1.72510.49400 77 0.000 0.270 0.000
Sidewalks Pascali Road P4781 1.72510.49400 14 0.000 0.180 0.000
Sidewalks Emmaus Road P4782 1.72510.49400 15 0.000 0.180 0.000
Lanes and Footpaths P4771 1.72510.49400 15 0.000 0.270 0.000
Lanes and Footpaths P4772 1.72510.49400 17 0.000 0.270 0.000
Lanes and Footpaths P4777 1.72510.49400 17 0.000 0.270 0.000
Sidewalks Ward 21 P4778 1.72510.49400 21 0.000 0.225 0.000
Sidewalks Ward 22 P4779 1.72510.49400 22 0.000 0.180 0.000
Sidewalks Rockdale P4783 1.72510.49400 24 0.000 0.180 0.000
Footpath Silverglen Drive P7354 1.72510.49300 69,70 0.000 0.203 0.000
Sidewalks Mallard Road P7355 1.72510.49300 73 0.000 0.338 0.000
Sidewalks Nyathi P7356 1.72510.49300 19 0.000 0.169 0.000
Passage gx 10 P7357 1.72510.49300 79 0.000 0.102 0.000
Sidewalks Themba Thabethe P7358 1.72510.49300 80 0.000 0.225 0.000
Passage Mlonazane Drive P7359 1.72510.49300 82 0.000 0.225 0.000
Sidewalks Dayimane Road P7360 1.72510.49300 83 0.000 0.225 0.000
Sidewalks and Passages - Luganda P7361 1.72510.49300 13 0.000 0.450 0.000
Kwa Ximba Access Road P7018 1.72510.49300 1 0.153 0.000 0.000
Vukani Road Sidewalk P7019 1.72510.49300 2 0.153 0.000 0.000
Amatata Road Sidewalk P7020 1.72510.49300 3 0.153 0.000 0.000
O R Thambo, Riet Valley P7021 1.72510.49300 4 0.153 0.000 0.000
Georgedale Main Road, Sidewalk P7022 1.72510.49300 5 0.153 0.180 0.000
Sidewalks in Mpumalanga P7023 1.72510.49300 6 0.153 0.000 0.000
Ekawandeni Road Sidewalk P7024 1.72510.49300 7 0.153 0.000 0.000
Embo Access Road Sidewalk P7025 1.72510.49300 8 0.153 0.000 0.000
Molweni Access Road Sidewalk P7026 1.72510.49300 9 0.153 0.000 0.000
Shongweni Road Sidewalk P7027 1.72510.49300 7 0.153 0.000 0.000
Valley View Area Sidewalk P7028 1.72510.49300 91 0.153 0.000 0.000
Sidewalks P7029 1.72510.49300 27 0.113 0.000 0.000
Sidewalks P7030 1.72510.49300 56 0.180 0.000 0.000
Antelope Place (Crescent to Harbottle) P7038 1.72510.49300 25 0.068 0.000 0.000
Dore Street P7042 1.72510.49300 60 0.113 0.000 0.000
Todd Street P7044 1.72510.49300 58 0.090 0.000 0.000
Rajendra Street P7046 1.72510.49300 61 0.135 0.000 0.000
Amman Circle P7049 1.72510.49300 60 0.135 0.000 0.000
Mzwillili Road P7050 1.72510.49300 38 0.072 0.180 0.000
Sidewalks P7051 1.72510.49300 42 0.158 0.000 0.000
Pinecottage Place P7052 1.72510.49300 48 0.090 0.000 0.000
Tynecroft Circle P7053 1.72510.49300 49 0.135 0.000 0.000
Swallowhaven Road P7054 1.72510.49300 50 0.180 0.135 0.000
Autumnpark Avenue P7055 1.72510.49300 51 0.135 0.000 0.000
Crestbrook Avenue P6960 1.72510.49300 51 0.135 0.000 0.000
Creche Road 1 0.000 0.000 2.700
Imbozamo Link Road 2 0.000 0.000 2.700
New River School Road 3 0.000 0.000 3.600
Kwacele Road 4 0.000 0.000 3.600
Mbojane Road 5 0.000 0.000 3.600
Malangeni Access Road 6 0.000 0.000 3.600
Salem Access Road 7 0.000 0.000 3.600
Hlengwa Access Road 8 0.000 0.000 3.600
Ntanankulu Road 9 0.000 0.000 2.700
Noel Road 10 0.000 0.000 0.900
Dhalia Road 0.000 0.000 0.900
Ward 91 Access Road Upgrade 91 0.000 0.000 2.700
Various gravel roads in Inanda 55 0.000 0.000 1.800
Route 5.4, Ward 56 56 0.000 0.000 1.800
Unsurfaced to surfaced Roads - North Various 0.000 0.000 5.400
Upgrade of Biko Rd - Kwandangezi Township 12 0.000 0.000 0.360
Upgrade of Str 200010 & Str 200040 - Sithundu Hills 13 0.000 0.000 0.360
Upgrade of Syringa Place - Nagina Township 13 0.000 0.000 0.450
Upgrading gravel road - TRK 75176 - Dassenhoek 14 0.000 0.000 2.250
Sixth St, Thornwood, Ward 15 15 0.000 0.000 0.540
Upgrade of Makhunga Pl - St Wendolins Township 16 0.000 0.000 0.315
Upgrading of gravel road -TRK47057 - Demat 17 0.000 0.000 3.600
Upgrade-STR47823-Savannah Park 17 0.000 0.000 0.450
Upgrade of Dahlia Rd-Wye bank 19 0.000 0.000 3.150
Upgrade of Lentaka Pl - Kwadabeka Township 20 0.000 0.000 0.270
Phephile Walk- Kwadabeka 20 0.000 0.000 0.315
Road Access :Lots 244-247-Kwadabeka 92 0.000 0.000 0.540
Sunset Grove P6914 70 0.000 0.000 1.350
63

CAPITAL BUDGET BY CLUSTER 2013 - 2016
Description Project No. Vote No. Ward No. BUDGET 2013/14 BUDGET 2014/15 BUDGET 2015/16
Rm Rm Rm
Road Widening : Greenvale Avenue P6915 70 0.000 0.000 1.080
Herman Drive : Road Widening P6916 71 0.000 0.000 0.810
Road Widening : Road 742 P6917 72 0.000 0.000 1.440
Road 708 Widening P6918 73 0.000 0.000 0.990
Access way : J863/ 862 P6923 77 0.000 0.000 0.108
Access Road : J181-188 P6924 77 0.000 0.000 0.135
G1449 Access Way (Str 107286) P6929 79 0.000 0.000 0.270
Nongoloza Road P6930 80 0.000 0.000 1.350
Access Road : N1484 P6936 82 0.000 0.000 0.675
Nkosi Avenue P6935 82 0.000 0.000 0.675
Access Road : Ematshini P6940 83 0.000 0.000 0.900
P6944 84 0.000 0.000 0.810
Access Road : AA460 (Bhekuzulu Road) P6947 85 0.000 0.000 0.540
Access Road A665 from Wanda Cele Rd
to Sports Field 93 0.000 0.000 4.230
Shozi Road 96 0.000 0.000 4.680
Bhoqwana Road & Uzemu Rd - Magabheni 99 0.000 0.000 3.510
Sidewalks - North Various 0.000 0.000 5.400
Sidewalks - West Various 0.000 0.000 5.400
Lanes and Footpaths 13 0.000 0.000 0.360
Sidewalks : Young Rd - Pinetown 15 0.000 0.000 0.270
Lanes and Footpaths - Tshelimnyama 15 0.000 0.000 0.180
Sidewalks : Spencer Rd - Shallcross 17 0.000 0.000 0.180
Sidewalks 18 0.000 0.000 0.270
Sidewalks 21 0.000 0.000 0.180
Sidewalks 22 0.000 0.000 0.180
Sidewalks : Homestead Rd - Westville 24 0.000 0.000 0.180
Sidewalks: Jacaranda Crescent 90 0.000 0.000 0.630
Sidewalks: Mayville Terrace 97 0.000 0.000 0.315
Sidewalks: Krantzdraai Crescent 97 0.000 0.000 0.270
Sidewalks: Gracedale 97 0.000 0.000 0.135
Sidewalks: Eagle Road - Umkomaas 99 0.000 0.000 0.405
Sidewalks: Golden Poppy Crescent P6984 71 0.000 0.000 0.360
Sidewalks: Ras Dashan Street P6985 71 0.000 0.000 0.360
Sidewalks: Rose Heights Road P6990 73 0.000 0.000 0.135
Sidewalk : Woodcrest Avenue P6991 73 0.000 0.000 0.180
Passage : J874 / 852 P6992 77 0.000 0.000 0.135
Passage : J808 / 815 P6993 77 0.000 0.000 0.135
Passage : J854 / 855 P6994 77 0.000 0.000 0.090
Sidewalks: Ngwenya Road P6996 79 0.000 0.000 0.135
Sidewalk: Sibusiso Mdakane Road - School P6997 80 0.000 0.000 0.135
Sidewalks: Sukuma Rd P6998 83 0.000 0.000 0.135
Umlaas River GX 11 Ped Bridge P6156 79 0.000 0.000 9.000
Ped bridges 2015/16 Various 0.000 0.000 5.400
HOUSING - Project Appraisals & Subsidy Applications 0.050 0.050 0.050
HOUSING - Transit Camp Eradication 0.050 0.050 0.050
HOUSING - Infrastructure Handover - As Builts & Remedial Works 0.050 0.050 0.050
HOUSING - Densification Top - Ups 0.050 0.050 0.050
BASIC COMMUNITY SERVICES - Interim Services to Informal Settlements 0.050 0.050 0.050
INCUBATION FUND - Long Term Spatial Infrastructure Plan 0.050 0.050 0.050
INCUBATION FUND - Spatial Plan to Coordinate Infrastructure Budgeting & Spend 0.050 0.050 0.050
INCUBATION FUND - Detailed Planning of Interim Services Clusters 0.050 0.050 0.050
INCUBATION FUND - Land Searches Around Eleven Key Train Stations 0.050 0.050 0.050INCUBATION FUND - Feasibility Studies
on Intended Acquisitions of Land around
Eleven Key Stations 0.050 0.050 0.050
INCUBATION FUND - Land Searches in Key Investment Locations 0.050 0.050 0.050
INCUBATION FUND - Feasibility Studies
on Intended Acquisitions of Land Found
in Key Investment Locations 0.050 0.050 0.050
INCUBATION FUND - eThekwini Informal Enterprise and Micro - Enterprise Initiative 0.050 0.050 0.050
INCUBATION FUND - Industrial Land Research and Strategy Development 0.050 0.050 0.050
INCUBATION FUND - River Reserve Detereminations 0.050 0.050 0.050
INCUBATION FUND - Retrofitting Suburbia Welbedacht East - Social Survey 0.050 0.050 0.050
INCUBATION FUND - Retrofitting Suburbia Welbedacht East - Planning 0.050 0.050 0.050
INCUBATION FUND - South Public Transport Corridor Phase 1 0.050 0.050 0.050
INCUBATION FUND - Functional Area Plan for Duffs Road Station 0.050 0.050 0.050
INCUBATION FUND - Preparation of Social Projects 0.050 0.050 0.050
INCUBATION FUND - Upgrade eHSP 0.050 0.050 0.050
INCUBATION FUND - Social Sector Plan 0.050 0.050 0.050
INCUBATION FUND - Blocksum 0.050 0.050 0.050
64
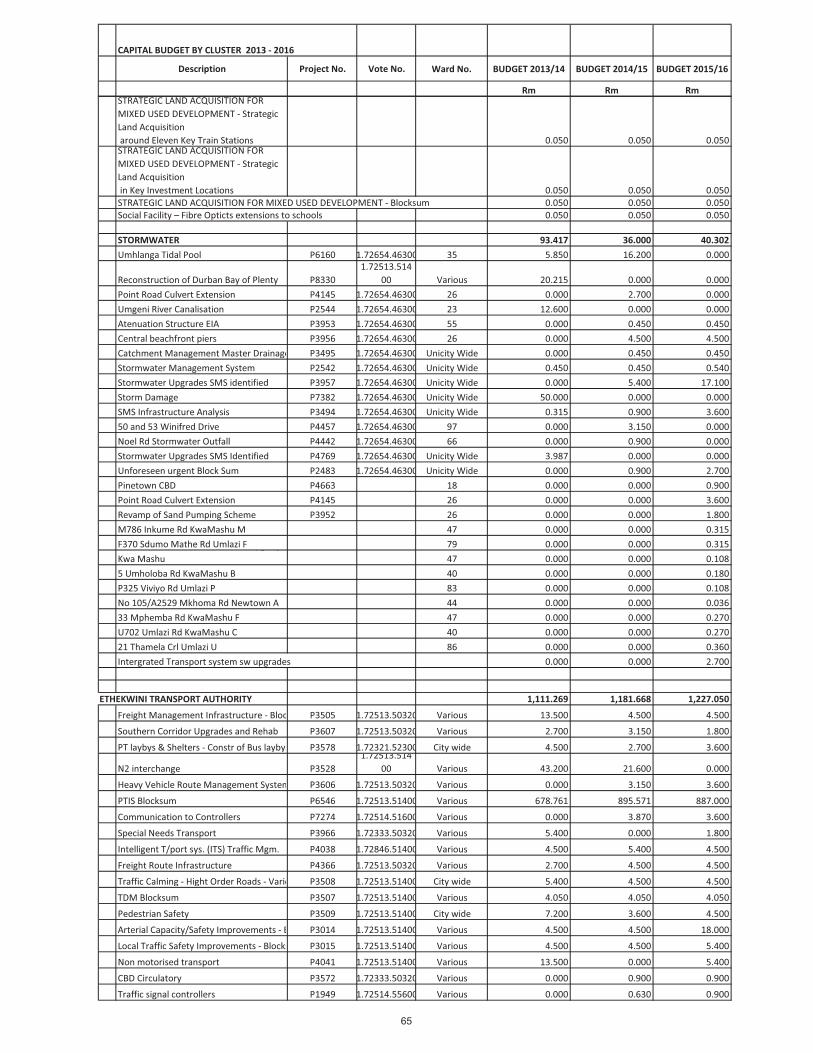
CAPITAL BUDGET BY CLUSTER 2013 - 2016
Description Project No. Vote No. Ward No. BUDGET 2013/14 BUDGET 2014/15 BUDGET 2015/16
Rm Rm RmSTRATEGIC LAND ACQUISITION FOR
MIXED USED DEVELOPMENT - Strategic
Land Acquisition
around Eleven Key Train Stations 0.050 0.050 0.050STRATEGIC LAND ACQUISITION FOR
MIXED USED DEVELOPMENT - Strategic
Land Acquisition
in Key Investment Locations 0.050 0.050 0.050
STRATEGIC LAND ACQUISITION FOR MIXED USED DEVELOPMENT - Blocksum 0.050 0.050 0.050
Social Facility – Fibre Opticts extensions to schools 0.050 0.050 0.050
STORMWATER 93.417 36.000 40.302
Umhlanga Tidal Pool P6160 1.72654.46300 35 5.850 16.200 0.000
Reconstruction of Durban Bay of Plenty P8330
1.72513.514
00 Various 20.215 0.000 0.000
Point Road Culvert Extension P4145 1.72654.46300 26 0.000 2.700 0.000
Umgeni River Canalisation P2544 1.72654.46300 23 12.600 0.000 0.000
Atenuation Structure EIA P3953 1.72654.46300 55 0.000 0.450 0.450
Central beachfront piers P3956 1.72654.46300 26 0.000 4.500 4.500
Catchment Management Master Drainage PlansP3495 1.72654.46300 Unicity Wide 0.000 0.450 0.450
Stormwater Management System P2542 1.72654.46300 Unicity Wide 0.450 0.450 0.540
Stormwater Upgrades SMS identified P3957 1.72654.46300 Unicity Wide 0.000 5.400 17.100
Storm Damage P7382 1.72654.46300 Unicity Wide 50.000 0.000 0.000
SMS Infrastructure Analysis P3494 1.72654.46300 Unicity Wide 0.315 0.900 3.600
50 and 53 Winifred Drive P4457 1.72654.46300 97 0.000 3.150 0.000
Noel Rd Stormwater Outfall P4442 1.72654.46300 66 0.000 0.900 0.000
Stormwater Upgrades SMS Identified P4769 1.72654.46300 Unicity Wide 3.987 0.000 0.000
Unforeseen urgent Block Sum P2483 1.72654.46300 Unicity Wide 0.000 0.900 2.700
Pinetown CBD P4663 18 0.000 0.000 0.900
Point Road Culvert Extension P4145 26 0.000 0.000 3.600
Revamp of Sand Pumping Scheme P3952 26 0.000 0.000 1.800
M786 Inkume Rd KwaMashu M 47 0.000 0.000 0.315
F370 Sdumo Mathe Rd Umlazi F 79 0.000 0.000 0.315H - Section No valid Road Name Npgwaja
Kwa Mashu 47 0.000 0.000 0.108
5 Umholoba Rd KwaMashu B 40 0.000 0.000 0.180
P325 Viviyo Rd Umlazi P 83 0.000 0.000 0.108
No 105/A2529 Mkhoma Rd Newtown A 44 0.000 0.000 0.036
33 Mphemba Rd KwaMashu F 47 0.000 0.000 0.270
U702 Umlazi Rd KwaMashu C 40 0.000 0.000 0.270
21 Thamela Crl Umlazi U 86 0.000 0.000 0.360
Intergrated Transport system sw upgrades 0.000 0.000 2.700
ETHEKWINI TRANSPORT AUTHORITY 1,111.269 1,181.668 1,227.050
Freight Management Infrastructure - BlocksumP3505 1.72513.50320 Various 13.500 4.500 4.500
Southern Corridor Upgrades and Rehab P3607 1.72513.50320 Various 2.700 3.150 1.800
PT laybys & Shelters - Constr of Bus laybys - CitywideP3578 1.72321.52300 City wide 4.500 2.700 3.600
N2 interchange P3528
1.72513.514
00 Various 43.200 21.600 0.000
Heavy Vehicle Route Management System P3606 1.72513.50320 Various 0.000 3.150 3.600
PTIS Blocksum P6546 1.72513.51400 Various 678.761 895.571 887.000
Communication to Controllers P7274 1.72514.51600 Various 0.000 3.870 3.600
Special Needs Transport P3966 1.72333.50320 Various 5.400 0.000 1.800
Intelligent T/port sys. (ITS) Traffic Mgm. P4038 1.72846.51400 Various 4.500 5.400 4.500
Freight Route Infrastructure P4366 1.72513.50320 Various 2.700 4.500 4.500
Traffic Calming - Hight Order Roads - Various P3508 1.72513.51400 City wide 5.400 4.500 4.500
TDM Blocksum P3507 1.72513.51400 Various 4.050 4.050 4.050
Pedestrian Safety P3509 1.72513.51400 City wide 7.200 3.600 4.500
Arterial Capacity/Safety Improvements - BlocksumP3014 1.72513.51400 Various 4.500 4.500 18.000
Local Traffic Safety Improvements - Blocksum P3015 1.72513.51400 Various 4.500 4.500 5.400
Non motorised transport P4041 1.72513.51400 Various 13.500 0.000 5.400
CBD Circulatory P3572 1.72333.50320 Various 0.000 0.900 0.900
Traffic signal controllers P1949 1.72514.55600 Various 0.000 0.630 0.900
65
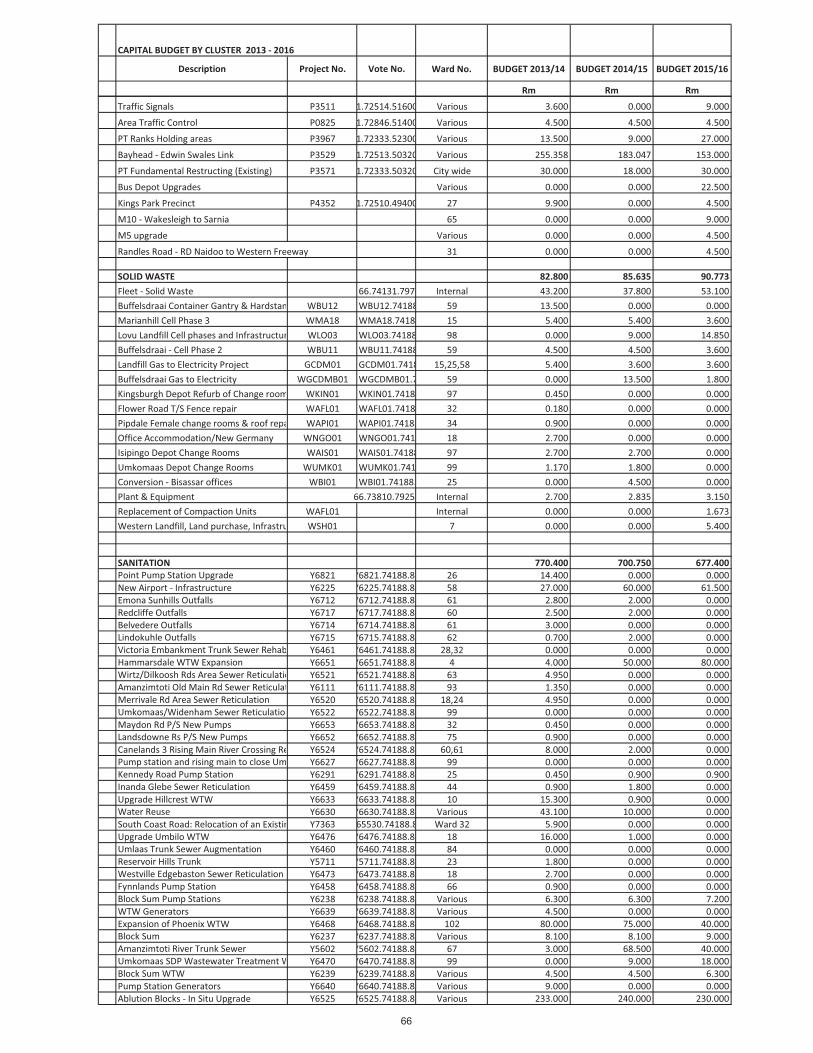
CAPITAL BUDGET BY CLUSTER 2013 - 2016
Description Project No. Vote No. Ward No. BUDGET 2013/14 BUDGET 2014/15 BUDGET 2015/16
Rm Rm Rm
Traffic Signals P3511 1.72514.51600 Various 3.600 0.000 9.000
Area Traffic Control P0825 1.72846.51400 Various 4.500 4.500 4.500
PT Ranks Holding areas P3967 1.72333.52300 Various 13.500 9.000 27.000
Bayhead - Edwin Swales Link P3529 1.72513.50320 Various 255.358 183.047 153.000
PT Fundamental Restructing (Existing) P3571 1.72333.50320 City wide 30.000 18.000 30.000
Bus Depot Upgrades Various 0.000 0.000 22.500
Kings Park Precinct P4352 1.72510.49400 27 9.900 0.000 4.500
M10 - Wakesleigh to Sarnia 65 0.000 0.000 9.000
M5 upgrade Various 0.000 0.000 4.500
Randles Road - RD Naidoo to Western Freeway 31 0.000 0.000 4.500
SOLID WASTE 82.800 85.635 90.773
Fleet - Solid Waste 66.74131.79700 Internal 43.200 37.800 53.100
Buffelsdraai Container Gantry & Hardstand Ext. AreaWBU12 WBU12.74188.88 59 13.500 0.000 0.000
Marianhill Cell Phase 3 WMA18 WMA18.74188.88 15 5.400 5.400 3.600
Lovu Landfill Cell phases and Infrastructure worksWLO03 WLO03.74188.88 98 0.000 9.000 14.850
Buffelsdraai - Cell Phase 2 WBU11 WBU11.74188.88 59 4.500 4.500 3.600
Landfill Gas to Electricity Project GCDM01 GCDM01.74188.8815,25,58 5.400 3.600 3.600
Buffelsdraai Gas to Electricity WGCDMB01 WGCDMB01.74188.8859 0.000 13.500 1.800
Kingsburgh Depot Refurb of Change rooms WKIN01 WKIN01.74188.88 97 0.450 0.000 0.000
Flower Road T/S Fence repair WAFL01 WAFL01.74188.88 32 0.180 0.000 0.000
Pipdale Female change rooms & roof repairs WAPI01 WAPI01.74188.88 34 0.900 0.000 0.000
Office Accommodation/New Germany WNGO01 WNGO01.74188.88 18 2.700 0.000 0.000
Isipingo Depot Change Rooms WAIS01 WAIS01.74188.88 97 2.700 2.700 0.000
Umkomaas Depot Change Rooms WUMK01 WUMK01.74188.88 99 1.170 1.800 0.000
Conversion - Bisassar offices WBI01 WBI01.74188.88 25 0.000 4.500 0.000
Plant & Equipment 66.73810.79252 Internal 2.700 2.835 3.150
Replacement of Compaction Units WAFL01 Internal 0.000 0.000 1.673
Western Landfill, Land purchase, Infrastructure & CellWSH01 7 0.000 0.000 5.400
SANITATION 770.400 700.750 677.400
Point Pump Station Upgrade Y6821 Y6821.74188.88 26 14.400 0.000 0.000
New Airport - Infrastructure Y6225 Y6225.74188.88 58 27.000 60.000 61.500
Emona Sunhills Outfalls Y6712 Y6712.74188.88 61 2.800 2.000 0.000
Redcliffe Outfalls Y6717 Y6717.74188.88 60 2.500 2.000 0.000
Belvedere Outfalls Y6714 Y6714.74188.88 61 3.000 0.000 0.000
Lindokuhle Outfalls Y6715 Y6715.74188.88 62 0.700 2.000 0.000
Victoria Embankment Trunk Sewer RehablitationY6461 Y6461.74188.88 28,32 0.000 0.000 0.000
Hammarsdale WTW Expansion Y6651 Y6651.74188.88 4 4.000 50.000 80.000
Wirtz/Dilkoosh Rds Area Sewer Reticulation Y6521 Y6521.74188.88 63 4.950 0.000 0.000
Amanzimtoti Old Main Rd Sewer Reticulation Y6111 Y6111.74188.88 93 1.350 0.000 0.000
Merrivale Rd Area Sewer Reticulation Y6520 Y6520.74188.88 18,24 4.950 0.000 0.000
Umkomaas/Widenham Sewer Reticulation Y6522 Y6522.74188.88 99 0.000 0.000 0.000
Maydon Rd P/S New Pumps Y6653 Y6653.74188.88 32 0.450 0.000 0.000
Landsdowne Rs P/S New Pumps Y6652 Y6652.74188.88 75 0.900 0.000 0.000
Canelands 3 Rising Main River Crossing RehabilitationY6524 Y6524.74188.88 60,61 8.000 2.000 0.000
Pump station and rising main to close Umkomaas WTWY6627 Y6627.74188.88 99 0.000 0.000 0.000
Kennedy Road Pump Station Y6291 Y6291.74188.88 25 0.450 0.900 0.900
Inanda Glebe Sewer Reticulation Y6459 Y6459.74188.88 44 0.900 1.800 0.000
Upgrade Hillcrest WTW Y6633 Y6633.74188.88 10 15.300 0.900 0.000
Water Reuse Y6630 Y6630.74188.88 Various 43.100 10.000 0.000
South Coast Road: Relocation of an Existing 600mm Diameter Steel Trunk SewerY7363 Y65530.74188.88 Ward 32 5.900 0.000 0.000
Upgrade Umbilo WTW Y6476 Y6476.74188.88 18 16.000 1.000 0.000
Umlaas Trunk Sewer Augmentation Y6460 Y6460.74188.88 84 0.000 0.000 0.000
Reservoir Hills Trunk Y5711 Y5711.74188.88 23 1.800 0.000 0.000
Westville Edgebaston Sewer Reticulation Y6473 Y6473.74188.88 18 2.700 0.000 0.000
Fynnlands Pump Station Y6458 Y6458.74188.88 66 0.900 0.000 0.000
Block Sum Pump Stations Y6238 Y6238.74188.88 Various 6.300 6.300 7.200
WTW Generators Y6639 Y6639.74188.88 Various 4.500 0.000 0.000
Expansion of Phoenix WTW Y6468 Y6468.74188.88 102 80.000 75.000 40.000
Block Sum Y6237 Y6237.74188.88 Various 8.100 8.100 9.000
Amanzimtoti River Trunk Sewer Y5602 Y5602.74188.88 67 3.000 68.500 40.000
Umkomaas SDP Wastewater Treatment Works Y6470 Y6470.74188.88 99 0.000 9.000 18.000
Block Sum WTW Y6239 Y6239.74188.88 Various 4.500 4.500 6.300
Pump Station Generators Y6640 Y6640.74188.88 Various 9.000 0.000 0.000
Ablution Blocks - In Situ Upgrade Y6525 Y6525.74188.88 Various 233.000 240.000 230.000
66

CAPITAL BUDGET BY CLUSTER 2013 - 2016
Description Project No. Vote No. Ward No. BUDGET 2013/14 BUDGET 2014/15 BUDGET 2015/16
Rm Rm Rm
Methane Power (Smaller Works) Y7047 Y7047.74188.88 Various 13.590 4.500 4.500
SWWTW Digester Online Y7048 Y7048.74188.88 68 31.500 42.000 50.000
Methane Power SWWTW Y7050 Y7050.74188.88 68 13.500 21.600 27.000
Composting (Block Sum) Y7049 Y7049.74188.88 Various 1.800 7.200 4.500
Tongaat Central WTW Expansion Y6972 Y6972.74188.88 62 50.000 40.000 10.000
Solar Energy Y7051 Y7051.74188.88 Various 0.000 1.800 1.800
Informal Settlements W & S plus Y6525 Y6525.74188.88 Various 42.000 10.000 20.000
Isipingo WTW Upgrades Y6975 Y6975.74188.88 89 12.000 1.000 0.000
Craigieburn WTW modifications Y6976 Y6976.74188.88 99 0.900 1.800 0.000
Kingsburgh WTW modifications Y6977 Y6977.74188.88 97 0.900 0.900 0.000
Refinery Road Pump Station Rising Main Y6986 Y6986.74188.88 90 2.160 0.000 0.000
Island View Pump Station Pumps Y6447 Y6447.74188.88 66 2.700 0.000 0.000
Kwa Mashua WWTW Y6973 Y6973.74188.88 102 50.000 10.000 10.000
Wastewater System Valve Y6979 Y6979.74188.88 Various 0.000 0.450 0.000
7th Avenue Retic Pinetown Y7081 Y7081.74188.88 16 0.000 0.900 7.200
North Park Sewer Reticulation Y7083 Y7083.74188.88 63 0.000 0.900 7.200
Umhlanga WTW Upgrades Y6978 Y6978.74188.88 35 0.900 3.600 0.900
Hammarsdale Elangeni Sewer
Reticulation Y7084 Y7084.74188.88 4 0.000 0.900 4.500
Desalination Y7085 Y7085.74188.88 Various 0.000 0.000 0.000
Block Sum X5258 X5258.74188.88 Various 36.000 7.200 7.200
Joanna Rd Pump Station Elimination 74188.88 34 2.000 2.000 0.000
Sea Outfalls Inspection 68 0.000 0.000 1.800
McCausland P/S Refurbishment Y6638 Y6638.74188.88 58 0.000 0.000 1.800
South Coast to Umkomaas Trunk Sewer Y6649 Y6649.74188.88 99 0.000 0.000 1.800
Northern WWTW Solar Energy 34 0.000 0.000 0.900
Oakford Priory Collector Sewer Y6981 Y6981.74188.88 59 0.000 0.000 1.800
Aberfoyle Bulk Sewer Y6982 Y6982.74188.88 61 0.000 0.000 1.800
Gwala Farm Bulk Sewer Y6983 Y6983.74188.88 61 0.000 0.000 1.800
Redcliffe - Canelands/Parkridge Bulk Sewer Y6984 Y6984.74188.88 60 0.000 0.000 1.800
Sanitation Master Plan and implementation Various 0.000 0.000 4.500
Sanitation Research and implementation Various 0.000 0.000 0.000
Umhlatuzana WWTW Upgrades 63 0.000 0.000 4.500
Cato Ridge Trunk Sewer 5 0.000 0.000 4.500
Trunk Sewer to close New Germany WWTW 92 0.000 0.000 2.700
WATER 744.430 841.400 806.100
Water Flagship Project - Western Aqueduct X4625 X4625.74188.88 Various 244.000 300.000 380.000
Reclaimed Water Kwa Mashua Works X6535 X6535.74188.88 102 0.000 3.600 0.000
Reclaimed Water Northern Works X6536 X6536.74188.88 34 0.000 3.600 0.000
Reservoir Bypass X6537 X6537.74188.88 Various 0.000 2.700 1.800
Labour Based Construction - Housing ( Water) X4257 X4257.74188.88 Various 13.500 13.500 9.000
Post Chlorination X4639 X4639.74188.88 Various 0.450 0.450 0.450
Motor Control Centre X4246 X4246.74188.88 Various 0.450 0.450 0.450
Capital Improvement of water Works X4235 X4235.74188.88 Various 0.900 0.900 0.900
Telemetry X4222 X4222.74188.88 Various 0.450 0.450 0.450
Pumps X4216 X4216.74188.88 Various 0.090 0.450 0.450
Bridge Refurbishment X4529 X4529.74188.88 Various 0.090 0.450 0.450
Bulk Sales Meters X4254 X4254.74188.88 Various 4.500 2.700 2.700
B/Fly valves X3793 X3793.74188.88 Various 0.900 1.800 1.800
Pump Station Upgrading X4215 X4215.74188.88 Various 0.900 1.800 1.800
Domestic Meters X4628 X4628.74188.88 Various 5.400 9.000 9.000
Cathodic Protection - New Works X4632 X4632.74188.88 Various 4.500 5.400 7.200
Reservoir Improvements X4219 X4219.74188.88 Various 0.900 2.700 2.700
Umdloti Res ( 5 Megs) X4140 X4140.74188.88 58 10.000 0.500 0.000
Install/upgrade reservoir and district meters X5189 X5189.74188.88 Various 2.700 4.500 9.000
Rezoning X4220 X4220.74188.88 Various 2.700 4.500 4.500
Umhlanga Res ( 10 Megs) X4319 X4319.74188.88 35 0.900 0.000 0.000
Reservoir Refurbishment X5188 X5188.74188.88 Various 0.900 1.800 4.500
Mini Hydro Power Stations X5506 X5506.74188.88 Various 25.000 10.000 5.000
Private Development X4213 X4213.74188.88 Various 7.200 9.000 9.000
Waterloss X3289 X3289.74188.88 Various 35.000 65.000 50.000
Relays & Extension X4217 X4217.74188.88 Various 40.000 25.000 25.000
Replacement of Water Pipes X4889 X4889.74188.88 Various 0.000 105.300 59.500
PRV Installation (RETURN) X5906 X5906.74188.88 Various 5.400 9.000 4.500
Custody Transfer Meter Upgrade X6217 X6217.74188.88 Various 0.450 0.900 1.800
Advanced Control on PRVs (RETURN) X6216 X6216.74188.88 Various 0.900 4.500 4.500
Upgrade to Ogunjini Works X6307 X6307.74188.88 59 10.000 1.000 0.000
Etafuleni Res 2 (5Megs) X2741 X2741.74188.88 56 1.000 10.000 5.000
Etafuleni Res2 Inlet X6301 X6301.74188.88 56 1.000 0.000 3.000
Upgrade to Mkizwana Works X6306 X6306.74188.88 8 0.000 4.000 3.000
Alverstone to Frasers Trunk X4368 X4368.74188.88 103 0.900 0.900 0.000
67

CAPITAL BUDGET BY CLUSTER 2013 - 2016
Description Project No. Vote No. Ward No. BUDGET 2013/14 BUDGET 2014/15 BUDGET 2015/16
Rm Rm Rm
Trenance Park Res X5044 X5044.74188.88 Various 6.000 0.000 0.000
Congo Res Inlet X2324 X2324.74188.88 56 0.000 0.000 0.000
Clifton pipline and pump station X6137 X6137.74188.88 7 0.000 0.000 0.000
Magabheni Res X4877 X4877.74188.88 99 6.000 0.500 0.000
Almond Rd Res Inlet X5158 X5158.74188.88 97 0.000 0.000 0.000
Zwelibomvu Res X6309 X6309.74188.88 7 8.000 0.000 0.000
Solor Power at Pump Stations X6305 X6305.74188.88 Various 1.000 2.000 2.000
Flow Limiter Upgrades RETURN) X6302 X6302.74188.88 Various 9.000 31.500 24.300
Route Markers X6304 X6304.74188.88 Various 2.700 0.900 0.900
Craigieburn Res X6300 X6300.74188.88 99 0.500 0.000 0.000
Adams Res X6299 X6299.74188.88 67 0.500 0.000 0.000
Folweni 1 Res (6 Meg) X5334 X5334.74188.88 96 5.000 3.000 0.000
Folweni 2 Res (6 Meg) X5335 X5335.74188.88 95 5.000 3.000 0.000
M1B Res (3 Meg) X6303 X6303.74188.88 15 5.400 0.000 0.000
Emoyeni Res (30 Meg) X5254 X5254.74188.88 8 1.000 10.000 0.000
Unicity Water Dispensers installation (Blocksum)X4247 X4247.74188.88 Various 0.450 0.450 0.450
Borehole Improvements X3218 X3218.74188.88 Various 0.900 0.000 0.000
Hammersdale H/L ET X5185 X5185.74188.88 4 0.900 0.000 0.000
Frasers Reservoir X2263 X2263.74188.88 62 0.000 2.000 5.000
Clansthal Res X4876 X4876.74188.88 99 0.900 2.000 5.000
Burbreeze Res X4969 X4969.74188.88 62 9.000 1.000 0.000
Blackburn Res (15 Megs) X2679 X2679.74188.88 102 1.800 13.500 0.000
Northern Aquaduct X4764 X4764.74188.88 Various 190.000 100.000 90.000
Blocksum X5259 X5259.74188.88 Various 18.000 13.500 13.500
Offtakes S C A X4527 X4527.74188.88 Various 1.800 0.000 0.000
Trunkmain Upgrade X6533 X6533.74188.88 Various 4.500 4.500 4.500
Fleet - Water 64.74131.60610 Internal 17.100 18.000 18.000
Water - Plant and Equipment 64.73810.60110 Internal 27.900 22.500 27.000
La Mercy Airport Reservoir (SM) 74188.88 58 0.000 7.200 8.000
ELECTRICTY 568.798 642.352 653.774
Prepayment Connection Costs -All Areas EFA001 80091 Various 40.000 40.000 45.000
Informal Settlements - Central Region EFA002 81049 Various 3.000 4.000 5.000
Informal Settlements - Northern Region 81012 Various 3.000 4.000 5.000
Informal Settlements - Southern Region 81042 27 3.000 4.000 5.000
MV/LV -EFA New Reticulation Central Region NER00002 81052 64 5.000 6.000 7.000
MV/LV -EFA New Reticulation Northern RegionNER00007 81039 53,56,57,59 3.000 4.000 5.000
MV/LV -EFA New Reticulation Southern RegionNER00013 81038 18 3.000 4.000 5.000
MV/LV -EFA Reticulation Reinforcement SD000403 81036 32,33 2.800 3.000 3.000
MV/LV Service Connections-Conventional CA0001 80051 95 15.000 16.000 17.000
MV/LV Service Connections-Dispenser Cost CA0002 80056 100 0.900 0.900 0.450
MV/LV Reinforcement-New Substations DISTSS01 81011 56 0.900 0.900 0.900
MV/LV New Supply-Central Region SD000025 81009 44 30.000 35.000 40.000
MV/LV New Supply-Northern Region 81025 36 20.000 25.000 25.000
MV/LV New Supply-Southern Region 81026 75 20.000 25.000 25.000
MV/LV Reinforcement-Central Region SD000023 81007 32 5.000 5.000 10.000
MV/LV Reinforcement-Northern Region 81002 18 5.000 5.000 8.000
MV/LV Reinforcement-Southern Region 81008 60 5.000 5.000 8.000
MV/LV Capital Replacement Central Region SD000204 81028 28 15.000 16.000 17.000
MV/LV Capital Replacement Nothern Region 81023 24 10.000 11.000 12.000
MV/LV Capital Replacement Southern Region 81022 Various 10.000 11.000 12.000
MV/LV Maintenance Replacement ReticulationSD000207 81037 Various 4.500 4.500 4.500
MV/LV Distribution Automation Project 80136 Various 13.500 13.500 15.000
Lighting -Major Route Improvements PL0001MR 80405 Various 2.700 2.700 2.700
Lighting -New Major Routes PL0001NR 80406 Various 0.900 0.900 1.000
Lighting- Parks PL0001PL 80407 Various 0.045 0.045 0.090
Lighting- Sundry SD0011SS 80412 Various 1.800 1.800 1.800
Southern Depot Buildings 80303 Various 0.090 0.090 0.090
North Western Depot Buildings 80311 Various 0.090 0.090 0.090
South Western Depot Buildings 80319 Various 0.090 0.090 0.090
Plant & Equipment- Faults 80243 Various 0.100 0.100 0.100
Plant & Equipment- Western Depot 80242 Various 0.200 0.200 0.200
Plant & Equipment-Northern depot 80247 Various 0.200 0.200 0.200
Plant & Equipment-North Western depot 80248 26,28 0.200 0.200 0.200
Plant & Equipment-Central Depot 80249 96 0.200 0.200 0.200
Plant & Equipment-Southern Depot 80250 90 0.200 0.200 0.200
Plant & Equipment-South western Depot 80260 26,28 0.200 0.200 0.200
Plant & Equipment- Lighting Division 80284 27 0.009 0.009 0.027
Office Furniture & Equip.-Northern Depot 80351 Various 0.050 0.050 0.050
Office Furniture & Equip.-Central Depot 80352 Various 0.050 0.050 0.050
Office Furniture & Equip.-Southern Depot 80353 Various 0.050 0.050 0.050
68

CAPITAL BUDGET BY CLUSTER 2013 - 2016
Description Project No. Vote No. Ward No. BUDGET 2013/14 BUDGET 2014/15 BUDGET 2015/16
Rm Rm Rm
Office Furniture & Equip.-Faults Division 80358 Various 0.050 0.050 0.050
Office Furniture & Equip.-Lighting 80365 Various 0.009 0.009 0.009
Office Furniture & Equip.-North Western Depot 80366 Various 0.050 0.050 0.050
Office Furniture & Equip.-Western Depot 80367 Various 0.050 0.050 0.050
Office Furniture & Equip.-South Western Depot 80370 Various 0.050 0.050 0.050
Airconditioning-Depot Buildings 80254 Various 0.090 0.090 0.130
PDA Mobile Device project 80283 Various 1.800 1.350 0.000
Land Acquisitions 80001 Various 0.500 0.500 0.500
Servitudes-Intangible 80002 Various 4.000 4.000 4.000
Umbogintwini Upgrade TM0006 80604 93 0.180 0.000 0.000
Pineside S/Stn TM0027 80625 Various 0.000 0.000 4.500
Klaarwater-substation transformers TM0024 80622 Various 42.000 22.000 0.000
La Mercy 132/11kv s/stn Transformers TM0049 80647 27 0.000 0.200 10.000
Springfield 33kv Board TM0026 80648 Various 3.600 0.000 0.000
Umgeni /Klaarwater OHTL TM0116 80850 Various 32.000 7.000 0.000
Fibre Optic Links TM0030 80628 Various 3.330 4.050 1.800
Lotus Park 275/132 Kv Stn TM0035 80634 Various 0.000 0.000 2.000
Bellair 275/132kv S/Stn TM0104 80636 Various 0.200 3.000 8.300
Kloof 132/11kv S/Stn TM0043 80843 26,27 0.491 1.000 18.620
Verulam 132/11KV S/Stn TM0047 80654 28 0.000 0.000 1.050
Himalayas/Austerville Link TM0059 80666 48 0.000 0.000 2.000
Transnet 132/11kv S/Stn (Harbour ) TM0052 80651 Various 0.180 22.500 14.760
K E Masinga S/Stn (Ordnance Rd ) TM0053 80652 Various 5.000 15.000 20.000
NCP Springpark S/Stn TM0094 80827 Various 0.000 2.000 12.000
Bridge City 132/11kv Substation TM0096 80661 Various 0.000 0.000 2.700
Durban South S/Stn (Transformers) TM0058 80793 70 25.000 0.000 0.000
Reunion Substation TM0061 80669 Various 0.000 2.500 22.500
Ottawa 275/132 S/Stn (Transformers) TM0105 80612 Various 0.000 0.500 27.000
Austerville 132/11kv Stn TM0068 80676 Various 0.000 3.270 25.070
Mahogany Ridge S/Stn TM0072 80680 Various 0.000 15.000 7.194
Underwood 132/11kv Stn TM0121 80681 Various 0.000 17.825 20.433
Jameson Park 132/11Kv Stn TM0075 80683 Various 20.000 37.000 0.000
Stockville 132Kv Switching Stn TM0077 80685 Various 0.000 0.000 11.070
Bulwer 132/11kv s/stn TM0078 80686 Various 0.000 0.200 2.180
Daly Road 132/11kv S/Stn TM0079 80687 27 0.000 0.000 3.600
Umlazi 132/11kv S/stn TM0087 80694 27 4.770 0.000 0.000
Sapref 132/33Kv S/Stn TM0089 80696 Various 33.800 11.000 0.000
Congella S/Stn(33 kv board/Bus Section) TM0130 80791 Various 5.004 1.284 0.000
Verulam 132kv switching station TM0047 80645 Various 0.000 1.050 10.000
Alice Street transformers & 11KV BOARD 80753 Various 9.000 0.000 0.000
HV Substation Walls & Security SD0010SW 80145 Various 4.500 4.500 0.900
HV Substation Construction SD0010SC 80168 26 5.000 5.000 4.000
Westville Control buildings 80323 18,24 10.000 1.000 1.000
Network Management System 80212 Various 3.600 1.800 0.900
HV Office Furniture & Equipment 80244 Various 0.027 0.027 0.036
HV Sundry Plant & Equipment 80251 Various 0.090 0.090 0.207
HV Alarms & Security Systems 80256 Various 1.800 1.800 0.900
Office furniture & equip -Westville Control 80359 Various 0.500 0.100 0.050
HV Test & Instrumentation 80701 Various 0.450 0.450 1.260
Springfield Complex 80305 Various 2.700 2.700 2.700
Control Centre Buildings 80310 Various 40.000 62.400 20.000
Headquarters Buildings/ Rotunda 80317 6,91 0.900 0.900 0.537
Mobile Plant 80201 Various 2.700 2.700 0.450
Vehicle Tracking System 80203 24,29,30 0.090 0.090 0.180
Cars & Vans 80205 Various 0.900 0.900 2.700
Trucks & Specialised Vehicles 80206 15 4.500 4.500 13.500
Fuel Management System 80209 26 0.090 0.090 0.090
Stores Sundry Equipment 80265 25,27 0.027 0.027 0.045
Airconditioning Equipment 80255 16,18 0.225 0.225 0.225
Plant & Equipment -Finance 80283 Various 0.045 0.045 0.090
Furniture & Equipment 80357 Various 0.540 0.540 0.500
Risk Management Plant & Equipment 80253 75 0.090 0.090 0.050
Mims-Ellipse Software 80211 Various 2.250 0.900 0.450
Computer Aided Design Software 80213 Various 0.045 0.045 0.045
Prepayment System 80217 Various 0.720 0.225 0.090
Outage Management System 80218 60 4.500 4.500 4.500
Lan Infrastructure 80219 11,37 1.800 1.800 0.450
Desktop Hardware 80220 61,62 1.000 1.800 0.900
Server Hardware 80221 Various 4.500 4.050 0.450
Computer Printers 80222 25 0.045 0.045 0.090
Software Systems Development 80223 Various 0.630 0.630 0.090
Computer Aided Design Hardware 80224 32 0.045 0.045 0.090
69
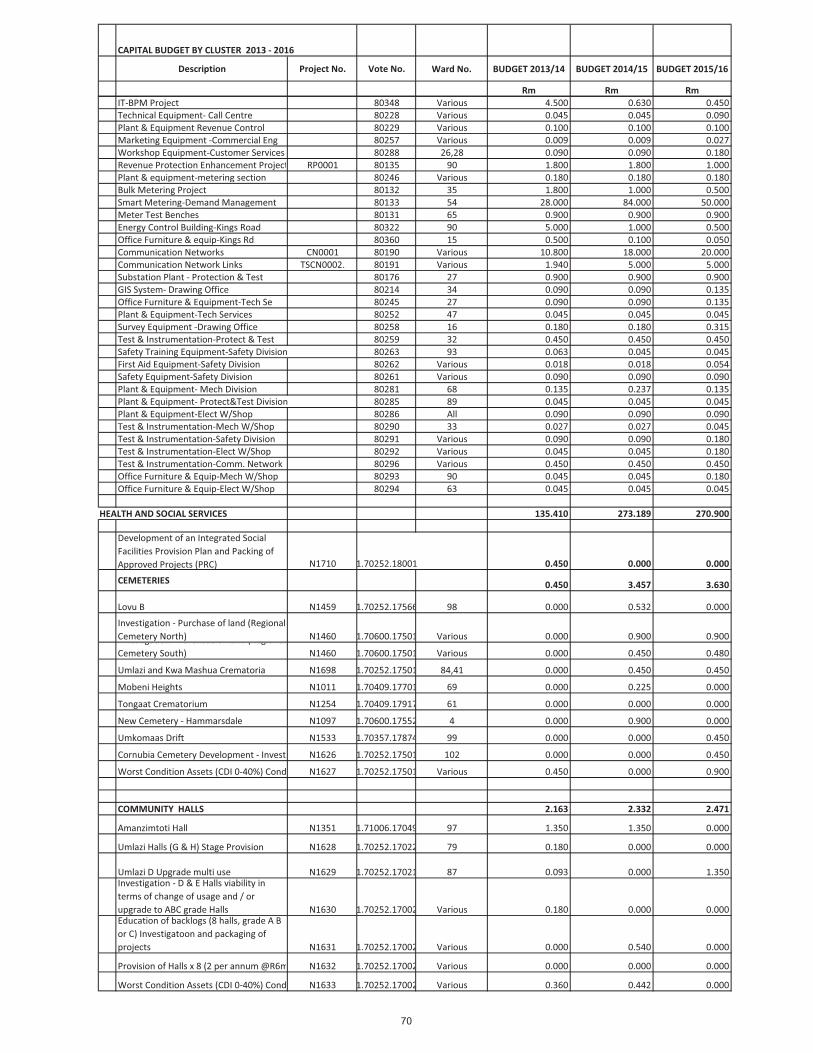
CAPITAL BUDGET BY CLUSTER 2013 - 2016
Description Project No. Vote No. Ward No. BUDGET 2013/14 BUDGET 2014/15 BUDGET 2015/16
Rm Rm Rm
IT-BPM Project 80348 Various 4.500 0.630 0.450
Technical Equipment- Call Centre 80228 Various 0.045 0.045 0.090
Plant & Equipment Revenue Control 80229 Various 0.100 0.100 0.100
Marketing Equipment -Commercial Eng 80257 Various 0.009 0.009 0.027
Workshop Equipment-Customer Services 80288 26,28 0.090 0.090 0.180
Revenue Protection Enhancement Project RP0001 80135 90 1.800 1.800 1.000
Plant & equipment-metering section 80246 Various 0.180 0.180 0.180
Bulk Metering Project 80132 35 1.800 1.000 0.500
Smart Metering-Demand Management 80133 54 28.000 84.000 50.000
Meter Test Benches 80131 65 0.900 0.900 0.900
Energy Control Building-Kings Road 80322 90 5.000 1.000 0.500
Office Furniture & equip-Kings Rd 80360 15 0.500 0.100 0.050
Communication Networks CN0001 80190 Various 10.800 18.000 20.000
Communication Network Links TSCN0002. 80191 Various 1.940 5.000 5.000
Substation Plant - Protection & Test 80176 27 0.900 0.900 0.900
GIS System- Drawing Office 80214 34 0.090 0.090 0.135
Office Furniture & Equipment-Tech Se 80245 27 0.090 0.090 0.135
Plant & Equipment-Tech Services 80252 47 0.045 0.045 0.045
Survey Equipment -Drawing Office 80258 16 0.180 0.180 0.315
Test & Instrumentation-Protect & Test 80259 32 0.450 0.450 0.450
Safety Training Equipment-Safety Division 80263 93 0.063 0.045 0.045
First Aid Equipment-Safety Division 80262 Various 0.018 0.018 0.054
Safety Equipment-Safety Division 80261 Various 0.090 0.090 0.090
Plant & Equipment- Mech Division 80281 68 0.135 0.237 0.135
Plant & Equipment- Protect&Test Division 80285 89 0.045 0.045 0.045
Plant & Equipment-Elect W/Shop 80286 All 0.090 0.090 0.090
Test & Instrumentation-Mech W/Shop 80290 33 0.027 0.027 0.045
Test & Instrumentation-Safety Division 80291 Various 0.090 0.090 0.180
Test & Instrumentation-Elect W/Shop 80292 Various 0.045 0.045 0.180
Test & Instrumentation-Comm. Network 80296 Various 0.450 0.450 0.450
Office Furniture & Equip-Mech W/Shop 80293 90 0.045 0.045 0.180
Office Furniture & Equip-Elect W/Shop 80294 63 0.045 0.045 0.045
HEALTH AND SOCIAL SERVICES 135.410 273.189 270.900
Development of an Integrated Social
Facilities Provision Plan and Packing of
Approved Projects (PRC) N1710 1.70252.18001 0.450 0.000 0.000
CEMETERIES 0.450 3.457 3.630
Lovu B N1459 1.70252.17566 98 0.000 0.532 0.000
Investigation - Purchase of land (Regional
Cemetery North) N1460 1.70600.17501 Various 0.000 0.900 0.900Investigation - Purchase of land (Regional
Cemetery South) N1460 1.70600.17501 Various 0.000 0.450 0.480
Umlazi and Kwa Mashua Crematoria N1698 1.70252.17501 84,41 0.000 0.450 0.450
Mobeni Heights N1011 1.70409.17701 69 0.000 0.225 0.000
Tongaat Crematorium N1254 1.70409.17917 61 0.000 0.000 0.000
New Cemetery - Hammarsdale N1097 1.70600.17552 4 0.000 0.900 0.000
Umkomaas Drift N1533 1.70357.17874 99 0.000 0.000 0.450
Cornubia Cemetery Development - InvestigationN1626 1.70252.17501 102 0.000 0.000 0.450
Worst Condition Assets (CDI 0-40%) Condition IndexN1627 1.70252.17501 Various 0.450 0.000 0.900
COMMUNITY HALLS 2.163 2.332 2.471
Amanzimtoti Hall N1351 1.71006.17049 97 1.350 1.350 0.000
Umlazi Halls (G & H) Stage Provision N1628 1.70252.17022 79 0.180 0.000 0.000
Umlazi D Upgrade multi use N1629 1.70252.17021 87 0.093 0.000 1.350Investigation - D & E Halls viability in
terms of change of usage and / or
upgrade to ABC grade Halls N1630 1.70252.17002 Various 0.180 0.000 0.000Education of backlogs (8 halls, grade A B
or C) Investigatoon and packaging of
projects N1631 1.70252.17002 Various 0.000 0.540 0.000
Provision of Halls x 8 (2 per annum @R6m) N1632 1.70252.17002 Various 0.000 0.000 0.000
Worst Condition Assets (CDI 0-40%) Condition IndexN1633 1.70252.17002 Various 0.360 0.442 0.000
70

CAPITAL BUDGET BY CLUSTER 2013 - 2016
Description Project No. Vote No. Ward No. BUDGET 2013/14 BUDGET 2014/15 BUDGET 2015/16
Rm Rm Rm
Worst Condition Assets (CDI 40%-60%) Condition IndexN1634 1.70252.17002 Various 0.000 0.000 1.121
LIBRARIES 59.589 179.640 185.900
Purchase of Library Books 1.73082.15033 Various 10.009 13.770 14.400
Purchase of Library Books (Carnegie) 1.73085.15035 Various 3.600 3.600 0.000
Computer Network (ICT) 1.73550.15035 Various 0.000 0.000 0.000
New Central Library (Library subsidy ringfenced)N1225 1.99990 26 34.000 112.200 122.000
New Central Library (Province Grant) N1225 1.70252.15050 26 10.000 7.500 0.000
New Central Library (Council Funded)) N1225 1.70252.15050 26 0.000 6.570 22.500
Whetstone Library N1225 1.70252.15050 26 1.530 0.000 0.000
KwaNdengezi Regional Library N1218 1.71241.15427 12 0.000 3.780 13.500
Ntshonweni Community Library N1577 1.70252.15468 7 0.000 0.450 0.000
E M L Infrastructure Upgrade N1578 1.70830.15055 32 0.450 13.320 0.000
Tshelimnyama Community Library N1352 1.72095.15429 15 0.000 13.500 0.000
Libraries - Block Sum N1578 1.70252.15032 32 0.000 0.000 0.000
Umlazi Library N1635 1.70252.15069 82 0.000 0.900 3.600
Fencing : Libraries N1636 1.71148.15032 Various 0.000 2.700 0.900
Kwa Ximba Library N1637 1.70252.15473 1 0.000 0.450 0.900
Umbumbulu Library N1638 1.70252.15468 100 0.000 0.450 0.900
Umzinyathi Library N1639 1.70252.15471 45 0.000 0.450 0.900
Air Conditioning: Libraries 0.000 0.000 6.300
MUSEUMS 13.650 3.497 6.300
Museums - Block Sum N1563 1.70252.15501 Various 0.000 0.000 0.000
Heritage Mapping N1609 1.70252.15501 Various 0.000 0.000 0.000
Collections Storage Facility N1610 1.70252.15501 Various 0.450 0.000 4.118
KwaMuhle Museum N1355 1.70880.15560 28 0.000 0.000 0.000
Umlazi Community Art Centre N1699 1.70252.15501 76 0.000 0.797 2.182
Liberation Route Nodes N1640 1.70252.15501 Various 0.000 0.900 0.000
Port Natal Maritime Museum staff & visitors facilitiesN1253 1.70252.15540 28 0.000 0.900 0.000
Cato Manor Museum (Lotto) N1341 1.71935.15580 29 13.200 0.900 0.000
Cato Manor Museum (Council) N1340 1.71935.15580 29 0.000 0.000 0.000
Natural Science Museum : Development N1354 1.70252.15521 28 0.000 0.000 0.000
Conversion of Umlazi D Hall to Art Centre N1641 1.70252.15501 87 0.000 0.000 0.000
PARKS 4.235 13.437 9.900
How Long Park N1573 1.70252.18152 86 0.450 0.720 0.000
Japanese Gardens (Durban North) N1480 1.70020.18101 36 0.000 0.720 0.000
Bulwer Park N1581 1.70020.18101 33 0.725 0.720 0.000
Replacement of fences Natural Resources N1485 1.71148.18101 Various 0.180 0.000 0.000Randles Nursery (Upgrade Infrastructure
and Centralisation of Nurseries) N1557 1.70252.18010 25 0.000 0.450 0.000
Japanese Gardens (PTN) N1480 1.70020.18101 16 0.180 0.450 0.000
Umgeni River Bird Park N1240 1.70020.18301 36 0.270 0.432 0.000
Park Fences N1243 1.72182.16171 27 0.000 0.450 0.000
Mitchell Park Zoo N1155 1.70095.18101 27 0.270 0.720 0.000
Upgrade Local Parks - Wards 48-59 N1236 1.70020.18351 Various 0.000 2.700 0.000
Natural Resources blocksum (include Silverglen)N1558 1.72052.18080 Various 0.000 0.720 0.900Upgrade of Staff Facilities (investigate,
package and provide) N1642 1.70252.18001 Various 0.000 0.000 6.300
Upgrade of existing parks N1243 1.70252.18001 Various 1.800 0.450 2.700
Worst condition assets (CDI 0-40%) Condition IndexN1643 1.70252.18001 Various 0.360 0.405 0.000
Worst condition assets (CDI 40%-60%) Condition IndexN1644 1.70252.18001 Various 0.000 0.000 0.000
Specialised Parks Equipment 1.73711.18001 Various 0.000 4.500 0.000
POOLS AND BEACHES 14.592 33.832 35.861
RF Pool 0.000 0.000 1.350
Buffesdale Pool 0.000 0.000 2.700
Nagina Pool 0.000 0.000 1.350
Chesterville Pool 0.000 0.000 1.350
71

CAPITAL BUDGET BY CLUSTER 2013 - 2016
Description Project No. Vote No. Ward No. BUDGET 2013/14 BUDGET 2014/15 BUDGET 2015/16
Rm Rm Rm
Inanda Pool (New) N1134 1.72182.16177 0.000 0.000 9.000
Pool - New (investigation and packaging)
(8) D2;D3; 4xD4;D5;D9 N1353 1.71920.16002 Various 0.000 0.000 0.000
Isipingo Pool N1570 1.70252.16224 89,90 0.000 0.000 0.000Upgrading of existing facilities (heating
of 3 pools) Chatsworth, Kwa Mashua and
Phoenix N1645 1.70252.16002 Various 3.150 0.000 0.000
Upgrade of existing facility - Kingsburgh N1646 1.70252.16002 97 0.000 0.000 0.000Eradiction of backlogs (8 swimming
pools) - investigation and packaging of
projects D2;D3; 4xD4; D5; D9 N1647 1.70252.16002 Various 0.000 22.500 0.000
Worst condition assets (CDI 0-40%) Condition IndexN1648 1.70252.16002 Various 0.000 4.500 0.000
Worst condition assets (CDI 40%-60%) Condition IndexN1649 1.70252.16002 Various 0.000 0.000 2.250
Shallcross Swimming Pool: Rehabilitation N1476 1.70252.16002 3.600 0.000 0.000
Laguna Pools :Rehabilitation N1659 1.70252.16172 2.889 0.000 0.000
Kings Park Pool: Roof Repairs N1232 1.70252.16171 3.600 0.000 0.000
Beaches 0.000 0.000 0.000
Umgababa Beach 1.70252.16225 0.000 0.000 9.000
Umhlanga Beach EIA, Investigation and packagingN1619 1.70252.16006 35 1.353 2.332 1.661
Amanzimtoti Lifeguard Tower N1650 1.70252.16224 97 0.000 0.000 2.700
Worst condition assets (CDI 0-40%) Condition IndexN1651 1.70252.16002 Various 0.000 4.500 4.500
Worst condition assets (CDI 40%-60%) Condition IndexN1652 1.70252.16002 Various 0.000 0.000 0.000
SPORT AND RECREATION 10.020 11.994 16.937
Rural Areas: New Sport Facilities 0.000 0.000 4.500
Umbilo Congella Sports Facility N1548 1.70252.16511 32,33 0.000 0.900 0.000
Existing assets upgrade N1585 1.70252.16502 Various 0.000 0.900 0.000
Cato Crest Ground Toilet N1586 1.70252.16502 101 0.000 0.900 0.000
Kwa Mashua Section E : Cricket Ground N1525 1.71974.16520 46 0.000 3.129 2.700
Netball courts upgrade N1559 1.72046.16502 Various 0.000 0.000 0.000
Tennis court upgrade N1560 1.72186.16502 Various 0.000 0.000 0.000
Worst condition assets (CDI 0-40%) Condition IndexN1654 1.70252.16502 Various 0.360 0.405 0.000
Development of Kickabout Facilities N1435 1.72118.16502 Various 1.800 1.260 6.137
Venrova kickabout N1436 1.72118.16533 62 0.000 0.000 0.000
Worst condition assets (CDI 40%-60%) Condition IndexN1658 1.70252.16502 Various 0.000 0.000 3.600
Umlazi - King Zwelithini Stadium N1660 1.70252.16559 87 1.620 1.620 0.000
Kwa Mashu - Princess Magogo Stadium N1661 1.70252.16558 45 1.440 1.440 0.000
Clermont - Sugar Ray Xulu Stadium N1662 1.70252.16566 20 1.440 1.440 0.000
Upgrading and Development of Sport Facilities N1524 1.71946.16521 0.450 0.000 0.000
Umzinyati Sport Field N1620 1.72114.16527 1.800 0.000 0.000
Nazareth Sport Field 1.110 0.000 0.000
CLINICS 30.262 25.000 9.900
Strategic Social Facilities N1521 1.70252.23053 Various 0.000 0.000 0.000
Clinic Alterations - Blocksum N1213 1.70252.23024 Various 0.000 0.000 0.000
Stonebridge Clinic N1663 48 8.310 0.000 0.000
Nagina Clinic N1664 13 6.750 0.000 0.000
New Project - Redcliffe Clinic N1665 59 1.122 0.000 0.000
New Project - Terrance Park Clinic N1666 59 1.962 0.000 0.000
New Project - Overport Clinic N1667 31 2.947 0.000 0.000
New Project - Township Centre Clinic N1668 65 1.549 0.000 0.000
New Project - Kingsburgh Clinic N1669 97 1.250 0.000 0.000
Offices & Shelving at new Pharmacy Depot N1670 28 3.222 0.000 0.000
Umhlanga Infrastructure 35 0.000 5.400 2.700
Clare Estate 23 0.000 0.000 1.350
Merebank 68 0.000 0.000 0.900
Austerville 67 0.000 0.000 0.900
Lalucia 35 0.000 5.400 0.000
Sydenham 25 0.000 9.000 0.000
Health Care Waste Areas - all Clinics Various 0.000 1.800 0.900
Monitoring Stations Various 1.350 1.600 1.350
Mobile Clinics ( Service to Rural Areas) Various 1.800 1.800 1.800
SOCIAL AND SECURITY SERVICES 81.521 93.878 91.790
FIRE AND EMERGENCY SERVICES 35.072 51.938 60.072
Fire Fighting Equipment at Depots 1.73837.21022 Various 1.620 1.889 3.067
72

CAPITAL BUDGET BY CLUSTER 2013 - 2016
Description Project No. Vote No. Ward No. BUDGET 2013/14 BUDGET 2014/15 BUDGET 2015/16
Rm Rm Rm
Fire and Emergency - Training Facility N1520 C1787 98 6.975 4.073 1.890
Verulam Fire Station (Permanent Facility) N1505 1.71153.21022 58 12.000 10.000 17.056
Verulam Fire Station ( Temporary Facility) 1.70407.21462 58 0.900 0.000 0.000
Umkomaas Fire Station (Temporary Facility) N1506 1.70407.21462 99 0.900 0.000 0.000
Umkomaas Fire Station (Permanent Facility) N1506 1.71153.21022 99 0.000 9.000 10.850
Umhlanga Fire Station (Temporary Fire Station) 1.70407.21403 35 0.441 0.000 0.000
Cato Ridge Fire Station (Permanent Fire Station)N1163 1.71153.21022 1 0.000 17.897 0.000
Fire HQ (Temporary Facility) 1.71153.21022 28 0.441 0.000 0.000
Specialist Support Vehicles - Fire 1.73966.21022 Various 2.700 5.724 23.004
Data Mining ESS 1.74153.21022 Various 0.900 0.000 1.800
Renovations and alterations (Prospecton) 1.70830.21622 90 1.800 0.000 1.800
Renovations and alterations (HQ) 1.70830.21022 28 3.830 0.000 0.000
Renovations and alterations (Congella) 1.70830.21032 32 0.270 0.000 0.000
Renovations and alterations (Phoenix) 1.70830.21442 49 0.180 0.000 0.000
Renovations and alterations (Umlazi) 1.70830.21612 79 0.180 0.000 0.000
Renovations and alterations (Pinetown) 1.70830.21203 18 0.900 0.000 0.000
Renovations and alterations (Hammarsdale) 1.70830.21232 4 0.180 0.000 0.000
Renovations and alterations (Brigades) 1.70830.21022 Various 0.855 2.724 0.605
Renovations and alterations (Durban North) 1.70830.21432 36 0.000 0.180 0.000
Renovations and alterations (Gillits) 1.70830.21242 10 0.000 0.450 0.000
EMERGENCY CONTROL AND DISASTER MANAGEMENT 34.200 34.857 23.850
Pinetown CCTV Control Centre N1535 1.71052.21810 18 0.450 0.450 0.450
Replacement of CCTV equipment 1.71052.21810 Various 2.700 2.700 2.250
CCTV N1534 1.71052.21810 Various 4.050 3.807 0.000
CCTV Spares 1.71052.21810 Various 0.900 0.900 0.900
Disaster Management CCTV system 1.71052.24410 Various 4.500 4.500 2.700Expansion of CCTV network in
accordance with crime trends and
statistics
1.71052.218
10 Various 4.500 4.500 3.150
Wireless communication 1.71052.21810 Various 1.350 1.800 2.250
Reinstatement of the fire optic cable infrastructure 1.71052.21810 Various 4.500 4.500 3.150
Installation of long range night vision and
thermal imaging cameras 1.71052.21810 Various 1.350 1.800 1.800
INK initiative CCTV system 1.71052.21810 Various 9.000 9.000 6.300
Emergency Services System (ESS) N1549 1.74153.21700 Various 0.900 0.900 0.900
METRO POLICE 2.277 7.083 7.868
Access Ramps Metro HQ 1.70830.20051 28 0.000 1.800 0.000
Refurbishment - Mpumalanga 1.70830.20051 6,91 0.000 0.900 0.000
Refurbishment - Umlazi 1.70830.20051 76 0.000 0.900 0.000
Refurbishment - Queensburgh 1.70830.20051 63 0.000 1.800 0.000
Refurbishment of Verulam Metro Police Station 1.70252.20051 60 0.450 0.000 0.000
Refurbishment of Boscombe Terrace Metro Police Station 1.70252.20051 26 1.350 0.900 0.000
Refurbishment of Albert Park Metro Police hawker unit facilities1.70830.20051 32 0.000 0.000 0.000
Refurbisment of Lahee Park training facility N1568 1.70252.20051 18 0.477 0.000 0.000
Kwa Mashua - Walkin safe 1.70830.20051 46 0.000 0.783 0.000
Umlazi Police Station (Permanemt facility) 1.71471.20051 0.000 0.000 7.868
SECURITY MANAGEMENT 9.972 0.000 0.000
Security management - New facilities N1608 1.70252.24420 27 9.972 0.000 0.000
SUSTAINABLE DEVELOPMENT AND CITY ENTERPRISES 160.157 204.740 247.100
ECONOMIC DEVELOPMENT 105.188 154.300 181.000
NEIGHBOURHOOD DEVELOPMENT 3.555 70.000 75.000
KwaMashu Town Centre S1038 1.71939.12010 41,45 3.555 0.467 0.000
Clermont & KwaDabeka S1047 1.71939.12010 19,20,22 0.000 19.998 12.400
INK S1060 1.71939.12010 Various 0.000 22.178 17.600
Umlazi S1048 1.71939.1201074,76,80,81,82,88,90 0.000 10.000 21.000
Neighbourhood Development Blocksum S1103 1.71939.12010 Various 0.000 17.357 24.000
TOWN CENTRE RENEWAL 73.894 55.800 69.000
Town Centre Renewal - Isipingo S1019 1.71939.12010 89 12.800 6.400 4.000
Town Centre Renewal - Tongaat S1024 1.71939.12010 61 2.100 1.600 0.000
Town Centre Renewal - Hammarsdale S1061 1.71939.12010 4 10.400 8.000 4.000
Town Centre Renewal - Umlazi S1062 1.71939.1201074,76,80,81,82,88,90 8.500 6.000 40.000
Town Centre Renewal - Umlazi (Ezimbuzini) S1028 1.71939.1201074,76,80,81,82,88,90 5.000 6.000 0.000
73
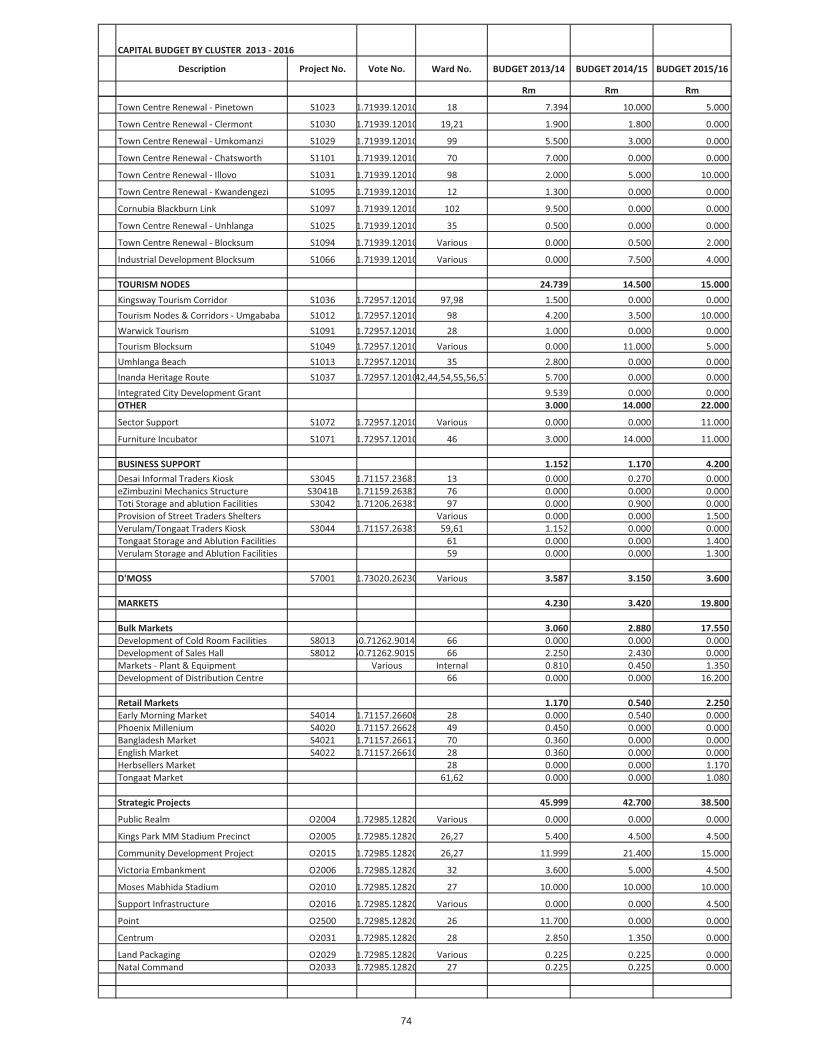
CAPITAL BUDGET BY CLUSTER 2013 - 2016
Description Project No. Vote No. Ward No. BUDGET 2013/14 BUDGET 2014/15 BUDGET 2015/16
Rm Rm Rm
Town Centre Renewal - Pinetown S1023 1.71939.12010 18 7.394 10.000 5.000
Town Centre Renewal - Clermont S1030 1.71939.12010 19,21 1.900 1.800 0.000
Town Centre Renewal - Umkomanzi S1029 1.71939.12010 99 5.500 3.000 0.000
Town Centre Renewal - Chatsworth S1101 1.71939.12010 70 7.000 0.000 0.000
Town Centre Renewal - Illovo S1031 1.71939.12010 98 2.000 5.000 10.000
Town Centre Renewal - Kwandengezi S1095 1.71939.12010 12 1.300 0.000 0.000
Cornubia Blackburn Link S1097 1.71939.12010 102 9.500 0.000 0.000
Town Centre Renewal - Unhlanga S1025 1.71939.12010 35 0.500 0.000 0.000
Town Centre Renewal - Blocksum S1094 1.71939.12010 Various 0.000 0.500 2.000
Industrial Development Blocksum S1066 1.71939.12010 Various 0.000 7.500 4.000
TOURISM NODES 24.739 14.500 15.000
Kingsway Tourism Corridor S1036 1.72957.12010 97,98 1.500 0.000 0.000
Tourism Nodes & Corridors - Umgababa S1012 1.72957.12010 98 4.200 3.500 10.000
Warwick Tourism S1091 1.72957.12010 28 1.000 0.000 0.000
Tourism Blocksum S1049 1.72957.12010 Various 0.000 11.000 5.000
Umhlanga Beach S1013 1.72957.12010 35 2.800 0.000 0.000
Inanda Heritage Route S1037 1.72957.1201042,44,54,55,56,57 5.700 0.000 0.000
Integrated City Development Grant 9.539 0.000 0.000
OTHER 3.000 14.000 22.000
Sector Support S1072 1.72957.12010 Various 0.000 0.000 11.000
Furniture Incubator S1071 1.72957.12010 46 3.000 14.000 11.000
BUSINESS SUPPORT 1.152 1.170 4.200
Desai Informal Traders Kiosk S3045 1.71157.23681 13 0.000 0.270 0.000
eZimbuzini Mechanics Structure S3041B 1.71159.26381 76 0.000 0.000 0.000
Toti Storage and ablution Facilities S3042 1.71206.26381 97 0.000 0.900 0.000
Provision of Street Traders Shelters Various 0.000 0.000 1.500
Verulam/Tongaat Traders Kiosk S3044 1.71157.26381 59,61 1.152 0.000 0.000
Tongaat Storage and Ablution Facilities 61 0.000 0.000 1.400
Verulam Storage and Ablution Facilities 59 0.000 0.000 1.300
D'MOSS S7001 1.73020.26230 Various 3.587 3.150 3.600
MARKETS 4.230 3.420 19.800
Bulk Markets 3.060 2.880 17.550
Development of Cold Room Facilities S8013 50.71262.90141 66 0.000 0.000 0.000
Development of Sales Hall S8012 50.71262.90151 66 2.250 2.430 0.000
Markets - Plant & Equipment Various Internal 0.810 0.450 1.350
Development of Distribution Centre 66 0.000 0.000 16.200
Retail Markets 1.170 0.540 2.250
Early Morning Market S4014 1.71157.26608 28 0.000 0.540 0.000
Phoenix Millenium S4020 1.71157.26628 49 0.450 0.000 0.000
Bangladesh Market S4021 1.71157.26617 70 0.360 0.000 0.000
English Market S4022 1.71157.26610 28 0.360 0.000 0.000
Herbsellers Market 28 0.000 0.000 1.170
Tongaat Market 61,62 0.000 0.000 1.080
Strategic Projects 45.999 42.700 38.500
Public Realm O2004 1.72985.12820 Various 0.000 0.000 0.000
Kings Park MM Stadium Precinct O2005 1.72985.12820 26,27 5.400 4.500 4.500
Community Development Project O2015 1.72985.12820 26,27 11.999 21.400 15.000
Victoria Embankment O2006 1.72985.12820 32 3.600 5.000 4.500
Moses Mabhida Stadium O2010 1.72985.12820 27 10.000 10.000 10.000
Support Infrastructure O2016 1.72985.12820 Various 0.000 0.000 4.500
Point O2500 1.72985.12820 26 11.700 0.000 0.000
Centrum O2031 1.72985.12820 28 2.850 1.350 0.000
Land Packaging O2029 1.72985.12820 Various 0.225 0.225 0.000
Natal Command O2033 1.72985.12820 27 0.225 0.225 0.000
74

CAPITAL BUDGET BY CLUSTER 2013 - 2016
Description Project No. Vote No. Ward No. BUDGET 2013/14 BUDGET 2014/15 BUDGET 2015/16
Rm Rm Rm
TREASURY 110.580 144.750 115.932
Outer West Satelite Workshop Facility 1.70880.77260 Internal 4.500 4.500 1.800
Vehicle Washing Facility - Central 1.70880.77110 Internal 1.800 0.000 0.000
Panel Shop - Spraybooth Replacement 1.70880.77130 Internal 1.800 0.000 0.000
Specialised Workshop Equipment 1.73837.77120 Internal 1.800 1.800 1.800
Fleet Replacement & Maintenance - R & G 1.74131.77350 Internal 29.000 41.000 46.700
Ottawa Workshop 1.70880.78100 Internal 0.000 9.000 4.500
Vehicle Tracking sytem 0.000 0.000 18.000
Fleet Management 1.73510.77170 Internal 1.800 1.800 0.450
Springfield Complex - Plant & Vehicle Hub 1.70880.77280 Internal 9.000 18.000 22.500
Plant and Equipment 1.70909.10810 Internal 4.500 4.500 4.500
Building Refurbishment/Upgrade 1.70880.11985 Internal 2.250 2.250 2.250
Real Estate V1194 1.70600.11999 Various 5.130 4.500 4.500
Revenue Blocksum 1.70800.11068 Internal 5.400 5.400 5.400
Supply Chain Management Plant & Equipment 1.73250.41500 Internal 0.000 0.000 0.450
Plant and Equipment 1.73250.11062 Internal 0.000 0.000 0.675
Building Refurbishment/Upgrade to 10th floor FMB Internal 0.000 0.000 1.800
Airconditioning Replacement at Rennie's House Internal 0.000 0.000 0.045
Upgrade CCTV Cameras At Rennies House Internal 0.000 0.000 0.540
Plant and Equipment - Insurance Internal 0.000 0.000 0.022
RMS 1.74152.11062 40.000 52.000 0.000
Refurbishment of Windere Street - 4th Floor T7122.7480 Internal 3.600 0.000 0.000
GOVERNANCE 13.500 23.680 14.310
City Hall
New Exterior Lighting 1.70880.11781 Internal 0.000 1.350 0.000
Wheelchair ramps at all 3 entrances G1002 1.70880.11781 Internal 1.170 0.000 1.350
Upgrade Interior Entrance G1002 1.70880.11781 Internal 0.000 0.000 0.000
Upgrading of Airconditioning G1001 1.70880.11781 Internal 7.200 9.000 6.480
City Hall Roof Replacement G1001 1.70880.11781 28 0.000 1.350 1.350
Council Chamber Allied Facilities 1.70880.11781 Internal 0.000 0.900 0.000
CPAS Blocksum 1.73250.12722 1.800 0.000 0.000
Records Management System Software G1004 1.70880.11781 Internal 2.250 1.080 1.350
Archive Storage Warehouse 0.000 0.000 0.000
Upgrade / Replacement of Pipes 0.000 0.000 2.700
Rationalise Circulation 2 new lifts in west foyer 1.70880.11781 Internal 1.080 0.000 1.080
Regional Centres 0.000 10.000 0.000
CORPORATE HUMAN RESOURCES 10.170 2.250 0.810
HUMAN RESOURCES 9.090 2.250 0.450
Old Canteen Building 1.70884.12772 Internal 5.310 0.000 0.000
Roll out of E-Recruitment (Kiosks) 1.70884.12772 Internal 1.350 2.250 0.000
Building Refurbishment / Upgrade - 7
Meller Road, C&SW HR Department
1.70884.615
05 Internal 2.340 0.000 0.000Building Refurbishment / Upgrade -
Room 301 & Room 323, City Engineer's
Bldg, HR Department
1.70884.127
52 Internal 0.090 0.000 0.000
Building Refurbishment / Upgrade
1.70884.127
52 Internal 0.000 0.000 0.360
Relocation of offices
1.70884.127
55 Internal 0.000 0.000 0.090
OCCUPATIONAL HEALTH AND SAFETY 1.080 0.000 0.360
Construction of new Clinic at Illovo/South Region 1.71300.12660 98 0.810 0.000 0.000
Refurbishment of existing 6 Clinics 1.71300.12660 internal 0.270 0.000 0.360
OFFICE OF THE CITY MANAGER 167.200 159.010 196.900
INFORMATION TECHNOLOGY 97.200 89.010 99.900
Radio Comm. Infrast. - Highsite Accom. Enhan - MarlightO3013 1.70880.12261 Various 3.600 2.700 2.700
Customer Relationship Management O1002 1.73301.12103 Internal 0.000 0.450 0.450
Collaboration Tools O1003 1.73301.12103 Internal 0.000 0.000 0.000
Street Name Signs R1003 1.72505.12747 Various 0.513 0.000 0.000
Infrastructure Management Tools O1010 1.73301.12103 Internal 0.720 0.450 0.900
Infrastructure -Telecom O1046 1.73550.12205 Internal 0.990 0.450 4.500
Knowledge Management Systems R1005 Internal 0.000 0.450 0.000
75

CAPITAL BUDGET BY CLUSTER 2013 - 2016
Description Project No. Vote No. Ward No. BUDGET 2013/14 BUDGET 2014/15 BUDGET 2015/16
Rm Rm Rm
Fixed Assets Integration O1034 1.73301.12103 Internal 0.900 0.450 0.900
E- Procurement O1004 1.73301.12103 Internal 1.530 0.900 2.700
Implement COBIT/ITIL O1059 1.73301.12103 Internal 0.000 0.450 0.450
Treasury - Networking of Telecommunication SystemO1029 1.73753.12205 Internal 0.225 0.180 0.450
Enterprise Architecture O1056 1.73301.12103 Internal 0.450 0.270 0.450
BEE Faciliatation and Tender Process ImprovementO1086 1.73301.12103 Internal 0.000 0.225 0.450
Integrated Procurement and Man. And Monioring Sys.O1087 1.73301.12103 Internal 0.000 0.225 0.450
Video Conferencing O1058 1.73301.12103 Internal 0.450 0.450 0.450
Payroll &HR Scheduling System -Metro Police LinkI0003 1.73511.12755 Internal 0.513 0.090 0.450
Performance Management Solution O1020 1.73512.12103 Internal 1.755 0.180 1.800
Desktop Infra: Desktop tools O1062 1.73301.12103 Internal 0.900 1.080 1.350
Telephony O1071 1.73753.12205 Internal 1.125 1.125 1.800
Datacente Infra: Enviromentals O1067 1.73301.12103 Internal 1.530 1.350 1.800
eLearning O1055 1.73301.12103 Internal 0.900 1.080 0.900
Data Warehousing, Business Intelligence & App IntegrationO1009 1.73301.12103 Internal 2.574 3.600 4.500
Antivirus/Patch Management O1072 1.73301.12103 Internal 0.810 0.900 1.350
Datacente Infra: Backup Robot O1065 1.73301.12103 Internal 2.061 1.800 2.250
Document Management System O1021 1.73454.12103 Internal 0.720 0.900 1.800
Datacente Infra: Management Tools O1066 1.73301.12103 Internal 0.900 1.080 1.350
IT Tools & Firewalls O1069 1.73301.12103 Internal 1.350 1.350 3.600
Datacente Infra: SAN Storage O1064 1.73301.12103 Internal 3.600 3.600 4.500
Desktop Infra: Upgrades/Equip for new staff O1061 1.73301.12103 Internal 2.610 2.700 3.150
Infrastructure- City Wide O1045 1.73550.12205 Internal 1.350 1.800 1.350
Internet/Intranet Development O1017 1.73475.12205 Internal 2.061 2.700 2.700
Datacente Infra: Servers O1063 1.73301.12103 Internal 3.060 3.150 3.600
Datacente Infra: Consolidation & ModernisationO1068 1.73301.12103 Internal 3.096 3.150 3.600
E-Government Web Based Applications O1005 1.73301.12103 Internal 3.600 3.600 4.500
Switches and Routes for Expansion of network O1070 1.73550.12205 Internal 0.270 0.450 1.800
Business Process Management O1007 1.73301.12103 Internal 4.122 4.500 5.400
Payroll & HR MIS I0001 1.73511.12755 Internal 1.350 1.800 1.800
MS Enterprise Groupwise replacement with MS ExchangeO1057 1.73301.12103 Internal 2.574 2.250 2.250
Software Licences 1.74153.12103 Internal 2.682 2.700 3.150
Fibre, Wireless, Monitoring & Wide Area NetworkO1031 1.73550.12205 Internal 5.130 4.500 4.500
Payroll & HR Time and Attendance I0002 1.73511.12755 Internal 2.520 4.500 4.500
Fibre and Wide Area Network O1018 1.73550.12205 Internal 7.713 6.300 9.000
Major System Enhancement O1082 1.73301.12103 Internal 22.050 14.625 0.000
Information Technology Computers 1.70909.10810 Internal 4.896 4.500 6.300
OCM - STRATEGIC PROJECTS 70.000 70.000 97.000
Economic Development Projects - Other 0.000 0.000 27.000
Zonal Plans - Blocksum 70.000 70.000 70.000
76
SUMMARY OF WARDS

Ward No’s Suburb / Area
1 Cato Ridge, Ximba, Nkandla, Sithumba, Nonoti
2 Imbozamo, Maphephetha, Mqeku
3 Engonweni
4 Hammarsdale, Drummond, Inchanga
5 Mophela / Georgedale, Sankontshe
6 Mpumalanga
7 Cliffdale / Inchanga
8 Embo /Assagay
9 Hillcrest / Waterfall, Forest Hill, Molweni
10 Gillits / Kloof, Winston Park, Albania, Everton, St. Helier
11 Newlands East / KwaMashu, Effingham Heights
12 Kwandengezi
13 Mangangeni / Marianhill
14 Dassnehoek / Sithunda Hill
15 Marianridge / Stkville, Tshelimnyama, Marinnhill, Mpola and surrounds
16 Caversham Glen / Northdene, Hatton Estate and surrounds
17 Klaarwater / Savannah Park, Nagina
18 Pinetown, Cowies Hill, Paradise Valley
19 Wyebank, KwaDabeka
20 Ekuyabuleni/ KwaDabeka
21 New Germany, Clermont, Padfield Park
22 Clermont/ Zakhele Primary School
23 Pemary Ridge, Resmont, Reservoir Hills, Palmiet, Recreation
24 Westville/ Berea West/ Chesterville
25 Sydenham/ Clara Hills, Springfield, Sherwood
26 Durban CBD, City, Point
27 Beach, Windermere, Stamford Hill
28 Musgrave, Morningside, Essenwood
29 Wiggins, Bonela, Chesterville
30 Cato Manor, Cato Crest, Old Dunbar
31 Glenwood, Mayville, Musgrave, Westridge, Sydenham, University
32 Congella, Albert Park, Esplanade, Maydon Wharf
33 Umbilo / Glenwood
34 Effingham, Avoca, Duffs Road, Greenwood Park, Sea Cow Lake
35 Durban North, Glenashley, Virginia, Umgeni Park, Briardene
36 Redhill, Umhlanga Rocks, Glen Anil, Sunningdale, La Lucia
37 Newlands West, Hippo Road
38 Thandolwesizwe/ Lindelani, Richmond Farm
39 KwaMashu A, Duffs Road
40 KwaMashu B
41 KwaMashu – K, C
42 Ntuzuma G, H, J, F
43 Hlalalisa, Ntuzuma
eThekwini Municipality
Summary of Wards
77

Ward No’s Suburb / Area
44 Inanda / Emapulazini
45 KwaMashu L, N, J, P, Ntuzuma C, KwaMancinza
46 KwaMashu – E, F & G
47 KwaMashu M, H/ Bester’s Camp
48 Phoenix Industrial, Greenbury, Stoneridge, Clayfield, Rockford
49 Sunford/ Eastbury, Longcroft
50 Foresthaven, Woodview, Stanmore
51 Shastri Park/Ottawa, Palmview
52 Whetstone/ Brookdale, Westham, Northcroft, Lenham
53 Amawod/ Trenance Manor
54 Ntshungwane/ Newtown C
55 Newtown A & B/ Ekuphakameni
56 Amatikwe/ Phola Mission, Etafuleni
57 Redfern/ Bhambayi/ Ohlange
58 Mt. Edgecombe, Umdloti Beach, La Mercy, Verulam
59 Etafuleni/ Oakford, Amaotana
60 Verulam/ Hazelmere, Redcliffe, Canelands
61 Cottonlands/ Tongaat CBD, Watsonia
62 Hambanathi/ Fairbreeze, Tongaat Beach, Mangwaveni, Ghandi’s Hill
63 Queensburgh, Malvern, Ethembeni, Ekuthuleni, Northdene
64 Yellowwood Park, Montclair, Woodlands
65 Hillary/ Burlington, Bellair, Memorial Park, Mount Vernon, Coedmore
66 Rossburgh, Bluff, Clairwood, Grosvenor, Bayhead, Island View
67 Wentworth, Brighton Beach
68 Mobeni, Jacobs, Austerville, Merewent
69 Bayview, Mobeni Heights, Havenside
70 Silverglen, Woodhurst, Westcliffe
71 Shallcross, Chatsworth
72 Chatsworth, Moorton, Arena Park, Welbedacht
73 Rose Heights, Witteklip, Croftdene, Arena Park
74 Lamontville (Chris Hani)
75 Lamontville (Barcelona)
76 Umlazi S & V/ Glebelands
77 Umlazi H/ Imisebe
78 Umlazi K & L
79 Umlazi F & G
80 Umlazi A, B, E & V
81 Umlazi C
82 Umlazi N, R & W
83 Umlazi J & M
84 Umlazi AA, BB, CC
85 Umlazi N, R, & F, Ogwini, Sizwakele
86 Umlazi Z, Y / Malukazi
eThekwini Municipality
Summary of Wards
78
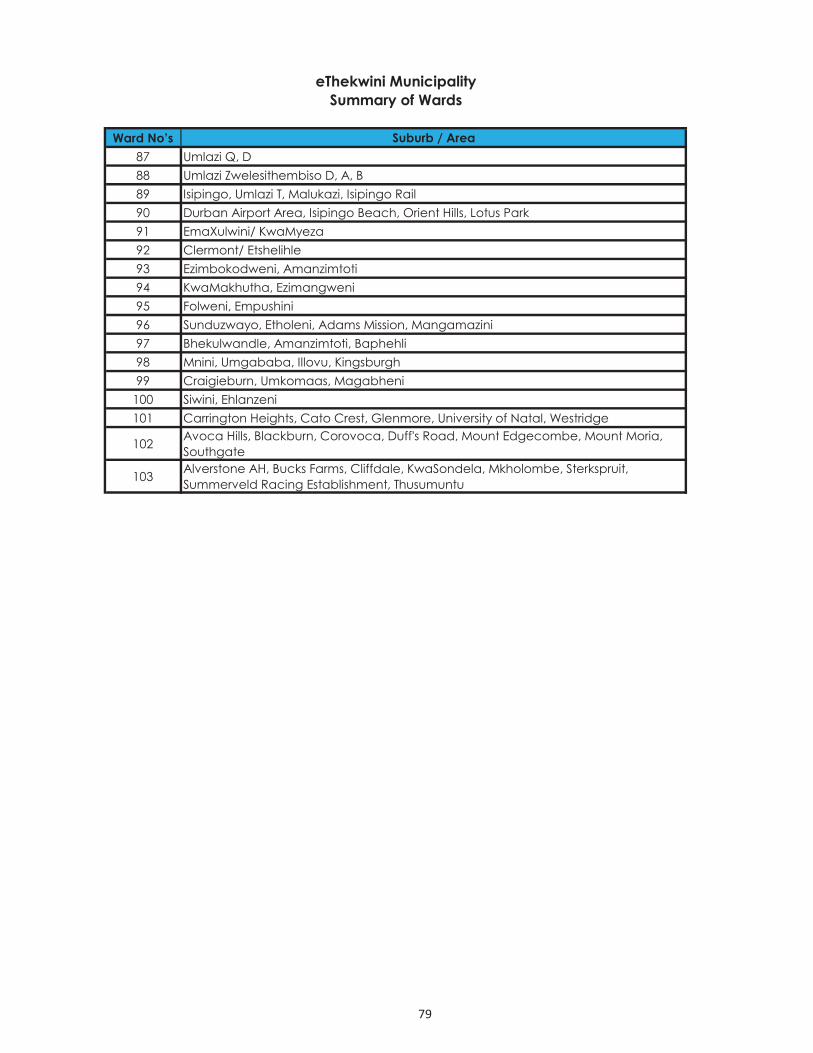
Ward No’s Suburb / Area
87 Umlazi Q, D
88 Umlazi Zwelesithembiso D, A, B
89 Isipingo, Umlazi T, Malukazi, Isipingo Rail
90 Durban Airport Area, Isipingo Beach, Orient Hills, Lotus Park
91 EmaXulwini/ KwaMyeza
92 Clermont/ Etshelihle
93 Ezimbokodweni, Amanzimtoti
94 KwaMakhutha, Ezimangweni
95 Folweni, Empushini
96 Sunduzwayo, Etholeni, Adams Mission, Mangamazini
97 Bhekulwandle, Amanzimtoti, Baphehli
98 Mnini, Umgababa, Illovu, Kingsburgh
99 Craigieburn, Umkomaas, Magabheni
100 Siwini, Ehlanzeni
101 Carrington Heights, Cato Crest, Glenmore, University of Natal, Westridge
102Avoca Hills, Blackburn, Corovoca, Duff's Road, Mount Edgecombe, Mount Moria,
Southgate
103Alverstone AH, Bucks Farms, Cliffdale, KwaSondela, Mkholombe, Sterkspruit,
Summerveld Racing Establishment, Thusumuntu
eThekwini Municipality
Summary of Wards
79