service firms in the politics of u.s. trade policyfaculty.msb.edu/sw439/documents/weymouth pe of...
TRANSCRIPT

Service Firms in the Politics of U.S. Trade Policy∗
Stephen Weymouth†
International Studies Quarterly, Forthcoming
Abstract
Despite the importance of services in international trade and in the support of globalproduction activities, studies of the political economy of trade liberalization tend tofocus on goods trade and the preferences of manufacturing firms and their employees.This paper advocates greater consideration of services firms and services trade in po-litical economy models of trade policy. The argument is built around a number ofstylized facts about U.S. trade in services. The data suggest that the United Statesmaintains a comparative advantage in services trade, which for standard accounts oftrade politics would suggest more homogenous support for trade liberalization withinthe services sector compared to manufacturing. However, the politics of services liber-alization are complicated by the distinct and complex features of international tradein services. Tradable services are delivered internationally through cross-border trade(often electronically), but also through temporary travel and—most importantly forU.S. firms—by a commercial presence (i.e., foreign direct investment). These featuresof services trade imply that governments have an array of policy tools at their disposalwith which to protect domestic firms from foreign competition. This paper documentsthe relative importance of various modes of U.S. trade in services, assesses the relation-ship between service restrictions and trade flows, and discusses how growth in servicestrade may impact firms’ trade policy objectives.
Keywords: international trade, foreign direct investment, global supply chains, in-trafirm trade, offshoring, services, trade agreements, international political economy
∗I am grateful to Brad Jensen, In Song Kim, Dennis Quinn, the ISQ editorial team, and three anonymousreferees for helpful comments and suggestions. I also thank participants at the conference on the Politics ofMultinational Firms, Governments, and Global Production Networks at Princeton University.
†Georgetown University; [email protected]

1 Introduction
This paper examines services trade in the context of the political economy of trade policy.
It presents a number of stylized facts related to three aspects of services trade:
1. The U.S. position in global services trade
2. The multiple modes through which U.S. firms export services
3. The array of policy impediments to services exports
These stylized facts provide a detailed portrait of the ways in which U.S. firms trade in
services, the countries with which they trade, and the policies that impede the international
delivery of services. The unique aspects of services trade suggest that service providers
should be considered potentially important actors in trade politics.
Services dominate the U.S. economy and account for a large share of global economic
activity. Measured in terms of value added, services have grown to around 75% of GDP in
Organisation for Economic Co-operation and Development (OECD) countries and 70% of the
global economy (Francois and Hoekman, 2010). Services include a broad range of activities
and industries. They can either be directly consumed by the buyer or serve as intermediate
inputs that facilitate transactions across distances (e.g. telecommunications services) and
over time (e.g. financial services) (Melvin, 1989). An expansive definition of services includes
any sector or activity not considered a good (goods are defined as agriculture, mining, and
manufacturing).1 According to this definition, services account for around 77% of U.S. GDP
and 80% of the country’s employment.
Along with technological advances and reductions in transportation costs, trade in
services has grown rapidly. Services trade encompasses the multiple modes by which ser-
1This broad definition includes construction, utilities, retail and wholesale trade, finance and insurance,real estate, business services, personal services, accommodations and restaurants, and public administration.
1

vices are delivered across borders, including in person (through travel) or electronically.2
According to the World Trade Organization,3 services make up 21% of global exports, and
have grown at an average of 7.9% every year since 1980 (compared to 6.6% average growth
in goods trade). Services are also key inputs that add significant value to other sectors,
including manufacturing.
Tradable services support the activities of multinational corporations (MNCs) across
a range of non-service activities such as manufacturing. Indeed, tradable services have
enabled the disintegration of the production of manufactured goods to disparate locations
around the world, and over 70% of global services imports are intermediate services.4 For
instance, transportation services move intermediate parts and components (and final goods)
along the global supply chain; financial services provide capital for goods production and
consumption; and legal and other professional services assist in compliance with shipping and
other regulations. As a result, services (measured in terms of value added) represent nearly
50% of global trade (WTO 2009). It is not surprising that a productive and competitive
services sector is associated with growth in goods exports (Arnold, Javorcik, and Mattoo,
2011).5
A relatively small number of countries are responsible for the majority of service
exports. Figure 1 displays the top 30 exporters of commercial services in 2015, which collec-
tively represent over 83% of global commercial service exports. The U.S. accounts for 14%
of service exports, which is nearly double the second leading exporter (China). The top five
exporters (U.S., China, U.K., Germany, and France) generate 36% of global service exports.
2The multiple modes of international services trade are discussed below.
3https://www.wto.org/english/res_e/statis_e/services_training_module_e.pdf
4https://www.oecd.org/sti/ind/interconnected-economies-GVCs-synthesis.pdf
5See Francois and Hoekman (2010) for a review.
2
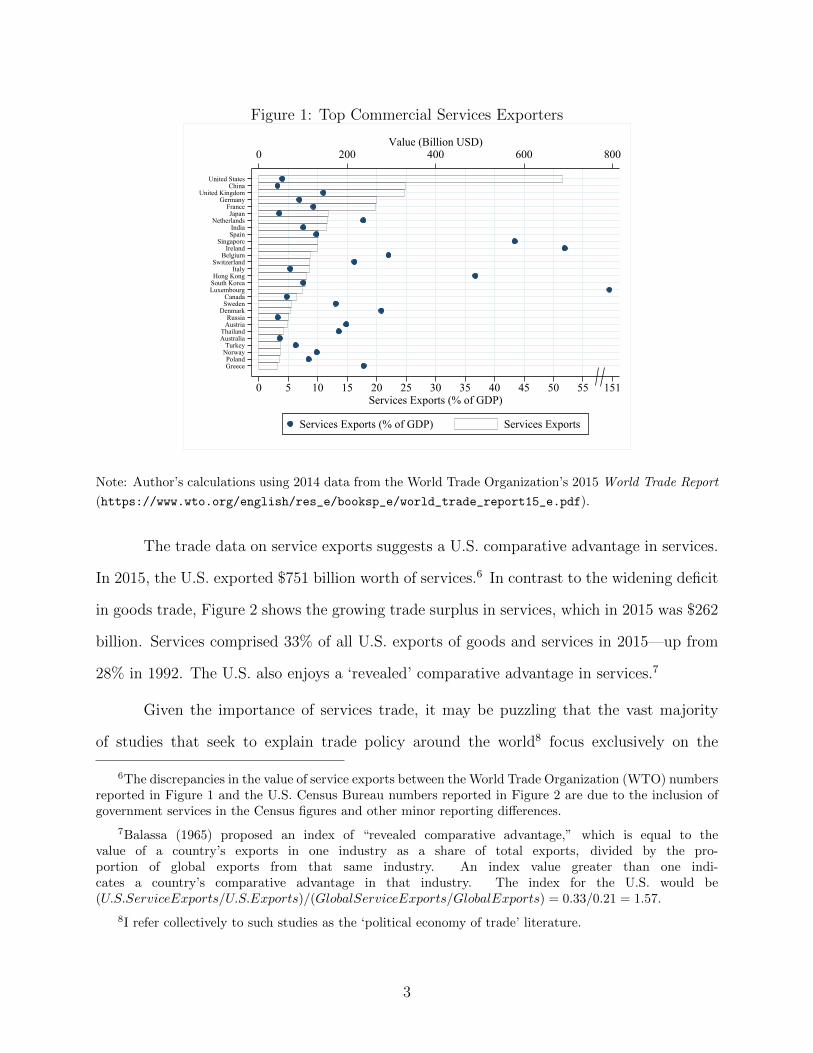
Figure 1: Top Commercial Services Exporters
GreecePoland
NorwayTurkey
AustraliaThailand
AustriaRussia
DenmarkSwedenCanada
LuxembourgSouth KoreaHong Kong
ItalySwitzerland
BelgiumIreland
SingaporeSpainIndia
NetherlandsJapan
FranceGermany
United KingdomChina
United States
0 200 400 600 800Value (Billion USD)
0 5 10 15 20 25 30 35 40 45 50 55 151Services Exports (% of GDP)
Services Exports (% of GDP) Services Exports
Note: Author’s calculations using 2014 data from the World Trade Organization’s 2015 World Trade Report
(https://www.wto.org/english/res_e/booksp_e/world_trade_report15_e.pdf).
The trade data on service exports suggests a U.S. comparative advantage in services.
In 2015, the U.S. exported $751 billion worth of services.6 In contrast to the widening deficit
in goods trade, Figure 2 shows the growing trade surplus in services, which in 2015 was $262
billion. Services comprised 33% of all U.S. exports of goods and services in 2015—up from
28% in 1992. The U.S. also enjoys a ‘revealed’ comparative advantage in services.7
Given the importance of services trade, it may be puzzling that the vast majority
of studies that seek to explain trade policy around the world8 focus exclusively on the
6The discrepancies in the value of service exports between the World Trade Organization (WTO) numbersreported in Figure 1 and the U.S. Census Bureau numbers reported in Figure 2 are due to the inclusion ofgovernment services in the Census figures and other minor reporting differences.
7Balassa (1965) proposed an index of “revealed comparative advantage,” which is equal to thevalue of a country’s exports in one industry as a share of total exports, divided by the pro-portion of global exports from that same industry. An index value greater than one indi-cates a country’s comparative advantage in that industry. The index for the U.S. would be(U.S.ServiceExports/U.S.Exports)/(GlobalServiceExports/GlobalExports) = 0.33/0.21 = 1.57.
8I refer collectively to such studies as the ‘political economy of trade’ literature.
3

Figure 2: U.S. Trade in Goods and Services, 1992–2015
Goods Imports
Goods Exports
Services Exports
Services Imports
Services Balance
Goods Balance
-6-4
-20
2Tr
ade
Bal
ance
(% o
f GD
P)075
01,
500
2,25
0B
illio
ns U
SD
1992 1996 2000 2004 2008 2012 2016
Note: Author’s calculations using publicly available data from the Bureau of Economic Analysis (https:
//www.bea.gov/international/index.htm).
liberalization of restrictions on trade in goods.9 The work mostly attempts to explain the
existence and/or the elimination of tariffs.10 This is potentially an important oversight to the
extent that 1) the modes of delivery of services across borders differ from manufacturing, and
so the set of policy impediments to trade in services differs from those in the manufacturing
sector and/or 2) the distributional implications of the liberalization of services differ from
those for the liberalization of goods (i.e., the sets of winners and losers are different), implying
that pro- and anti-trade coalitions for goods and services may differ.
9An important exception is Chase (2008), who examines protectionist demands by low-skilled workersin the motion picture services industry. See also Hoekman, Mattoo, and Sapir (2007), who discuss the lackof progress in expanding and deepening the coverage of multilateral services liberalization commitments.
10The goods bias in the political economy literature could be due to a variety of factors, including: 1)technological factors that until recently impeded the remote delivery of many services; 2) the difficulties ofmeasuring services barriers (compared to tariff schedules, which are much easier to quantify) make them lessamenable to academic investigation; and 3) weaknesses in services trade data (more on this below). I thankan anonymous referee for raising these potential sources of bias.
4

In this paper, I provide some preliminary evidence that both of these conditions hold
by presenting several stylized facts related to how (and where) U.S. firms export services
abroad. I also discuss some potential implications of the empirical findings for trade politics,
while advocating greater consideration of tradable services firms and workers in political
economy explanations of trade policy.
Recent progress in this area examines the distributional consequences of trade in
services. Jensen, Quinn, and Weymouth (2016) demonstrate that the voting patterns of
workers in high-skilled tradable services appear to reflect U.S. competitiveness in this sector.
Examining the activities of U.S. MNCs, Jensen, Quinn, and Weymouth (2014) show large
gains from services liberalization in host countries: U.S. MNCs expand employment, sales
and revenues following the foreign liberalization of payments for invisibles. This suggests that
MNCs should favor reforms to financial current account transactions and other impediments
to trade in services. Examining the consequences of occupational offshoring, including in
services, Owen and Johnston (2015) find that workers’ attitudes toward trade reflect their
susceptibility to job losses due to offshoring.
This paper provides a first step toward incorporating the activities of services firms
into analyses of trade policy, but it is limited in several important ways. I seek to provide a
richer picture of the international activities of U.S. service suppliers to help illuminate their
trade policy objectives. However, the empirical analysis is largely descriptive and none of
the results should be interpreted causally. (More rigorous empirical analyses will require
firm-level data on the economic and political activities of services firms.) The political
economy implications that are drawn from the analyses in this paper should thus be viewed
as somewhat speculative at this point: each requires much deeper theoretical and empirical
scrutiny than is possible here. With these caveats in place, I hope this paper provides a
useful distillation of the sources of—and the policy obstacles to—U.S. services trade, and
initiates new interest in the participation of service firms in the politics of trade policy.
5

The paper proceeds as follows. The first section provides an overview of the political
economy of trade literature, highlighting the (relative paucity of) work on services trade
and services firms. Next, I describe the various modes of services delivery and the ways in
which U.S. services exports are delivered internationally. I show that firms are more likely to
trade in services through foreign direct investment (FDI) than through alternative modes of
delivery. I present several stylized facts about the relationships between the trade in services
and goods, and the conditions related to service exports. I then discuss impediments to
services trade, and provide preliminary evidence of how these impediments are associated
with decreased service trade volumes. The final section concludes.
2 Political Economy of Trade Literature
Despite the importance of services in international trade and in the support of global produc-
tion activities, the political economy of trade literature primarily focuses on policies affecting
goods trade (mainly tariffs), and the preferences of manufacturing firms and their employees
with respect to these policies. Here I briefly survey the literature examining the ‘demand’
side of trade policies, leaving aside a large body of work on the domestic institutional deter-
minants of trade liberalization and protectionism.11
Foundational studies explaining trade policy rely on factor- and sector-based economic
models to anticipate the expected winners and losers of trade and international financial
flows (Rogowski, 1987; Frieden, 1991; Hiscox, 2002). Hiscox (2002) shows that legislator
support for trade between 1824 and 1994 reflects the expected distributive consequences of
trade openness among class- and industrial-based constituencies. Other work emphasizes
the tradeoffs between national welfare and interest group pressures in the implementation
or liberalization of tariffs (Bailey, Goldstein, and Weingast, 1997; Bagwell and Staiger, 1999;
Grossman and Helpman, 1994).
11However, I note that the institutionalist work tends to be similarly focused on goods trade restrictions.
6

Another strand of the trade policy literature seek strives to explain variation in trade
support within industries. This work increasingly builds on “new, new trade theory” or
“heterogeneous firm” explanations of firms’ participation in international trade (Bernard
and Jensen, 1999; Melitz, 2003). Accordingly, such studies find that firm-level differences
in size, product differentiation, and in the location of their global operations determine
firms’ varied political stances toward trade liberalization (Milner, 1988; Jensen, Quinn, and
Weymouth, 2015; Kim, 2016; Osgood et al., N.d.; Osgood, 2016a,b). For instance, Milner
(1988) and Jensen, Quinn, and Weymouth (2015) demonstrate that firms with global supply
chain operations are less protectionist. Barriers to trade restrict producers’ opportunities
to exploit country differences in the costs of the factors of production, which leads firms to
lobby for trade liberalization with countries from which they source (Chase, 2003; Manger,
2009; Blanchard and Matschke, 2015).
While the trade policy literature focuses almost exclusively on goods trade, a related
literature on the politics of offshoring considers worker and policymaker responses to the
movement of some services jobs overseas. Chase (2008) studies high- and low-skilled service
workers in the motion picture services industry in the United States. He finds that the threat
of low-skilled occupational offshoring leads low-skilled workers to demand forms of trade
protection. Owen and Johnston (2015) demonstrate that workers susceptible to offshoring
tend to oppose free trade,12 and Owen (2016) shows that members of Congress are less likely
to support trade agreements if they have a preponderance of offshorable jobs in their district.
The literature on worker and voter vulnerabilities to offshoring suggests that political
behavior such as voting may reflect exposure to trade competition and offshoring. Exam-
ining county-level U.S. presidential election results, Margalit (2011) demonstrates that em-
ployment dislocations from goods import competition—measured as applications for Trade
Adjustment Assistance (TAA)—weakened support for the incumbent in the 2004 presidential
12Mansfield and Mutz (2013) find that opposition to offshoring reflects nationalist sentiment more thaneconomic interests.
7

election. Feigenbaum and Hall (2015) examine the specific effects of economic shocks from
Chinese import competition, and find that legislators from exposed districts vote in a more
protectionist manner. Autor et al. (2016) argue that the Chinese import shock increased
polarization in U.S. congressional districts. Overall, the literature shows that voters and
their elected representatives respond politically to being on the losing side of trade.
With a few exceptions, the political activities of firms and individuals who have ben-
efited from increased economic integration have been overlooked. As demonstrated here, the
United States has a comparative advantage in services trade, which means that workers in
tradable services should benefit from the liberalization of trade in services. Jensen, Quinn,
and Weymouth (2016) link the expansion of high-skilled tradable services (as well as worker
exposure to manufacturing import competition) to voting in presidential elections. Since
tradable services such as business services are consistent with U.S. comparative advantage,
workers in high-skilled tradable services should benefit from the increased tradability of ser-
vices (Jensen, 2011). Jensen, Quinn, and Weymouth (2016) develop comprehensive measures
of trade exposure in goods and services using census data covering nearly all economic ac-
tivity in the United States. They find that concentrations of workers in high-wage tradable
services are associated with increasing incumbent party vote shares (a proxy for voter sat-
isfaction) in U.S. presidential elections; concentrations of employment in low-wage tradable
manufacturing are associated with diminished incumbent support. Consistent with Chase
(2008), their study suggests that workers’ support for trade openness is likely to depend
on their industry of employment and skill level. How trade in services influences electoral
politics and firms’ lobbying activities is an exciting area for future research.
3 Varieties of International Services Trade
Services are distinct from manufacturing in a number of ways. Unlike goods, services are
intangible and thus not storable (Francois and Hoekman, 2010); their delivery often requires
8

direct contact between the producer and consumer (Hill, 1977). The classic example of a
haircut provides the case in point: the service cannot be delivered remotely. The need for
face-to-face delivery of many services has been referred to as the ‘proximity burden’ (Francois
and Hoekman, 2010).
The proximity burden presents an inherent obstacle to international trade in services:
producers often need to be present in the importing country in order to deliver the service.13
This requirement is conceptually important for the analysis of services trade, since commer-
cial presence is considered one of the main modes of international service delivery (Sampson
and Snape, 1985). Given the proximity burden, it is not surprising that ‘gravity’ variables
(e.g., relative distance between countries, economic size and language) explain not only trade
in goods (Bernard et al., 2007), but also trade in services (Breinlich and Criscuolo, 2011;
Kimura and Lee, 2006; Eichengreen and Gupta, 2013).
Due to advances in technology, many service inputs, like goods inputs, can be pro-
duced remotely (Bhagwati, 1984). This fragmentation of the production process across
multiple locations has clearly contributed to the growth in services trade.14 However, the
importance of the proximity burden for many services, including service inputs, means that
service trade will more often require a local commercial presence, or the cross-border move-
ment of either producer or consumer, than is the case with goods (Francois and Hoekman,
2010).
To address some of the complexities of international services trade, the WTO classified
the four main modes of international services delivery:
• Mode 1 (Cross-border supply): The service supplier and the consumer remain in their
respective countries; the service crosses the border.
13Alternatively, the importer may travel to the exporting country to consume the service.
14While this paper focuses on services exports (and thus services firms as producers of services), servicesproducers are often consumers of services and goods. For instance, firms in non-manufacturing sectors suchas retail are major importers of goods. These firms will likely have strong preferences for trade liberalizationin multiple industries. I thank an anonymous referee for emphasizing this point.
9

• Mode 2 (Consumption abroad): The consumer travels to the exporting country to
obtain the service.
• Mode 3 (Foreign commercial presence): The service is supplied by a locally established
affiliate or subsidiary of a foreign-owned company.
• Mode 4 (Movement of natural persons): The service supplier travels to the importing
country to provide the service.
The inherent complexities in international services delivery complicate our ability to
gather accurate and comprehensive services trade statistics. Indeed, the lack of high-quality
data on the multiple modes of services trade is one of the foremost obstacles to academic
research in this area, and likely accounts for much of the literature’s emphasis on goods, as
opposed to services, trade. For example, monthly data are reported for U.S. goods exports
and imports, with most countries covering over 8,000 product categories. In contrast, the
U.S. services trade statistics have covered only around 40 categories annually since 2006, and
fewer prior to that. (For further details, see p. 38-40 and Appendix A of Jensen (2011).) In
October 2016, the U.S. Bureau of Economic Analysis (BEA) expanded the annual services
trade data from 49 to 90 countries and areas.15 These additional data will prove useful in
future research.
U.S. trade statistics capture all four modes of international services trade. Modes 1,
2, and 4 are recorded and published by the BEA as services transactions between residents
and non-residents. The BEA records these transactions as imports and exports of services in
the international transactions accounts, also known as the balance of payments. The services
trade statistics (covering Modes 1, 2, and 4) include nine main categories.16 The BEA also
15BEA, 2016
16Since 2006, the coverage has included around 40 sub-categories nested within the nine main categories:Maintenance and Repair Services; Transport; Travel; Insurance Services; Financial Services; Charges forthe Use of Intellectual Property; Telecommunications, Computer, and Information Services; Other BusinessServices; and Government Goods and Services.
10

covers Mode 3, the commercial presence mode of international service delivery, through
annual surveys of majority-owned foreign affiliates of multinational enterprises (MOFAs).17
Table 1: U.S. International ServicesData: Service Exports Services Supplied by Majority Owned Affiliates (MOFAs)
Source: International Transaction Accounts (Balance of Payments) BEA MNE Surveys of MOFAs Activities
Availability: 1999-2015 2004-2013
Coverage (Mode): 1, 2, and 4 3
Classification: Type of service Primary industry of MNE affiliate
Major Categories: Maintenance and Repair Services n.i.e. Mining
Transport Manufacturing
Travel (for all purposes including education) Wholesale trade
Insurance Services Retail trade
Financial Services Information
Charges for the Use of Intellectual Property n.i.e. Finance and insurance
Telecommunications, Computer, and Information Services Professional, scientific, and technical services
Other Business Services Other industries
Government Goods and Services n.i.e.
Note: The data are available at http://www.bea.gov/international/index.htm. For additional details
on the definitions and methodology of U.S. trade in services, see Part III: Statistical Methodologies in
International Economic Accounts: Concepts and Methods.
It is important to note that the two data sources (balance of payments and MNE
activities) on U.S. international services classify the data differently. The statistics on trade
in services (Modes 1, 2, and 4) reported in the balance of payments are collected and reported
by the type of service (thus only service industries are reported), whereas the MNE data
on services supplied through MOFAs (Mode 3) are collected and reported according to
the foreign affiliate’s primary industry (thus the sale of services by affiliates in non-service
industries is included). Specifically, “affiliates in any industry can be providers of services
because the classification of an affiliate reflects the affiliate’s primary industry of sales and
affiliates classified in industries that typically produce goods may have secondary activities
in services industries.”18 Table 1 summarizes the U.S. data on trade in services.
17Mode 3 is captured as the sale of services reported by MOFAs. The sales of services (and goods) byforeign affiliates are reported as data on the activities of multinational enterprises. These data (availableat here) are part of a wide variety of publicly available aggregates of financial indicators and operations ofU.S. MNCs. In contrast, FDI appears in international investment positions data in the balance of payments,which cover positions and transactions between parent companies and their affiliates.
18https://bea.gov/international/international_services_definition.htm
11

Table 2: U.S. Exports, MNE Sales, and FDI Positions in Goods and Services
Total (Billions USD) Share
U.S. Exports 2,293
goods 1,592 0.69
services 701 0.31
Sales by Foreign Affiliates of U.S. MNEs 5,758
goods 4,317 0.75
services 1,441 0.25
U.S. Direct Investment Positions Abroad 4,580
goods 624 0.14
services 3,743 0.82
services not incl. holding companies 1,515 0.33
other 213 0.05
Note: The table contains 2013 data from the U.S. BEA.
Table 2 provides data on the international engagement of U.S. firms in goods and
services. It summarizes U.S. exports, the foreign sales of majority-owned affiliates of U.S.
multinational enterprises, and for the purpose of comparison, U.S. FDI positions. Services
make up 31% of total exports, and 25% of total MOFA sales in goods and services. In terms
of direct investment positions, services represent 33% of total assets (excluding holding
companies). When holding companies are included, services represent 82% of U.S. FDI
positions abroad. This leads to our first stylized fact.
Fact 1. Services represent a substantial proportion of U.S. firms’ FDI and U.S. MNE sales
abroad.
Figure 3 illustrates U.S. service exports and imports (Modes 1, 2 and 4) among the
nine main components of services trade, as of 2015. Travel accounts for $177B dollars and
over a quarter of U.S. service exports. The U.S. exports $121B in Business Services, which
include research and development, consulting (e.g., legal, accounting, and management),
and technical services (e.g., architectural, construction contracting, engineering, and trade-
related services). The U.S. trade balance in business services is $35B. In 2015, the U.S. ran
a trade surplus in Travel, Business, Intellectual Property, Financial, and Maintenance and
12

Figure 3: U.S. Service Imports and Exports (Modes 1, 2, and 4)
0 50,000 100,000 150,000 200,000Millions USD
Insurance Services
Government Services
Maintenance and Repair
Telecom and Information
Transport
Financial Services
Charges for Intellectual Property
Other Business Services
Travel
Exports Imports
Note: The import and export values are from 2015. Author’s calculations using publicly available data from
the BEA.
Figure 4: Services Supplied by Majority-Owned Foreign Affiliates of U.S. Multinationals(Mode 3)
Other industries
Wholesale trade
Finance and insurance
Professional services
Information
Retail trade
Mining
Manufacturing
0 100,000 200,000 300,000Total Service Sales by MOFAs (Millions USD)
0 2 4 6 8 10 12 14 16 18 20 22 24Share of Total MOFA Service Sales
Share Service Sales
Note: The values are from 2013. Author’s calculations using publicly available data from the BEA. The
category “Other Industries” includes: Utilities ($37B), Transportation and warehousing ($67B), Health care
and social assistance ($5B), Accommodation and food services ($5B), and Other.
13
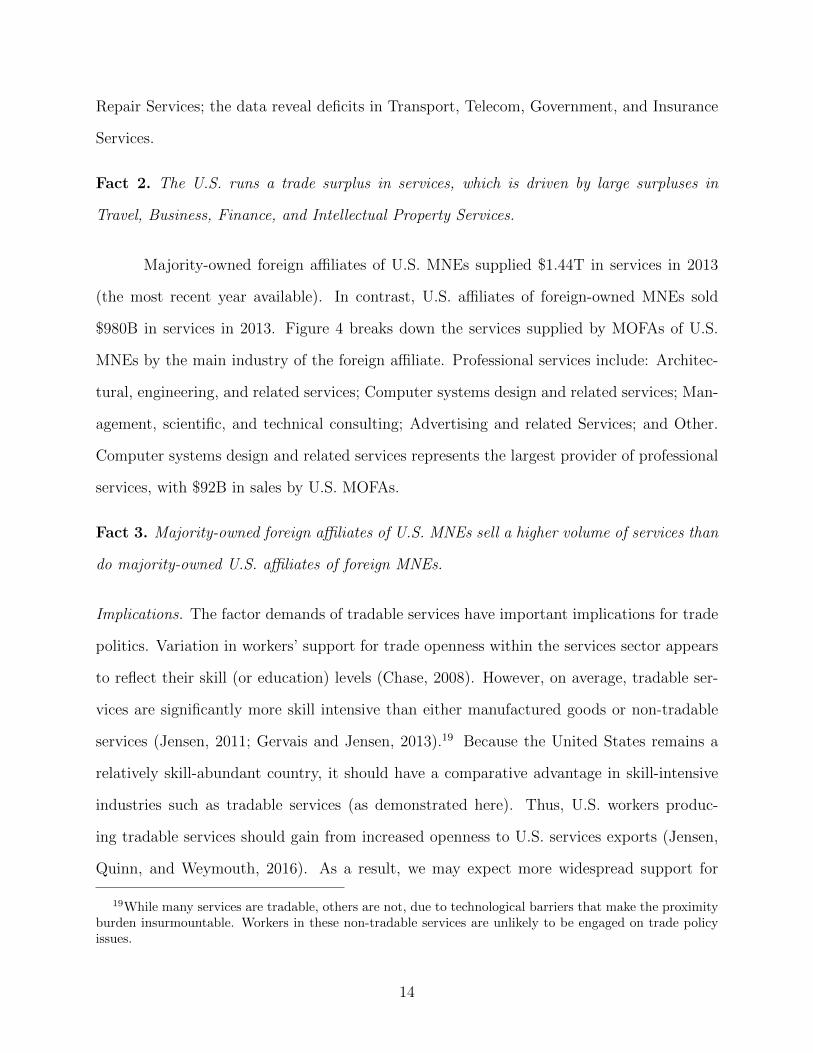
Repair Services; the data reveal deficits in Transport, Telecom, Government, and Insurance
Services.
Fact 2. The U.S. runs a trade surplus in services, which is driven by large surpluses in
Travel, Business, Finance, and Intellectual Property Services.
Majority-owned foreign affiliates of U.S. MNEs supplied $1.44T in services in 2013
(the most recent year available). In contrast, U.S. affiliates of foreign-owned MNEs sold
$980B in services in 2013. Figure 4 breaks down the services supplied by MOFAs of U.S.
MNEs by the main industry of the foreign affiliate. Professional services include: Architec-
tural, engineering, and related services; Computer systems design and related services; Man-
agement, scientific, and technical consulting; Advertising and related Services; and Other.
Computer systems design and related services represents the largest provider of professional
services, with $92B in sales by U.S. MOFAs.
Fact 3. Majority-owned foreign affiliates of U.S. MNEs sell a higher volume of services than
do majority-owned U.S. affiliates of foreign MNEs.
Implications. The factor demands of tradable services have important implications for trade
politics. Variation in workers’ support for trade openness within the services sector appears
to reflect their skill (or education) levels (Chase, 2008). However, on average, tradable ser-
vices are significantly more skill intensive than either manufactured goods or non-tradable
services (Jensen, 2011; Gervais and Jensen, 2013).19 Because the United States remains a
relatively skill-abundant country, it should have a comparative advantage in skill-intensive
industries such as tradable services (as demonstrated here). Thus, U.S. workers produc-
ing tradable services should gain from increased openness to U.S. services exports (Jensen,
Quinn, and Weymouth, 2016). As a result, we may expect more widespread support for
19While many services are tradable, others are not, due to technological barriers that make the proximityburden insurmountable. Workers in these non-tradable services are unlikely to be engaged on trade policyissues.
14
services liberalization and trade agreements among U.S. tradable services industries as com-
pared to manufacturing.
But industries don’t trade—firms do—and so the expectation of services sector cohe-
sion in favor of liberalization may be complicated somewhat by differences among firms. One
important difference concerns participation in international trade: most firms do not trade,
or trade very little. It is now well established that goods exporters represent a small subset of
the largest, most productive businesses (Bernard et al., 2007), and similar descriptors seem
to apply to firms that export services (Breinlich and Criscuolo, 2011).20 Moreover, large im-
porters, such those in the retail sector (such as Walmart), will benefit from the liberalization
of services as well as goods.21
As a result of these firm-level differences in participation in international trade, we
might expect uneven support for trade liberalization within tradable services industries. To
the extent that trade is dominated by a small group of firms, support for liberalization may
be much more intense among these influential companies, which stand to gain the most from
further liberalization. Future research should examine which U.S. services firms support
trade liberalization, which (if any) oppose it, and why.
4 Additional Stylized Facts About U.S. Trade in Ser-
vices
This section reports a number of additional stylized facts about trade in services, focusing
specifically on the U.S., since it is the world’s leading exporter of services. I first examine the
relative importance of the alternative modes of services trade for U.S. services exporters. I
20Focusing on the effects of preferential trade liberalizations, Baccini, Pinto, and Weymouth (N.d.) exam-ine the universe of U.S. MNCs in goods and services industries and find that the trade gains from preferentialliberalization are concentrated among the largest, most productive multinationals.
21For the relevance of imports of intermediates in trade politics, see Osgood (2016c).
15

then analyze the relationship between the destinations of goods exports and services exports.
The final set of stylized facts concerns the relationship between service trade restrictions and
the international delivery of services by U.S. firms.
4.1 FDI as a Form of U.S. Services Trade
I next report statistics on the relative value of services trade through alternative modes of
delivery. I find that the vast majority of U.S. international services are delivered abroad
through a foreign commercial presence (Mode 3), reflecting the importance of physical prox-
imity to customers.
Table 3 reports the total exports and total sales of goods and services by majority-
owned foreign affiliates of U.S. MNEs. In 2013, the U.S. exported $701B in services and
supplied $1.02T in services to local customers in their host markets through FDI. Thus, the
delivery of services through a commercial presence abroad (Mode 3) is about 1.5 times as
large as the combination of Modes 1, 2 and 4 service exports. As shown in Table 3, the ratio
of local sales to exports in services is nearly the same as for goods.
Table 3: Exports vs. FDI, Services and Goods2009 2010 2011 2012 2013
U.S. Exports
Services 513 563 628 656 701
Goods 1,070 1,290 1,499 1,563 1,592
Sales to Host Country by U.S. MNE MOFAs
Services 851 903 983 1,011 1,028
Goods 1,883 2,078 2,416 2,397 2,412
Host Country MOFA Sales to Exports Ratio
Services 1.66 1.60 1.57 1.54 1.47
Goods 1.76 1.61 1.61 1.53 1.52
Note: Author’s calculations based on publicly available data from the BEA. The trade and sales figures are
reported in billions of USD.
Fact 4. Mode 3 accounts for a higher volume of international services delivery than service
exports through Modes 1, 2, and 4.
16
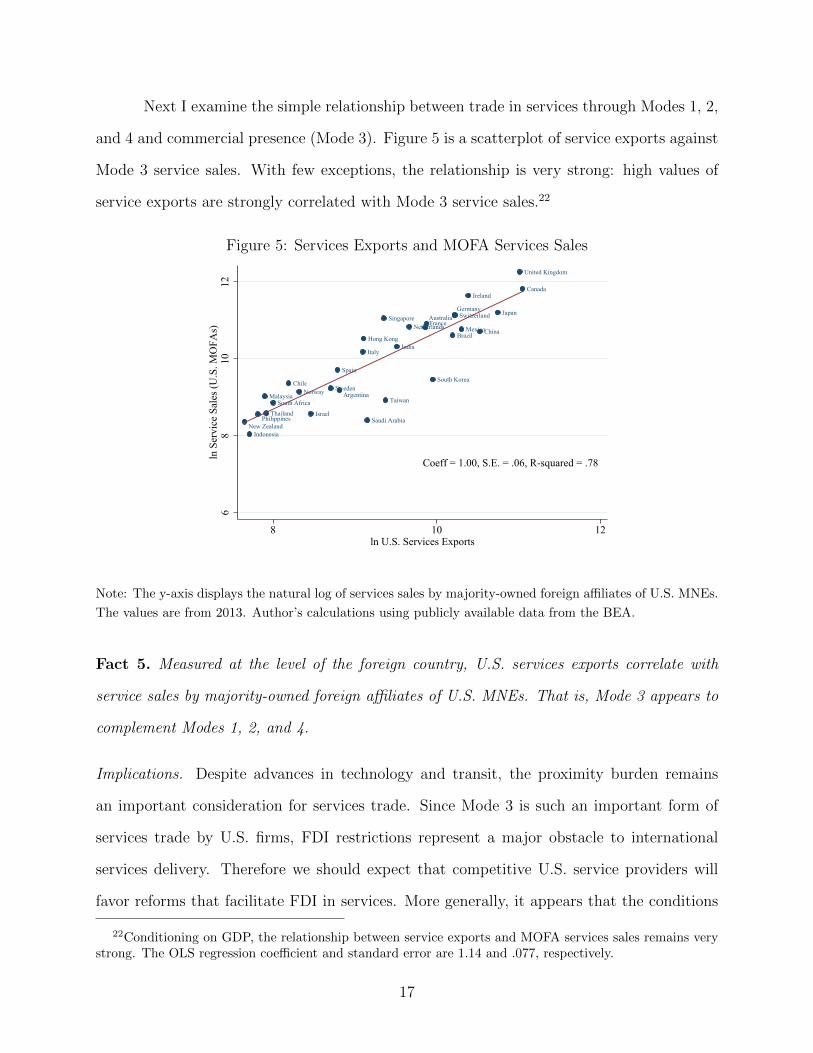
Next I examine the simple relationship between trade in services through Modes 1, 2,
and 4 and commercial presence (Mode 3). Figure 5 is a scatterplot of service exports against
Mode 3 service sales. With few exceptions, the relationship is very strong: high values of
service exports are strongly correlated with Mode 3 service sales.22
Figure 5: Services Exports and MOFA Services Sales
Argentina
Australia
Brazil
Canada
Chile
ChinaFrance
Germany
Hong KongIndia
Indonesia
Ireland
Israel
Italy
Japan
Malaysia
MexicoNetherlands
New Zealand
Norway
Philippines Saudi Arabia
Singapore
South Africa
South KoreaSpain
Sweden
Switzerland
Taiwan
Thailand
United Kingdom
Coeff = 1.00, S.E. = .06, R-squared = .78
68
1012
ln S
ervi
ce S
ales
(U.S
. MO
FAs)
8 10 12ln U.S. Services Exports
Note: The y-axis displays the natural log of services sales by majority-owned foreign affiliates of U.S. MNEs.
The values are from 2013. Author’s calculations using publicly available data from the BEA.
Fact 5. Measured at the level of the foreign country, U.S. services exports correlate with
service sales by majority-owned foreign affiliates of U.S. MNEs. That is, Mode 3 appears to
complement Modes 1, 2, and 4.
Implications. Despite advances in technology and transit, the proximity burden remains
an important consideration for services trade. Since Mode 3 is such an important form of
services trade by U.S. firms, FDI restrictions represent a major obstacle to international
services delivery. Therefore we should expect that competitive U.S. service providers will
favor reforms that facilitate FDI in services. More generally, it appears that the conditions
22Conditioning on GDP, the relationship between service exports and MOFA services sales remains verystrong. The OLS regression coefficient and standard error are 1.14 and .077, respectively.
17

that increase demand for U.S. services exports also increase demand for services delivered
through a commercial presence.
4.2 Destinations of U.S. Service Exports
I now examine how conditions in trade partner countries correlate with services trade and
services delivery through a commercial presence.
Figure 6 is a scatterplot of U.S. exports of goods and services at the level of the
importing country. With few exceptions, the volume of goods exports correlates with the
volume of services exports. It appears that countries with higher services imports relative to
goods imports are somewhat wealthier: a simple regression of the ratio of services exports
to goods exports regressed on the log of GDP/capita (not reported) indicates a positive
relationship (p-value = 0.027).
Figure 6: U.S. Exports of Goods and Services
Argentina
Australia
Brazil
Canada
Chile
China
France
Germany
Hong Kong
India
Indonesia
Ireland
Israel
Italy
Japan
Malaysia
Mexico
Netherlands
New Zealand
Norway
Philippines
Saudi ArabiaSingapore
South Africa
South Korea
SpainSweden
Switzerland
Taiwan
Thailand
United Kingdom
Venezuela
Coeff = .74, S.E = .11, R-squared = .60
89
1011
ln U
.S. S
ervi
ces E
xpor
ts
8 9 10 11 12 13ln U.S. Goods Exports
Note: The values are from 2013. Author’s calculations using publicly available data from the BEA.
Fact 6. Measured at the level of the importing country, U.S. exports of goods and services
are highly correlated.
18

Figure 7 reveals a strongly positive relationship relationship between the sale of goods
and services by majority-owned foreign affiliates of U.S. MNEs.
Figure 7: Sales of Goods and Services by Foreign Affiliates of U.S. MNEs
Argentina
Australia
Austria
Belgium
Brazil
Canada
Chile
China
Colombia
Czech Republic
Denmark
Dominican RepublicEgypt
Finland
France
Germany
Greece
Hong Kong
Hungary
India
Indonesia
Ireland
Israel
Italy
Japan
Luxembourg
Malaysia
MexicoNetherlands
New Zealand
Norway
Peru
PhilippinesPoland
Saudi Arabia
Singapore
South Africa
South KoreaSpain
Sweden
Switzerland
Taiwan
Thailand
United Arab Emirates
United Kingdom
Coeff = .95, S.E. = .06, R-squared = .86
68
1012
ln S
ervi
ce S
ales
(U.S
. MO
FAs)
8 10 12 14ln Goods Sales (U.S. MOFAs)
Note: The data displayed are the natural log of the total goods and services sales by majority-owned foreign
affiliates of U.S. MNEs. The values are from 2013. Author’s calculations using publicly available data from
the BEA.
Fact 7. Measured at the level of the foreign host country, the sale of services correlates with
the sale of goods by majority-owned foreign affiliates of U.S. MNEs.
Implications. The fact that services trade and investment flows occur in countries with high
levels of goods trade and MNE goods sales indicates that similar demand conditions exist
across countries. The correlations could also be the result of the interconnectedness of goods
and services, as well as the fact that trade in services facilitates the trade of goods. The
correlation between goods-related FDI sales and Mode 3 service sales also supports the view
that an existing business presence helps overcome informational barriers to entry in services
(Raff and von der Ruhr, 2007). An interesting area of future work would be to examine
the degree to which U.S. manufacturing FDI precedes services FDI. To the extent that the
expansion of goods sales (either to the host country or to third countries) relies on services
19
intermediates, MNCs in both the services and manufacturing sectors are likely to support
services liberalization abroad—particularly in countries in which these firms have established
operations.
4.3 Policy Impediments to Trade in Services
Firms that deliver services across borders face different impediments than those exporting
goods internationally. The obstacles to goods trade—such as tariffs or quotas—generally
occur at the border, whereas restrictions on services delivery tend to involve so-called behind-
the-border regulations (Nordas and Rouzet, 2015). Because of the complexity of services
trade, which in many cases includes the proximity requirement for the delivery of services,
many of the policies that restrict services trade will differ from those that restrict trade in
goods. Examples of services trade restrictions include (but are not limited to):23
• discriminatory licensing and certification requirements for foreign professionals
• restrictions on data flows (e.g., forced localization of servers)
• subsidization of domestic service providers
• restrictions on the movement of workers, including temporary business visa restrictions
• restrictions on FDI
• restrictions on international payments such as profit repatriation, currency conversions,
and current account transactions such as payments for invisibles
In general, the set of restrictions on services trade is immense, and may differ from
the set of barriers to trade in goods. While many of the constraints on services trade can also
restrict goods trade—for instance, temporary trade barriers and subsidies, or regulations such
23These examples draw on Fefer (2015).
20

as sanitary and phytosanitary measures—a wide array of policy tools can protect domestic
services firms from foreign competition, some of which are also applicable to goods.
Services trade restrictions may explicitly discriminate against foreign firms, or they
may affect all firms, including domestic suppliers. Examples of discriminatory barriers in-
clude restrictions on FDI such as limits on (or the direct prohibition of) foreign equity
ownership, or nationality quotas for managers of foreign affiliates. Non-discriminatory entry
barriers may, for example, limit the number of providers in a market regardless of national-
ity. Services trade liberalization is generally thought to mean actions taken by governments
to reduce discrimination. However, since non-discriminatory barriers may still exist that
impede services trade, foreign firms (and governments) may also seek concessions related to
non-discriminatory regulatory regimes.
Researchers have begun to measure impediments to international services trade across
different modes of delivery. The research to date attempts to distinguish between policies that
affect fixed costs by restricting entry into the market and those that increase firms’ operating
(variable) costs (Deardorff and Stern, 2008; Francois and Hoekman, 2010). The best-known
indexes of services trade are the World Bank’s Services Trade Restrictions Database (STRD)
(Borchert, Gootiiz, and Mattoo, 2014) and the OECD’s Services Trade Restrictiveness Index
(STRI) (Nordas and Rouzet, 2015).24 The STRD covers restrictions in five main industries
(financial services, telecom, retail, transportation, and professional services) and 103 coun-
tries as of 2010. The STRD data were gathered from publicly available sources in the case of
OECD countries, and from questionnaires completed by local law firms in non-OECD coun-
tries. The STRI is based on a coding of laws on the books. It captures measures affecting
trade in 18 service sectors and 40 countries as of 2013. For each sector, the STRI measures:
24Other work has begun to examine services trade provisions in preferential trade agreements (PTAs)(Roy, 2011; Dur, Baccini, and Elsig, 2014). Roy (2011) codes Mode 3 restrictions for 152 sub-sectors, andMode 1 restrictions for 142 sub-sectors. Dur et al. examine service chapters in the universe of PTAs,and code whether national treatment clauses exist, whether there are explicit provisions providing for themovement of natural persons beyond GATS, and the existence of provisions for specific service sectors. Duret al. capture whether service commitments are based on a positive or negative list approach. U.S. PTAshave used the negative list approach, which is thought to lead to deeper commitments.
21

restrictions on foreign entry, restrictions on the movement of people, barriers to competition,
regulatory transparency, and other discriminatory measures.
Other potential barriers to services trade appear as restrictions on current and cap-
ital account transactions. Quinn and Toyoda (2008) measure capital account and financial
current account restrictions that are relevant to trade in services. Indeed, capital account
restrictions are important impediments to Mode 3 trade to the extent that these restrictions
bar or impede the establishment of foreign affiliates through which U.S. MNCs (in any sec-
tor) sell services to foreign markets. But impediments to financial payments for invisibles
(i.e., services) recorded on the current account (e.g., royalties, licenses for intangible prop-
erty, headquarter consulting fees, insurance, financial services) are particularly germane to
firms’ (often internal) transfers of knowledge (Keller and Yeaple, 2013). Jensen, Quinn, and
Weymouth (2014) argue and show that restrictions on disembodied knowledge transfers—
represented by restrictions of service payments on the financial current account—affect the
expansion of U.S. MNC activities abroad.
Here I report the results of a simple analysis of the relationship between 1) foreign
country services trade restrictions and 2) U.S. exports of goods and services provided by U.S.
MNEs. To enable comparability with existing studies that account for the effects of gravity,
I include bilateral distance, common language (English), and (the natural log of) GDP as
control variables. To capture barriers to services trade, I include the STRD,25 STRI,26 and
the Quinn and Toyoda (2008) index, which measures restrictions on resident payments for
invisibles (PAYINV).27 The results should be viewed as descriptive. The analysis intends
to probe the plausible association between services restrictions and services trade. A more
rigorous approach in future research should consider how liberalizations affect services trade
over the medium to long term, while also considering other factors related to FDI and services
25I take the average level of restrictions across all sectors.
26I use the index of “Overall” services trade restrictiveness.
27PAYINV is transformed so that higher values indicate higher restrictions on invisibles payments.
22

trade, including tax rates, exchange rates, and other policies. It will also be important to
estimate the determinants of trade flows at the individual firm level.
Table 4: Correlates of U.S. Services Exports(1) (2) (3) (4) (5) (6)
ln GDP 0.966*** 0.963*** 0.949*** 0.778*** 0.810*** 0.782***
(0.100) (0.101) (0.104) (0.142) (0.131) (0.155)
ln Distance to U.S. -0.474* -0.472* -0.506 -0.493** -0.455** -0.514**
(0.258) (0.262) (0.298) (0.198) (0.194) (0.229)
English 1.174*** 1.238*** 1.273*** 0.562* 0.641** 0.640**
(0.361) (0.377) (0.381) (0.265) (0.276) (0.265)
STRI -3.800*** -2.339**
(1.061) (1.096)
STRD -0.028*** -0.022**
(0.010) (0.010)
PAYINV -0.679*** -0.341
(0.194) (0.255)
Constant -12.026***-12.175***-11.727*** -7.408 -8.657* -7.651
(3.510) (3.464) (3.847) (4.667) (4.251) (5.087)
R-squared 0.795 0.787 0.765 0.713 0.726 0.679
N 29 29 29 20 20 20
Service Sales (U.S. MOFAs) U.S. Services Exports
Note: The dependent variable in Columns 1–3 is the natural log of service sales by majority-owned foreign
affiliates of U.S. MNEs; in Columns 4–6 it is the natural log of total service exports. Both variables are
measured at the level of the trade partner country. The STRI is the OECD’s Services Trade Restrictiveness
Index (Nordas and Rouzet, 2015), and the STRD is the World Bank’s Services Trade Restrictions Database
(Borchert, Gootiiz, and Mattoo, 2014). PAYINV is an index measuring restrictions on resident payments
for invisibles from Quinn and Toyoda (2008). English is a dummy variable equal to 1 if the country’s official
language is English.
Table 4 reports the results of cross-sectional regression estimates of service sales of
MOFAs (Columns 1–3) and service exports (Columns 4–6), measured at the level of the
importing country. Beginning with the Mode 3 models, I find that restrictions on services
trade (measured using the STRI and the STRD) are associated with lower U.S. exports of
services. The results in Column 1 indicate that an improvement in the STRI from around the
25th percentile (Poland) to the 75th percentile (Australia) is associated with a 25% increase
in Mode 3 sales. Figure 8 is a partial regression plot of the relationship between STRI
and Mode 3 sales of services, accounting for the control variables; outliers do not appear to
drive the strong correlation. The results are consistent with prior work demonstrating that
services trade restrictions reduce services trade flows (Nordas and Rouzet, 2015). The results
also indicate a strongly negative association between restrictions on payments for invisibles
23
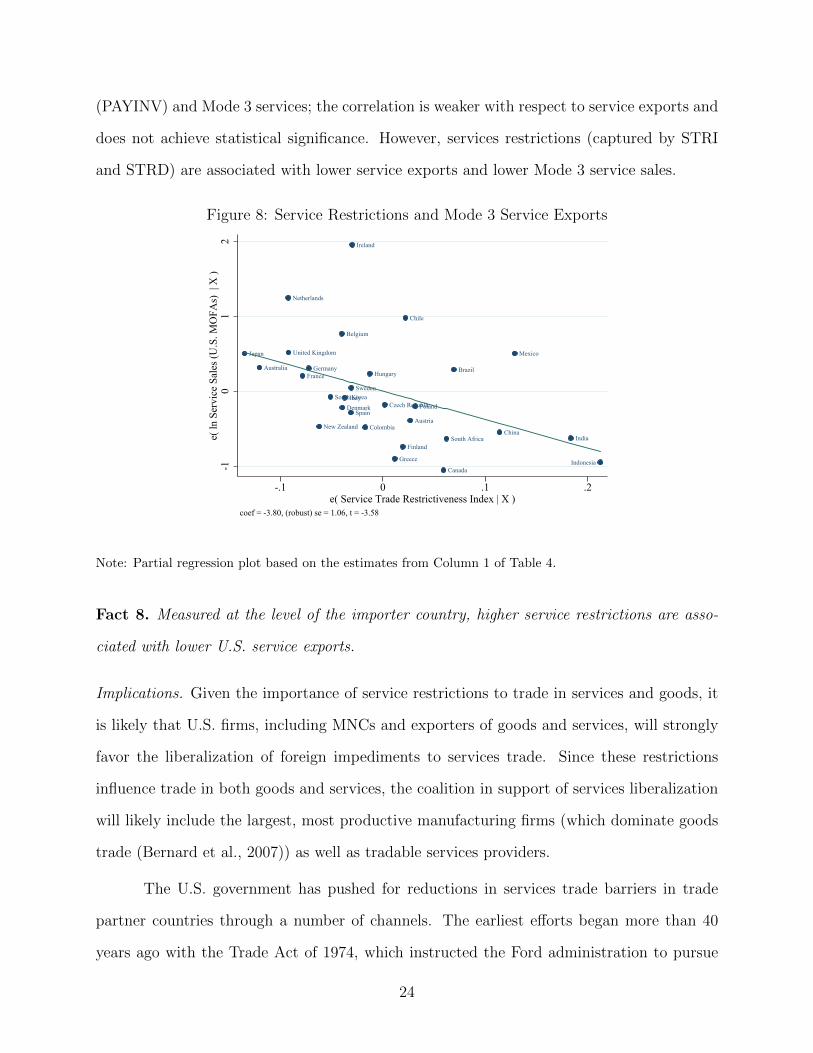
(PAYINV) and Mode 3 services; the correlation is weaker with respect to service exports and
does not achieve statistical significance. However, services restrictions (captured by STRI
and STRD) are associated with lower service exports and lower Mode 3 service sales.
Figure 8: Service Restrictions and Mode 3 Service Exports
Japan
Australia
Netherlands
United Kingdom
FranceGermany
New Zealand
South Korea
Belgium
DenmarkItaly
Spain
Sweden
Ireland
Colombia
Hungary
Czech Republic
Greece
Finland
Chile
Austria
Poland
Canada
South Africa
Brazil
China
Mexico
India
Indonesia-10
12
e( ln
Ser
vice
Sal
es (U
.S. M
OFA
s) |
X )
-.1 0 .1 .2e( Service Trade Restrictiveness Index | X )
coef = -3.80, (robust) se = 1.06, t = -3.58
Note: Partial regression plot based on the estimates from Column 1 of Table 4.
Fact 8. Measured at the level of the importer country, higher service restrictions are asso-
ciated with lower U.S. service exports.
Implications. Given the importance of service restrictions to trade in services and goods, it
is likely that U.S. firms, including MNCs and exporters of goods and services, will strongly
favor the liberalization of foreign impediments to services trade. Since these restrictions
influence trade in both goods and services, the coalition in support of services liberalization
will likely include the largest, most productive manufacturing firms (which dominate goods
trade (Bernard et al., 2007)) as well as tradable services providers.
The U.S. government has pushed for reductions in services trade barriers in trade
partner countries through a number of channels. The earliest efforts began more than 40
years ago with the Trade Act of 1974, which instructed the Ford administration to pursue
24

services liberalization during the Tokyo Round of the General Agreement on Tariffs and
Trade (GATT), the predecessor to the WTO. Though unsuccessful during the Tokyo Round,
services liberalization became part of the subsequent Uruguay Round agreement as a set of
rules known as the General Agreement on Trade in Services (GATS). The GATS, which
entered into force in 1995, represents the only multilateral rules for services trade.28
The U.S. pushed for additional measures during the Doha Round negotiations, which
began in 2001 but have yet to conclude. The priorities of U.S. negotiators include removing
restrictions on commercial presence, improving and extending GATS commitments, increas-
ing transparency in regulatory barriers, and expanding market access (Fefer, 2015). Devel-
oping countries have resisted opening their services markets, which remain more protected
than those of developed countries. Another obstacle to progress in the Doha Round is the
inherent complexity and the wide range of activities considered services (Fefer, 2015).
Slow multilateral progress has contributed to the turn towards services liberalization
through PTAs, which the U.S. has signed and implemented with 20 countries. Services
commitments within U.S. PTAs follow a negative list approach: market access is provided
for all services and all modes of delivery unless the partner country explicitly lists the ser-
vice/mode as restricted. Reflecting the objectives of U.S. services providers, all U.S. PTAs
include extensive liberalizations of services that extend beyond the GATS.
The Trade Promotion Authority (TPA) passed by Congress in 2015 provides further
evidence of the strong political support among U.S. firms for reduced barriers and the greater
facilitation of trade in services. Section 3801.b.2 states:
The principal negotiating objective of the United States regarding trade in ser-
vices is to reduce or eliminate barriers to international trade in services, including
28Under the GATS, if a country chooses to open its services markets to foreign suppliers, the GATTmost-favored nation principle applies. This means that all liberalization commitments will apply to all WTOmembers. Countries’ participation in the agreement is based on a positive list approach. This means that thelist of liberalization commitments, delineated by sector, represents the schedule of services liberalizations;non-listed services may remain closed to foreign providers. For additional details on the GATS, see https:
//www.wto.org/English/tratop_e/serv_e/gats_factfiction1_e.htm.
25

regulatory and other barriers that deny national treatment and market access or
unreasonably restrict the establishment or operations of service suppliers.29
The TPA gave the president the authority to negotiate large regional trade agreements,
including the Trans-Pacific Partnership and the Trans-Atlantic Trade and Investment Part-
nership. The TPA also covers negotiations over the proposed Trade in Services Agreement,
over which 23 WTO members began negotiations in 2013.30 Future work should exam-
ine firms’ political engagement over the services components of U.S. PTAs and other trade
agreements.
5 Conclusion
This paper provides a set of stylized facts related to trade in services by U.S. services ex-
porters that underscore the salience of services trade and services restrictions for U.S. firms.
Services represent a large and growing proportion of U.S. exports, and firms deliver services
internationally through a variety of modes. A principle channel of services trade is through
the establishment of a foreign affiliate presence in the importing country. A range of policies
in partner countries restrict services exports and the foreign sales of services firms.
The expansion of tradable services has potentially important implications for trade
politics. The U.S. comparative advantage in high-skilled tradable services should lead U.S.
firms to push for services liberalization between the U.S. and trade partner countries. How-
ever, governments can implement numerous and complex policy restrictions on services trade,
and services firms can have very different liberalization objectives depending on which ser-
vices they provide and the modes of delivery they employ. These diverse interests among
services firms within the sector may complicate the policy objectives and organization of the
29http://uscode.house.gov/view.xhtml?req=granuleid:USC-prelim-title19-section3802&num=
0&edition=prelim
30Barring unforeseen changes in the protectionist stance of the current U.S. administration, progress onthese megaregional and plurilateral deals is considered unlikely in the near term.
26
U.S. coalition for services liberalization. This study also suggests that the important role of
services in the facilitation of disintegrated global production should lead competitive man-
ufacturers in the U.S. to support services liberalization. Each of these assertions remains
speculative, and future work should rigorously examine these and other claims related to
firms’ political engagement over services trade. In sum, it seems that a consideration of
service firms, their policy objectives, and the wide array of services trade restrictions will
allow for a more comprehensive explanation of international trade and investment policies.
27

References
Arnold, Jens M., Beata S. Javorcik, and Aaditya Mattoo. 2011. “Does services liberalizationbenefit manufacturing firms?: Evidence from the Czech Republic.” Journal of Interna-tional Economics 85 (1): 136–146.
Autor, David, David Dorn, Gordon Hanson, and Kaveh Majlesi. 2016. “Importing politicalpolarization? The electoral consequences of rising trade exposure.” National Bureau ofEconomic Research Working Paper .
Baccini, Leonardo, Pablo M. Pinto, and Stephen Weymouth. N.d. “The DistributionalConsequences of Preferential Trade Liberalization: Firm-Level Evidence.” InternationalOrganization. Forthcoming.
Bagwell, Kyle, and Robert W. Staiger. 1999. “An Economic Theory of GATT.” AmericanEconomic Review 89 (1): 215–248.
Bailey, Michael A., Judith Goldstein, and Barry Weingast. 1997. “The Institutional Rootsof American Trade Policy.” World Politics 49 (3): 309–338.
Balassa, Bela. 1965. “Trade liberalisation and “revealed” comparative advantage.” TheManchester School 33 (2): 99–123.
Bernard, Andrew B., and J. Bradford Jensen. 1999. “Exceptional Exporter Performance:Cause, Effect, or Both?” Journal of International Economics 47 (1): 1–25.
Bernard, Andrew B., J. Bradford Jensen, Stephen J. Redding, and Peter K. Schott. 2007.“Firms in International Trade.” Journal of Economic Perspectives 21 (3): 105–130.
Bhagwati, Jagdish N. 1984. “Why are services cheaper in the poor countries?” The EconomicJournal 94 (374): 279–286.
Blanchard, Emily J, and Xenia Matschke. 2015. “US Multinationals and Preferential MarketAccess.” Review of Economics and Statistics .
Borchert, Ingo, Batshur Gootiiz, and Aaditya Mattoo. 2014. “Policy barriers to internationaltrade in services: evidence from a new database.” The World Bank Economic Review 28(1): 162–188.
Breinlich, Holger, and Chiara Criscuolo. 2011. “International trade in services: A portraitof importers and exporters.” Journal of International Economics 84 (2): 188–206.
Chase, Kerry. 2003. “Economic Interests and Regional Trading Arrangements: The Case ofNAFTA.” International Organization 57 (1): 137–74.
Chase, Kerry A. 2008. “Moving Hollywood abroad: Divided labor markets and the newpolitics of trade in services.” International Organization pp. 653–687.
28

Deardorff, Alan V, and Robert M Stern. 2008. “Empirical analysis of barriers to internationalservices transactions and the consequences of liberalization.” A handbook of internationaltrade in services pp. 169–220.
Dur, Andreas, Leonardo Baccini, and Manfred Elsig. 2014. “The design of internationaltrade agreements: Introducing a new dataset.” Review of International Organization 9(3): 353–375.
Eichengreen, Barry, and Poonam Gupta. 2013. “The two waves of service-sector growth.”Oxford Economic Papers 65 (1): 96–123.
Fefer, Rachel F. 2015. U.S. Trade in Service: Trends and Policy Issues. Technical reportCongressional Research Service.
Feigenbaum, James J, and Andrew B Hall. 2015. “How Legislators Respond to LocalizedEconomic Shocks: Evidence from Chinese Import Competition.” The Journal of Politics77 (4): 1012–1030.
Francois, Joseph, and Bernard Hoekman. 2010. “Services trade and policy.” Journal ofEconomic Literature 48 (3): 642–692.
Frieden, Jeffry A. 1991. Debt, development, and democracy: modern political economy andLatin America, 1965-1985. Princeton University Press.
Gervais, Antoine, and J Bradford Jensen. 2013. The tradability of services: Geographicconcentration and trade costs. Technical report National Bureau of Economic Research.
Grossman, Gene M, and Elhanan Helpman. 1994. “Protection for Sale.” American EconomicReview 84 (4): 833–850.
Hill, T Peter. 1977. “On goods and services.” Review of income and wealth 23 (4): 315–338.
Hiscox, Michael J. 2002. “Commerce, coalitions, and factor mobility: Evidence from con-gressional votes on trade legislation.” American Political Science Review 96 (3): 593–608.
Hoekman, Bernard, Aaditya Mattoo, and Andr Sapir. 2007. “The political economy ofservices trade liberalization: a case for international regulatory cooperation?” OxfordReview of Economic Policy 23 (3): 367–391.
Jensen, J Bradford. 2011. Global trade in services: fear, facts, and offshoring. PetersonInstitute for International Economics Washington, DC.
Jensen, J. Bradford, Dennis P. Quinn, and Stephen Weymouth. 2014. “Services Liberaliza-tion and MNC Activities.” Georgetown University Working Paper.
Jensen, J. Bradford, Dennis P. Quinn, and Stephen Weymouth. 2015. “The Influence FirmGlobal Supply Chains and Currency Undervaluations on U.S. Trade Disputes.” Interna-tional Organization 69 (4): 913–947.
29

Jensen, J Bradford, Dennis P Quinn, and Stephen Weymouth. 2016. Winners and Losersin International Trade: The Effects on US Presidential Voting. Technical report NationalBureau of Economic Research.
Keller, Wolfgang, and Stephen Ross Yeaple. 2013. “The gravity of knowledge.” The AmericanEconomic Review 103 (4): 1414–1444.
Kim, In Song. 2016. “Political Cleavages within Industry: Firm-level Lobbying for Trade Liberalization.” Working paper available athttp://web.mit.edu/insong/www/pdf/exporters.pdf.
Kimura, Fukunari, and Hyun-Hoon Lee. 2006. “The gravity equation in international tradein services.” Review of world economics 142 (1): 92–121.
Manger, Mark S. 2009. Investing in Protection: The Politics of Preferential Trading Agree-ments between North and South. New York: Cambridge University Press.
Mansfield, Edward D, and Diana C Mutz. 2013. “US versus them: Mass attitudes towardoffshore outsourcing.” World Politics 65 (04): 571–608.
Margalit, Yotam. 2011. “Costly jobs: Trade-related layoffs, government compensation, andvoting in US elections.” American Political Science Review 105 (01): 166–188.
Melitz, Marc. 2003. “The impact of Trade on Intra-industry Reallocations and AggregateIndustry Productivity.” Econometrica 71 (6): 1695–1725.
Melvin, James. 1989. “Trade in Producer Services: A Heckscher-Ohlin Approach.” Journalof Political Economy 97 (5): 1180–96.
Milner, Helen V. 1988. Resisting protectionism: Global industries and the politics of inter-national trade. Princeton University Press.
Nordas, Hildegunn Kyvik, and Dorothee Rouzet. 2015. “The impact of services trade re-strictiveness on trade flows.”.
Osgood, Iain. 2016a. “The Breakdown of Industrial Opposition to Trade: Firms, ProductVariety and Reciprocal Liberalization.” World Politics .
Osgood, Iain. 2016b. “Differentiated Products, Divided Industries: Firm Preferences overTrade Liberalization.” Economics & Politics .
Osgood, Iain. 2016c. “Globalizing the Supply Chain: Firm and Industrial Support for USTrade Agreements.”.
Osgood, Iain, Thomas Bernauer, In Song Kim, Helen Milner, Dustin Tingley, and GabrielleSpilker. N.d.
Owen, Erica. 2016. “Exposure to Offshoring and the Politics of Trade Liberalization: Debatesand Votes on Free Trade Agreements in the U.S. House of Representatives, 2001-2006.”International Studies Quarterly .
30

Owen, Erica, and Noel Johnston. 2015. “Occupation and the Political Economy of Trade:Job routineness, offshorability and protectionist sentiment.” working paper.
Quinn, Dennis P, and A Maria Toyoda. 2008. “Does capital account liberalization lead togrowth?” Review of Financial Studies 21 (3): 1403–1449.
Raff, Horst, and Marc von der Ruhr. 2007. “Foreign Direct Investment in Producer Services:Theory and Empirical Evidence.” Applied Economics Quarterly (formerly: Konjunktur-politik) 53 (3): 299–321.
Rogowski, Ronald. 1987. “Political Cleavages and Changing Exposure to Trade.” AmericanPolitical Science Review 81 (4): 1121–1137.
Roy, Martin. 2011. “Services commitments in preferential trade agreements: an expandeddataset.” Available at SSRN 1957564 .
Sampson, Gary P, and Richard H Snape. 1985. “Identifying the issues in trade in services.”The World Economy 8 (2): 171–182.
31