service integration in the context of pepfar programming david hoos september 2010
Post on 19-Dec-2015
214 views
TRANSCRIPT

Service Integration
in the Contextof PEPFAR
Programming
David HoosSeptember 2010
3841238777391423950839873402380
100,000
200,000
300,000
400,000
500,000
600,000
700,000
800,000
900,000
1,000,000
0
100
HIV Care ART
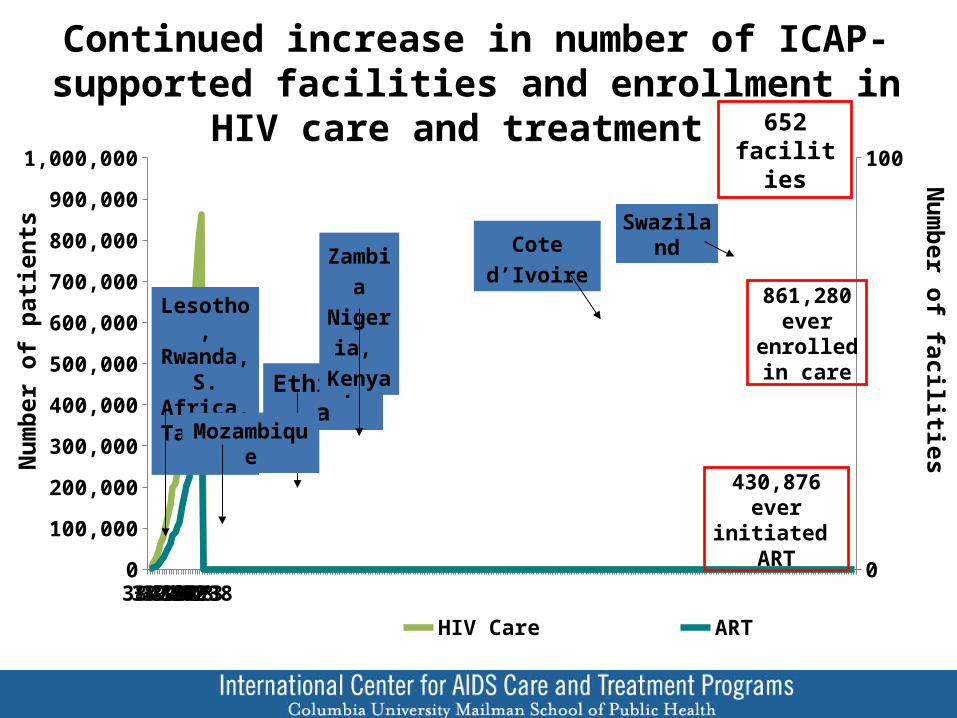
Continued increase in number of ICAP-supported facilities and enrollment in HIV care and treatment
Ethiopia
Lesotho, Rwanda,S. Africa, Tanzania
Mozambique
Zambia Nigeria, Kenya
Cote d’Ivoire
652 facilities
861,280 ever enrolled in
care
Num
ber o
f pati
ents
Num
ber of facilities
430,876 ever initiated ART
Swaziland

Demand and Uptake of HIV care and treatment continues to increase
Num
ber o
f new
pati
ents
Note: *New enrollment includes transfers
0
10,000
20,000
30,000
40,000
50,000
60,000
70,000
80,000
90,000
100,000
6,078
17,875
29,032
37,193
52,471 52,846
60,440
73,566 72,580
84,28090,326
2,1075,457
12,42716,639
24,091 26,25729,484
36,838 36,032
45,891
52,684
New care enrollment New ART enrollment

Can Efforts Related to Millennium Development Goal 6 Support MDG 4 and 5
to eradicate extreme poverty and hunger;
to achieve universal primary education;
to promote gender equality and empower women;
to reduce child mortality;
to improve maternal health;
to combat HIV/AIDS, malaria, and other diseases;
to ensure environmental sustainability; and
to develop a global partnership for development
MDG-1:
MDG-2:
MDG-3:
MDG-4:
MDG-5:
MDG-6:
MDG-7:
MDG-8:

PEPFAR implementing partners work throughout the health facility
Num
ber o
f site
s
Note: Some sites offer more than one activity
Total d
istin
ct site
s
Care &
treatm
ent
TB scre
ening fo
r HIV
pts
HIV te
sting fo
r TB p
ts
PMTCT
Early in
fant d
iagnosis
PICT/V
CTLab
0
200
400
600
800
1,000
1,200
1,400
1037
507 474310
879
451676
385
182
180 147
101
43
12414
69
Non-MCAP
MCAP
39142 39326 39508 39692 39873 40057 402380%
50%
100%
0
50
100
150
200
250
300
350
400
450
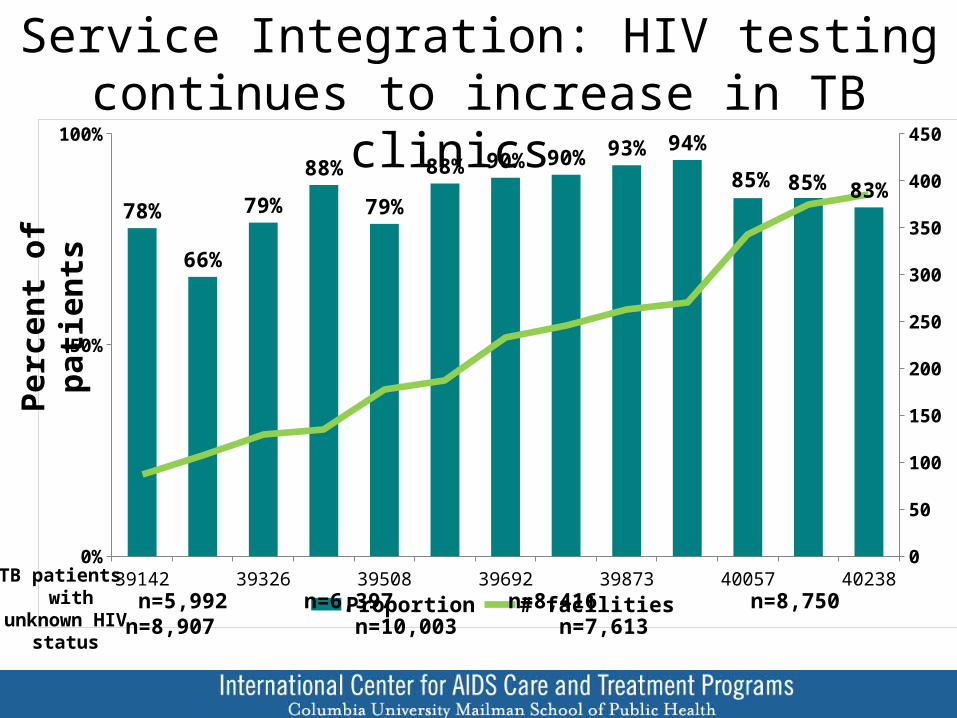
78%
66%
79%
88%
79%
88% 90% 90% 93% 94%
85% 85% 83%
Proportion # facilities
Service Integration: HIV testing continues to increase in TB clinics Pe
rcen
t of p
atien
ts
n=5,992 n=6,397 n=8,416 n=8,750 n=8,907 n=10,003 n=7,613TB patients with
unknown HIV status
Sep-07 Dec-07 Mar-08 Jun-08 Sep-08 Dec-08 Mar-09 Jun-09 Sep-09 Dec-09 Mar-100%
10%
20%
30%
40%
50%
60%
70%
0
100
200
300
400
500
600
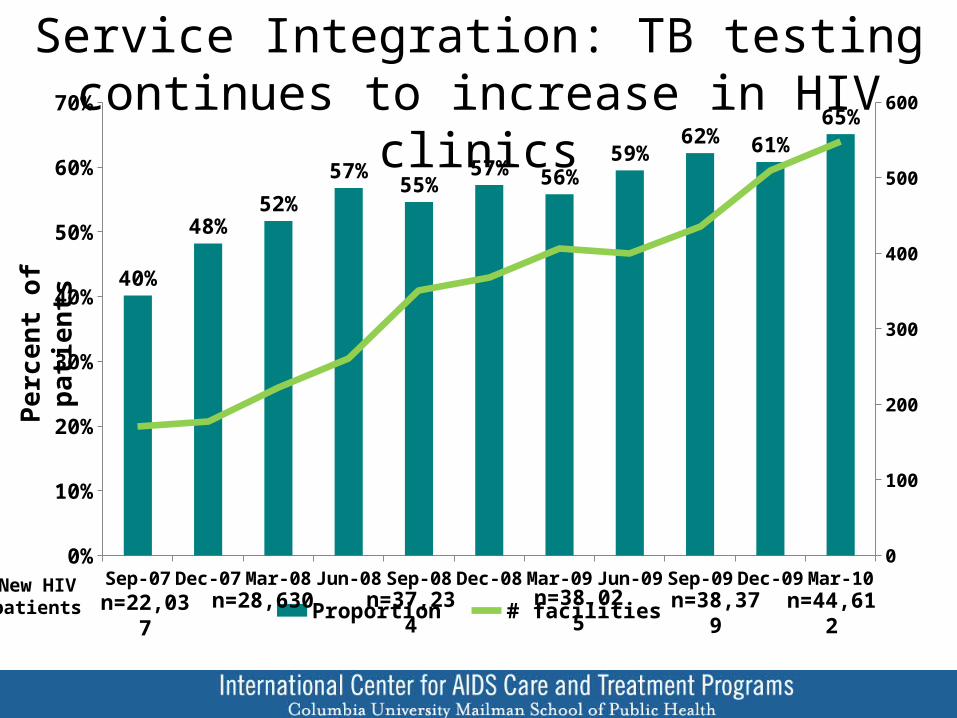
40%
48%52%
57%55%
57% 56%59%
62% 61%65%
Proportion # facilities
Service Integration: TB testing continues to increase in HIV clinicsPe
rcen
t of p
atien
ts
n=22,037New HIV patients n=28,630 n=37,234 n=38,025 n=38,379 n=44,612

PHC: HIV care is not a vertical program: care provided by same staff for same patients leads to increased retention (an opportunity for
MDG 4 and 5)

Systems for HIV Care and other Health Issues Face Common Barriers and Challenges
Maternal health Child health TB Diabetes HIV/AIDSBarriers and challenges:• Demand-side barriers • Inequitable availability• Human resources• Lack of adherence support• Infrastructure, equipment• Program management• Drug supply / procurement• Referral and linkages• Community involvement
√√√√√√√√√
√√√√√√√√√
√√√√√√√√√
√√√√√√√√√
√√√√√√√√√
Adapted from Travis, Bennett, et al. Lancet 2004

Establishment of HIV-related support services offers opportunity for generalization of essential services
Perc
ent o
f fac
ilitie
s
Adherence counseling
Outreach Peer educators Nutritional treatment for
adults
Nutritional treatment for in-
fants/children
Food security support for adults
or children
0%
50%
100% 96%
59%
31%26%
21%
98%
65%
54%
25%
41%
N/A
99%
82%
74%
41%
66%
35%
Jul-07 Jan-08 Jul-09
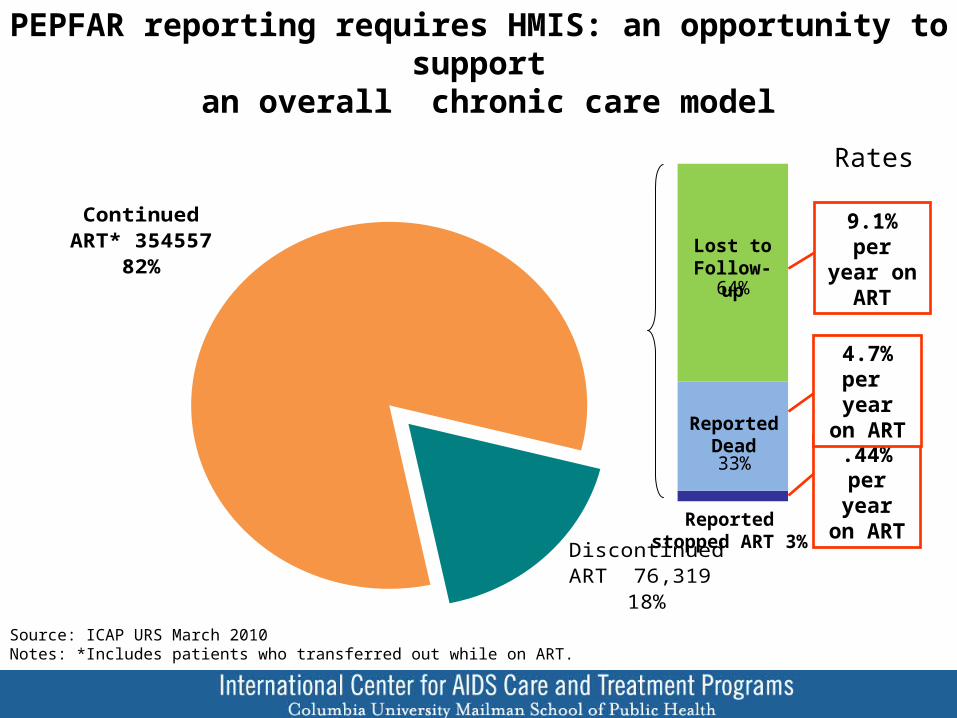
Continued ART* 354557
82%
Discontinued ART 76,319
18%
33%
64%
9.1% per year on
ART
PEPFAR reporting requires HMIS: an opportunity to support an overall chronic care model
.44% per year on
ART
4.7% per year on
ART
Lost to Follow-up
Reported Dead
Reported stopped ART 3%
Source: ICAP URS March 2010Notes: *Includes patients who transferred out while on ART.
Rates

Mapping can assist in utilization of PEPFAR supported HIV care sites for other public health needs

Interrelationship of MDGs 4, 5 and 6
• HIV and maternal conditions are the two leading causes of mortality in women age 20-59 in low income countries and worldwide*
– 17.7+ million women and girls living with HIV worldwide
– Over 530,000 women die in pregnancy or childbirth yearly
– An estimated 200 million women in the developing world want to space or limit childbearing but are not using family planning, which contributes to 25% of maternal and child deaths
– Women who are HIV-infected have rates of maternal mortality up to 5-times that of uninfected women
*Women and health: today's evidence tomorrow's agenda, WHO, 2009

Effect of HIV Treatment on Incidence of Malaria in HIV-infected Patients
Uganda & Zimbabwe
Year 1 Year 2 Year 3 Year 40
100
200
300
400
500
600
700
591
476
259
153
Rate
of M
alar
ia p
er 1
,000
pys
Kasirye et al, IAS 2009

Effect of PMTCT Programs on Quality of Overall Antenatal Care and Delivery - Cote D’Ivoire
Delvaux et al, IAS 2009

Potential Impact on < 2 Child Mortality Kwa Zulu Natal, South Africa
Ndirangu et al. AIDS 2010
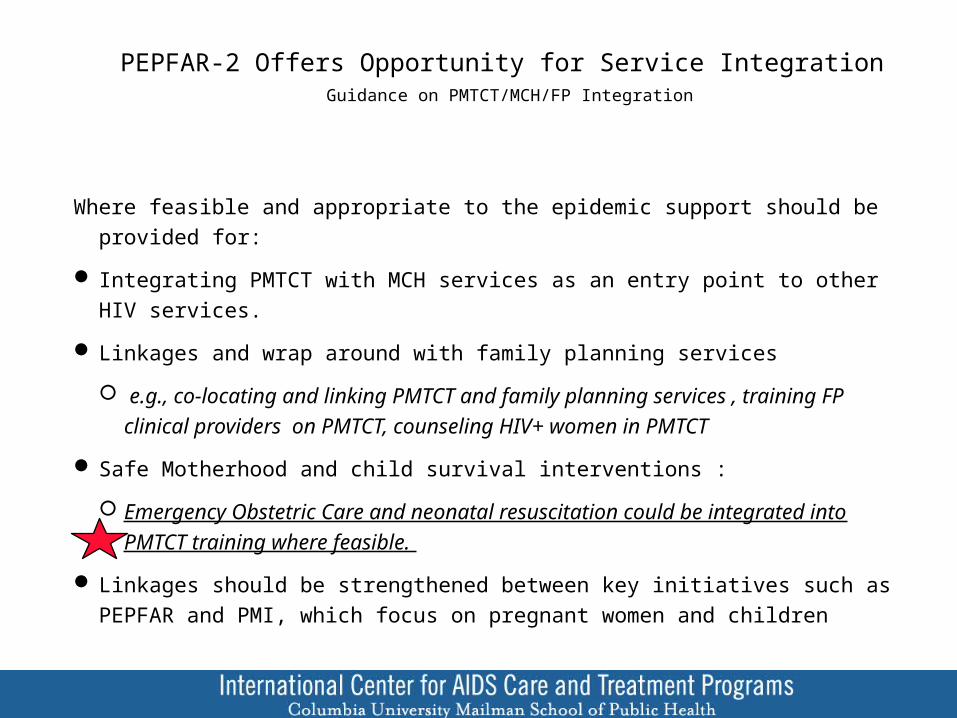
PEPFAR-2 Offers Opportunity for Service Integration Guidance on PMTCT/MCH/FP Integration
Where feasible and appropriate to the epidemic support should be provided for:
Integrating PMTCT with MCH services as an entry point to other HIV services.
Linkages and wrap around with family planning services
e.g., co-locating and linking PMTCT and family planning services , training FP clinical providers on PMTCT, counseling HIV+ women in PMTCT
Safe Motherhood and child survival interventions :
Emergency Obstetric Care and neonatal resuscitation could be integrated into PMTCT training where feasible.
Linkages should be strengthened between key initiatives such as PEPFAR and PMI, which focus on pregnant women and children

Causes of Maternal Deaths• Direct (69%)
– Obstructed/prolonged labor=21%– Ruptured uterus =22%– Severe pre-eclampsia =20%– Abortion= 10%– PPH= 10%– APH=9%
• Indirect causes (21%)– Malaria 35%– Anemia 25%– HIV/AIDS related 21%– Other 19%
• Unknown (10%)

19
But WHY Do These Women Die?• Delay in decision to seek care – increased uptake of PMTCT may
impact– Poor uptake of ANC– Lack of understanding of complications that can be prevented
by facility-based births• Delay in reaching care – expansion of level of HIV care at PHC
may improve access for other diseases– Transport – PHC not equipped to handle complications
• Inadequate /unskilled care at facilities – Training opportunities funded through PEPFAR may support– Shortages of supplies and staff– Inadequately trained staff– Finances
Three Delays Model

Challenges
• Perception that treatment and prevention are dichotomous choices
• How to identify efficiencies within development funding?
• Flat or decreased funding will limit options• Perception that disease specific funding will
cannot strengthen health systems