services to exporters integrated annual report 2016/17
TRANSCRIPT

INTEGRATED ANNUAL REPORT2016/17
BEST PROVIDER OF SERVICES TO EXPORTERSTOP EMPLOYER IN PUBLIC SECTOR TOP PERFORMING
PUBLIC SERVICE COMPANYJOB CREATION AWARD VISION 2030 - INFRASTRUCTURE DEVELOPMENT AWARD
For enquiries, contact Dr. Ayanda Vilakazi, Head of CDC Marketing and Communications: [email protected]

B-BBEE LEVEL 3 CONTRIBUTOR ISO 9001 14001 20001 27001 31000 OHSAS 18001

2 3C O E G A D E V E L O P M E N T C O R P O R A T I O N I N T E G R A T E D R E P O R T 2 0 1 6 / 1 7
THIS IS COEGA
About the Integrated Report Reporting Philosophy 6Reporting Approach & Changes 6Scope, Boundaries & Materiality 6Assurance & Comparability 7Board Statement of Appreciation, Responsibility & Approval 7Chairman’s Statement 8CEO’s Report 10Corporate Highlights 12
About Coega Development Corporation 14Business Model – How CDC Creates Value 18
Business Model Evolution 18Organisational Overview & Business Model 20Global Competitiveness 22Area Profile 24Ownership & Control 26
Stakeholders 28Material Issues – Risks & Opportunities 32Governance 34
Corporate Governance Statement 34Governance Structure 36Board of Directors 38Audit & Risk Committee 42Human Resources & Remuneration Committee 44Social & Ethics Committee 45Executive Management 46Programme Directors 47
Coega Brand Architecture 48Social Responsibility 50Coega Timeline 52
PErfOrmAnCE InfOrmATIOn
2016/17 Corporate Performance 56Strategic Overview 66IDZ Investment Services Investment Promotion 68 Infrastructure Development 74 Operations Management 78Central Support Services
Broad-Based Black Economic Empowerment (B-BBEE) 82Human Capital Solutions 84Development, Empowerment & Transformation 86
External Services External Programmes 88Sustainability Report 90Outlook 94
AnnUAL fInAnCIAL STATEmEnTS
CFO’s Review 98Certificate by Company Secretary 98General Information 100Statement of Directors’ Responsibilities and Approvals 101Independent Auditor’s Report 102Directors’ Report 108Statement of Financial Position 110Statement of Profit or Loss 111Statement of Changes in Equity 112Statement of Cash Flows 113Accounting Policies 114Notes to the Consolidated Annual Financial Statements 124Detailed Income Statement 158
AdmInISTrATIOn
Abbreviations & Acronyms 162
01 02 03 04
SECT
ION
04
SECT
ION
03
THIS
IS C
OEG
AAD
MIN
ISTR
ATIO
NPE
RFO
RM
ANCE
INFO
RM
ATIO
N

4 5C O E G A D E V E L O P M E N T C O R P O R A T I O N I N T E G R A T E D R E P O R T 2 0 1 6 / 1 7
T H I S I S C O E G A
INVESTORS16 NEW INVESTORS SIGNED DURING THE 2016/17 FY
166 697
PEOPLE TRAINED THROUGH SkILLS DEVELOPMENT DURING THE 2016/17 FY
01
SECT
ION
04
SECT
ION
03
THIS
IS C
OEG
AAD
MIN
ISTR
ATIO
NPE
RFO
RM
ANCE
INFO
RM
ATIO
N
About the Integrated Report Reporting Philosophy 6Reporting Approach & Changes 6Scope, Boundaries & Materiality 6Assurance & Comparability 7Board Statement of Appreciation, Responsibility & Approval 7Chairman’s Statement 8CEO’s Report 10Corporate Highlights 12
About Coega Development Corporation 14Business Model – How CDC Creates Value 18
Business Model Evolution 18Organisational Overview & Business Model 20Global Competitiveness 22Area Profile 24Ownership & Control 26
Stakeholders 28Material Issues – Risks & Opportunities 32Governance 34
Corporate Governance Statement 34Governance Structure 36Board of Directors 38Audit & Risk Committee 42Human Resources & Remuneration Committee 44Social & Ethics Committee 45Executive Management 46Programme Directors 47
Coega Brand Architecture 48Social Responsibility 50Coega Timeline 52
9 626NUMBER OF CONSTRUCTION JOBS CREATED DURING THE 2016/17 FY

6 7C O E G A D E V E L O P M E N T C O R P O R A T I O N I N T E G R A T E D R E P O R T 2 0 1 6 / 1 7
REPORTING PHILOSOPHY
The International Integrated Reporting Council (IIRC) requires Coega Development Corporation (CDC) to compile a fully integrated annual report in terms of the International Integrated Reporting Framework <IR>. Over the four years that the CDC has complied with this requirement, the process of collecting and collating information and the opportunity it gives to reflect on both successes and challenges has become a welcomed exercise.
The CDC supports the view of the IIRC that, in a climate of uncertainty and restrained economic performance, there is a need to develop more meaningful interactions and relations between investment decisions, corporate behaviour and reporting in order to promote financial stability and sustainable development.
According to the IIRC, <IR> helps businesses to think holistically about their strategy and plans, make informed decisions and manage key risks to build investor and stakeholder confidence and improve future performance. It is shaped by a diverse coalition including business leaders and investors to drive a global evolution in corporate reporting.
This “integrated thinking” breaks down internal silos and reduces duplication while also improving the quality of information available, thereby enabling a more efficient and productive allocation of capital. Its focus on value creation, and the “capitals” used by the business to create value over time, contributes towards a more financially stable global economy.
Once again this year, the reporting process has stimulated integrated thinking within the CDC. It sharpened the organisation’s focus on first evaluating and understanding the external environment and stakeholder needs and concerns in order to make decisions on material issues. This process informs the CDC’s strategic response, planning and performance targets which are aimed at creating value over time for shareholders and both the CDC and its broad base of stakeholders.
The CDC is confident that the 2016/17 Integrated Annual Report will provide shareholders, stakeholders and investors with clear, concise, connected and comparable information about how the CDC’s strategy, governance, performance, and prospects are creating value over the short- medium- and long term. This information is supplemented by the website (www.coega.co.za), which carries more in-depth information on the various projects and initiatives in which the CDC is involved. The CDC website is updated regularly.
Readers of this report are given a clear picture of the CDC’s strategic objectives, current position, where it is heading and how it plans to get there. The objective is to enable investors and other stakeholders to make informed assessments of the CDC’s performance and its ability to continue creating stakeholder, customer, and shareholder value.
In the pages that follow, the reader will discover details of the CDC’s mandate, strategy, business model, governance structure, performance review and future outlook. The report also illustrates how the CDC is responding to risks and opportunities in its drive to create sustainable value and to support the Provincial Government, business and civil society in the drive to address the socio-economic developmental needs of the Eastern Cape.
REPORTING APPROACH AND CHANGES
In the 2016/17 Integrated Annual Report, the focus of the content continues to be on connecting performance more closely to strategy and material issues in line with the guiding principles of the <IR> Framework and the King III report on corporate governance.
The following reporting standards have been applied in the preparation of this report:
• <IR> Framework v1.0, International Integrated Reporting Council, December 2013
• Public Finance Management Act (PFMA), Act 1 of 1999• Companies Act, Act 71 of 2008• International Financial Reporting Standards (IFRS)• King Code of Corporate Governance for South Africa (The
Institute of Directors in Southern Africa) September 2009 (King III).The King IV report on Corporate Governance for South Africa 2016 (King IV) published on 1 November 2016 is effective in respect of financial years commencing on or after 1 April 2017. King IV replaces King III in its entirety. Therefore, the CDC’s Integrated Annual Report 2017/18 will be based on King IV.
SCOPE, BOUNDARIES AND MATERIALITY
This report covers the financial year 2016/17 from the period 1 April 2016 to 31 March 2017. It encompasses all operations related to the mandate of the CDC. This includes its role as the license holder responsible for the development and operation of the Coega Industrial Development Zone (IDZ).
Using the expertise and experience acquired during the creation of the IDZ infrastructure since inception from 1999, the CDC is also able to serve as an implementing agent (IA) for certain key government departments in support of the Infrastructure Delivery Programme (IDP). The IDP is an initiative of the South African government to fast-track and improve the standard of infrastructure delivered by the public sector. In order to provide this support, the CDC has adopted the infrastructure delivery management system (IDMS), which helps to ensure that the organisation is able to support efficient and effective public sector infrastructure investment.
The CDC operates in a dynamic environment. Therefore, the organisation adapts in order to respond to meeting the needs and requirements of all stakeholders, including funders, investors, tenants and external services clients. This is reflected in the report, which highlights the performance of the CDC in the context of its strategy, including its commercial and project management services and its management of the Nelson Mandela Bay Logistics Park.
The activities of investors, tenants and the adjacent Port of Ngqura are addressed only to the extent that they impact upon, or are serviced or influenced by, the CDC’s execution of its strategy.
ASSURANCE AND COMPARABILITY
The CDC employs a rigorous system of internal controls, as well as external oversight, to assure the quality of its reported results and its adherence to international standards.
Wherever possible, the results for the year under review are compared to at least one of the following:
• The previous year• Cumulative for the past five years• And/or cumulative since inception
Financial controls and risk management are subject to review through an internal audit process. As a public entity, the CDC’s financial statements are independently reviewed and reported on by the Auditor-General of South Africa.
Similarly, non-financial information is subject to internal review and control in accordance with the standards set by the Board and independent external verification that has taken place during the period under review.
The Board provides leadership and ongoing support to create an environment with controls and risk management mechanisms that have strengthened the CDC and enhanced governance.
Internal assurances included internal audit, risk management and executive management committee supervision, with additional oversight from the Board, its sub-committees and the CDC’s project committees.
Certification
The CDC obtained the following standards and certification in the year under review:• ISO 9001 : 2015• OHSAS 18001 : 2007• ISO 14001 : 2004• ISO 27001 • ISO 20000
Furthermore, the organisation is pursuing certification in the following standards:
• ISO 28000• ISO 50001
Similarly, the CDC undertakes an annual independent project management maturity audit based on internationally accepted project management standards such as OPM3 and P3M3, which were developed by the Philadelphia, USA-based Project Management Institute (PMI).
In addition, the CDC received six certificates of excellence (or recognition awards) during the period under review. These were: Top Performing Public Service Company: Job Creation; 2030 Vision; Legends of Empowerment & Transformation; Top Employer in SA: Public Sector; Top 50 companies in the Nelson Mandela Bay (NMB); and Best Established Black Business Awards. Two more prestigious awards were received in 2017, these were Vision 2030 - Infrastructure Development award and Best International Trade Marketing Specialist in Africa award.
BOARD STATEMENT OF APPRECIATION, RESPONSIBILITY AND APPROVAL
There are a number of individuals and organisations whom the Board would like to thank for their vital roles in the last year, including, the chair of the Parliamentary Portfolio Committee on Trade and Industry, Ms Joanmariae Fubbs; the Minister of Trade and Industry, Dr Rob Davies; the Minister of Economic Development, Mr Ebrahim Patel and their respective deputy ministers and directors general.
The Board also expresses its appreciation to the Premier of the Eastern Cape, Mr Phumulo Masualle; the Eastern Cape MEC for Finance, Economic Development, Environmental Affairs and Tourism, Mr Sakhumzi Somyo and their respective heads of department for their support, oversight and leadership.
CDC staff and external stakeholders are vital to the success of the organisation. Therefore, the Board extends a special and warmhearted thank you to each and every person who continues to uphold the values and high performance standards of the organisation.
The CDC Board, assisted by its committees, is ultimately responsible for oversight of the integrity of the annual report. Therefore, the Board has collectively reviewed the output of the integrated reporting process and has concluded that the 2016/17 Integrated Annual Report has made substantial progress over the previous year in the journey to meeting the requirements of the International Integrated Reporting Framework v1.0.
ABOUT THE INTEGRATED REPORT
Dikobe Ben Martins & Dr Rob DaviesMinister of Energy & Minister of Trade and Industry (respectively)“Coega IDz is a good story to tell.”
C O E G A D E V E L O P M E N T C O R P O R A T I O N I N T E G R A T E D R E P O R T 2 0 1 6 / 1 7
SECT
ION
04
SECT
ION
03
THIS
IS C
OEG
AAD
MIN
ISTR
ATIO
NPE
RFO
RM
ANCE
INFO
RM
ATIO
N

8 9C O E G A D E V E L O P M E N T C O R P O R A T I O N I N T E G R A T E D R E P O R T 2 0 1 6 / 1 7
CHAIRMAN’S STATEMENT
As I look back on the 2016/17 financial year, there are many factors that are worthy of praise, but there is one statistic that stands out above the rest.
This financial year saw the IDZ exceeding more than 100 000 jobs created since its inception 16 years ago. This figure, more than
any other, demonstrates the impact that the Coega Development Corporation (CDC) has had on the socio-economic-development of the Eastern Cape and of South Africa, as a whole.
It also speaks to the core of why CDC was established, and why so many people have devoted their best years to building the Coega Industrial Development Zone (IDZ). It is a clear indication that we are doing our part in fulfilling our mandate in terms of the National Development Plan’s focus on job creation.
The success of the Coega IDZ is even more rewarding, given the current climate of low economic growth and investment volatility. The environment for doing business is no less challenging this financial year than last year, but we have seen the CDC’s global competitiveness and the IDZ’s unique value proposition paying dividends beyond all expectations.
The forward-thinking decision by the Department of Trade and Industry (dti) to offer Special Economic Zone (SEZ) incentives to investors has added to the business case for investing in the Coega IDZ, soon to be Gazetted a Special Economic Zone.
Although the manufacturing sector in South Africa has not yet achieved the highs last seen in 2008 before the global slump, figures from Statistics SA have shown a steady upward trajectory, with exports from South Africa rising 16.4% month-on-month to R101.2 billion in March of 2017. We hope that the SEZ incentives would soon start showing growth of other sectors with export orientation on which the CDC focusses.
This upswing has been even more apparent at Coega, with more than 90% of CDC’s current and operational investors describing the Coega IDZ and its logistics park in particular as the ideal location for global industries.
Throughout the period under review, the Coega IDZ and the deep water Port of Ngqura have remained catalysts for investment and local development. Nowhere is this clearer than the single largest investment in 40 years in the whole of Africa: the historic Beijing Automobile International Corporation’s (BAIC) R11 billion investment at the Coega IDZ, which was announced in August 2016.
As we look ahead to the next financial year, we acknowledge that there are challenges ahead and that the credit agency downgrades may have an impact on investor confidence and economic growth. We remain confident, however, that our track record of excellence and the new investment projects worth over R1 billion, ready for implementation from April 2017, will ensure that our growth trajectory continues its upward trend.
The achievements and successes of the Coega IDZ over the past five years have proven that our approach to attracting investors is working, even when faced with geopolitical and low economic growth and investment volatility. Therefore, the CDC’s global competitiveness and IDZ value proposition continues to offer investors a strategic location and a gateway to other African markets in the continent through its world-class infrastructure, integrated logistics and advanced Information Communication Technology and labour management systems.
In conclusion, I would like to express my utmost appreciation to the Board, its Committees and the Executive Management team for achieving their Key Performance Indicators (KPIs) during 2016/17. I would also like to commend CDC staff and each and every person who played their part in making the CDC an unrivalled success by giving their best, day by day.
350 MW peaking power plant
Dr Paul JourdanChairman
SECT
ION
04
SECT
ION
03
THIS
IS C
OEG
AAD
MIN
ISTR
ATIO
NPE
RFO
RM
ANCE
INFO
RM
ATIO
N
BAIC GROUP CONSTRUCTION SITE: Aerial view of the 54,62 ha BAIC Group site with the construction of the 85 000 m2 plant facility underway.

10 11C O E G A D E V E L O P M E N T C O R P O R A T I O N I N T E G R A T E D R E P O R T 2 0 1 6 / 1 7
CDC’s place in a global world
CDC must be realistic of its place in a world that is experiencing a marked decline in economic growth. Emerging and advanced economies saw a growth decrease during 2016. Similarly, South Africa’s economy contracted by 0.3% quarter-on-quarter (seasonally adjusted and annualised), reported by Stats SA. Africa as a whole recorded growth of below 3.4%. National Treasury has pegged its growth estimate at 1.3% for the year ahead, improving to 2% in 2018 and 2.2% in 2019.
Therefore, CDC must seek opportunities that are able to provide additional value and investments amidst a stagnating economic climate.
A recent independent report by Muffin Consulting highlighted that locating one’s business in the Coega IDZ could prove to be a profitable business decision for local and global companies. The study shows that 84% of the companies that have invested and located in the Coega IDZ reported an increase in profitability year-on-year. Over 85% of investors have increased their workforce since opening their businesses in the IDZ, and 62% have expanded their businesses/ factories. More than 90% of CDC’s operational investors described the IDZ and its logistics park in particular as the ideal location for global industries looking for growth.
Investment in the Coega IDZ reflects the positive trends identified in the recently unveiled EY’s Attractiveness Program Africa & Foreign Direct Investment (FDI) 2017. The research by FDI Markets shows a 31.9% growth in foreign capital investment in Africa between 2015 and 2016, owing to capital intensive projects in the real estate, hospitality and transport/logistics sectors. This supports the EY’s Attractiveness Program Africa report, which identified 676 new foreign direct investment (FDI) projects in Africa in 2016. In 2017, South Africa was ranked the second most attractive country in Africa for FDI, down from its top ranking position in 2016, now occupied by Morocco. South Africa was ranked first in Africa for investment in infrastructure and logistics, second for economic diversification and 33 for Macro-economic resilience.
In its quest to maintain a position of the preferred Foreign Direct Investment (FDI) destination of choice in Africa, the CDC must continue with its diversification and innovation programme, be efficient, and provide a competitive investment location.
Awards of Excellence
The organisation has received six prestigious certificates of excellence, during the period under review namely, Top
Performing Public Service Company; Job Creation; 2030 Vision - Infrastructure Development; Legends of Empowerment & Transformation; Top Employer in SA - Public Sector; Top 50 companies in the Nelson Mandela Bay (NMB); and Best Established Black Business Awards.
In addition, two more awards were achieved in 2017. CDC was announced the overall winner of the prestigious Infrastructure Development Award in South Africa at the locally-held Vision 2030 Awards in Johannesburg. CDC also received the coveted title of “Best International Trade Marketing Specialist” at the sub-Saharan Enterprise Awards 2017, hosted by MEA (Middle East & Africa) Markets. This makes the Coega IDZ an internationally-award winning IDZ; the first IDZ in South Africa to obtain such a prestigious title.
The Coega IDZ’s excellence was further acknowledged by the People’s Republic of China’s Vice President, Dr LI Yuanchao, during his State visit to South Africa and the Coega IDZ in November 2016, who said “I’ve been to many developing countries and industrial development zones in the world, the Coega IDZ is by far the best of them all.” The DG of the dti, Mr Lionel October, in his visit to the CDC in December 2016, further highlighted his support and was pleased with the CDC’s progress and achievements as an IDZ when he said “Coega is a flagship programme we are very proud of. It’s effectively the best functioning and most successful IDZ in the country and also has world class management and corporate governance systems.”
All of the awards received and acknowledgements serve to highlight that the CDC is delivering on its mandate and promise to our shareholders, investors, stakeholders, communities and its employees.
Conclusion
The accomplishments mentioned and reiterated throughout this report do not happen in isolation. They are a culmination of many hours of real hard work and input from CDC’s Board, investors, shareholders, stakeholders and employees. Amidst, a stagnating economic climate and the Rating agencies downgrade of South Africa, we are confident of our position to continually add value to the growth of the Eastern Cape’s economy and South Africa, as a whole, in order to make a lasting contribution.
Please join me on our journey to realise our vision for growth in the region, our country and the continent.
CEO’S REPORT
As Chief Executive of the Coega Development Corporation (CDC), I have the satisfaction of looking back each year and seeing how we are living up to our mandate to:
• Develop and operate the 11 500 ha Coega Industrial D eve l o p m e n t Z o n e (“Coega IDZ”)
• Facilitate the creation of an industrial complex with clear economic advantages;
• Provide the location for the establishment of strategic investments;
• Enable the exploitation of local resources for intensive industries, beneficiation and manufacturing;
• Take advantage of existing industrial capacity that promotes integration with local industry and increases value – added production; and
• Create employment and other economic and social benefits in the region in which the Coega IDZ is located.
In pursuing business opportunities to ensure the sustainability of the CDC, we take a particular focus on delivering socio-economic growth in accordance with our vision, mission, and values.
Performance overview
Once again, I am pleased to report that the CDC has cemented its role as the country’s leading IDZ in terms of key corporate performance indicators. This year, we have secured a total of 16 new investors with a combined investment value of R11.685 billion – 962% ahead of target. The positive impetus is set to continue as the new financial year begins, with investment projects worth over R1 billion ready for implementation in the Coega IDZ, from April 2017. In addition, the organisation exceeded the half-a-billion rand revenue mark for the first time since its inception 16 years ago, despite the absence of OPEX funding, which has had a direct impact on the achievement of annual targets. In spite of this, the CDC managed to achieve, where possible, its annual targets. Actual performance has been exceeded for all Key Performance Indicators (KPI’s), showing an overall performance achievement at 245%. In addition, the organisation achieved an overall performance of 101% against the set five year targets.
Furthermore, in line with the mandate and vision of the organisation, the CDC has created 9 626 construction jobs and 7 243 cumulative operational jobs during the period under review. For the first time in the history of the organisation, the CDC has exceeded 100 000 jobs created (direct and indirect), to achieve 102 794 jobs, a significant milestone given the challenges the country is facing in terms of creating job opportunities and with the unemployment rate reported by Stats SA at 27.7% in the first quarter of 2017. The growth trajectory of the organisation in the past four financial years has yielded double digit investments. In the 2013/14 financial year there were 10 new investors, whereas in the 2014/15 financial year there were 19 new investors. Last year we were able to confirm 17 new investors and this year we have welcomed 16 new investors – bringing a total number of new investment achieved in the past four years to 62. No other IDZ in the country has been able to achieve such a number of investments over the same period.
Highlights
The Eastern Cape is well-known for its role in driving the automotive industry in the province and the country. But not in the last forty years has the continent seen such a significant investment in the automotive industry as the Beijing Automobile International Corporation (BAIC) at the Coega IDZ, signed last year. Site preparation has already begun for the construction of the 85 000 sqm new manufacturing plant, with several milestones already achieved.
Notwithstanding the absence of OPEX funding, among some of the key performance highlights in the 2016/17 financial year, the CDC has contributed to the growth of small businesses by awarding over 38% of all procurement spent to Small Micro Medium Enterprise’s (SMME’s). Of particular significance is the SMME spend, which amounted to R831,8 million in 2016/17. Already the BAIC investment has seen 11 SMMEs from the Nelson Mandela Bay Metropolitan Area (including two female-owned companies) given work packages valued at more than R17 million during the site preparation stages of the project.
In addition, training and development is critical to the economy of the province in providing the much needed skills, especially to the youth. I am proud to say that the CDC has provided training to 6 697 people in the period under review.
As regards to sector developments, one of our flagship projects is in the energy sector, which is the biggest operational investment in the zone to date, the R3,5 billion 342 MW Dedisa Peaking Power station. Together with our wind farm, these two projects are proof of the attractiveness of Coega as a destination for investors, particularly in the energy sector and is already having spinoffs for other energy projects, including the gas to power plant, with an allocation of 1 000 MW and an estimated investment value of R25 billion. In addition, during the period under review, CDC concluded a MoU with Eskom to commence discussions to cooperate in the development of South Africa’s nuclear new build programme (NNBP), specifically to build local capacity through supplier development and localisation.
The metals and manufacturing sector of the Coega IDZ has grown in stature. The sector will soon roll out three new investment projects. These include a R650 million manufacturing cement grinding plant, a R71 million ready mix concrete plant, and a R350 million Gas Cylinder Plant. Other major investors in the IDZ include a lighting plant, logistics operators, green energy companies and agro-processors. Similarly, an increasing number of shipping and logistics-related investments, including National Ship Chandlers, MSC SA and Vector Logistics, are also indicative of a growth trend of the logistics sector, supported by the port of Ngqura which is coming into its own.
Furthermore, Coega is attracting investors in all the main growth sectors identified namely technology, media and telecommunications, consumer products and retail, business services, transport and logistics and automotive. A positive for the Nelson Mandela Bay Metro and Eastern Cape is that we are seeing less reliance on the automotive sector to create jobs and economic growth.
Given such growth, we have seen the Coega IDZ achieving 40 operational investors, which have contributed a cumulative investment of R6.996 billion.
16 new investors signed
SECT
ION
04
SECT
ION
03
THIS
IS C
OEG
AAD
MIN
ISTR
ATIO
NPE
RFO
RM
ANCE
INFO
RM
ATIO
N
The Integrated Annual Report 2016/17 was approved for release by the Board and signed on its behalf by:
Lionel Billings Chief Financial Officer
Dr Paul JourdanChairman
Mninawe (Pepi) SilingaCEO
3 August 2017 3 August 2017 3 August 2017

12 13C O E G A D E V E L O P M E N T C O R P O R A T I O N I N T E G R A T E D R E P O R T 2 0 1 6 / 1 7 178 km of service ducts (telecoms)
2016/17 FY CORPORATE HIGHLIGHTS
Promote Small Medium and Micro Enterprise
(SMME) Development
38%PERFORMANCE
ACHIEVED
Improve Skills Development
6 697PERFORMANCE
ACHIEVED
Number of New Investors
16PERFORMANCE
ACHIEVED
Value of Investment
R11,685 billion PERFORMANCE
ACHIEVED
Operational Investors
40PERFORMANCE
ACHIEVED
SECT
ION
04
SECT
ION
03
THIS
IS C
OEG
AAD
MIN
ISTR
ATIO
N
Cumulative Operational Jobs
7 243PERFORMANCE
ACHIEVED
Construction Jobs Created
9 626PERFORMANCE
ACHIEVED
Revenue Generated
R541,8 million
PERFORMANCE ACHIEVED
PER
FOR
MAN
CE IN
FOR
MAT
ION
reduced Corporate Income Tax rate – Certain companies will qualify for a reduced rate of 15% (instead of 28%) between 2014 and 2024
Building Allowance – Qualifying businesses operating within SEZs will be eligible for an accelerated depreciation allowance of 10% for buildings
12i Tax Allowance – This offers a tax allowance in relation to capital investment for NEW industrial projects, as well as expansions or upgrades to EXISTING ones
VAT and Customs relief – Businesses within customer-controlled areas will qualify for VAT and customs relief, similar to those currently enjoyed in IDZs
Employment Tax Incentive – Employers that hire low-salaried staff (below R60 000 PER ANNUM) in any SEZ will be entitled to this incentive
%
SPECIAL ECONOMIC zONE TAX INCENTIVES
The success of the Coega IDZ in attracting investors under the new Special Economic Zone (SEZ) Act (Act No 16 of 2014) will depend on the effectiveness of the SEZ incentives in making South Africa a more globally competitive investment destination. The SEZ Act came into operation on 9 February 2016, having been signed into law in May 2014. The legislation aims to boost private investment (domestic and foreign) in labour-intensive areas in order to stimulate job creation, competitiveness, skills and technology transfer as well as increasing exports of beneficiated products through the establishment of special economic zones. Incentives for qualifying companies located in an SEZ include, value-added tax and customs duty relief – if located in a customs controlled area; and the relaxation of employment tax incentive (ETI) provisions, subject to certain conditions. More information on the SEZ incentives for qualifying companies is available on the department of trade and industry’s website (http://www.thedti.gov.za/industrial_development/sez.jsp).
EMPOWERING GROWTH: BAIC SA Manufacturing Plant on track to start production in 2018, with excavations already underway.

14 15C O E G A D E V E L O P M E N T C O R P O R A T I O N I N T E G R A T E D R E P O R T 2 0 1 6 / 1 7
1
2
3
ABOUT COEGA DEVELOPMENT CORPORATION C O E G A D E V E L O P M E N T C O R P O R A T I O N I N T E G R A T E D R E P O R T 2 0 1 6 / 1 7
The Coega Development Corporation (CDC) is a state-owned enterprise (SoE) based in the Nelson Mandela Bay Municipality with operations throughout South Africa. The corporation is mandated to develop and operate the 11 500 ha Coega Industrial Development Zone (IDZ), which was established in 1999. To this end, the CDC is tasked with the responsibility to create employment, provide training and development, and SMME support and development opportunities, in order to reduce unemployment, inequalities, and to eradicate poverty in the Eastern Cape, with a focus on Nelson Mandela Bay Metro, in particular. Therefore, the CDC’s vision is to be the leading catalyst for the championing of socio-economic growth. Its mission is to provide a competitive investment location supported by value-added business services that effectively enables socio-economic development in the Eastern Cape and the rest of South Africa.
In the 17 years since its establishment, the CDC has become South Africa’s most successful IDZ and has matured to become one of the biggest drivers of job creation and development of the Eastern Cape economy. It is purpose-designed following the cluster model, which strategically positions related and synergistic industries and their supply chains in close proximity to one another in order to maximise efficiency and minimise turnaround times.
The Coega IDZ is demarcated into 14 zones, with the focus being placed on the following sectors:
• Metals/Metallurgical• Automotive• Business Process Outsourcing (BPO) • Chemicals• Agro-processing
• Logistics• Trade Solutions• Energy• Maritime
In 2008, the reach of the Coega IDZ was extended to include the 216 ha Nelson Mandela Bay Logistics Park (NMBLP) in Uitenhage, an area which provides infrastructure and support services to the automotive manufacturing industry, thus reducing costs and improving suppliers’ competitiveness.
The CDC’s organisational structure is based on the three main business areas:
• The Coega IDZ – currently home to 40 operational tenants, who comprises of local and international investors. This translates into a combined investment value in excess of R6,996 billion;
• Coega Commercial Services – which includes: – Recruitment and selection, training and development,
staff development services for investors in the IDZ, and social facilitation, through Coega Human Capital Solutions (Coega HCS);
– Business and leisure travel-related solutions (including accommodation and car hire) through Coega Corporate Travel (CCT) providing seamless and cost effective travel management solutions. CCT hold an IATA accreditation, a seal of approval recognised worldwide;
– Consulting services providing fully scalable suite of integrated management consultancy and turnkey solutions through Coega Business Solutions (CBS);
– ICT services by Coega Telecoms enhancing the Coega IDZ telecommunications services; and
– Accommodation and conferencing at the Vulindlela Accommodation and Conference Centre (VACC).
• Project Management Services – Engineering and project management skills honed during the construction of Africa’s largest IDZ, Coega IDZ, have been retained to enable the CDC to contribute towards the socio-economic development of the country. To this end, the CDC acts as an Implementing Agent (IA) for a range of public and private sector clients, providing infrastructure development and
facilities management services throughout South Africa. CDC is also assisting other companies/ agencies in the country with the establishment of the SEZ under the new SEZ Act (Act No. 16 of 2014). In the near future, these services would be extended to the rest of the African continent, especially the Eastern Corridor.
The Coega Development Corporation offers the following revenue generating products and services:
REVENUE GENERATING PRODUCT OFFERING
IDZ Focus Industrial Estate Planning & Development
• Infrastructure Planning & Development• Investment Promotion • Facilities Management• One-Stop-Shop
IDZ & Non-IDZ Focus
Travel Agency Services• Travel Planning• Travel & Accommodation• VISA Applications
Skills Development Services
• Accredited Training• Mentorship & Development• Non-accredited Training• Human Capital Solutions
Non-IDZ Focus
Programme Implementing Agency Services
• Project Management Services• Mega & Minor Infrastructure
Development• Facilities Management
Management Consultancy Services
• Turnkey Business Solutions• Economic Research & Development• Document Management Services• IDZ Planning & Development• Business Process & Systems
Re-engineering• ICT Systems Development & Support
TOP 9 REASONS TO INVEST AT COEGA
World Class Infrastructure
• The Coega IDZ is ready to “plug and play”. All the necessary infrastructure is in place, including roads, bulk water and sewer networks, telecommunication sleeve networks, electrical substations (HV and MV), and overhead power lines (HV and MV) – all that investors are looking for and more in a world class industrial development zone.
Governance
• CDC has robust internal governance structures in place to prevent corruption. Strong and proven supply chain processes ensure minor and mega infrastructure projects are implemented on time, within scope and on budget.
A Connected Zone
• There is a rail connection between the IDZ, the rest of South Africa and neighbouring countries
• Major roads provide a seamless link into the national N2 arterial highway, which connects the IDZ to the rest of the region
• The zone is integrated into Africa’s newest deep-water harbour, the Port of Ngqura
• National and international connectivity for passengers and freight is provided by the Port Elizabeth International Airport (PLZ), which is around 20 minutes travelling time away on the N2 Freeway
• It takes just 1 hour 40 minutes to fly from PLZ to OR Tambo International Airport on a route serviced by a number of airlines
• The distance to the main banking and business precincts in Port Elizabeth is around 20 km, which takes about 15 minutes.
R11,685 billion investment value
SECT
ION
04
SECT
ION
03
THIS
IS C
OEG
AAD
MIN
ISTR
ATIO
NPE
RFO
RM
ANCE
INFO
RM
ATIO
N
Coega IDZ focus sectors:

16 17C O E G A D E V E L O P M E N T C O R P O R A T I O N I N T E G R A T E D R E P O R T 2 0 1 6 / 1 7
4
9
8
5
6
7
Regional and international logistics
• The Coega IDZ is strategically positioned on the main Southern Hemisphere east-west shipping routes
• It is the only IDZ in Africa to be served by two ports, with a combined capacity of over two million TEU (Twenty Foot Equivalent Unit) a year
• The deep-water port of Ngqura is the designated South African hub for container traffic, and is served by the world’s top shipping lines
• Named day services connect the port to the main global markets and supply centres
• The Port of Port Elizabeth operates world class container, vehicle, breakbulk and bulk terminals
• The shipping links are complemented by direct road and rail links to the rest of South and Southern Africa.
World Class Support Systems
• Geographic Information System helps investors make informed decisions on positioning their plant
• ICT Solutions for supply chain management, budgeting, procurement and financial management
• Customs Control Areas (CCA) in the Logistics and Automotive Zones
• Customs compliance infrastructure management• Proven in-house expertise in delivering
infrastructure projects of all sizes on budget and on time.
One Stop Investor Services Centre
• Full Human Relations support, including recruitment, training and managing labour relations
• Assistance with visa applications, work and study permits, applications for municipal services
• Assistance with applying for incentives • Facilitation of environmental approvals and licence
requirements for project development (EIAs, Basic Assessment, Air Quality Licence, Waste Licence and OEMP)
• Customs services to assist with all SARS Customs registrations and permit processes in preparation for approval of facility for operational phases
• Incentives: Assist all investors to ensure optimal use of all necessary incentives available to industry (IDZ, Municipal, and Sector Specific Incentives)
• Construction management and operational Safety, Health and Environment (SHE) management systems in place
• SHE systems monitor and control construction and operational phases (waste management, water and air quality, storm water and effluent, alien plant eradication, open space management)
• The CDC clinic provides services during construction and operational phases.
Incentives
• The CDC assists investors in their application for incentives offered by the national government, provincial legislature and local municipality. They include incentives for:
– Training – Automotive Production and Development
Programme (APDP)– Production Incentive Programme– Aquaculture Development and Enhancement
Programme– Research and Development (S11D) – Export promotion incentives – Infrastructure support – Reduced municipal costs
• The Coega IDZ also provides some of the most affordable rates for developed and zoned industrial land in Africa.
Skills Development
• Systems are in place to assist investors with skills development
• Advanced systems for registering work- seeker and competency based recruitment functionality
• Advanced labour management systems in place• Co-ordinated transport services• Induction training capacity• Central wage payment services• Construction Village facilities provide
accommodation, conference and training venues• Partnership with internationally recognised
university (NMMU) for research and development• Apprenticeship training centre (construction,
manufacturing and MEI).
Lifestyle – the Best of All Worlds
• Nelson Mandela Bay and its surroundings offer a lifestyle that is the envy of other IDZ operators around the world
• It offers a cosmopolitan Indian Ocean lifestyle that is a unique mix of the best of African, European and Asian cultures
• Executives and key staff will find comfortable homes within a 20 minute commute of the IDZ
• Nelson Mandela Bay has world-class theatres, including an opera house, museums, restaurants, beaches, public gardens, sports stadiums, gymnasiums, hospitals and shopping malls
• It is home to some of South Africa’s top schools, as well as the Nelson Mandela Metropolitan University
• There is plenty of opportunity to enjoy the great outdoors – Nelson Mandela Bay is the sunniest metro complex in South Africa
• Algoa Bay, the metro, is rated as one of the top water sport venues in the world and has world-renowned Blue Flag beaches
• Nelson Mandela Bay is the gateway to the world-famous Garden Route
• For those venturing further afield, the Metro is 750 km from Cape Town along the Garden Route, 1 000 km from Durban, and 1 300 km from Gauteng.
LIFESTYLE: Nelson Mandela Bay and its surroundings offer a lifestyle that is the envy of other IDZ operators around the world, making Coega IDZ and NMBM an ideal investment location.
589 employees
SECT
ION
04
SECT
ION
03
THIS
IS C
OEG
AAD
MIN
ISTR
ATIO
NPE
RFO
RM
ANCE
INFO
RM
ATIO
N

18 19C O E G A D E V E L O P M E N T C O R P O R A T I O N I N T E G R A T E D R E P O R T 2 0 1 6 / 1 7
The diagram below indicates the evolution of the CDC’s business model, with the addition of project management services outside of the IDZ:
The IDZ focuses on investment attraction and therefore it is investor specific; however, these investors also make use of the external consulting products and services on offer (commercial services), specifically human capital solutions, corporate travel, accommodation and conferencing facilities and Telecoms. External consulting is comprised of individual business units originally intended to support the investors of the IDZ, but which now operate with a core focus to generate their own revenue through servicing of private businesses and government.
Project Management Services is targeted to cater to the project management needs of large infrastructure developments, currently servicing government projects and IDZ investors, but can potentially service private industry infrastructure development projects in the country and the rest of the African continent.
The CDC’s previous five-year strategy 2009/10 - 2014/15 indicates a business model that has evolved over time from mainly investment attraction to providing project management and strategic services to a broader range of clients in the public and private sector. This evolution came about through the implementation of the CDC’s five-year rolling strategy, that ended in the 2014/15 FY, and which saw a diversification of the CDC’s core business from IDZ developer and operator to catalyst for the championing of socio-economic development throughout the Eastern Cape and beyond thus empowering growth and development in South Africa.
This shift in strategy reflects the CDC’s vision of a developmental organisation and the reduction in government grant funding, which has greatly challenged the business model of the CDC.
As a result, over the past few years, the CDC has pro-actively developed external consulting businesses (including project management of provincial and national Infrastructure Programmes). The consulting business has evolved from the capabilities the organisation has built internally over time, which have been converted into product and services offering delivering customer value and diversifying CDC’s income streams.
Therefore, the external consulting businesses and infrastructure programmes have driven a consistent increase in self-generated revenue for the CDC, growing at an average of 36% year-on-
year over the past five-year strategy implementation period, and constituting 52.9% of the total revenue in the year under review.
BUSINESS MODEL EVOLUTION
When the CDC was established in 1999, its key role was the developer, operator of the Coega IDZ as well as investment attraction. In other words, the focus was on leasing the developed industrial land in the IDZ for commercial gain to create jobs and stimulate economic growth. Over time, with changes in the environment, especially the declining grant funding from the shareholder and a maturing organisation, the CDC has had to evolve.
As a result, investors and clients in general are now offered a suite of innovative products and services (including a range of project management competencies and services) in-house, which improves turnaround times and fast track the delivery of infrastructure.
Some of the external consulting business clients who have immensely taken advantage of CDC’s innovative products and services and derived value in doing so includes, amongst others, Eastern Cape and KwaZulu-Natal DoE, EC DoH, NDPW, and more recently other government departments located in Gauteng, Mpumalanga and Western Cape.
SMME DEVELOPMENT: SMMEs on site (left to right) - Mthuthuzeli Ngingi of Ngingi Construction, Terence Goliath of TG Projects (Pty) Ltd, Morne Jegels of Construction Solutions and Nkosoxolo Ntisana of Magma Civils installing a R5 million fencing project in the Coega IDZ.
BUSINESS MODEL – HOW CDC CREATES VALUE
COEGA DEVELOPMENT CORPORATION
Infrastructure Development Services
Project Management ServicesCommercial Services
Coega Human Capital Solutions
Facilities Management Services
Coega Strategic Solutions (Business Consulting)
Coega Telecoms
Coega Corporate Travel
Coega Vulindlela Accommodation & Conference Centre
INVESTMENT PROMOTION
PRODUCT DIVERSIFICATION
CUSTOMER DIVERSIFICATION
DIVERSIFIED BUSINESS:PROJECT
MANAGEMENT
2005 - 2010: REVENUE GROWTH
2010 - 2015: DIVERSIFICATION STRATEGY
2015 - 2020: SUSTAINABLE GROWTH STRATEGY
IDZ
NMB Logistics Park
Litho SukaChair: Select Committee on Economic & Business Development, NCOP
“Coega has enormous potential to further broaden the economy of Nelson Mandela Bay and the Eastern Cape. Investor interest and investment in the Coega IDz is commendable.”
C O E G A D E V E L O P M E N T C O R P O R A T I O N I N T E G R A T E D R E P O R T 2 0 1 6 / 1 7
SECT
ION
04
SECT
ION
03
THIS
IS C
OEG
AAD
MIN
ISTR
ATIO
NPE
RFO
RM
ANCE
INFO
RM
ATIO
N

20 21C O E G A D E V E L O P M E N T C O R P O R A T I O N I N T E G R A T E D R E P O R T 2 0 1 6 / 1 7
ORGANISATIONAL OVERVIEw – wHO wE ARE, wHAT wE DO
During the past five financial years, the CDC undertook organisational restructuring to streamline its operations to meet growing internal and external demands. The result is the diversification of the CDC’s business and the allocation of human resources to further capacitate the organisation through Programme Directors for the infrastructure development business of the organisation in the following areas:
• SEZ Investment Services• Central Support Services• External Services.
These divisions and the new organisational structure are further outlined in the organogram below.
40 investors operational in the IDz
SECT
ION
04
SECT
ION
03
THIS
IS C
OEG
AAD
MIN
ISTR
ATIO
N
C O E G A D E V E L O P M E N T C O R P O R A T I O N I N T E G R A T E D R E P O R T 2 0 1 6 / 1 7ORGANISATIONAL OVERVIEW & BUSINESS MODEL
CHIEF EXECUTIVE OFFICER
MR PEPI SILINGA
INTERNAL AUDIT
MS LUMkA PANI
CENTRAL SUPPORT
SERVICES
SEZ INVESTMENT
SERVICES
INVESTMENT PROMOTIONS
(BUSINESS DEVELOPMENT):
MR CHRISTOPHER MASHIGO
IDz INFRASTRUCTURE
PROGRAMME:
MS MARIA VAN ZYL
BUSINESS DEVELOPMENT
EXTERNAL PROJECTS:
MR CHUMA MBANDE
CORPORATE SERVICES:
MR BONGINKOSI MTHEMBU
kzN PROGRAMME:
MS NOLUNDI KETI
NATIONAL DPw PROGRAMME:
MR THEMBA KOZA
OPERATIONS:
MR DAVID LEFUTSO (Acting)
ICT, RESEARCH AND STRATEGY:
MR MONDE MAWASHA
CENTRE OF EXCELLENCE:
MR RICCARDO TEMMERS (Acting)
PROVINCIAL TREASURY
INFRASTRUCTURE PROGRAMME:
MR ZUKO MQHATU
DEPARTMENT OF EDUCATION DEPT OF SPORT, RECREATION, ARTS AND CULTURE PROGRAMME:MS THEMBEKA POSWA
wILD COAST SEz PROGRAMME:
MR THANDO GWINTSA
DEPARTMENT OF HEALTH FACILITIES MANAGEMENT PROGRAMME:MR ROBERT MAGOTSI
DEPARTMENT OF HEALTH
INFRASTRUCTURE PROGRAMME:
MR HENNIE VAN DER KOLF
DEPARTMENT OF EDUCATION
MAINTENANCE PROGRAMME:
MR FEZILE NDEMA
EXTERNAL SERVICES
COST ENGINEERING UNIT:
MR HENNIE VAN DER KOLF
FINANCE:
MR LIONEL BILLINGS
SHARED SERVICES UNIT:
DR SIYABONGA SIMAYI
PER
FOR
MAN
CE IN
FOR
MAT
ION

22 23C O E G A D E V E L O P M E N T C O R P O R A T I O N I N T E G R A T E D R E P O R T 2 0 1 6 / 1 7
INDIA & SE ASIA
ServicesMetals AutomotiveChemicalsEnergy
EU
PetrochemicalsMetalsEnergy
EU
AutomotiveAgro-processingChemicalsMetals Energy
EU
ServicesAutomotiveMetalsEnergy
EU
ServicesAutomotiveMetalsEnergy
SADC
Export-orientedManufacturingServicesHeavy Industry
LogisticsAgro-processingChemicals & Allied Industries
AUSTRALASIA
AutomotiveGeneral ManufacturingCapitalEquipment
RNRF
USA/ CANADA/ MEXICO
AutomotiveServices ChemicalsMetals
FAR EAST
ElectrotechnicalAutomotiveMetalsEquipment & Machinery
The CDC creates value for investors, clients and stakeholders through its provision of a competitive investment location supported by value-added business services, resulting in the organisation achieving its mission to act as an enabler of sustainable socio-economic development. This is evidenced by major trans-national companies from the majority of the world’s leading industrial nations that have invested in the IDZ.
Currently, the Coega IDZ contributes an estimated 0,23% to the provincial gross geographic product (GGP), a figure which is expected to increase in the short term as the organisation gains traction within the IDZ, and more investments and projects are attracted to the province as a whole. The CDC’s objective is to contribute 0,5% to the Eastern Cape GGP.
Trade map of South Africa with SADC, the rest of Africa and the world.
South Africa with SADC, the rest of Africa and the world’s imports & exports statistics.
GLOBAL COMPETITIVENESS
SOUTH AFRICA
Population (2016):55,91 million
GDP (2016):US$ 294,13 billion
BRAZIL
Population (2016):206,1 million
GDP (2016):US$ 1,798 trillion
Export (2015):US$ 223,87 billion
Import (2015):US$ 243,94 billion
REST OF AFRICA
Population (2016):1,16 billion
GDP (2015):US$ 1,953 trillion
Export (2015):US$ 397,92 billion
Import (2015):US$ 597,92 billion
SADC
Population (2016):329,45 million
GDP (2015):US$ 627,89 billion
Export (2015):US$ 198,51 billion
Import (2015):US$ 224,4 billion
RUSSIA
Population (2016):143,44 million
GDP (2016):US$ 1,28 trillion
Export (2015):US$ 393,26 billion
Import (2015):US$ 281,36 billion
INDIAPopulation (2016):1,309 billion
GDP (2016):US$ 2,256 trillion
Export (2015):US$ 428,0 billion
Import (2015):US$ 532,56 billion
CHINA
Population (2016):1,382 billion
GDP (2016):US$ 11,218 trillion
Export (2015):US$ 2,429 trillion
Import (2015):US$ 2,044 trillion
5 x 132 kv main substations
SECT
ION
04
SECT
ION
03
THIS
IS C
OEG
AAD
MIN
ISTR
ATIO
N
DIGITAL LOGISTICS
SHIFTING YOUR WORLD
PER
FOR
MAN
CE IN
FOR
MAT
ION
PE COLD STORAGE (PTY) LTD

24 25C O E G A D E V E L O P M E N T C O R P O R A T I O N I N T E G R A T E D R E P O R T 2 0 1 6 / 1 7
WORLD
AREA PROFILE
ZONE 2
Automotive Cluster – FAW, CFR/Zackpack Logistics, REDISA
ZONE 1N
Commercial Cluster – Coega Business Centre
ZONE 1S
Logistics Cluster – Digistics, Famous Brands, APM Terminals, PE Cold Storage, General Motors South Africa, ID Logistics, Vector Logistics, DSV, BAIC Group
ZONE 3
General Industries Cluster – Afrox, Air Products, Dynamic Commodities, Coega Dairy, Coega Cheese, DCD Wind Tower, River Edge, NTIP
ZONE 12
Advanced Manufacturing Cluster
ZONE 13
Energy Cluster – DEDISA Substation and Peaking Plant, Himoinsa, Enel Green Power
ZONE 4
Training & Academic Cluster – Human Capital Solutions, Skills Development Centre, BPO Park: Discovery, SBFS, WNS
ZONE 5
Metallurgical Cluster – Bosun Brick
ZONE 7
Chemicals Cluster – Cerebos
ZONE 6
Ferrous Metals Cluster – Agni Steels SA, Electrawinds
ZONE 8
Port Area
ZONE 9
Materials Handling Cluster
ZONE 10
Mariculture & Aquaculture Cluster
ZONE 11
Petrochemical Cluster
ZONE 14
Advanced Manufacturing: Aeronautical and Aerospace Cluster
NMBLP
Nelson Mandela Bay Logistics Park – MSC, Grupo Antolin, Benteler, Inergy, Rehau, Faurecia, Hella, ITPSA, Q-Plas, UDDI
SOUTH AFRICAEASTERN CAPE
NELSON MANDELA BAY LOGISTICS PARk
12
11
6
13
14
7
9
8
1n
35
10
4
1s
2
COEGA IDz CLUSTER zONES
COEGA IDZRevenue R541,8 million
SECT
ION
04
SECT
ION
03
THIS
IS C
OEG
AAD
MIN
ISTR
ATIO
N
C O E G A D E V E L O P M E N T C O R P O R A T I O N I N T E G R A T E D R E P O R T 2 0 1 6 / 1 7
PER
FOR
MAN
CE IN
FOR
MAT
ION

26 27C O E G A D E V E L O P M E N T C O R P O R A T I O N I N T E G R A T E D R E P O R T 2 0 1 6 / 1 7
MinisterDr Rob Davies
COEGA: A beacon of hope empowering growth and development.
PHOTO: Reuters
REPUBLIC OF SOUTH AFRICAMEC of DEDEATMr Sakhumzi Somyo
OWNERSHIP & CONTROL
The CDC is a government-owned entity mandated to develop and operate the 11 500 ha Coega IDZ, adjacent to the deep-water Port of Ngqura, which is owned by the Transnet National Ports Authority (TNPA). The Department of Trade and Industry (dti) is the primary shareholder and executive authority, with all the ordinary shares transferred from the Eastern Cape Development Corporation to the Eastern Cape Department of Economic Development, Environmental Affairs and Tourism, with effect from 20 April 2017.
The dti has promulgated a new legislation, which has already begun to significantly change the current IDZs in terms of ownership and control, amongst others. The Special Economic Zones Act, Act No 16 of 2014 came into operation on 9 February 2016, having been signed into law in May 2014. However, as required by the Act, the redesignation of the IDZs into special economic zones (SEZs) is expected to be Gazetted in the middle of 2017. The legislation aims to boost private investment (domestic and foreign) in labour-intensive areas in order to stimulate job creation, competitiveness, skills and technology transfer as well as increasing exports of beneficiated products through the establishment of SEZs. SEZs are geographically designated areas of the country, attracting targeted economic activities which are supported and incentivised through a range of measures, including tax incentives.
The SEZ legislation builds on the Industrial Development Zone (IDZ) dispensation and provides for the existing IDZs at Richards Bay, Coega, East London, OR Tambo and Saldanha Bay to be transitioned into SEZs. In addition, additional SEZs have been identified across all provinces.
1 138 street lights
SECT
ION
04
SECT
ION
03
THIS
IS C
OEG
AAD
MIN
ISTR
ATIO
NPE
RFO
RM
ANCE
INFO
RM
ATIO
N
“when a man has done what he considers to be his duty to his people and his country, he can rest in peace. I believe I havemade that effort and that is,
therefore, why I will sleep for the eternity. ”
Nelson Mandela, 1918–2013
Nelson Mandela
“what counts in life is not the mere fact that we have lived. It is what difference we have made to the lives of others
that determine the significance of the life we lead.”

28 29C O E G A D E V E L O P M E N T C O R P O R A T I O N I N T E G R A T E D R E P O R T 2 0 1 6 / 1 7
STAkEHOLDERS
Stakeholders are all those individuals, groups or institutions which affect or influence – or are affected by or impacted upon – the CDC’s operations, services, products or performance. As an agent of socio-economic transformation and development, the CDC relies on a complex network of stakeholders for its success in achieving its mission and strategic goals. At the same time, the organisation takes comprehensive measures to maintain consistent mindfulness of its impact on stakeholders – in terms of job creation, skills development, economic empowerment and improved quality of life – manifested through its activities in investment promotion, infrastructure projects and community development.
The organisation views positive stakeholder relationships as being founded on acknowledgement of mutual needs and interests, and strives to maintain open, two-way communication and effective strategic relationship management.
The CDC believes that successful stakeholder management requires a commitment to actively engage with stakeholders, listen to them, build a relationship with them and then respond to their concerns in a mutually beneficial way. Engagement is not an end in itself, but means to help build better relationships with the societies in which we operate, ultimately resulting in improved business planning and performance.
Objectives of CDC’s Stakeholder Relations Strategy
The following main objectives were met during the year under review:
• Created a coherent guiding principles that outlines and defines the route towards better stakeholder engagement.
• Established a strategy and plan that adequately acknowledges the role, influence and impact of stakeholders.
• Identified and engaged all stakeholders in order to meet and where possible exceed their expectations.
• Contributed to sustainable business growth and sustainable development of the CDC.
• Lobbied and communicated with key decision-makers and stakeholders to facilitate buy-in and support for the CDC’s activities.
• Kept decision-makers, role-players and stakeholders constantly informed of CDC’s projects development.
• Measured the impact of stakeholder activities through stakeholder satisfaction surveys.
• Established a favourable environment and conditions for successful implementation of the overarching goals of the CDC.
• Ensured high quality, simple and targeted communication was maintained for all users.
• We endeavoured to deliver the right information, to the right people, at the right time.
• Implemented a pro-active communication strategy as well as effectively responded to enquiries within agreed time-frames.
• Provided a central point of contact for all inquiries regarding CDC projects for information purposes.
• Involved all stakeholders in the communication process in order to build maximum trust and cooperation.
Key Stakeholder Communication Principles
The following communication principles were adhered to during stakeholder engagements in the year under review:
• Open and HonestOpen and honest communications will ensure that all stakeholders share a single consistent message and that rumours and speculation are kept to a minimum. In addition, the reputation and credibility of all parties will be protected.
• Face to FaceChanges that directly impact a particular group of stakeholders should be communicated face-to-face. This gives the stakeholders the opportunity to provide immediate feedback. Listening to stakeholders is an important communication skill.
• Clear, Concise and ConsistentIt is important to ensure that there is no confusion or misunderstanding of the messages received. Information shared must focus on facts and not on emotions or personalities.
• TimelyAs it happens, when it happens. Information should be provided as soon as it becomes available. Reducing delays to a minimum will decrease the risk of uncertainty, rumours and unauthorised leaks. We will tell employees what we know when we know it; we will tell them what we don’t know and when we expect to know it.
• FrequentStakeholders must be kept involved in the process by regularly engaging them through various communication channels.
• Use Established Communication ChannelsTried and tested communication channels should be used to avoid the risk of ineffective message transfer through unfamiliar media. Social media should not be utilised to disseminate important stakeholder information unless the message is generic and targeted to a large audience throughout the Province or South Africa.
STAkEHOLDER RELATIONS APPROACH
During the year under review, the CDC’s Stakeholder Relations Strategy, based on the instrumental value model, was implemented. As a result, the relationships CDC developed with its stakeholders, i.e. shareholders, employees, investors, communities, organised businesses, SMMEs and other stakeholders, has had a significant positive impact on the financial performance of the organisation as reported in this Integrated Report. Furthermore, despite some challenges identified during the year especially involving small businesses seeking business opportunities from the CDC, stakeholder engagement remained effective. Engagements were based on transparent and effective communication with stakeholders as this is essential for building and maintaining their trust and confidence. Complete, timely, relevant, accurate, honest and accessible information was provided by the CDC to its stakeholders whilst having regard to legal and strategic considerations.
Local Users
CDC Stakeholders
Regular Users
Other
Potential Users
Public Departments and Metros Land Owners
Regular Users
Neighbours
Economic Interest Wider Catchment User
Professional Interest
Civil Society Organisations
Other Businesses
Local Users
Potential Users
Industrial Development Related
Current Investors, CDC Staff
Local Community (Public)
Potential Investors, Potential Employees
Trade Unions, Political Organisations
Vulindlela Accommodation & Conference Centre, Business Solutions, Human Capital Solutions, Telecoms, Corporate Travel
NMBM, Despatch, Uitenhage, Sundays River
Special Residential School
Political Organisations (dti, DEDEA), Trade Unions
DSRAC, DoE, NMBM, DoH, DSD, DRDLR NMBM
Potential Investors, Day Visitors
CDC STAkEHOLDER MAP
STAKEHOLDERS
B-BBEE Level 3 certification
SECT
ION
04
SECT
ION
03
THIS
IS C
OEG
AAD
MIN
ISTR
ATIO
N
C O E G A D E V E L O P M E N T C O R P O R A T I O N I N T E G R A T E D R E P O R T 2 0 1 6 / 1 7
PER
FOR
MAN
CE IN
FOR
MAT
ION
Stakeholder Relationships
Firm Financial Performance
Firm Stategy

30 31C O E G A D E V E L O P M E N T C O R P O R A T I O N I N T E G R A T E D R E P O R T 2 0 1 6 / 1 7
In addition, the CDC’s approach to stakeholder engagement is based on a recognised framework designed to assist the organisations select the appropriate level of participation required for different stakeholder groups. There is a range of flexible approaches and tools depending on the goals, time-frames and resources available and the interest of other parties. It recognises that different projects can require different approaches and that stakeholder needs can change overtime. Given the stakeholder phases as identified, CDC engages with its stakeholders taking into account the following:
Inform Consult Involve Collaborate empower
stakeholderengagement Goals
To provide balanced, objective, accurate and consistent information to assist stakeholders to understand the problem, alternatives, opportunities and/or solutions.
To obtain feedback from stakeholders on analysis, alternatives and/or outcomes
To work directly with stakeholders throughout the process to ensure that their concerns and needs are understood and considered.
To partner with stakeholders in developing where necessary alternatives and the identification of positive solutions.
To place final decision-making in the hands of the stakeholder. Stakeholders are enabled/equipped to actively contribute to the achievement of outcomes.
promise tostakeholders
The CDC’s information on projects would be relevant, current, and address stakeholder expectations.
Keep stakeholders informed, listen to and acknowledge concerns and aspirations, and provide feedback on how stakeholder input influenced the outcome.
Involve/ work with stakeholders to ensure concerns and aspirations are directly reflected in the alternatives developed and provide feedback on how stakeholder input influenced the outcome.
Look to stakeholders for advice and innovation in formulating solutions and incorporate stakeholder advice and recommendations into the outcomes to the maximum extent possible.
Stakeholder activities would deliver high impact to address triple challenge of unemployment, inequality and poverty.
methods ofengagement
Fact sheetsOpen days/ roadshows/ ForumsNewsletters Information packs MediaExternal WebsitesSocial Media toolsAnd in collaboration with other agencies where feasible.
Public commentsFocus groupsSurveysPublic meetingsIntranetSocial Media tools
WorkshopsForumsSocial Media tools
Reference groupsFacilitated consensus building forums for deliberations and decision-making.Experimental projects
Dialogue SessionsJoint planning forumsCompetitionsShared projectsCapacity building
Government Business Communities internal
Department of Trade and Industry Current Investors Communities impacted
by CDC’s programmes CDC Employees
Parliamentary portfolio committees on Trade and Industry & Economic Development
Potential Investors Community Forums and Associations
CDC Executive Management
National Treasury, EC Provincial Treasury, Auditor-General, and SCOPA
Civil Societies and Non-Governmental Organisations (NGOs)
CDC Board of Directors
EC Provincial Government, which includes the office of the Premier and other provincial departments such as DEDEAT
Media, Influencers and Thought Leaders
CDC Operational and Projects Management Structures
Nelson Mandela Bay Municipality
Education and Training Institutions including Research Institutes
Political Parties and Local Ward Councillors
Key infrastructure project government stakeholders - EC DRPW, KZN & EC DoE, DSRAC, NDPW, Cogta, DSD, EC DoH, DRDLR, others
Organised Businesses (NAFCOC, BMF, etc), SMME Forums, Local Business Agencies, Business Associations and Business Chambers, such as NMB Business Chamber
Youth Organisations in the NMBM and throughout the EC Province
Service Providers (IDZ)
Various Oversight Committees of government Service Providers (PMS)
Stakeholder Engagement Methodology
Specific Stakeholders Key to the CDC
40 km of sewer lines, 5 pump stations
SECT
ION
04
SECT
ION
03
THIS
IS C
OEG
AAD
MIN
ISTR
ATIO
NPE
RFO
RM
ANCE
INFO
RM
ATIO
N
The People’s Republic of China’s Vice President, Dr LI Yuanchao, during his State visit to South Africa and the Coega IDZ said, “I’ve been to many developing countries and industrial development zones in the world, the Coega IDZ is by far the best of them all.” These sentiments were echoed by the DEDEAT MEC Somyo, who said “The Coega IDZ is the best performing and has done very well to win national awards in South Africa, we are very proud of this institution.”
In December 2016, the DG of the dti, Mr Lionel October highlighted his support and was pleased with the CDC’s progress and achievements as an IDz when he said “Coega is a flagship
programme we are very proud of. It’s effectively the best functioning and most successful IDz in the country and also has
world class management and corporate governance systems.”
In March 2017, the Tunisian Ambassador on her visit to the CDC further expressed support for the Coega IDz. “Our
objective is to learn and have a sense of appreciation of all opportunities which relate to the Coega IDz,” said HE Ms N
Dridi Ambassador Extraordinary and Plenipotentiary.
Lionel OctoberDirector General of the dti
N DridiAmbassador Extraordinary and Plenipotentiary

32 33C O E G A D E V E L O P M E N T C O R P O R A T I O N I N T E G R A T E D R E P O R T 2 0 1 6 / 1 7
MATERIAL ISSUES RISkS & OPPORTUNITIES
The risk management processes in the CDC are guided by:
• ISO 31000 Guidelines;• National Treasury Framework; and• The CDC’s Policy Framework.
Risk management is central to the CDC’s management processes. It is essential for the achievement of the organisation’s objectives. Effective implementation of risk management is a critical characteristic of an efficient/ focused business enterprise, imposed by the PFMA and Treasury Regulations.
CDC classifies risks into the following broad categories:
• Strategic risks: These directly impact on the ability of the CDC to deliver on its mandate;
• Operational risks: These include financial, legal and compliance risks. They affect the systems, people and processes through which the CDC operates;
• Systematic risks: These originate from macro-economic and national challenges affecting the National
System Innovation and National and Provincial Government Business Enterprise space in which the CDC operates.
Once risks and opportunities have been identified and the likelihood and consequences of them occurring have been evaluated, appropriate policies and procedures are put in place to manage them, proportionate to the risk or opportunity involved.
The Board of Directors of the CDC assumes ultimate responsibility for the governance of risk by setting the direction and oversight on how risk should be managed and addressed in the organisation.
Similarly, the process of identifying strategic top 10 risks is carried out by the CDC’s Executive Management Committee and thereafter approved by the Board.
Monitoring reports of the top 10 risks are prepared and updated on a regular basis for the CDC’s Executive Management Committee, the Audit and Risk Committee and the Board of Directors.
No.ORGANISATIONAL OBJECTIVES
CATEGORy RISK MITIGATION
1 Financial Sustainability and Growth Financial Failure to obtain sustainability
and growth in the CDC
Secure additional contracts for External Programmes (draw up an annual plan with time frames for Business Development for External Programmes)
2 Attain Diversification of customers/ and products
Customer and stakeholder
Inability to grow and maintain clientele (Tenant attrition due to failure to deliver on CDC value proposition)
Monitor delivery on contracts between the CDC and IDZ tenants
3 Promote SMME Development Developmental Inadequate SMME development support
Implement the undertakings made to SMMEs
4
Improve Customer Satisfaction Index – Promote Excellence in the delivery of projects at the CDC
Customer and Stakeholder- Internal Processes
Inability to complete projects allocated to the CDC
Implement the recommendations that came from the review of the programmes model
5 Achieve Independence from Government funding Financial Audit qualification
Conduct Skills and Capacity analysis - and respond to the gaps
6 Attain Diversification of customers and products
Customer and Stakeholder
Inability to secure investors (Depressed world economic condition leading to limited investment in the IDZ)
Develop a process for early identification of constraints on the finance ability of investment projects
7 Attain Diversification of customers and products
Customer and Stakeholder
Loss/ Gain of Stakeholder Confidence
Build relationship capital across the key spheres of business and government
8 Attain Diversification of customers and products
Customer and Stakeholder
Inability to grow and maintain clientele (Procurement-related project failures and litigations)
Prepare lessons learnt from previous challenges experienced i.e. CDC/388 and present this to EXMA, to enhance the creation of a functioning control environment
9 Attain Diversification of customers and products
Customer and Stakeholder
Inability to secure investors (Inability to fully commit interested investors) due to:(a) Financial Closure(b) Lack and finalisation of
Incentives(c) Environmental and(d) Infrastructure stability e.g.
electricity
Design criteria to identify and remove/manage barriers to projects, relevant stakeholders and solutions
10 Attain Diversification of customers and products
Customer and Stakeholder
Loss of competitive edge due to CDC information being accessible to competitors
(a) Knowledge Creation Roles in the CDC identified
(b) KM Portal Implemented
TOP 10 RISkS AND CATEGORIES
BIG DEAL: Coega IDZ CEO, Pepi Silinga and Dong Haiyang, president and CEO of the BAIC Group, seal a deal for the R11 billion investment on the car manufacturing plant at the Coega IDZ, in Zone 1.
Bafedile RamatlhapeDIRCO
“The growth potential of any investor in Coega is phenomenal. The opportunities are endless in terms of what we’ll take to the outside world, such as manufacturing, back office processing, agro processing, science and technology and in research.”
SECT
ION
04
SECT
ION
03
THIS
IS C
OEG
AAD
MIN
ISTR
ATIO
NPE
RFO
RM
ANCE
INFO
RM
ATIO
N

34 35C O E G A D E V E L O P M E N T C O R P O R A T I O N I N T E G R A T E D R E P O R T 2 0 1 6 / 1 7
GOVERNANCE
CORPORATE GOVERNANCE STATEMENT
A governance system that is beyond reproach is one of the commitments that the CDC has made to its investors. As such, the CDC complies both with the legislation that is applicable to it as well as aligning itself to non-binding rules, codes and standards such as the King report and governance protocol.
It is through ethical, effective corporate governance that public entities are controlled, managed and held to account. Corporate governance defines the distribution of rights and responsibilities among all the stakeholders and determines the rules and procedures for decision making. Most importantly, it defines where accountability lies.
In addition to legislative requirements based upon the CDC’s enabling legislation and the Companies Act of 2008, corporate governance is applied through the precepts of the Public Finance Management Act of 1999 (PFMA), Treasury Regulations and in accordance with the principles contained in the King III Report on Corporate Governance and the Protocol on Corporate Governance, 2002.
Company Secretary and Professional Advice
All directors have access to the service of the Company Secretary, who is responsible for ensuring that Board procedures are followed. All directors are entitled to seek independent professional advice about the affairs of the Company and the Company’s expense.
Report of the Audit & Risk Committee
The Audit and Risk Committee (ARC) has adopted formal terms of reference, which have been approved by the Board. In meeting its responsibilities as set out in the terms of reference, the ARC has reviewed the following:
• The functionality of the Risk Management internal control system
• The functioning of the internal audit department• The risk areas of the entity’s operations to be covered in
the scope of the internal and external audits• Financial information provided by management• The accounting or auditing concerns identified as a result
of the internal or external audits
• The entity’s compliance with legal and regulatory provisions
• The credibility, independence and objectivity of the external auditors as well as their audit reports.
The ARC is satisfied that internal controls and systems have been put in place and that these controls have generally functioned effectively during the period under review.
The ARC has evaluated the annual financial statements of the Coega Development Corporation Proprietary Limited for the year ended 31 March 2017 and has concluded that they comply, in all material respects, with the requirements of the Companies Act (Act 61 of 1973, as amended) and International Financial Reporting Standards (IFRS).
The ARC has:
• Reviewed the credibility, independence and objectivity of the external auditors
• Reviewed significant adjustments resulting from the audit• Reviewed the external audit report and audit opinion• Met with the external auditors to ensure that there are no
unresolved issues.
The ARC agrees that the adoption of the going concern premise is appropriate in preparing the annual financial statements.
The ARC has therefore recommended the adoption of the annual financial statements by the Board of Directors.
Ayanda MjekulaChairperson: Audit and Risk Committee
RESPECTED EXPERT: Ayanda Mjekula, chairperson of the Audit & Risk Committee.
41 km of roads
SECT
ION
04
SECT
ION
03
THIS
IS C
OEG
AAD
MIN
ISTR
ATIO
NPE
RFO
RM
ANCE
INFO
RM
ATIO
N

36 37C O E G A D E V E L O P M E N T C O R P O R A T I O N I N T E G R A T E D R E P O R T 2 0 1 6 / 1 7
GOVERNANCE STRUCTURE
Robust and effective governance is the cornerstone of the CDC’s continued success in value creation – providing both investors and stakeholders with the assurance of stability and sustainability.
The CDC Board provides the organisation’s vision and strategic direction, playing an active role in defining and monitoring the organisation’s annual performance objectives and targets, which map the road towards achievement of the five-year strategy. The Board meets quarterly to review progress against performance objectives and to consider material issues in the context of the external environment and adjust course where necessary.
The diversity of backgrounds, networks and experience of the Board members ensures a well-rounded collective with significant insight into business and industry, economic affairs, politics and government, infrastructure development, finance, investment and sustainability. Members bring an appropriate mix of the range of specialist expertise required to guide the organisation in its diverse activities, and the Board benefits from the insight and institutional knowledge of its long-standing founder members.
Board members are carefully selected not only for their specialist expertise and knowledge, but their in-depth understanding of the socio-economic development challenges of the Eastern Cape and South Africa, and the complexity of managing mega-projects such as the Coega IDZ as a mechanism for responding to those challenges.
These qualities of the Board – specialist skills and knowledge, diversity of experience and networks, in-depth understanding of the organisation and its external environment – play a vital role in the organisation’s ability to deliver value creation to its diverse stakeholders.
In addition, a strongly integrated and transparent governance system in line with best practice supports the work of the Board, with the Company Secretary as interface between the Board and the organisation, ensuring consistent application throughout all levels of the business and enabling the CDC to maintain its position as a leader in accountable corporate governance.
The three committees of the Board – Audit and Risk (ARC), Human Resources and Remuneration (HRRC) and Social and Ethics Committee (SEC) – meet bi-monthly to consider specific material, strategic and social issues pertinent to their terms of reference, which have been formalised and approved by the Board. Their smaller size and more frequent meetings enable key issues to be swiftly addressed.
The CEO and Executive Management Committee (EXMA) are responsible for overseeing the operational execution of the corporate strategy and implementing decisions of the Board. Day-to-day operational responsibilities are delegated by the CEO to the Executive Managers, and the CEO regularly reports to and engages with the Board and Board Committees, ensuring a free and transparent flow of information to support informed and integrated decision-making at all levels.
NMBLP: 216 ha logistics park for the automotive industry
ATTENDANCE SCHEDULE OF BOARD & SUB-COMMITTEE MEETINGS
2016/17 FY BOARD MEETING ATTENDANCE SCHEDULE
MEMBERS MEETING 27 JUL 2016
MEETING 29 SEP 2016
MEETING 7 DEC 2016
MEETING 23 FEB 2017
Dr P Jourdan � � � �
Mr J de Bruyn � � � �
Mr S Zikode Apology � � Apology
Mr S Liebenberg Apology � � �
Mr P Silinga � � � �
Mr P Ndoni � � Apology Apology
Adv T Norman SC � Apology � Apology
Cllr B Lobishe � � � �
Mr S Khan Apology � � �
2016/17 FY Audit & Risk Committee AtteNdANCe sCHeduLe
memBeRs meetiNG 25 JuL 2016
meetiNG 15 seP 2016
meetiNG 7 deC 2016
meetiNG 16 FeB 2017
Mr A Mjekula � � � �
Mr J de Bruyn � � � �
Mr S Liebenberg � � Apology �
Mr T Zakuza � � � Apology
Ms N Qangule � � � �
2016/17 FY HUMAN RESOURCES & REMUNERATION COMMITTEE ATTENDANCE SCHEDULE
MEMBERS MEETING 26 MAY 2016
MEETING 15 SEp 2016
MEETING 7 DEC 2016
MEETING 22 FEB 2017
Mr J de Bruyn � � � �
Dr P Jourdan � � � �
Adv T Norman SC Apology � � �
2016/17 FY SOCIAL AND ETHICS COMMITTEE ATTENDANCE SCHEDULE
MEMBERS MEETING 15 SEp 2016
MEETING 7 DEC 2016
Mr J de Bruyn � �
Dr P Jourdan � �
Adv T Norman SC � �
SECT
ION
04
SECT
ION
03
THIS
IS C
OEG
AAD
MIN
ISTR
ATIO
NPE
RFO
RM
ANCE
INFO
RM
ATIO
N

38 39C O E G A D E V E L O P M E N T C O R P O R A T I O N I N T E G R A T E D R E P O R T 2 0 1 6 / 1 7
Appointed: 1999
Dr Paul Jourdan is an independent consultant on resource-based development strategies, working across several African states as well as for SADC, the AU and UNECA. As Deputy Director-General in charge of Special Projects at the dti, Jourdan was responsible for the establishment of the IDZ programme, with the Coega IDZ and CDC as pioneer projects. Later, as CEO of Mintek, he contributed to minerals beneficiation growth strategies, including the planning of the metallurgical cluster at Coega.
Dr Jourdan holds a BSc in Geology and a BA in African Government from UCT; a Postgraduate Diploma in Exploration Geophysics from ITC (International Institute for Aerospace Survey and Earth Sciences) in Delft; an MSc in Mineral Economics from Wits University; and a PhD in Politics from Leeds University.
Appointed: 1999
Jan de Bruyn was Chair of the Manufacturing Development Board of the dti since inception in 1993 until it closed down in 2017.
De Bruyn has served on, and in many cases chaired, the boards of leading South African corporates, including Algorax, Gencor, Hulett Aluminium and Saldanha Steel, as well as the Small Business Development Corporation (now Business Partners), the Council of the Technicon Witwatersrand (now part of the University of Johannesburg and the executive of the Afrikaans Handelsinstituut (AHI). He is also a trustee of the Asbesrus Relief Trust.
Appointed: 1999
Mninawe (Pepi) Silinga is the founding CEO of the CDC, appointed on the establishment of CDC in 1999.
Silinga is a professionally registered Civil Engineer (Pr. Eng), Project Manager (PMP), Chartered Director (C.Dir) and a fellow of the South African Academy of Engineers (SAAE). He holds a BSc (Eng) from the University of KwaZulu-Natal, MSc (Eng) (Wits) and an MBA from Heriot-Watt University in the UK, and has participated in management programmes with Unisa (MDP), Stellenbosch (CMP), Oxford and INSEAD (AMP).
Silinga’s distinguished service and outstanding contribution to socio-economic development in the Eastern Cape through bringing the vision for the Coega IDZ to life was recognised in late 2014 with the Prestige Award of the NMMU Council.
Appointed: 2010
Sybert Liebenberg, is a seasoned public sector executive with experience in research, strategy development and operational management. He previously served as acting Head of Department for the Eastern Cape Department of Economic Development, Environmental Affairs and Tourism and as interim Chief Executive Officer of the Eastern Cape Parks and Tourism Agency. He is currently in private practice.
Dr Liebenberg holds BA, BA Hons (Political Science) and Master’s in Public Administration from the University of Stellenbosch, and a DPhil in Development Studies from NMMU.
Appointed: 2007
Pumelele ‘Bicks’ Ndoni has played a leading role in local government since 1996 when he was elected as a councillor on the Uitenhage Transitional Local Council. He served as Mayor of Uitenhage from 1999 to 2000, when the Nelson Mandela Metropole was formed to include Port Elizabeth, Uitenhage and Despatch. He served as Portfolio Councillor for Infrastructure, Engineering and Energy in that structure until 2001 and was appointed the first Deputy Executive Mayor of Nelson Mandela Bay in 2002, serving in that position until 2009.
Ndoni previously worked at Goodyear in Uitenhage and holds a BA degree from Vista University.
JAn dE BrUYndr PAUL JOUrdAn: CHAIrPErSOn
mnInAWE (PEPI) SILInGA: CHIEf EXECUTIVE OffICEr
SYBErT LIEBEnBErG PUmELELE ndOnI
6 697 people trained
BOARD OF DIRECTORS
SECT
ION
04
SECT
ION
03
THIS
IS C
OEG
AAD
MIN
ISTR
ATIO
N
C O E G A D E V E L O P M E N T C O R P O R A T I O N I N T E G R A T E D R E P O R T 2 0 1 6 / 1 7
Appointed: 2007
Sipho Zikode is the Deputy Director General of the Special Economic Zones and Economic Transformation (SEZ & ET) at the South African Department of Trade and Industry (the dti). He joined the dti in 2011.
He has a B.Comm (Economics) degree from the University of the Witwatersrand along with a Post Graduate Diploma in Marketing Management from the University of South Africa, and a National diploma in Chemical Engineering from Mangosuthu Technikon.
He also has an MBA from the University of Pretoria and also awarded a Certificate for Technology Innovation. In 1999 he rose from Deputy Director Defence Portfolio to the position as Chief Director Industrial Participation in 2003 later taking up the DDG position for BPD. In January 2014 to August 2015 he was appointed as the Acting CEO at SEDA and he is currently serving as a board member of the Coega Development Corporation.
SIPHO ZIKOdE
PER
FOR
MAN
CE IN
FOR
MAT
ION

40 41C O E G A D E V E L O P M E N T C O R P O R A T I O N I N T E G R A T E D R E P O R T 2 0 1 6 / 1 7
Appointed: 2014
Advocate Thandi Norman SC was admitted as an advocate in Bhisho in 1992, and to the Bhisho Bar in 1997. She took silk in 2011. She brings valuable expertise to the CDC Board through her preferred areas of practice in shipping, competition, constitutional and administrative law.
She has appeared in the Constitutional Court, the Supreme Court of Appeal, in various High Courts, the Land Claims Court and Labour Court. Adv Norman SC chaired the RTI Commission (February 2013 to March 2014) and acted as evidence leader in the Pillay Commission (2005) and the Goldstone Commission (1995), both in the Eastern Cape. She was also a Presiding Officer at the country’s first democratic elections and has acted as a judge from time to time since June 2002 in the Eastern Cape and KwaZulu-Natal.
Adv Norman SC holds a BJuris LLB degree and a Certificate in Shipping from the Chartered Institute of Shipping.
AdV THAndI nOrmAn SC
Appointed: 2014
Shabeer Khan is the Chief Financial Officer of the dti, leading the Financial Management Services team, responsible for the department’s overall spending and aligning priorities with the necessary funding to ensure the dti achieves its objectives. He is a member of the dti’s Executive Board as well as the Bid, Risk and Ethics committees. He is also a member of the South African Bureau of Standards (SABS) audit committee.
Khan holds a BCom Honours degree and is a registered Chartered Accountant. He joined the dti in 2013, having previously worked for the Auditor-General of South Africa where he was responsible for managing numerous audit portfolios and taking the lead in many United Nations audit assignments.
SHABEEr KHAn
SHARING INFORMATION: Mninawe (Pepi) Silinga has been CEO of the CDC since 1999.
38% SMME procurement
SECT
ION
04
SECT
ION
03
THIS
IS C
OEG
AAD
MIN
ISTR
ATIO
N
Appointed: 2014
Babalwa Lobishe holds the portfolio of Economic Development, Tourism and Agriculture (EDTA) on the mayoral executive committee of the NMBM and is the MMC of the Roads and Transport Portfolio Committee. She is currently doing social facilitation in the construction industry.
She joined the ANC in 1999 and assisted in community mobilisation and development. She was elected as a branch secretary for the South African Student Congress in 2000 and served on the provincial executive of the ANCYL from 2008 to 2010. From 2008 until recently, Lobishe was an ANC regional leader on the Sports and Economic Development desk. She was deployed to the mayoral committee in the Sports, Arts and Culture portfolio in 2011 and moved to EDTA in 2013 and was further deployed to start a new portfolio of Transport in 2015.
Lobishe has a BCom degree from Vista University in Port Elizabeth and is currently studying towards her Master’s in Public Administration at the University of Fort Hare.
BABALWA LOBISHE
PER
FOR
MAN
CE IN
FOR
MAT
ION

42 43C O E G A D E V E L O P M E N T C O R P O R A T I O N I N T E G R A T E D R E P O R T 2 0 1 6 / 1 7
AUDIT & RISK COMMITTEE
Appointed: 2010
A Chartered Accountant (CA(SA)) with extensive board and audit committee experience, Nomfundo Qangule started her career in Nedcor’s Corporate and International Division. She has served as director and chaired the audit committee of Rand Mutual Assurance, and also served as a board member of Afrocentrix Health, Hans Merensky Holdings and Royale Energy.
Qangule was previously executive manager at Worldwide Africa Investment Holdings. She is a Certified Associate of the Institute of Bankers (CAIB, SA), a member of the KwaZulu-Natal Growth Fund Investment Committee, and a director and member of the audit committee of Rebosis Ltd and Nozala Investments.
Appointed: 2010
See Sybert Liebenberg’s profile under Board Member profile.
Appointed: 2007
See Jan de Bruyn’s profile under Board Member profile.
Appointed: 2010
Temba Zakuza is an audit partner at Nkonki Inc. Chartered Accountants and has extensive experience in public sector governance. He was previously the head of the Department of Accounting at the University of Fort Hare; IRBA Board member and chaired the education, training and professional development committee of the Independent Regulatory Board for Auditors (IRBA).
Zakuza chaired the audit and risk committees of the South African Local Government Association (SALGA), and Centlec and currently, Walter Sisulu University and Mbizana Local Municipality.
Zakuza has a BCom degree from the University of Limpopo and postgraduate accounting diplomas from UCT. He qualified as a Chartered Accountant (CA (SA)) in 1999 and as a Certified Internal Auditor in 2000.
Appointed: 2002 (Board); 2010 (ARC)
A widely-respected business leader, Ayanda Mjekula has over 20 years’ experience in the banking sector, having held executive management positions in two of the four major South African commercial banks and served as chairperson of Ubank Limited.
As Chief Executive of the South African Supplier Development Agency (SASDA), Mjekula gained extensive experience in enterprise and supplier development. He has played a prominent role in the energy sector as a past chairman of the Central Energy Fund (CEF) and director of PetroSA.
Mjekula is the chairperson of the National Arts Festival, serves on the Board of Safika Holdings and its audit and remuneration committees, is deputy chair of the Council of the University of Fort Hare and chairs its finance and investment committees.
He is a member of the Institute of Directors of South Africa, and holds a BA degree in English (University of Fort Hare) and an MBA in Financial Accounting from Western Michigan University (USA).
nOmfUndO QAnGULESYBErT LIEBEnBErG TEmBA ZAKUZAJAn dE BrUYn AYAndA mJEKULA: CHAIrmAn
In order to ensure independent oversight of the organisation’s response to material issues via financial controls and risk management, the membership of the ARC is weighted towards independent, external members.
184 km of electrical cable
SECT
ION
04
SECT
ION
03
THIS
IS C
OEG
AAD
MIN
ISTR
ATIO
N
C O E G A D E V E L O P M E N T C O R P O R A T I O N I N T E G R A T E D R E P O R T 2 0 1 6 / 1 7
PER
FOR
MAN
CE IN
FOR
MAT
ION

44 45C O E G A D E V E L O P M E N T C O R P O R A T I O N I N T E G R A T E D R E P O R T 2 0 1 6 / 1 7
Appointed: 2015
See Adv. Thandi Norman SC’s profile under Board Member profile.
Appointed: 2015
See Jan de Bruyn’s profile under Board Member profile.
JAn dE BrUYn
Appointed: 2015
See Dr Paul Jourdan’s profile under Board Member profile.
dr PAUL JOUrdAn
HUMAN RESOURCES & REMUNERATION COMMITTEE
Three non-executive directors make up the Human Resources and Remuneration Committee. The committee makes recommendations to the Board on matters including general staff policy, remuneration, bonuses, Directors’ fees, services contracts and other employee benefits.
The role of the social and ethics committee is to monitor the activities of the CDC, including its subsidiaries, taking into consideration the relevant legislation and any other legal requirements or prevailing codes of best practice.
SOCIAL & ETHICS COMMITTEE
AdV THAndI nOrmAn SC
IDz: 6 443 ha of lettable back of port, industrial space
SECT
ION
04
SECT
ION
03
THIS
IS C
OEG
AAD
MIN
ISTR
ATIO
NPE
RFO
RM
ANCE
INFO
RM
ATIO
N
Appointed: 2000
See Jan de Bruyn’s profile under Board Member profile.
JAn dE BrUYn
Appointed: 2015
See Adv. Thandi Norman SC’s profile under Board Member profile.
AdV THAndI nOrmAn SC
Appointed: 2000
See Dr Paul Jourdan’s profile under Board Member profile.
dr PAUL JOUrdAn

46 47C O E G A D E V E L O P M E N T C O R P O R A T I O N I N T E G R A T E D R E P O R T 2 0 1 6 / 1 7
EXECUTIVE MANAGEMENT (EXMA)
The Executive Management Committee (EXMA) is the CDC’s highest operational decision-making body. Convened by the CEO and with all Executive Managers as members, it is a key structure in ensuring combined assurance and enabling integrated thinking and reporting by the organisation.
With specific authority delegated to it by the CEO in order to facilitate effective, collective decision-making, EXMA considers strategic matters relating to the CDC as a whole, as well as operational matters arising from the various business units, and acts to facilitate coordination of the activities of these business units.
Joined CDC in 2015
Areas of expertise: Finance and supply chain management.
Joined CDC in 1999
Areas of expertise: Engineering, project management, leadership, economics.
Joined CDC in 2003
Areas of expertise: Business development management, strategy, engineering.
mnInAWE (PEPI) SILInGA: CHIEf EXECUTIVE OffICEr
LIOnEL BILLInGS (CHIEf fInAnCIAL OffICEr)
CHrISTOPHEr mASHIGO (BUSInESS dEVELOPmEnT)
Joined CDC in 2010
Areas of expertise: Facilities and operations management, sustainable development.
dAVId LEfUTSO (ACTInG OPErATIOnS)
BOnGInKOSI mTHEmBU (COrPOrATE SErVICES)
Joined CDC in 2015
Areas of expertise: People management, leadership and corporate governance.
Joined CDC in 2003
Areas of expertise: Engineering, management, project management, economics.
mOndE mAWASHA (PrOGrAmmE dIrECTOr: ICT, rESEArCH & STrATEGY, IrS)
Joined CDC in 2003
Areas of expertise: Project management, quantity surveying.
Joined CDC in 2003
Areas of expertise: Engineering, project management, finance.
HEnnIE VAn dEr KOLf (COST EnGInEErInG)
rICCArdO TEmmErS(ACTInG CEnTrE Of EXCELLEnCE)
CHUmA mBAndE (BUSInESS dEVELOPmEnT - EXTErnAL PrOJECTS)
Joined CDC in 2013
Areas of expertise: Programme & project management, strategic project management, engineering: built environment.
PROGRAMME DIRECTORS
Programme Directors are responsible for the CDC’s infrastructure programmes under the External Services Unit, a growing component of the organisation’s business model as it brings its expertise in managing complex and mega infrastructure projects to assist in resolving government’s service delivery challenges. Clients include the Eastern Cape provincial departments of Health; Education; Roads and Public Works; Sports, Recreation, Arts and Culture; Rural Development and Land Reform; and Economic Development, Environmental Affairs and Tourism. Other clients can be found in other provinces, including KwaZulu-Natal Provincial Department of Education and National Department of Public Works.
Programme Director: EC-Department of Education/DSRAC
Programme Director: National Department of Public Works
Programme Director: KZN Programme
THEmBA KOZA
THEmBEKA POSWA
nOLUndI KETI
Programme Director: Department of Health (Infrastructure)
HEnnIE VAn dEr KOLf
rOBErTmAGOTSI
Programme Director: Department of Health (Facilities Management)
fEZILEndEmA
Programme Director: Wild Coast SEZ Programme
Programme Director: Provincial Treasury; Infrastructure Programme
THAndO GWInTSA
dr SIYABOnGA SImAYI
mArIA VAn ZYL
ZUKO mQHATHU
Programme Director: Shared Services Unit
Programme Director: Department of Education Maintenance Programme
Programme Director: IDZ Infrastructure Programme
Producer of power through solar and wind
SECT
ION
04
SECT
ION
03
THIS
IS C
OEG
AAD
MIN
ISTR
ATIO
NPE
RFO
RM
ANCE
INFO
RM
ATIO
N

48 49C O E G A D E V E L O P M E N T C O R P O R A T I O N I N T E G R A T E D R E P O R T 2 0 1 6 / 1 7
MOTHER BRAND
BRAND VALUES & PILLARS
Positioning
Brand Values• Integrity• Innovation• Partnership• Service Excellence• Sustainability
The Coega brand strategy is based on a monolithic brand approach. The mother brand is Coega and pay-off line is Right Place, Right Time, Right Choice. There are three main brands, namely: IDZ, Commercial Services, and Project Management Services (External Programmes). The Coega sub-brands are as follows: NMLP, Vulindlela Accommodation & Conference Centre, Corporate Travel, Human Capital Solutions, Business Solutions, Telecoms, Infrastructure Development, and Facilities Management.
Brand Pillars• Transparent Practices• Customised Solutions• Efficiency through Expertise• Sustainable Socio- Economic Development
Monolithic Brand
Right Place, Right Time, Right Choice
MAIN BRANDSIndustrial Development Zone Commercial Services Project Management Services
SUB-BRANDS
Brand Personality• Progressive• Trustworthy• Intelligent
Infrastructure Development
COEGA BRAND ARCHITECTURE
VisionTo be the leading catalyst for the championing of socio-economic development.
MissionTo provide a competitive investment location, facilitate holistic infrastructure and value-adding commercial business solutions.
14 zones arranged in clusters in accordance with international best practice
SECT
ION
04
SECT
ION
03
THIS
IS C
OEG
AAD
MIN
ISTR
ATIO
N
C O E G A D E V E L O P M E N T C O R P O R A T I O N I N T E G R A T E D R E P O R T 2 0 1 6 / 1 7
PER
FOR
MAN
CE IN
FOR
MAT
ION

50 51C O E G A D E V E L O P M E N T C O R P O R A T I O N I N T E G R A T E D R E P O R T 2 0 1 6 / 1 7
Making a difference through Maths & Science
The Coega Maths & Science Programme is a flagship programme at CDC, which is in line with one of the organisation’s CSI Focus Areas of Education and Skills Development. The CDC established the Coega Maths and Science programme in 2013 as part of its Corporate Social Investment Programme. The programme is available to grade 12 learners in the Eastern Cape, who wish to improve their maths and science results or to those who failed these subjects.
The aim of the programme is to improve the grade 12 results for Mathematics and Physical Science for the learners from the
disadvantaged communities. However, the long term goal of the programme is to improve the aptitude of learners in Maths and Science, and to inspire, support, and encourage these learners to follow a career in the field of engineering, science, and technology. Good results in Maths and Science further enables students to pursue other career streams, such as Accounting, Actuarial and related studies, to name but a few.
In 2016/17, 48 learners were trained and successfully completed the programme.
CORPORATE SOCIAL INVESTMENT (CSI)
In keeping with its vision and in compliance to the King III code on corporate governance and international best practice, the CDC aims to make long term and sustainable investments in communities. Therefore, Coega’s sustainability focus ensures that corporate social investment (CSI) permeates through the organisation in cross-functional areas in job creation such as the internship programme, environmental protection, heritage and culture alignment, training and skills development, business partnerships, enterprise development and engagement with communities.
Coega’s social responsibility programmes focus on skills, training and human development and are designed to fill the shortfalls and needs that have been identified in the Eastern Cape. The sustainability of the CSI programmes are ensured by high impact and long lasting initiatives, rather than just short-term charitable donations.
The decision to equip communities with long term skills rather than focusing on philanthropic giving or short term
donations was taken during the 2016 financial year, and saw a reassessment of the way in which the 4% of CDC profits are disbursed. It was recognised that building skills ultimately stimulates the economic development of the region as a whole, and thus contributes to the core mandate of the CDC.
The investment in communities during the year under review allowed for the expansion of the CSI programme to include scholarships and bursaries, a successful maths and science programme and the driver training programme. The focus on skills development for people with disabilities, as well as the other skills development initiatives, filter though the organisation as a whole. Long term and life changing work opportunities are made available through the successful CDC’s internship programme.
MATHS AND SCIENCE PROGRAMME: The CDC donated maths and science equipment to Grade 12 scholars from Mt Arthur Girls High School at Bangindlala village near Lady Frere.
SOCIAL RESPONSIBILITY
11 500 ha IDz
SECT
ION
04
SECT
ION
03
THIS
IS C
OEG
AAD
MIN
ISTR
ATIO
N
C O E G A D E V E L O P M E N T C O R P O R A T I O N I N T E G R A T E D R E P O R T 2 0 1 6 / 1 7
PER
FOR
MAN
CE IN
FOR
MAT
ION
CSI Programmes
PROJECT AREA PROJECT DESCRIPTIONMaths and Science Programme Bizana Conducts science experiments to schools with no access to
Science Labs. Equips Science Educator with practical Science skills.
Lady FrereMdantsaneUitenhageNMBM Provide Grade 12 learners who either failed Maths and Science
or want to improve their results to gain entrance at universities for Science, Engineering and Technology studies.
Chess Development Programme NMBM Provide financial assistance to Nelson Mandela Bay Chess Union for the development of chess teams in African communities.
Ubuntu Fund After School Programme
NMBM Provide assistance for Science learners in the form of a mobile science lab as described above.
Youth Leadership Development Programme
All 4 HET of the EC and the FET Colleges
An annual academy hosted by the CDC focusing on enhancing leadership qualities identified in tertiary students.
Driver Training Programme Eastern Cape Assist unemployed youth to obtain a driver’s licence by providing driving classes at no cost.
KwaZulu-Natal
Career Guidance Programme NMBM Career Guidance Programme is to make available career information to all NMBM pupils living in the townships and northern areas, to enable them to qualify themselves for a career for which they may have the necessary aptitude/talent; and Job Shadowing Programme for Grade 9 girl learners from township schools.
Crime Awareness Campaigns NMBM Creating Crime Awareness in Primary and High School through testimonies from ex-prisoners.
Disability Affirmation Programme Eastern Cape Training Initiatives, Awareness Campaigns and Job Placements
Social Assistance to Destitute Families Programme
Eastern Cape Back to school campaigns for children from destitute families, basic necessities for families in need.
Women Empowerment Programmes
Lusikisiki and Port Elizabeth Working with groups of women entrepreneurs by equipping them with fundamental business skills.

52 53C O E G A D E V E L O P M E N T C O R P O R A T I O N I N T E G R A T E D R E P O R T 2 0 1 6 / 1 7
COEGA TIMELINE
1997 - 2010 20122011 2013 2014 2015 2016 2017
• A feasibility study established that the Coega Project was viable and well-suited to the establishment of the deep-water port
• The Coega Development Corporation Pty (Ltd) is established
• Coega becomes the first declared South African IDZ
• Dynamic Commodities becomes the first investor to operate in the Coega IDZ
• The CDC signs a long-term lease agreement with the Nelson Mandela Bay Municipality (NMBM) to take over the management of the NMBLP
• CDC portfolio of projects increases to R40 billion within four years of an intensive marketing drive
• Trial operations at Port of Ngqura confirm readiness for operations
• The CDC signs Hella Automotive to the NMBLP
• Coega Dairy (agro-processing) signs a lease agreement to establish a fully-fledged dairy in Zone 3 of the Coega IDZ to the value of R125 million
• Discovery Health signs a lease to establish a R15 million call centre in the Coega IDZ BPO Park
• President Jacob Zuma officially opens the Port of Ngqura
• The Port of Ngqura surpasses the Port Elizabeth Port to become the third busiest container port in South Africa
• Chinese automotive giant, First Automotive Works (FAW) signs a lease agreement to establish a truck assembly plant in Zone 2 of the Coega IDZ with an investment value of R600 million
• DCD signs agreement with CDC to establish a wind tower manufacturing plant in Zone 3 of the Coega IDZ to the value of R300 million
• The CDC signs GDF Suez and the National Tooling Initiative Programme as investors in the Coega IDZ
• The CDC signs 4PL. Com Logistics and Kuehne & Nagel as investors at the NMBLP
• Term sheets are signed with EAB (renewable energy), Tyre Energy Extraction (logistics), OSHO Cement (metals), and Newco Cheese Factory (agro-processing)
• CDC reaches a Broad-Based Black Economic Empowerment (B-BBEE) level 2
• India-SA consortium Agni Steels starts construction of its R400 million steel billet manufacturing plant
• CDC signs industrial gas company Air Products in December for R300 million investment
• AfriSam signs lease for establishment of a cement plant to the value of R634 million
• Famous Brands signs lease agreement for the establishment of a R25 million cold storage distribution unit and partners with neighbouring investor, Coega Dairy, to produce cheese for its fast food outlets across the Eastern Cape
• A total of eight investors are signed including Golden Era (manufacturing), Grinrod (logistics), Royale Energy International (chemicals) and Vector Logistics (logistics)
• CDC records its highest level of self-generated revenue of R290,7 million since inception, mainly due to its work on external infrastructure projects across the Eastern Cape
• CDC creates a new record of 13 569 jobs and training 13 607 people
• Chinese company Sinopec partners with PetroSA on a blueprint and feasibility study for the proposed oil refinery at Coega IDZ, dubbed Project Mthombo
• Discovery’s BPO call centre breaks the mark of 450 people employed
• DCD Wind Towers begins construction on its Zone 3 wind tower manufacturing plant in March; Air Products South Africa begins construction on its air separation unit in May, the first in the Eastern Cape
• CDC wins Top Performing Parastatal/Agency of the Year at National Business Awards in November
• CDC wins Best Provider of Services to Exporters in the Eastern Cape Award from the EC Exporters Club
• CDC wins the Best Company in Promoting and Enhancing Sustainable Development in the Eastern Cape
• Afrox, a leading South African gas company, is signed as a new investor in November
• Coega Cheese starts producing thousands of tons of cheese a month for Famous Brands
• Construction of FAW’s truck assembly plant is completed
• Famous Brands starts operating from Zone 1 of the Coega IDZ
• Agni Steels fires up its machines to start producing steel billets
• CDC’s pipeline is valued at R140 billion (private sector investments only in terms of capital expenditure with no revenues accruing to the CDC)
• Afrox starts construction of its air separation unit in Zone 3 of the IDZ in February
• FAW, DCD Wind Towers and Agni Steels SA reach commissioning phase and start production in March
• First wind turbine tube rolls off the DCD Wind Towers production line in March
• Operational investors move from 22 to 28
• Afrox and Air Products launch their air separation units
• CDC signs record number of ten new investors
• CDC awarded Top Employers South Africa 2014-2015 Award
• CDC awarded Best Provider of Services to Exporters 2014
• CDC, in partnership with JA Solar, initiates a 48 KW solar panel project to assist electricity generation within the IDZ, initially supplying power to the CDC headquarters
• CDC nominated for finalist in the Top Empowered Public Service Award category at 14th Annual Oliver Empowerment Awards
• CDC appointed implementing agent on behalf of KwaZulu-Natal Co-operative Governance and Traditional Affairs (COGTA) on two projects
• UTi moves into a new IDZ facility
• Air Products becomes operational
• Afrox becomes operational• 31 operating investors
with an investment value in excess of R6,44 billion
• 19 new investors signed in the Coega IDZ valued at R1,889 billion
• Implementation of Phase 1 of the Multi-user facility in Zone 3
• River Edge, a food processing company, the first investor to take occupation in the Multi-user facility
• Commissioning of the R3,5 billion Dedisa Peaking Power Plant
• WNS – call centre operational at BPO
• Project Maturity 3.34• Knowledge Management
Level 2
• 17 new investors signed with an investment value of R26,99 billion
• 36 Operational investors• 11 774 jobs created• 37,2% SMME Procurement• 9 500 m2 Coega Cheese and
Coega Dairy Expansion• Job Creation Award (Oliver
Empowerment Award)• Top Employer Award 2016• Implementation of 5 year
sustainable growth strategy (SGS) commences
• ISO Attainment 100%• Certified in ISO 9001:2015
(Quality Assurance),OHSAS 18001 (Occupational Health and Safety), and ISO 14001:2015 (Environmental Management)
• 174 people were placed successfully with Aspen Pharmaceuticals in general assistant positions
• 50 learners successfully trained in the following skills programmes:– Boiler making - 15
Learners placed in host companies
– Welding - 14 Learners placed in host companies, with 1 undergoing training
– Fitting and Turning - 12 Learners placed in host companies
– Joinery - 8 Learners undergoing training
• CDC facilitated accredited training for 218 small businesses throughout the Eastern Cape
• 16 new investors signed with an investment value R11,685 billion
• 40 Operational investors• 9 626 Construction jobs
created• 7 243 Cumulative operational
jobs• 38% SMME Procurement• 54.6 ha BAIC investment
secured• R6.996 billion private sector
investment• B-BBEE Level 3 certification• Qualified as a value-adding
supplier• Received eight awards:
Top Performing Public Service Company: Job Creation; 2030 Vision; Legends of Empowerment & Transformation; Top Employer in SA: Public Sector; Top 50 companies in the Nelson Mandela Bay (NMB); Best Established Black Business Awards; Winner of Infrastructure Development at Vision 2030 Awards; and Best International Trade Marketing Specialist at the sub-Saharan Enterprise Awards 2017 (international recognition).
• Certified in ISO 15 498: Records Management, SANS 16 001: HIV & AIDS, OHSAS 18 001: Occupation Health & Safety, ISO 20 000: IT Service Management, ISO 27 000: Information Management, ISO 31 000: Risk Management
• 6 697 people trained
38 km potable water piping
SECT
ION
04
SECT
ION
03
THIS
IS C
OEG
AAD
MIN
ISTR
ATIO
N
C O E G A D E V E L O P M E N T C O R P O R A T I O N I N T E G R A T E D R E P O R T 2 0 1 6 / 1 7
PER
FOR
MAN
CE IN
FOR
MAT
ION

54 55C O E G A D E V E L O P M E N T C O R P O R A T I O N I N T E G R A T E D R E P O R T 2 0 1 6 / 1 7
PERFORMANCE INFORMATION
02
SECT
ION
04
SECT
ION
03
PER
FOR
MAN
CE IN
FOR
MAT
ION
THIS
IS C
OEG
AAD
MIN
ISTR
ATIO
N
THE COEGA IDz HAD 40 OPERATIONAL INVESTORS BY THE END OF THE 2016/17 FY, AMOUNTING TO R6,996 BILLION 40
COEGAFOCUSING ON SUSTAINABILITY
CDC ACHIEVED B-BBEE LEVEL 3STATUS FOR THE 2016/17 FY 3
2015/16 Corporate Performance 56Strategic Overview 66IDZ Investment Services Investment Promotion 68 Infrastructure Development 74 Operations Management 78Central Support Services
Broad-Based Black Economic Empowerment (B-BBEE) 82Human Capital Solutions 84Development, Empowerment & Transformation 86
External Services External Programmes 88Sustainability Report 90Outlook 94

56 57C O E G A D E V E L O P M E N T C O R P O R A T I O N I N T E G R A T E D R E P O R T 2 0 1 6 / 1 7
2016/2017 CORPORATE PERFORMANCE
SECT
ION
04
SECT
ION
03
PER
FOR
MAN
CE IN
FOR
MAT
ION
THIS
IS C
OEG
AAD
MIN
ISTR
ATIO
N
CORPORATE PERFORMANCE OVERVIEw
The CDC has completed the second year of its Five Year Strategic Plan ending 2019/20. Sustainability is a key driver for the CDC. The goals and objectives are aimed at achieving a breakeven status by the end of the fifth year of the strategic period. The SWOT and PESTLE analyses conducted in preparation of the Strategic Plan presented three options to pursue in order to achieve the level of sustainability of the CDC. The High Road was premised on 100% operational and capital expenditure funding being made available from the Executive Authority, and less dependencies on CDC’s External Programmes. The Medium Road considered an 80% operational expenditure funding, and 100% capital expenditure funding with medium dependencies on external services.
The Low Road is premised on 50% operational expenditure funding, 100% capital expenditure funding and a major dependency on external services for sustainability.
Equally, the target/s for each objective is aligned to the funding availability. Funding is a key enabler for the achievement of the goals of the CDC.
The strategy considers the CDC’s need to contribute to the socio-economic factors which are mandatory deliverables and are therefore included as part of the objectives of the CDC. The SEZ Act defines the purpose of the Special Economic Zones, and the strategy aligns itself to achieve on the objectives of the act.
The table below describes the three Strategic Goals and the Strategic Objectives of the CDC.
The objectives of each programme are also aligned to the purposes of the SEZ Act and are described in the Objectives per Programme section.
ORGANISATIONAL PERFORMANCE OVERVIEw
The CDC has achieved its overall performance showing an average unweighted performance achievement at 245%. Actual performance has been exceeded for all Key Performance Indicators (KPI’s). A discussion on variances is presented under the relevant programme sections. The factor that inflates the CDC’s average performance is the achievement and securing of the BAIC investment which was not considered in the planned targets.
CDC Strategic Goals and Objectives
** Note: Number of Investors Secured recognises Irrevocable Letter of Intent/Term Sheets and signed Lease Agreements
Strategic Goal Goal Statement Strategic Objectives
GO
AL
1 PREFFERED INVESTMENT DESTINATION
Facilitating the creation of the Special Economic Zone, having strategic national economic advantage for targeted investments and industries.
Secure 54 investors** valued at R10.28 billion by 2019/20
Sustain Tenant Industries to realise 50 operational investors by 2019/20
GO
AL
2 FINANCIAL SUSTAINABILITY AND GROWTH
Develop and sustain strategic partnerships to achieve financial sustainability.
Diversify and grow the CDC income streams to a sum of R2.47 billion by 2019/20
GO
AL
3 ADVANCE SOCIO-ECONOMIC DEVELOPMENT
Creating decent work and other economic and social benefits in the region in which it is located, including the broadening of economic participation by promoting small, micro and medium enterprises and co-operatives, and promoting skills and technology transfer.
Realise 61,772 Jobs from all spheres of CDC operations by 2019/20
Realise 29,227 people trained by 2019/20
Achieve 40% of procurement spend on the SMMEs by 2019/20
CDC Annual Performance Achieved 2016/17 FY
800%
300%
100%
200%
0%
229%
100% 100% 100% 100% 100% 100% 100% 100%108% 120% 127%
101% 102% 106%
1062%
Number ofInvestorsSecured
Number ofCumulativeOperational
Investors
RevenueGeneration
Number ofPeopleTrained
Number ofConstruction
Jobs
Number ofCumulativeOperational
Jobs
Procurement Spend onSMMEs
Value ofInvestment
Pledged
Target Annual Performance Achieved
1000%
1200%
Overall Organisational Performance = 245%
WORK CONTINUES AT THE BAIC SA MANUFACTURING PLANT: On track to start production in 2018, with maximum participation of the local SMMEs who have already secured R17 million in work packages. Phase 1 (Site Preparation) has been completed and Phase 2 (Construction) is due to start soon, however excavations are already underway.

58 59C O E G A D E V E L O P M E N T C O R P O R A T I O N I N T E G R A T E D R E P O R T 2 0 1 6 / 1 7
PROGRAMME PERFORMANCE
The CDC’s strategy is developed in a manner that enhances a synergistic approach to performance management whereby various Business Units contribute to a KPI. This approach enhances drivers across the organisation in pursuit of a common goal.
However, to satisfy compliance requirements the organisation has to segregate the indicators into Programmes in order to depict a Budget-Per-Programme methodology. For this reason the Indicators have been aligned to the Three Programmes.
The graphics below show the contributing programmes to the cross cutting KPI’s. However, the KPI’s are reported under the single responsible programme for purpose of accountability.
The absence of OPEX funding had a direct impact on the complete achievement of all targets. However, it should
be noted that despite the funding challenges, the CDC IDZ Business Units managed to achieve, where possible, their overall annual targets.
Programme 1: IDZ Investment Services
Programme Purpose
The IDZ Investment Services programme is enabled to achieve on the SEZ Act Objectives and is aligned to the CDC’s Strategic objectives to achieve on the mandate as described below:
• Facilitating the creation of an industrial complex, having strategic national economic advantage for targeted investments and industries in the manufacturing sector and tradable services;
• Developing infrastructure required to support the development of targeted industrial activities;
• Attracting foreign and domestic direct investment;• Providing the location for the establishment of targeted
investments;• Enabling the beneficiation of mineral and natural resources;
and• Taking advantage of existing industrial and technological
capacity, promoting integration with local industry and increasing value-added production.
The IDZ Investment Services Programme is therefore comprised of Business Development, IDZ Infrastructure and Zone Operations. Together, the sub-programmes take a synergistic approach to achieve on the overarching core mandates of the CDC.
SECT
ION
04
SECT
ION
03
PER
FOR
MAN
CE IN
FOR
MAT
ION
THIS
IS C
OEG
AAD
MIN
ISTR
ATIO
N
The following provides the Overall Organisational Performance for the 2016/17 FY:
ORGANISATIONAL PERFORMANCE OVERVIEw
Key
per
form
ance
are
aK
PI (
mea
sure
)m
easu
red
Bas
elin
eT
arge
t 20
16/1
7A
nnua
l Pe
rfor
man
ce
2016
/17
Var
ianc
e
Stra
tegi
c ob
ject
ives
to
Goa
l 1: P
REF
ERR
ED IN
VES
TM
ENT
DES
TIN
AT
ION
Secu
re 5
4 in
vest
ors
valu
ed
at R
10.2
8 bi
llion
by
2019
/20
Num
ber
of In
vest
ors
Secu
red
*Q
uart
erly
177
16+
129%
Valu
e of
Inve
stm
ent
Pled
ged
Qua
rter
lyR
26,9
9 bi
llion
R1,
1 bi
llion
R11
,685
bill
ion
+96
2%
Sust
ain
Tena
nt In
dust
ries
to
rea
lise
50 o
pera
tiona
l in
vest
ors
by 2
019/
20
Num
ber
of C
umul
ativ
e O
pera
tiona
l Inv
esto
rsA
nnua
lly36
3740
+8%
Stra
tegi
c ob
ject
ives
to
Goa
l 2: F
INA
NC
IAL
SUST
AIN
AB
ILIT
Y A
ND
GR
OW
TH
Div
ersi
fy a
nd g
row
the
CD
C
inco
me
stre
ams
to a
sum
of
R2.
47 b
illio
n by
201
9/20
R
even
ue G
ener
atio
nQ
uart
erly
R48
8,1
mill
ion
R45
1 m
illio
nR
541,
8 m
illio
n+
20%
Stra
tegi
c ob
ject
ives
to
Goa
l 3: A
DVA
NC
E SO
CIO
- EC
ON
OM
IC D
EVEL
OPM
ENT
Rea
lise
61,7
72 Jo
bs fr
om a
ll sp
here
s of
CD
C o
pera
tions
by
201
9/20
Num
ber
of
Con
stru
ctio
n Jo
bsQ
uart
erly
889
9 53
59
626
+0.
9%
Num
ber
of C
umul
ativ
e O
pera
tiona
l Job
sA
nnua
lly10
886
7 11
57
243
+2%
Targ
et 4
0 %
of p
rocu
rem
ent
spen
d on
SM
MEs
by
2019
/20
Proc
urem
ent
Spen
d on
SM
MEs
Ann
ually
37%
36%
38%
+6%
Rea
lize
29,2
27 p
eopl
e tr
aine
d by
201
9/20
Num
ber
of P
eopl
e Tr
aine
dQ
uart
erly
6 37
55
274
6 69
7+
27%
ORGANISATIONAL PERFORMANCE OVERVIEw AGAINST 5 YEAR TARGET
The organisation achieved an overall performance against the set 5 year targets of 101%. The CDC has already exceeded the 5 year target of the value of investment pledged by 370%. The CDC has 3 years remaining to achieve the other 7 KPI’s recognised but the observation depicted in the graphs shows that the CDC will achieve and exceed the targets.
CDC Performance Achieved Against 5yr Targets 2016/17 FY
Number ofInvestorsSecured
Number ofCumulativeOperational
Investors
RevenueGeneration
Number ofPeopleTrained
Number ofConstruction
Jobs
Number ofCumulativeOperational
Jobs
Procurement Spend onSMMEs
Value ofInvestment
Pledged
200%
100%
50%
75%
0%
61%
100% 100% 100% 100% 100% 100% 100% 100%
80%
39% 45%42%
76%
370%5yr Target Performance Achieved Against 5yr
300%
400%
Overall Organisational Performance = 101%
93%
Job Creation
KPI Responsibility: EXTERNAL SERVICES
KPI Responsibility: CENTRAL SUPPORT
SERVICES
Revenue

60 61C O E G A D E V E L O P M E N T C O R P O R A T I O N I N T E G R A T E D R E P O R T 2 0 1 6 / 1 7
SECT
ION
04
SECT
ION
03
PER
FOR
MAN
CE IN
FOR
MAT
ION
THIS
IS C
OEG
AAD
MIN
ISTR
ATIO
N
Sub-Programme: Business Development
The role of the Business Development (BD) business unit in attracting and retaining investment in the IDZ and NMBLP is thus central to the CDC’s ability to create and sustain value. Investment promotion is the point of initiation from which the CDC is able to develop the diversified industrial base critical to the Eastern Cape’s future growth, in turn contributing to poverty alleviation through job creation, skills training and the empowerment of SMMEs. The strong, multi-disciplinary Business Development team is the first point of contact for prospective investors. The CDC’s integrated business approach thus crucially ensures that, from this first contact point, investors are assisted seamlessly in progressing projects from concept to completion. The CDC’s successful track record in executing complex enabling projects requiring the participation of multiple stakeholders – including government, regulatory bodies, development finance institutions, investors’ technical teams, and many other parties – comprises the cornerstone of the value proposition presented by Investment Services to prospective clients. The benefits of clustering for optimisation of integrated synergies, operational alignment and strengthening of the value chain is at the core of the CDC’s investment promotion strategy.
Multi-disciplinary sector experts, each focused on a particular cluster in the IDZ, have ensured the CDC’s success in
progressing from its initial anchor tenant approach to attracting a diverse mix of tenants in terms of size, sector and nationality, along with catalytic mega-projects such as the Dedisa peaking power plant and PetroSA’s Project Mthombo. Investment promotion takes place globally, with a particular focus on a “Look East” strategy, which has paid dividends in that at any one time, approximately 40% of the CDC’s investment pipeline comprises investors with direct or indirect links to the Asian continent.
Sub-Programme: Operations
The Operations Business Unit (OBU) plays a key role in delivering on the Coega IDZ’s value proposition to investors of world-class infrastructure, customised investment solutions, and supply chain integration, as well as making a substantial contribution to the CDC’s strategic objective of financial sustainability through its revenue-generating activities. Operations creates value for tenants and investors – and in turn for the CDC – through provision of: utilities and services; maintenance of buildings and equipment at the required levels of quality; mutually beneficial commercial agreements; and responsive IDZ security. The unit is committed to fostering positive investor relations through service excellence in terms of quality, dependable, on-time delivery and mutually beneficial partnerships. The value-adding support services provided by the OBU ensure a stable environment for tenants and investors, enabling them to focus on their core business and supporting economic productivity and job creation. The OBU aims to support the CDC’s key objective of providing an integrated, value-adding logistics and supply chain solution that maximises efficiency and minimises turnaround times, with an enabling environment that includes trade logistics, port and back-of-port operations, customs management and transport linkages.
OBU provides the following services:• Facilities and asset management • Investor Services;• Commercial Services;• Customs, Logistics and Security Services; and• Safety, Health, Environment and Quality (SHEQ) Management.
EXPLANATION OF MAJOR VARIANCES
Performance Information
Number of Investors
BD has achieved and exceeded its target with regards to number of investors. The positive variance of 200% in achievement which is characterised by higher numbers in Quarter 4 is mainly due to projects that:
• Advanced more rapidly in the pipeline as promoters brought forward their time to market date;
• Reached critical milestones such as the elements of the business case coming together faster than expected; and
• Benefited from the Coega IDZ readiness and shaved off months of preparation they would have required elsewhere which only entered the pipeline after 1 April 2016 and reached all the critical milestones before 31 March 2017.
Investment Value Pledged
Strengthening individual and collective capacity in areas of due diligence; project evaluation and other non-core, yet essential areas has assisted to accelerate the conversion process of projects. The strategy of the CDC is to attract projects which have a higher investment value and therefore the most impact in achieving the objectives of the organisation. The Business Development investor pipeline is an important indicator in determining the targeted investment value. The targeted industries as reflected in the pipeline consist of the projects that carry higher investment value, e.g. metals, and automotive industry projects. BD was able to record a huge achievement in Investment Value KPI of 962% positive variance because of mega projects like BAIC signed which have a significance contribution in terms of investment value contribution. This
investor which is currently under construction and is the largest investment in 40 years’ is worth R11 billion.
Number of Cumulative Operational Tenants
At the beginning of the 2016/17 FY the CDC had 36 Operational Investors in the IDZ and Nelson Mandela Bay Logistic Park. The variance of positive 8% is due to the total number of Investors / Tenants currently operational in both the Nelson Mandela Bay Logistics Park and the IDZ is 40 as recorded for the 2016/17 FY. The four (4) new additions are outlined as follows:
Investor Name Zone Operational Date
Operational Investors
Enel Green Power IDZ Multi-User Facility
Jan-2017
Ambassam IDZ Multi-User Facility
Dec-2016
Other Tenants
MICB NMBLP May-2016
Ulrica NMBLP Nov-2015
Challenges
The availability of OPEX continues to be a major challenge which encroaches on planned investment promotions. Inevitably this impacts on the realisation of performance. The shift to the SEZ environment and the alignment to such has an impact on the functional operational IDZ environment until clarity is sought. The unknown environment does not bring comfort to the Zone and its operations. The overspent CAPEX is due to projects approved during the year and for which funding has been secured from the dti’s SEZ Fund.
SEZ
Inve
stm
ent
Ser
vice
sBusiness
Development
Infrastructure Development
Operations
• Investment Promotions• Marketing and Communications
• SEZ Construction Programme• Cost Engineering
• Facilities Management• Investor Services• Commercial
CDC Performance Information
Key Performance Area 2016/17 TargetAnnual
Performance 2016/17
Variance
Strategic Objectives to Goal 1: PRefeRReD INveStmeNt DeStINatION
Number of Investors Secured 7 16 +129%
Value of Investment Pledged R1,1 billion R11,685 billion +962%
Number of Cumulative Operational Tenants 37 40 +8%
Key Performance Area (continued...) 2016/17 TargetAnnual
Performance 2016/17
Variance
Strategic Objectives to Goal 2: fINaNCIal SuStaINabIlIty aND GROwth: Diversify and grow the CDC income streams to a sum of R2,47 billion by 2019/20
Revenue Generation R207,5 million R226,7 million +9%
Strategic Objectives to Goal 3: aDvaNCe SOCIO-eCONOmIC DevelOPmeNt: Realise 61,772 Jobs from all spheres of CDC operations by 2019/20
Number of Construction Jobs 2,020 1,714 -15%
Number of Cumulative Operational Jobs 7,115 7,243 +2%

62 63C O E G A D E V E L O P M E N T C O R P O R A T I O N I N T E G R A T E D R E P O R T 2 0 1 6 / 1 7
SECT
ION
04
SECT
ION
03
PER
FOR
MAN
CE IN
FOR
MAT
ION
THIS
IS C
OEG
AAD
MIN
ISTR
ATIO
N
Procurement Spend on SMME’s
SMME development is also part of the CDC imperatives; as such the CDC has a dedicated unit called SMME Development which is responsible for ensuring that the CDC develops the SMME’s in areas that it operates in and that a specific amount of the CDC procurement spent is directed to SMME’s.
Empowering Small, Medium and Micro Enterprises (SMMEs) remains the organisation’s important strategic priority and as such, the organisation has policies aimed at promoting and facilitating access to CDC procurement opportunities. The organisation in the 2016/17 financial period achieved R2,2 billion total procurement spend. The organisation also measures total spend towards SMMEs and has achieved 38% against a set target of 36% of overall procurement spend, with a total value of R884 million payments towards SMMEs in the supplier database. The above achievement is due to the organisation’s responsibility to facilitate the process of ensuring that SMME packages are identified prior the appointment of the main contractor.
Challenges
Key challenges include the following:
• Insofar as the higher quality skills interventions (internships, apprenticeships, learnerships), notably learnerships and apprenticeships and accredited skills programmes are concerned, the Coega Development Corporation is entirely dependent on external funding to achieve this objective. While some funding has been secured, notably on the Bill of Quantity provisioning attached to infrastructure programmes, there is still a significant funding gap to be closed to cover the full training target for the year. Despite extensive efforts in this regard, no funding has been forthcoming and unless resolved, this places a performance constraint on the higher quality skills development interventions.
• Insofar as EPWP-compliance type training (also referred to as Life Skills training) is concerned; training performance derives from construction schedules. The performance achieved during previous quarters showed some variation from the training targets and is reflective of project delays
experienced on the provincial infrastructure projects. This variance was overcome by launching an extensive outreach programme in the Nelson Mandela Metro in an effort to balance the training numbers and to achieve the overall annual training target.
• IDZ training performance compared to prior years have reduced substantially due to a slowdown of construction activities, which, in turn, derive from funding constraints on the CDC’s infrastructure budget. However, we do expect an uptick in IDZ training activity deriving from the BAIC construction start.
• The organisation through its management continues with efforts to create an enabling and favourable HR environment for its employees, however, the organisation is not exempt from some of the challenges which continue to surface in the different aspects of the business. Some of the challenges, which can be noted are as follows:
(a) Funding constraints affecting the organisation’s employee value proposition. The CDC is unable to implement some of the human resource programmes that makes the organisation an employer of choice;
(b) High rate of staff turnover is concerning, and proactive measures to retain critical skills and targeted talent are receiving priority attention;
(c) The compliance order issued by the Department of Labour in relation to security personnel’s payment for overtime is receiving attention and the CDC is working with the Department of Labour to resolve the issue;
(d) Varying employment benefits for employees on fixed-term contracts (less than three years) is a challenge from an employee value proposition perspective and employer affordability. However, the matter is receiving management’s attention; and
(e) Full utilisation of HR information management systems is among the areas of improvement. This is crucial for data integrity, information management and the protection of intellectual property. However, the matter is receiving management’s attention.
Programme 2: Central Support Services
Central Support Services (CSS) is considered as the administrative function of the CDC, however, there are sub-programmes within the unit that contributes to other KPI’s such as revenue.
The Sub-Programmes are:
• CEO’s Office• Corporate Services • Finance• Human Capital Solutions • ICT, Research and Strategy
• Centre of Excellence • SMME Development• Technical Procurement Support• Shared Services
The functions of the Central Support Services Programme provide elements of governance, financial control, skills development, advisory and systems services to the Core Operating Programmes.
The indicators listed under the programme are reported here as a result of accountability of the programme. The targets are driven from the CSS but are contributed by both SEZ Investment Services and External Services.
EXPLANATION OF MAJOR VARIANCES
Performance Information
Revenue Generation
The revenue target for Central Support Services was exceeded by a positive variance of 10% due to the PMTE project that was secured during the year but was not budgeted for.
Number of People Trained
Performance is reported on the CDC’s learner management system consisting of the database G20 and ERP System Ncedo and is subject to extensive internal and external audit. Planned performance for Quarter 3 was 1,400 while actual performance was recorded at 2,066 which indicates that our Quarter 4 target has been achieved as planned, with a positive variance of 27%.
A substantial portion of training activities for this quarter were targeted at the rural Eastern Cape, particularly the Eastern Districts, to support local labour absorption on the provincial infrastructure projects the CDC implements on behalf of provincial government departments. Underperformance in previous quarters occasioned by the delay in implementation on a number of infrastructure projects, and notably insofar as the Department of Health and the Department of Basic Education Projects are concerned.
Consequently, to balance the training numbers in order to achieve the overall annual training target, the Coega HCS embarked on an extensive outreach programme in the Nelson Mandela Metro to offer skills training through local community organisations, NGO’s and Local Government Programmes. This is in keeping with our stated intent reported in the Quarter 3 report where we noted that to compensate for the decline in training opportunities arising from the CDC’s portfolio of external projects, Coega HCS will be engaging with local communities to see where there were additional training opportunities to make up for the shortfall.
CDC Performance Information
Key Performance Area 2016/17 TargetAnnual
Performance 2016/17
Variance
Strategic Objectives to Goal 2: fINaNCIal SuStaINabIlIty aND GROwth: Diversify and grow the CDC income streams to a sum of R2,47 billion by 2019/20
Revenue Generation R103.79 million R113,9 million +10%
Strategic Objectives to Goal 3: aDvaNCe SOCIO- eCONOmIC DevelOPmeNt: Realise 29,227 people trained by 2019/20
Number of People Trained 5,274 6,697 +27%
Strategic Objectives to Goal 3: aDvaNCe SOCIO- eCONOmIC DevelOPmeNt: target 40% of procurement spend on Smme's by 2019/20
Procurement Spend on SMMEs 36% 38% +6%
SMME DEVELOPMENT: The SMMEs that were identified through the procurement process for the clearing of the BAIC Group site – Vukujonge Trading, AmanziEthu Trading, Infra Force Africa, Loppsy Trading, April & Son, and Tshintshiwe Trading. All these SMMEs managed to deliver the work within the agreed time and budget.

64 65C O E G A D E V E L O P M E N T C O R P O R A T I O N I N T E G R A T E D R E P O R T 2 0 1 6 / 1 7
SECT
ION
04
SECT
ION
03
PER
FOR
MAN
CE IN
FOR
MAT
ION
THIS
IS C
OEG
AAD
MIN
ISTR
ATIO
N
Programme 3: external Services
The External Services programme is made up of several revenue generating sub-programmes that are aimed at creating and achieving organisational self-sustainability. The job creation indicator is the outcome of the various sub-programmes which are the majority contributor to the KPI. This programme is a significant contributor to Revenue generation aimed at organisational sustainability; however the KPI on Revenue is reported under the Central Support Services programme. Other outputs include skills development and contributions to Project Maturity.
EXPLANATION OF MAJOR VARIANCES
Performance Information
Revenue Generation
The budget has been exceeded by a positive variance of 44% due to invoicing that was done for projects for the ECDOH programme that was stopped by the client but for which work was done. Additional income was also generated from emergency projects undertaken on behalf of DOE/DSRAC.
Number of Construction Jobs
The External Services Programme with a positive variance of 5% has slightly exceeded the annual target, despite major funding challenges experienced by most external Programmes especially the Provincial Treasury Infrastructure Programme (PTIP) and Eastern Cape Department of Health (DoH). The success is attributed to the new projects that were established during the 2016/17 FY, from the National Department of Public Works (NDPW) and existing programmes.
Challenges
Key challenges include the following:
• Some of the clients are not paying the CDC on time which has a negative impact on the cash flow of the organisation. The CDC has approached the Provincial Treasury to intervene so that it can resolve its revenue soon.
• The decrease in the allocation for the PTIP portfolio leading to a reduction in revenue.
• The DOH Facilities Programme came to an end in the previous financial year. The costs currently being incurred relate to the close-out of the programme.
• EDU had also come to an end in the last financial year. The costs thus being incurred are to close out the programme. This will be recovered from the client.
• Department of Public Works Mthatha Programme has been experiencing delays with transfer of funding.
CDC Performance Information
Key Performance Area 2016/17 TargetAnnual
Performance 2016/17
Variance
Strategic Objectives to Goal 2: fINaNCIal SuStaINabIlIty aND GROwth: Diversify and grow the CDC income streams to a sum of R2,47 billion by 2019/20
Revenue Generation R139,9 million R201 million +44%
Strategic Objectives to Goal 3: aDvaNCe SOCIO- eCONOmIC DevelOPmeNt: Realise 61,772 jobs from all spheres of CDC operations by 2019/20
Number of Construction Jobs 7,515 7,913 +5%
EXTERNAL SERVICES: Cecilia Makiwane Hospital (CMH) situated in the Mdantsane township of East London, Eastern Cape were completed during the year in review.

66 67C O E G A D E V E L O P M E N T C O R P O R A T I O N I N T E G R A T E D R E P O R T 2 0 1 6 / 1 7
The CDC’s strategic direction is always guided by its core mission as an enabler of socio-economic development and transformation in the Eastern Cape. In the 17 years since its establishment, the Coega IDZ has proved to be one of the biggest drivers of job creation and development in the Eastern Cape economy, achieving its stated aim of addressing the twin challenges of unemployment and poverty through economic development.
Strategic direction in the Coega IDZ has taken the form of a series of five year plans, with the current strategy period running from 2015 – 2020, the year in which it is expected to become self-sustaining.
In the last four years, the CDC has signed double-digit new investment deals with 62 private sector investors, making the Coega IDZ the premier IDZ in Africa.
During the period under review, the growth of the Coega IDZ has continued its positive trajectory, in spite of the slow recovery of the world’s economy. In Sub-Saharan Africa, in particular, growth has been at its lowest level in two decades, with South Africa’s marked deceleration to just 0.3% being a major contributor.
The United Kingdom’s vote to leave the European Union had the knock-on effect of turbulence in South Africa’s stock market. During 2016, the currency showed some recovery in the second and fourth quarters but inflation remained high, at 6.6% year on year. Gross government debt continued to rise throughout the period, exceeding 50% of GDP. Commodity prices remain well below their post-global-crisis averages.
Aligning the CDC Strategy with the SEZ Act
The Strategic Goals of the CDC are aligned to the strategic intent of the SEZ Act (Act No. 16 of 2014). The Coega Industrial Development Zone (IDZ) was designated an IDZ (Notice No. 2364 of 2001) by virtue of Regulation 3 of the Regulations (Government Gazette No. 21803 of 1 December 2000) made in terms of the Manufacturing Development Act (Act No. 187 of 1993).
During the period under review, the CDC developed a transitional plan as required in terms of the SEZ Act and enabling regulations. The Plan was submitted to DEDEAT for review and then to the dti for approval. In addition, the dti has embarked on a process for the designation of the Coega IDZ in the terms of the Act, wherein – by virtue of the automatic legal effect of section 39(2) of the SEZ Act – the Coega Industrial Development Zone must, as from the date of commencement of the SEZ Act, be regarded as a Special Economic Zone under the SEZ Act, soon to be Gazetted in the middle of 2017.
The introduction of the SEZ legislation brought changes in the way that funding to the IDZs is allocated - from that of MTEF allocations to specific project-based approvals, which will be given from time to time. In addition, the Act states that the funding of the operations of the SEZs will be the responsibility of the Provincial Government and no longer that of the dti. However, the dti will continue to fund qualifying capital projects in terms of the SEZ Act.
Critical to the SEZ designation is the sustainability as a key driver for the CDC, a fact which is enhanced by the IDZ’s position as a preferred destination for investments. The goals and objectives are aimed at achieving a break-even status by the end of the fifth year or by 2020 of the current strategic five year period. However, funding is a key enabler for the achievement of these goals and objectives.
Furthermore, the strategy considers the CDC’s need to contribute to the socio-economic factors which are mandatory deliverables and are therefore included as part of the objectives of the CDC and key corporate KPI’s.
The new SEZ Act defines the purpose of the Special Economic Zones, and the CDC strategy is aligned to achieve on the objectives of the Act.
The Strategic Goals of the CDC for the five years to 2020 are as follows:
• To be the preferred investment destination• To ensure financial sustainability and growth• To advance socio-economic development
Highlights
Construction has started on a plastic moulding plant for packaging for the automotive and other industries. Preparations are also underway for a manufacturer of tractors and farming implements in the IDZ.
The 54.62 ha Beijing Automobile International Corporation (BAIC) plant in Zone 1 of the Coega IDZ is under construction. It is the biggest automotive investment in Africa in the last 40 years. More than 10 500 jobs are expected to be created through this investment. The BAIC plant has contributed substantially to inflating the CDC’s average performance as it was not considered in the planned targets during the current five year Strategic Plan.
The aforementioned projects are aligned to the CDC’s strategic objectives and illustrate CDC’s contribution to human capital and small business development, broad-based black economic empowerment, corporate social investment and infrastructure development.
LOOkING AHEAD
Currently, there is some uncertainty in the country due to the recent announcements of downgrades by global rating agencies. At the start of 2016, the global economy grew at its slowest pace in almost three years due to rising volatility at the outset of the year. A more detailed analysis during the first quarter suggested that global economic activity was bottoming out and was likely to accelerate in the second half of the year. According to the June 2016 Global Economic Prospects forecast, however, global growth was projected at 2.4%. This was 0.5% below the January forecast and unchanged from a disappointing 2015.
Emerging markets and developing economies are facing stronger headwinds including weaker growth among advanced economies and low commodity prices. Significant divergences persist between commodity exporters struggling to adjust to depressed prices and commodity importers showing continued resilience.
The outlook for the next period is positive, with global growth projected to increase up to 3% by 2018 as stabilising commodity prices provide support to emerging markets which are net commodity exporters, as well as to developing economies. Downside risks have become more pronounced, however, with deteriorating conditions among key commodity exporters, softer-than-expected activity in advanced economies, rising private sector debt in some large emerging markets and heightened policy and geographical uncertainties.
STRATEGIC OVERVIEW
2020 STRATEGIC GOALSOF THE CDC
BUSINESS INTELLIGENCE
FINANCIAL SUSTAINABILITY
STRATEGIC PARTNERSHIPS
1. Improve Funding
Opportunities
2. Manage Risk on Project
Delivery
3. Deliver CSI Projects
4. Gain New Clients
5. Gain New Products
& Services
6. Optimise SMME
Development
1. Improve Productivity2. Improve Business Processes
3. Profitability Optimisation4. Improve Project Management
1. Increase Revenue
2. Customer Diversification
3. Manage Funding Risk
4. Diversify Products & Services
5. Increase Profit
6. Assure Return on
Investment
7. Reduce Client Turnover
8. Ensure Compliance
& Governance
9. Cost Control
10. Improve Productivity
2020 STRATEGIC GOALSOF THE CDC
1. financial Sustainability2. Strategic Partnerships3. Business Intelligence
The diagramme below captures the CDC’s Sustainable Growth Strategy for the next 5 years:
SECT
ION
04
SECT
ION
03
PER
FOR
MAN
CE IN
FOR
MAT
ION
THIS
IS C
OEG
AAD
MIN
ISTR
ATIO
N
C O E G A D E V E L O P M E N T C O R P O R A T I O N I N T E G R A T E D R E P O R T 2 0 1 6 / 1 7

68 69C O E G A D E V E L O P M E N T C O R P O R A T I O N I N T E G R A T E D R E P O R T 2 0 1 6 / 1 7
Investment promotion provides solutions which are designed to attract and secure potential investors across a range of industry sectors, matching investors to the most complementary product combination of serviced land and/or customised buildings.
The unique value proposition offered by the CDC is bolstered by the following services and supporting infrastructure:
• Serviced land;• Utilities (power, water and sewer network);• Intermodal transportation linkages [road, sea (integration
to the deep water port of Ngqura), air and rail];• Telecommunication services;• Human capital solutions (skills development, recruitment,
placement, labour relations and permitting of foreign human capital);
• Facilities management;• Security;• Expedited customs solutions (plus the resulting operational
and logistical efficiencies); • Single window investor servicing interface; and• Industrial clustering for synergy.
In recognition of the needs of stakeholders and their business partners, a unique Business Development Stakeholder Matrix has been developed to facilitate engagement. The matrix recognises the significant contribution by these partners to the provision of resources, adding value to the product offering and providing expert knowledge.
To deliver on the corporate strategy and targets, investment promotions moved from a ‘business as usual’ mode towards an approach that ensures the optimal alignment between the team, the current strategy, and all business areas within the CDC. In so doing, the team’s competencies are honed to adapt to an efficient ‘selling’ pace and intensively customer-orientated approach (in line with its customer intimacy model).
Ensuring alignment with strategy is the first priority of investment promotion services.
INVESTMENT PROMOTION STRATEGY
Investment Promotion, with its services, is at the heart of the CDC and is largely instrumental to its success. These services are the point of initiation from which the CDC is able to develop the diversified industrial base critical to the Eastern Cape’s future growth. In practical terms, the CDC’s integrated business approach ensures that investors are assisted seamlessly in progressing projects from concept to completion, as described in the investor experience diagram below. Each successful investment has a vital role to play in the alleviation of poverty in the region.
Strategic areas of focus include:
• Operationalisation of signed investor-projects with transformational potential;
• Realisation of 100% occupancy of the Multi-User Facility phase 1. The process of applying for the second phase is under way. This phase is reliant on securing more tenant agreements;
• Ensuring continuous achievement of significant milestones e.g. replenishment of the investor pipeline, while progressing potential investor projects, which will create development momentum in the period post 2018/19; and
• Strengthening individual and collective capacity in areas of due diligence; project evaluation and other non-core, yet essential areas to assist to accelerate the conversion process e.g. streamlining, consolidation and rationalisation in respect of processes, KPI’s, reports, etc.
It is clear that this strategy is working. The target of seven new investors, with a projected value of R1.1 billion was exceeded by more than 100% by the end of the 2016/17 financial year as 16 investors were secured, realising a total value of R11.685 billion. This is the fourth year in a row that the CDC has exceeded its target, achieving double digit investment numbers, i.e. 10, 19, 17 and recently 16 investors.
Number of investors signed in the past three years
Value of investment pledged in the past three years (R billion)
The CDC’s five year strategy stipulates the targets that the organisation has to reach in order to be self sustainable against various organisational KPI’s. The KPI’s include the number of investors secured and value of investment pledged, as in the graph below.
Investors secured performance
After the completion of 61% of the five year cycle, the CDC is well on track. It has already achieved 61% of the five year target on new signed investors.
The value of investment has also grown year on year as can be seen in the graph below.
Investment value performance (R billion)
The CDC is at a staggering 101% of its five year targets and is well on track to surpass this over the remaining two financial years of the 5-year strategy.
CHALLENGES AND OPPORTUNITIES
It is clear that in spite of challenges experienced in the 2016/17 financial year, the organisation has exceeded its targets. Far from resting on its laurels, however, the organisation is cognisant of the limitations and additional factors that need to be faced. These include:
• Rapidly-changing economic conditions;• Cautious optimism from investors waiting for market
offtake;• Long-lead times associated with environmental permit
approvals;• Uncertainty about the future of the National Tooling
Institute Programme (NTIP) in the IDZ as the Commercial Unit is in the process of terminating their lease agreement. (A high level HCS decision is pending.);
• Inability to secure funding for the Nelson Mandela Bay Logistics Park (NMBLP) projects from the dti;
• Financial closure; and• The availability of water remains threatened.
Balanced against these concerns are the CDC’s world-class infrastructure, the quality HR and value-added services, a strong track record of delivery and an escalated growth curve. Coupled with this are the value of the current assets and the size of the land available for development.
Counterbalancing the strengths are the funding constraints, the limitations on the investment promotion budget and the lack of infrastructure services such as shops and public transport. Warehouse space is constrained, the overhead costs can be high and there is a long lead time before delivery.
INVESTMENT PROMOTION
SOD-TURNING: CDC broke ground on the 30th of August 2016 to mark the historic Beijing Automobile International Corporation (BAIC) R11 billion investment at the Coega IDZ.
SECT
ION
04
SECT
ION
03
PER
FOR
MAN
CE IN
FOR
MAT
ION
THIS
IS C
OEG
AAD
MIN
ISTR
ATIO
N
2016/172015/162014/15
Inve
stor
s Si
gned
7
1617
19
11 11
20
15
10
5
0
Target Actual
2016/172015/162014/15
Inve
stm
ent
Pled
ge
R1,1
R11,68
R26,99
R1,8R1,6
R1,2
R30
R10
R2
R1
0
Target Actual
5 Year Target2016/172015/16
Inve
stor
s Se
cure
d
54
33
1617
20
7
45
2535
5565
20
12
4
16
8
0
Target Actual
Inve
stm
ent
Pled
ge
5 Years Target2016/172015/16
R1,1
R11,68
R26,99R38,67
R10,28
R3,5
R30R20
R40
R15
R4
R10
R3R2R1
0
Target Actual

70 71C O E G A D E V E L O P M E N T C O R P O R A T I O N I N T E G R A T E D R E P O R T 2 0 1 6 / 1 7
The following sectors are prioritised for investment promotion as the CDC focuses on the next three to five years:
Metals Sector
The CDC has announced ambitious plans for the expansion of the metals beneficiation initiative and metal sector investment in South Africa through its newly unveiled 2015-2020 metal cluster strategy. This aims to attract a significant number of investors, while it also targets local and foreign investment to the Coega IDZ over the next 5-10 years. The CDC Metals Cluster Strategy is aligned to the dti, IPAP and South Africa’s beneficiation bill, the government’s Medium-term Strategy Framework together with the National Growth Plan, Energy Security and Skills Development initiatives.
Independent studies have identified the Coega IDZ location for metal sector investments as technically feasible, economically viable and qualitatively reliable for the following production plants:
• Iron and carbon steel smelting and manufacturing;• Stainless steel manufacturing;• Carbon and stainless steel rolling-mills Ferromanganese Smelt;• Copper smelting and manufacturing;• Zinc smelting;• Direct reduced iron and hot briquette iron manufacturing;• Manganese smelting; and• Cement production.
Chemical Sector
Chemical industries are a cornerstone of modern industrial economies, servicing major industries such as textiles and clothing, housing and construction, the commercial sector, medicare, education, recreation, household consumables, automotive, metals and mining, and the agricultural sector. The chemical sector is a significant contributor to job creation and to South Africa’s Gross Domestic Product (GDP), contributing 6% to the GDP and 25% to the manufacturing sector.
Based on a demand analysis study on the South African chemical sector, the following opportunities have been determined for the Coega IDZ:
• Aluminium sulphate;• Lactose;• Polystyrene;• Butadiene;• PET polymer; and• Biodiesel
An investment in the chemicals sector can positively address CDC’s expectation of being a platform for the creation of jobs, while facilitating and encouraging economic activities in the Eastern Cape. South Africa has a well-established chemicals sector, with revenue in excess of $35,1 billion, which positions it as the biggest chemicals market in Africa.
Agro-Processing Sector
According to global trends, capture fisheries stocks are declining while culture fisheries production is increasing. Coega IDZ has earmarked Zone 10 of the IDZ for aquaculture development. The site has approximately 120 ha available at less than 40m
above sea level, and the environmental conditions have been described by experts as being ideal for abalone farming. The CDC aims to have 30 ha of abalone farming in production by 2020, thereby creating about 1 000 permanent jobs. South Africa is widely known to have the most suitable abalone species for aquaculture (Haliotis midae). The Chinese market is currently the main importer of abalone. Finfish farming in the Coega IDZ can create about 200 permanent jobs in the long term. The CDC is also pursuing aquaponics; i.e. the combination of freshwater aquaculture and hydroponics. The CDC targets to have 50 ha under aquaponics by 2020 creating approximately 600 jobs.
Automotive Sector
The South African automotive industry is considered as a success story and the Motor Industry Development Programme (MIDP) has been recognised around the world by automotive stakeholders as one of the most successful and innovative strategies to develop automotive manufacturing and open up a domestic market in the new environment of globalisation. The MIDP has been successful in realising various key objectives: Significant investments in best practice assets and state-of-the-art technology have taken place accompanied by technology transfers, skills upgrading and training to accommodate the expansion in export growth.
Coega has, with the attraction of the R11 billion investment by the Beijing Automobile Group Company Ltd in 2016, affirmed the vital role it is playing in stimulating the development of the automotive industry in the Nelson Mandela Bay Municipality (NMBM) and Eastern Cape (EC) at large. The BAIC Group’s commitment to locate at Coega and other automotive related investments attracted over the past decade, is in line with the CDC’s objective to continue to play an increasingly relevant role in enhancing the region’s automotive footprint and in contributing to the sustainability of the automotive sector by providing opportunities to service the local and export markets.
Most notable achievements thus far include the location of BAIC Group‘s passenger vehicle assembling facility and FAW’s heavy vehicle assembly plant in the Coega IDZ.
The CDC has begun the process of establishing a Multi-OEM complex for the automotive assembly and components manufacturing sectors in Zone 2. FAW and BAIC Group are currently anchoring this initiative which is in line with CDC’s strategic plan embracing an OEM industrial clustering approach.It is envisaged that the Multi-OEM complex will house vehicle assembly halls and shared service infrastructures. First, second, and third tier automotive component suppliers will all be brought together in one mega automotive zone. The envisaged Coega Multi-OEM complex will have shared facilities that will include a supplier park, an e-coating plant, a paint shop and a vehicle distribution centre, amongst other amenities.
Energy Sector
The Eastern Cape is endowed with good resources for a diverse energy mix. The CDC plays a central role in advancing readiness for the realisation of various transformational
energy-related initiatives, which include generation and manufacturing-orientated projects for the energy sector. This aligns to the broader CDC’s mandate, anchored on advancing industrialisation through stimulating local content manufacturing.
Among the key focus areas within the energy sector are the following initiatives:
• Locate LNG & Gas-to-Power solution at Coega;• Build socio-economic linkage to Indigenous Gas Prospects;• Central in Nuclear Readiness Programme to support
Thyspunt;• Expand Renewable Energy implementation to drive socio-
economic growth; and • Leverage lessons from Dedisa PPP & REIPPPP experience
of the region.
Extensive work continues to be conducted by both the private and public sector towards the development of these strategic
projects. This reinforces the value created through effective co-ordination and collaboration between key state organs. The Department of Energy is currently in a regulatory process of revising the national Integrated Resource Plan and finalising the Integrated Energy Plan. This is expected to be completed in the 2017/18 financial year.
The Coega IDZ has also built momentum on energy projects in both conventional energy and renewable energy so as to attract and sustain its investment projects. There are two big announcements made for the Gas-to-Power projects in the year under review:
• The Coega IDZ was identified as one of the two locations for the gas-to-power programme, a 1 000 MW of the power facility, with an estimated budget of R25 billion.
• Eskom and the CDC signed a Memorandum of Understanding on nuclear localisation. The MoU seeks to support government’s plans to build local capacity through supplier development and localisation around the unfolding infrastructure for the nuclear programme.
SECT
ION
04
SECT
ION
03
PER
FOR
MAN
CE IN
FOR
MAT
ION
THIS
IS C
OEG
AAD
MIN
ISTR
ATIO
N
FAW TRUCK ASSEMBLY PLANT: Chinese automotive manufacturer First Automotive Works (FAW), based in Zone 2 of the Coega IDZ.

72 73C O E G A D E V E L O P M E N T C O R P O R A T I O N I N T E G R A T E D R E P O R T 2 0 1 6 / 1 7
LOOkING AHEAD
With its solid track record and the growing confidence of investors in the Coega IDZ’s ability to deliver on its promises, the CDC looks set to continue its growth trajectory and to play a major role in the growing prosperity of the Eastern Cape population in the next few years.
The threats facing the IDZ are the current economic slowdown, coupled with low business confidence in South Africa and increased competition from other African countries such as Nigeria. The electricity crisis and political upheavals add to the uncertainly experienced by potential investors. Other SEZ’s and a lack of incentives could also be perceived as threats.
During the 2016/17 financial year, CDC operated without receiving the full amount of requisite funding for operational expenditure but was able to sustain operations from external revenues generated by CDC. As a result of the changes in the funding arrangements, some of the CDC’s key financial ratios have deteriorated in comparison to the previous year’s. The provision of the necessary additional funding required by the organisation has been discussed with the shareholders and is receiving attention at the highest level.
SECT
ION
04
SECT
ION
03
PER
FOR
MAN
CE IN
FOR
MAT
ION
THIS
IS C
OEG
AAD
MIN
ISTR
ATIO
N
COEGA INVESTOR EXPERIENCE
AwarenessInvestor notices marketing advert online or via other media
Client IdentificationCoega identify potential Investors to pursue
ResearchInvestor will search online or via other mediums to find more information on the Coega IDz
First ContactInvestor makes first contact with Coega to show intent
Contact & Visit InvestorCoega contacts Investor to arrange a meeting to make a presentation to promote the Coega IDz
Getting to Know InvestorInvestor fills in the Coega BSA to assess business, infrastructure and services needs
Relationship BuildingInvestor visits the Coega IDz for atour of the land and surrounding sites
Talking BusinessInvestor and Coega negotiate the terms and conditions of the deal
Contract ApprovalInvestor and Coega sign the final contract and prepare announcement and site handover to Investor
Investor LaunchInvestor start with operations and launch announced to all stakeholders
Sod-Turning & Construction CeremonyInvestor announced to all stakeholders through sod-turning and/ or construction ceremony
Hello,Coega!
Investor OperationalInvestor starts with production
OR
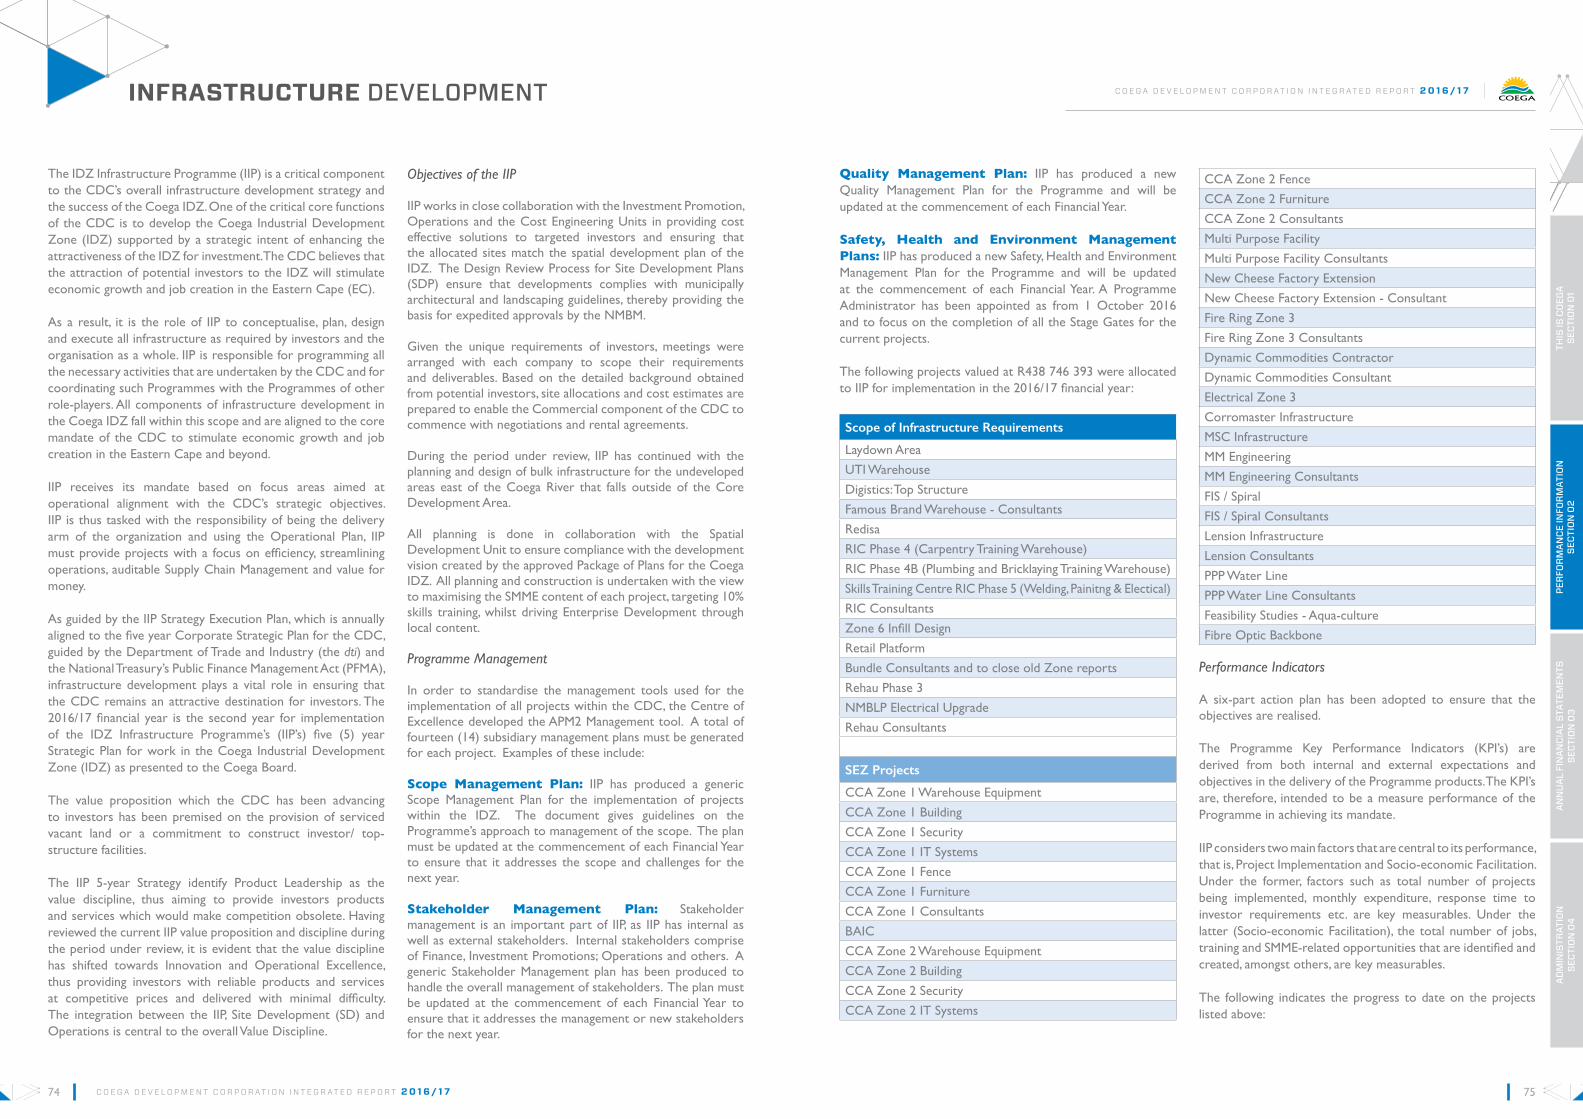
74 75C O E G A D E V E L O P M E N T C O R P O R A T I O N I N T E G R A T E D R E P O R T 2 0 1 6 / 1 7
The IDZ Infrastructure Programme (IIP) is a critical component to the CDC’s overall infrastructure development strategy and the success of the Coega IDZ. One of the critical core functions of the CDC is to develop the Coega Industrial Development Zone (IDZ) supported by a strategic intent of enhancing the attractiveness of the IDZ for investment. The CDC believes that the attraction of potential investors to the IDZ will stimulate economic growth and job creation in the Eastern Cape (EC).
As a result, it is the role of IIP to conceptualise, plan, design and execute all infrastructure as required by investors and the organisation as a whole. IIP is responsible for programming all the necessary activities that are undertaken by the CDC and for coordinating such Programmes with the Programmes of other role-players. All components of infrastructure development in the Coega IDZ fall within this scope and are aligned to the core mandate of the CDC to stimulate economic growth and job creation in the Eastern Cape and beyond.
IIP receives its mandate based on focus areas aimed at operational alignment with the CDC’s strategic objectives. IIP is thus tasked with the responsibility of being the delivery arm of the organization and using the Operational Plan, IIP must provide projects with a focus on efficiency, streamlining operations, auditable Supply Chain Management and value for money.
As guided by the IIP Strategy Execution Plan, which is annually aligned to the five year Corporate Strategic Plan for the CDC, guided by the Department of Trade and Industry (the dti) and the National Treasury’s Public Finance Management Act (PFMA), infrastructure development plays a vital role in ensuring that the CDC remains an attractive destination for investors. The 2016/17 financial year is the second year for implementation of the IDZ Infrastructure Programme’s (IIP’s) five (5) year Strategic Plan for work in the Coega Industrial Development Zone (IDZ) as presented to the Coega Board. The value proposition which the CDC has been advancing to investors has been premised on the provision of serviced vacant land or a commitment to construct investor/ top-structure facilities.
The IIP 5-year Strategy identify Product Leadership as the value discipline, thus aiming to provide investors products and services which would make competition obsolete. Having reviewed the current IIP value proposition and discipline during the period under review, it is evident that the value discipline has shifted towards Innovation and Operational Excellence, thus providing investors with reliable products and services at competitive prices and delivered with minimal difficulty. The integration between the IIP, Site Development (SD) and Operations is central to the overall Value Discipline.
Objectives of the IIP
IIP works in close collaboration with the Investment Promotion, Operations and the Cost Engineering Units in providing cost effective solutions to targeted investors and ensuring that the allocated sites match the spatial development plan of the IDZ. The Design Review Process for Site Development Plans (SDP) ensure that developments complies with municipally architectural and landscaping guidelines, thereby providing the basis for expedited approvals by the NMBM.
Given the unique requirements of investors, meetings were arranged with each company to scope their requirements and deliverables. Based on the detailed background obtained from potential investors, site allocations and cost estimates are prepared to enable the Commercial component of the CDC to commence with negotiations and rental agreements.
During the period under review, IIP has continued with the planning and design of bulk infrastructure for the undeveloped areas east of the Coega River that falls outside of the Core Development Area.
All planning is done in collaboration with the Spatial Development Unit to ensure compliance with the development vision created by the approved Package of Plans for the Coega IDZ. All planning and construction is undertaken with the view to maximising the SMME content of each project, targeting 10% skills training, whilst driving Enterprise Development through local content.
Programme Management
In order to standardise the management tools used for the implementation of all projects within the CDC, the Centre of Excellence developed the APM2 Management tool. A total of fourteen (14) subsidiary management plans must be generated for each project. Examples of these include:
Scope management Plan: IIP has produced a generic Scope Management Plan for the implementation of projects within the IDZ. The document gives guidelines on the Programme’s approach to management of the scope. The plan must be updated at the commencement of each Financial Year to ensure that it addresses the scope and challenges for the next year.
Stakeholder management Plan: Stakeholder management is an important part of IIP, as IIP has internal as well as external stakeholders. Internal stakeholders comprise of Finance, Investment Promotions; Operations and others. A generic Stakeholder Management plan has been produced to handle the overall management of stakeholders. The plan must be updated at the commencement of each Financial Year to ensure that it addresses the management or new stakeholders for the next year.
Quality management Plan: IIP has produced a new Quality Management Plan for the Programme and will be updated at the commencement of each Financial Year.
Safety, Health and Environment management Plans: IIP has produced a new Safety, Health and Environment Management Plan for the Programme and will be updated at the commencement of each Financial Year. A Programme Administrator has been appointed as from 1 October 2016 and to focus on the completion of all the Stage Gates for the current projects.
The following projects valued at R438 746 393 were allocated to IIP for implementation in the 2016/17 financial year:
Scope of Infrastructure Requirements
Laydown Area
UTI Warehouse
Digistics: Top Structure
Famous Brand Warehouse - Consultants
Redisa
RIC Phase 4 (Carpentry Training Warehouse)
RIC Phase 4B (Plumbing and Bricklaying Training Warehouse)
Skills Training Centre RIC Phase 5 (Welding, Painitng & Electical)
RIC Consultants
Zone 6 Infill Design
Retail Platform
Bundle Consultants and to close old Zone reports
Rehau Phase 3
NMBLP Electrical Upgrade
Rehau Consultants
SEZ Projects
CCA Zone 1 Warehouse Equipment
CCA Zone 1 Building
CCA Zone 1 Security
CCA Zone 1 IT Systems
CCA Zone 1 Fence
CCA Zone 1 Furniture
CCA Zone 1 Consultants
BAIC
CCA Zone 2 Warehouse Equipment
CCA Zone 2 Building
CCA Zone 2 Security
CCA Zone 2 IT Systems
CCA Zone 2 Fence
CCA Zone 2 Furniture
CCA Zone 2 Consultants
Multi Purpose Facility
Multi Purpose Facility Consultants
New Cheese Factory Extension
New Cheese Factory Extension - Consultant
Fire Ring Zone 3
Fire Ring Zone 3 Consultants
Dynamic Commodities Contractor
Dynamic Commodities Consultant
Electrical Zone 3
Corromaster Infrastructure
MSC Infrastructure
MM Engineering
MM Engineering Consultants
FIS / Spiral
FIS / Spiral Consultants
Lension Infrastructure
Lension Consultants
PPP Water Line
PPP Water Line Consultants
Feasibility Studies - Aqua-culture
Fibre Optic Backbone
Performance Indicators
A six-part action plan has been adopted to ensure that the objectives are realised.
The Programme Key Performance Indicators (KPI’s) are derived from both internal and external expectations and objectives in the delivery of the Programme products. The KPI’s are, therefore, intended to be a measure performance of the Programme in achieving its mandate.
IIP considers two main factors that are central to its performance, that is, Project Implementation and Socio-economic Facilitation. Under the former, factors such as total number of projects being implemented, monthly expenditure, response time to investor requirements etc. are key measurables. Under the latter (Socio-economic Facilitation), the total number of jobs, training and SMME-related opportunities that are identified and created, amongst others, are key measurables.
The following indicates the progress to date on the projects listed above:
INFRASTRUCTURE DEVELOPMENT
SECT
ION
04
SECT
ION
03
PER
FOR
MAN
CE IN
FOR
MAT
ION
THIS
IS C
OEG
AAD
MIN
ISTR
ATIO
N
C O E G A D E V E L O P M E N T C O R P O R A T I O N I N T E G R A T E D R E P O R T 2 0 1 6 / 1 7

76 77C O E G A D E V E L O P M E N T C O R P O R A T I O N I N T E G R A T E D R E P O R T 2 0 1 6 / 1 7
Scope of Infrastructure requirements Pm
Physical Progress to datePlanning design Procurement Construction
Laydown Area LT Complete / retention
UTI Warehouse MvZ Complete / retention
Digistics Warehouse BP Complete / retention
Famous Brand Warehouse BP Complete / retention
Zone 1 consultants MvZ Complete
Redisa MvZ Complete
RIC Phase 4 (Carpentry Training Warehouse) MvZ Complete /
retention
RIC Phase 4B (Plumbing and Bricklaying Training Warehouse) MvZ Complete /
retention
Skills Training Centre RIC Phase 5 (Welding; Painting & Electrical)
MvZ Complete / retention
Bus Parking at the BPO Construction 80%
RIC Consultants MvZ Ongoing
Return Effluent Consultants LT Suspended 80%
Return Effluent Construction LT Suspended 80%
Zone 6 Infill Design MvZ Ongoing
Bulk Sewer Line LT Suspended 75%
Bulk Sewer Line Consultants LT Suspended 75%
Construction Village (Phase I C) SK Suspended 60%
Construction Village (Phase I C): Consultants SK Suspended 60%
Consultant Appointment for the close out Report for the Colchester Bulk Waterline
HvdK Ongoing 95%
Contractor Appointment for the close out Report for the Colchester Bulk Waterline
HvdK Ongoing 95%
NMBLP
Q Plus BP Complete
Rehau Phase 3 MvZ Complete
Rehau Consultants HvdK Complete / retention
SEZ PROJECTS
CCA Zone 1 Building HW Construction 15%
CCA Zone 1 Fence HW Construction 75%
CCA Zone 1 Consultants HW Implementation 45%
BAIC - Platform LT Complete
BAIC - Ring Road LT Procurement 50%
BAIC - Fire Ring LT Procurement 65%
BAIC - Electrical Reticulation LT Procurement 25%
CCA Zone 2 Building HW Complete
CCA Zone 2 Fence HW Construction 98%
Scope of Infrastructure requirements (continued...)
Pm Physical Progress to date
Planning design Procurement ConstructionCCA Zone 2 Consultants HW Ongoing
Multi Purpose Facility SK Complete
New Cheese Factory Extension BP Complete
Fire Ring Zone 3 LT Complete
Dynamic Commodities MvZ Complete
Electrical Zone 3 MvZ Construction 85%
Corromaster Infrastructure LT Complete
MSC Infrastructure LT Design 0%
MM Engineering BP Construction 5%
Spiral Wrap Warehouse HW Complete
Lension Warehouse and Infrastructure BP/LT Complete
PPP Water Line MvZ Complete
SECT
ION
04
SECT
ION
03
PER
FOR
MAN
CE IN
FOR
MAT
ION
THIS
IS C
OEG
AAD
MIN
ISTR
ATIO
N
Funding
Projects that were successful in the last financial year were the projects that received funds under the SEZ Bill, for which applications had to be prepared and submitted to the dti for their consideration. 24 projects were submitted for which funding was approved. Notable, is the amount of funds that were approved for projects by the dti, which shows that in the 2016/17 financial year R587 968 566 was approved. However, over the past three years, R1 404 932 803 was approved by the dti, of which 81% has been received, and that has enabled the growth of infrastructure projects in the IDZ. However, more could be done by the organisation as soon as all the approved funds have been received.
LOOkING AHEAD
The Infrastructure Development Programme will continue with innovation and operational excellence to deliver infrastructure in the IDZ at competitive prices, delivered with minimal difficulty. However, of critical importance in the year ahead is the finalisation of the funding of projects that have not been funded, those that are partly funded and those where approved funding has not been received. Funding applications for infrastructure projects not yet funded are currently underway and have been submitted to the dti (under the SEZ fund). Examples are the bulk sewer project and the completion of the Construction Village.
CUSTOMS CONTROL AREA: The new CCA control centre in Zone 2 of the Coega IDZ.

78 79C O E G A D E V E L O P M E N T C O R P O R A T I O N I N T E G R A T E D R E P O R T 2 0 1 6 / 1 7
Operations Management creates value for tenants and investors – and in turn for the CDC – by providing utilities and services, maintaining buildings and equipment, mutually beneficial commercial agreements and responsive IDZ security, as described in the diagram below.
The value-adding support services provided by Operations ensure a stable environment for tenants and investors, enabling them to focus on their core business and supporting economic productivity and job creation. The unit provides an enabling environment that includes trade logistics, port and back-of-port operations, customs management and transport linkages.
Strategy
Operations management provides turn-key one-shop-stop services to investors in the IDZ thus improving operational efficiencies and maximising economies of scale for investors. The unit has strong collaborative relationships with various arms of the business with which it works in tandem to strengthen the CDC’s value proposition to investors.
Sustainability
The 2016/17 financial year has seen some exciting new investors into the Coega IDZ. A highlight was the expansion of existing investor facilities within the Coega IDZ and NMBLP as this indicates an upswing in regional economic activities and bodes well for the new economic activity to support the growth in current established sectors. Such expansions also highlight the professional service offered by the Coega IDZ and further demonstrate investor confidence.
Highlights
From an investor satisfaction perspective, a total of 153 tickets were logged, of which a total of 149 tickets were closed successfully.
As regards to safety and security in the IDZ, given an increase in the number of incidences reported in the IDZ, a new approach to safety and security has been adopted, starting with the recruitment of a new Security Manager, who joined the organisation in the 4th quarter of the current financial year. The CDC is also in the process of optimising technical security measures in all its areas of operations. The focus is to ensure that security in the Coega IDZ grows from strength to strength in preventing incidences and responding quicker to cases that have been reported by tenants. Stricter security and access controls along with security innovations will produce enhanced management of security in the zone.
The Customs Controlled Area, Administration Building and Zone 2 Entrance have been completed. The CCA offers several integrated services to tenants and investors. CDC’s Customs Control Areas are located in Zone 1, 2, 3 and 7 of the Coega IDZ and is already advancing investors such as FAW China and Beijing Automobile International Corporation (BAIC). Incentives offered within the Customs Control Area are:
Simplified business start-up and license requirements:
• Single surety by IDZ Operator for CCA Enterprises –w/housing & movement;
• Manufacturing / Storage Warehouses and Rebate user; and• No License fees.
Simplified customs procedures:
• Bond movements – between CCA’s and South Africa;• Stage consignments – meet requirements (i.e. importation
in knock down condition);• Release under embargo (examination conducted at
premises) on meeting specified criteria; and• Allow imported, duty free goods, to be warehoused in
CCA.
Relief from customs duties. No import duties on:
• Any raw material for manufacture;• Any goods for storage;• Capital equipment used in the CCA (machinery, forklifts
etc); and• Any goods for the construction and maintenance of the
CCA infrastructure.
No VAT payable on:
• Any goods for storage (imported/local);• Raw materials for manufacture (imported/local);• Capital equipment used in the CCA (imported/local);• Any goods for the construction and maintenance of the
CCA infrastructure (imported/local);• Any services rendered in the CCA; and• Rental payments made with the CCA.
Biodiversity Protection and Management
The CDC prides itself in ensuring that it creates a sustainable natural environment in the Coega IDZ.
A total of 3 485 plant species were rescued from the BAIC SA site during the period under review. Of those total, 903 plants were rehabilitated within the IDZ and 2 582 plants were used in the landscaping of the new Zone 2 Customs Control Area (CCA) entrance.
During the bush clearing phase, at least six SMMEs based in the Eastern Cape benefitted from work worth R3 million. This project could have been implemented by a single large and well-established construction company but it was awarded to six SMMEs with the objective of sharing and spreading opportunities as much as possible to many organisations. All the SMMEs delivered the work within agreed time and budget.
Air Quality Management
When the Environmental Authorisation was issued that allowed the change in land use from agricultural use to special purposes, the Coega IDZ undertook to ensure world class Safety, Health, Environment and Quality (SHEQ) management to potential as well as operational investors. In order to ensure a sound SHEQ performance, CDC has implemented an integrated SHEQ management system based on the requirements of the ISO 9001 and ISO 14001, OHSAS 18001 and International Standards.
Support services offered by SHEQ during the period under review include:
1. Identification, evaluation and provision of mitigation measures in occupational safety, as well as health hazards and risks related to the Coega IDZ development and activities which may put the health and safety of our personnel, contractors, concessionaires, tenants, visitors, and community at risk;
2. Advice to all SHE legislation requirements, government policies and other requirements relevant to the development and operation of the Coega IDZ;
3. The development of an Environmental Questionnaire for completion by potential and operational tenants. This data is used as a guiding tool to assess and determine investor’s permit requirements so as to enable the support required; and
OPERATIONS MANAGEMENT
SECT
ION
04
SECT
ION
03
PER
FOR
MAN
CE IN
FOR
MAT
ION
THIS
IS C
OEG
AAD
MIN
ISTR
ATIO
N
C O E G A D E V E L O P M E N T C O R P O R A T I O N I N T E G R A T E D R E P O R T 2 0 1 6 / 1 7
* FACILITIESAND ESTATE
MANAGEMENT
CUSTOMS AND
LOGISTICS
COMMERCIALSERVICESSECURITY
SPATIALDEVELOPMENT
OFFICEMANAGEMENT
SAFETY, HEALTH,ENVIRONMENTAND QUALITY
INVESTORSERVICES
OPERATIONS
* COEGA,VULINDLELA
ACCOMMODATIONAND CONFERENCE
CENTRE (VACC)
SUSTAINING THE ENVIRONMENT: Nurturing plants at the Coega Nursery where rescued endemic plants are relocated.

80 81C O E G A D E V E L O P M E N T C O R P O R A T I O N I N T E G R A T E D R E P O R T 2 0 1 6 / 1 7
4. The building of a clinic in Zone 4 of the Coega IDZ. The clinic is manned by well qualified nurses and occupational health practitioners offering various services.
Spatial Development
Site specific planning is a key service which the CDC provides to its investors. Provision has been made in the Development Management Plan for a number of design review processes which ensure that site development and building plans are approved on time so that construction can begin.
Planning impacting on the IDZ occurs within four broad areas, i.e. Metropolitan, IDZ, Cluster and Site; and are aligned with metropolitan planning through the Integrated Development Plan (IDP) and Spatial Development Framework (SDF) of the Nelson Mandela Bay Municipality (NMBM). Within the IDZ, planning is framed by Revision 1 of the Development Framework Plan (DFP) of 2006 and is detailed at a cluster level through instruments such as the Coega East Master Plan (Zones 6, 7, 9, 10, 11 and 13) and zone specific layout plans.
Occupancy certificates for structures built in terms of approved building plans are issued by the NMBM with the Spatial Development Unit playing a coordinating and monitoring role. During 2016/17 financial year, six occupancy certificates for new investments were issued and building plans to the value of R99 210 352 were approved by the NMBM.
Coega Geographic Information System
The Coega Geographic Information System is developed and maintained by the SDU. The system is primarily desktop-based with a Geodatabase server maintained on the CDC intranet. During 2016/17, funding constraints affected the deployment of GIS technology as an ESRI Enterprise license could not be issued. This has since been remedied.
The “as built” infrastructure information that the GIS provides is of value to Facilities Management, SHEQ and Infrastructure personnel who are responsible for ensuring uninterrupted services to IDZ tenants.
The CDC has also continued to provide NMBM users with data updates. The process has continued for building the necessary logical and physical data structures required for a comprehensive Spatial Data Infrastructure (SDI) for the Coega IDZ. During the period under review, key layers such as Investors, Cadastral, Tenants and other Base Data layers have been maintained on an ongoing basis. Particular attention has been given to the capture of “as built” information of physical infrastructure in standardised GIS formats and good progress has been made with respect to core utilities layers such for sewage, water and roads.
Training in the use of geospatial technologies has continued with an active internship program, training to staff members
and support to GIS users within the CDC. During the period under review, three interns were successfully placed.
Drawing Management
Drawing Management has continued on an ongoing basis. A drawing register has been maintained, with all drawings issued by CDC-appointed consultants registered on the system. In 2016/17, the option of leveraging the drawing register into other CDC projects was pursued, but dedicated personnel resources are required in order to implement such expansion.
Challenges
The completion of construction of the additional Bed and Breakfast (B&B) units needed to accommodate large numbers of clients, has become urgent because of possible loss of business in the future.
The pilot project which brought security operations in the IDZ into the control of the CDC proved to be a challenge. It was decided to terminate the pilot and continue with the outsourcing of security services for the IDZ in order to maximise its operational efficiency.
Opportunities
There are opportunities arising from improving management competencies, establishing a substantial market and entering into contracts with government departments and private companies, especially for our commercial conferencing and accommodation facilities.
LOOkING AHEAD
The strategy for 2017/18 financial year is to implement innovative ideas in order to improve operations management of the IDZ, strengthen our value proposition in terms of turn-key one-stop-shop services to investors in the IDZ, thus improving operational efficiencies and maximising economies of scale for investors. Strong collaborative relationships with various arms of the business needs to be maintained, where required improved, in order to further strengthen the CDC’s value proposition to investors.
SECT
ION
04
SECT
ION
03
PER
FOR
MAN
CE IN
FOR
MAT
ION
THIS
IS C
OEG
AAD
MIN
ISTR
ATIO
N
VULINDLELA ACCOMMODATION AND CONFERENCE CENTRE (VACC): A view of the Vulindlela’s stylish accommodation, providing comfortable living for tenants and guests.

82 83C O E G A D E V E L O P M E N T C O R P O R A T I O N I N T E G R A T E D R E P O R T 2 0 1 6 / 1 7
The organisation has retained its Level 3 B-BBEE Certification, during this financial year, which was obtained in the 2015/16 financial year, under the revised codes. Prior to the revision, the CDC achieved Level 1 status.
Socio-economic transformation is also achieved through its extensive range of community empowerment programmes in support of the Coega Infrastructure portfolio. These programmes offer an extensive range of occupational skills training and social facilitation services.
The CDC’s commitment to transformation has also seen the launch and execution for Coega’s BEESIP (BEE Scorecard Improvement Programme) which assists 100% black-owned
and black women-owned enterprises to improve their B-BBEE status levels. Over the past two years, 600 black companies have benefitted from this programme and obtained a Level 1 B-BBEE Certificate. An outcome is that the CDC now has a valid and active pool of 600 level 1 black-owned companies it can tap into for a range of services.
However, the CDC remains challenged in terms of occupational level based transformation particularly in relation to gender balance. The 589 staff are made up of 53.31% men and 46.68% women across the different occupations and races. This analysis excludes the 66 Interns, who reflect the opposite imbalance with 60:40 between women and men.
The CDC headcount of employees is 589 for the final quarter of the 2016/17 financial year. Showing a gradual decline from the end of the previous financial year of 774. The total headcount as at 31st March 2017 is sitting at 655 including 66 interns and 21 temporary employees.
The overall headcount has continued to reduce and this is attributed to the following factors:
a) A concerted effort to manage the headcount through termination of fixed term contracts whose term was due to end over the past four months with minimal loss of critical skills;
b) Acceptance of employee turnover on non-critical skills sets which were equally lacking the requisite strategic fit and competences;
c) Suspension of non-critical appointments, particularly where there is capacity to stretch and grant further developmental exposure on existing resources;
d) Non-replacement of interns upon termination of contracts or securing employment external to the CDC; and
e) Strategic review and consolidation of positions particularly where roles have become redundant.
LOOkING AHEAD
CDC remains committed to the empowerment principles prescribed by the amended B-BBEE Codes of Good Practice. CDC will strive to regain and maintain its B-BBEE Level 1 status as determined by the new B-BBEE scorecard. The organisation will continue to be a leader in and an example for effective economic transformation and the implementation of programmes guided by the amended B-BBEE Codes of Good Practice. The organisation will also continue to strive for women development and transformation in general.
These imbalances have been targeted for interventions because a lack of gender transformation, especially in senior management, will continue to affect the overall B-BBEE rating for the CDC. These targeted interventions for women development and transformation in particular are required to ensure that the overall objectives are achieved.
CDC Headcount
The CDC organisational structure consists of three main divisions/programmes as provided in the Strategic Plan and
Corporate Plan approved by the Board and Executive Authority:
(i) IDZ Investment Services(ii) Central Support Services(iii) External Consulting Services
The breakdown of the headcount between these divisions at 31st March 2017 is as follows:
IDZ Investment Central Support Services External Consulting
203 237 149BUSINESS STAKEHOLDER ENGAGEMENT: A Business Stakeholder Engagement session for the Nelson Mandela Bay Business Community updating them on project developments and business opportunities at the CDC.
BROAD-BASED BLACK ECONOMIC EMPOWERMENT
SECT
ION
04
SECT
ION
03
PER
FOR
MAN
CE IN
FOR
MAT
ION
THIS
IS C
OEG
AAD
MIN
ISTR
ATIO
N
MALE FEMALE FOREIGN NATIONAL
GRAND TOTAL
Occupational Category African Coloured Asian White Total African Coloured Asian White Total Female Male
Top Management 1 0 0 0 1 0 0 0 0 0 0 0 1
Senior Management 13 2 0 2 17 3 0 0 1 4 0 0 21
Prof Qualified & Experienced Specialist & Mid- Management
38 14 3 22 77 31 3 3 4 41 1 2 121
Skilled, Academic, Junior Management, Supervisors, Foremen & Superintendent
65 15 1 12 93 58 8 1 5 72 1 2 168
Semi-skilled & Discretionary Decision Making
101 9 0 0 110 129 11 0 2 142 0 0 252
Unskilled and Defined Decision Making
0 0 0 0 0 5 0 0 0 5 0 0 5
Total Permanent 218 40 4 36 298 226 22 4 12 264 2 4 568
Temporary Employees 7 1 0 3 11 7 1 0 1 9 0 1 21
GrAnd TOTAL 225 41 4 39 309 233 23 4 13 273 2 5 589
CDC Employment Equity Profile - 31st March 2017:

84 85C O E G A D E V E L O P M E N T C O R P O R A T I O N I N T E G R A T E D R E P O R T 2 0 1 6 / 1 7
When an investor chooses to be part of the CDC, a contributing factor is often the added value provided by the Coega Human Capital Solutions (HCS). The provision of adequately skilled staff in response to investor requirements and the assurance of labour stability on the Coega IDZ, are important selling points for the region.
The CDC has taken the decision not to follow the international trend of low wage labour models apparent in most other Export processing Zones (EPZ’s) in the developing world. Instead, the Coega labour management model achieves a better competitive outcome by combining decent work and wages with high skills and labour productivity, thereby producing better labour cost outcomes than low wage / low productivity destinations.
Labour stability is achieved through a unique and first-of-its-kind collective instrument, the Zone Labour Agreement, and has consistently produced a level of labour stability on the Coega IDZ that is unprecedented elsewhere in South Africa, whilst simultaneously providing labour flexibility and worker protection. Unsurprisingly, the Coega IDZ was named by the Fair Trade Commission of the International Labour Organisation as an example of international best practice on mega construction projects.
The Coega HCS also provides an extensive database of occupational skills training and social facilitation services as it hosts the Gateway to Opportunities (G2O) (www.g2o.co.za) - a massive database of Nelson Mandela Bay’s skills pool that grew from 275,469 in the 2013/2014 financial year to 353,746 in the 2016/7 financial year. The database has evolved from just being a desk-top application that provides skilled workers for construction projects in the Coega IDZ to a web enabled portal to recruit people with a unique set of skills for the investors operating in the Coega IDZ and beyond. G2O has been integrated with Twitter, LinkedIn, and Facebook to allow job seekers to access their targeted job opportunities instantly.
Backed by the mobile simulator fleet and mobile labour offices, HCS is able to operate anywhere, as all its systems and facilities are now portable.
Programme Activities
CDC has introduced new and innovative ways to ensure that the local community has a fair and equal chance of working on projects it delivers on behalf of the Eastern Cape Provincial Government. To manage infrastructure development projects, the Ncedo labour management system has been developed and is used on multiple sites. Ncedo provides a complete overview of labour matters in cases of large and geographically dispersed projects; and also draws off the G2O database for suitable candidates in the area.
The effective Social Facilitation services provided by HCS enabled the preparation, establishment and maintenance of an environment conducive to construction on each project, whilst also ensuring that possible local socio-economic benefits associated with each construction project were maximised. In
addition, the Coega HCS provides social facilitation and labour management support to the National Department of Public Works projects in the Eastern Cape where a further 189 job seekers found employment opportunities.
Since its inception, Coega Human Capital Solutions has achieved the following results:
• Through the course of the past financial year, no instances of lost time through labour strike action were experienced on the Coega IDZ;
• The total lost time through labour strike action experienced since commencement of construction in 2002 to date is 0.12%, against a South African construction industry best practice benchmark of 2.5% time lost. What is notable is that the Coega projects and IDZ managed to retain this exceptional labour stability rate over the past 15 years, despite the national increase in both occurrence and intensity of labour instability currently plaguing the country. This is truly a world-class best practice and the result of implementing and maintaining effective labour management protocols and enhanced stakeholder management, particularly with organised labour; and
• In partnership with the dominant IDZ trade union, the National Union of Mineworkers, a successful week-long Shop Steward Capacity building workshop was conducted through the course of the past year, which directly benefited 25 participating Shop Stewards. These proactive developmental initiatives contribute to the labour stability, which continues to be experience on the Coega IDZ.
In addition to the 7 243 people currently enjoying employment with operational investors in the Coega IDZ, a further 417 new employment opportunities were created in the 2016/17 financial year as a result of new investors choosing to locate on the Coega IDZ.
Thirty two principal construction contractors were employed on the NMBLP, IDZ and Port during the year. Their employment peaked at 3 198 construction personnel, 87% of which were local residents of Nelson Mandela Bay. The mobilisation of contractor employees required the administration of 4 299 medical assessments for entry, periodic and exit medicals for the year. IDZ inductions were undertaken with all personnel.
The Coega HCS continues to provide targeted recruitment and skills development in support of investor requirements. A total of 6 697 unemployed people benefitted from the Coega HCS training programmes over the past year which represents an achievement against target of 27%. A unique new project was the facilitation of the work readiness programme undertaken for new work seekers. This was run over three days and introduced over 400 work seekers to the world of work and the need to be prepared.
HUMAN CAPITAL SOLUTIONS
SECT
ION
04
SECT
ION
03
PER
FOR
MAN
CE IN
FOR
MAT
ION
THIS
IS C
OEG
AAD
MIN
ISTR
ATIO
N
COEGA WELLNESS CENTRE: Administered 4 299 medical assessments for entry, periodic and exit medicals of contracted employees.
Youth Development Initiatives and Career Days
The Coega HCS participated in numerous initiatives to address youth unemployment and careers guidance programmes. The Working World Exhibition, held annually in Port Elizabeth is the premier event for career support for matriculants in the Sara Baartman district. Career Exhibitions were held in Motherwell, Uitenhage and Zwide at various times during the year where the exposure of scholars and unemployed youth into bursary opportunities, multiple career choices and business opportunities and the target audience for is the scholars and Unemployed Youth. In the rural areas the Coega HCS supported events in Mthatha, Butterworth and Coffee Bay during the year.
Stakeholder Engagement
The Coega HCS team has effectively engaged local community structures through its social facilitation interventions to establish and manage Project Support Committees for every project undertaken to date. The impact on keeping communities abreast of project developments has ensured the socio-economic promises made to communities are realised.
In addition, Coega HCS continues to support its external partners in promoting socio-economic development. Coega HCS has completed the Maritime Skills forecast, the results
of which was shared with stakeholders in the Eastern Cape, a study on the economic benefits that could arise from the planned nuclear development at Thyspunt, and the Eastern Cape Strategic Infrastructure Projects (SIPS) labour absorption forecast for the Office of the Premier in support of the National Development Plan. In addition ongoing support is being given to the Nelson Mandela Bay Composites Cluster and the Eastern Cape Tooling Cluster.
LOOkING AHEAD
HCS will continue to work closely with all strategic stakeholders, including investors in order to meet the objectives of the CDC. One of the challenges is demand for specialists skills. To this end, HCS has been working closely to strenghten the relationship with local education institutions in order to harness the right skills for the labour market in the IDZ. In addition, the 16 new investors signed during the period under review will require skills, some of which may not be available in the Metro and region. As a result, NMMU and other institutions of higher learning have been made aware of the skills requirements, including Maritime skills for shipping and logistics companies in the IDZ. The University and the CDC has an existing MoU which is aimed at fostering collaboration between the two parties in the field of teaching and learning and research.

86 87C O E G A D E V E L O P M E N T C O R P O R A T I O N I N T E G R A T E D R E P O R T 2 0 1 6 / 1 7
SMME DEVELOPMENT
SMMEs are widely recognised as holding the key to economic growth in South Africa. It is the employment opportunities that they provide that lead to inclusive economic growth and sustainable employment.
A study commissioned by the Small Enterprise Development Agency (Seda) in late 2016 showed that there were 2 251 821 SMMEs in South Africa. Of these, 667 433 were in the formal sector, with 34% of those black-owned. Just over 13% operate in the construction sector.
According to Statistics SA, the number of SMMEs in the Eastern Cape has dropped from 218 865 in 2008 Quarter 1 to 197 366 (2015 Quarter 2). Significantly, their contribution to GDP has increased, from just under R1 million per SMME in 2008 to close to R1,25 million per SMME by 2013.
SMME development remains an important strategic priority of the CDC. A number of policies are in place to facilitate and promote access to procurement opportunities within the CDC. In the period under review, the SMME procurement spend exceeded the target of 36% by 6%. This translated to a Rand value for the 2016/17 financial year of R831,8 million payments towards SMMEs in the supplier database against a CDC Procurement Spend of R2,2 billion.
Established in 2016, the CDC has a dedicated SMME Development Unit which facilitates programmes related to the development and support of SMMEs.
The CDC has pursued a number of initiatives which prioritise empowerment, unlock opportunity and talent and stimulate the local economy – particularly in the infrastructure, construction and built environment sectors. The CDC has made major headway in creating empowerment opportunities derived from the contracts awarded by the CDC, based on the empowerment criteria of:
• Broad-Based Black Economic Empowerment (B-BBEE); • Women Empowerment Ownership (WEO); • Small Medium Micro Enterprises (SMMEs); and • Local Empowerment Participation (LEP).
A number of successful projects were undertaken with SMMEs during the period under review. The projects contributed to the measurable, positive impact that the CDC has had on the region as a whole.
Eight projects that were given to the CDC by the National Department of Health contributed to better access to
appropriate health services for local communities. The Maxwele Clinic, a R24 million project, was built with the help of 52 local residents, who together benefited with 35% of the project value.
The clearing of the BAIC site saw 11 SMMEs from the Nelson Mandela Bay Metropolitan Area, including two women-owned companies, given work packages valued at more than R17 million.
Another four SMMEs were awarded the contract to supply fencing for the Customs Control Area in Zones 1 and 2 of the IDZ. This project is putting R5 million into the local coffers.
SMMEs will benefit in the next financial year from projects in the BAIC infrastructure, managed by the CDC. These include:
• Ring Road (Design) – on procurement (SMMEs to be allocated 36.25% of project value);
• Electrical 132kv Line (Tender) – Design & Construct to be allocated 38% SMME packages for the construction component post tender; and
• Fire Water Supply (Design) – on procurement (SMMEs to be allocated 36.25% of project value).
The SMME procurement target is to achieve 40% of procurement spend on the SMMEs by 2019/20.
LOOkING AHEAD
Compared to the rest of Africa, South Africa is lagging behind in terms of entrepreneurship activity. As a country, we already have a number of government-supported policies, strategies and programmes which encourage entrepreneurship, and with the support of positive procurement policies by organisations such as CDC, the meaningful participation of sustainable SMMEs in our economy will increase. The 2016 Seda report showed that the turnover among SMMEs in the construction sector had grown by 99% between December 2010 and March 2015. In Real Estate and Business Services the increase was an astonishing 204% over the same period. In spite of the fact that the growth in the number of SMMEs has proved to be lower than the economic growth rate of the country, the contribution of SMMEs to GVA increased over the same period. This is a clear indication that the procurement opportunities of the CDC, among others, is paying dividends.
SMME DEVELOPMENT: CDC is actively involved in supporting sub-contractors and SMMEs through skills development.
DEVELOPMENT, EMPOWERMENT & TRANSFORMATION
SECT
ION
04
SECT
ION
03
PER
FOR
MAN
CE IN
FOR
MAT
ION
THIS
IS C
OEG
AAD
MIN
ISTR
ATIO
N

88 89C O E G A D E V E L O P M E N T C O R P O R A T I O N I N T E G R A T E D R E P O R T 2 0 1 6 / 1 7
The External Services programme is made up of several revenue generating sub programmes that are aimed at creating and achieving organisational self-sustainability. The job creation indicator is the outcome of the various sub-programmes which are the majority contributor to the KPI. The CDC’s external
programmes are a significant contributor to the revenue generation aimed at organisational sustainability, as depicted below. Other notable outputs of the external programmes include skills development and contributions to project maturity.
Revenue generation for External Services was higher than expected in this financial year due mostly to projects for the ECDOH. This resulted in the budget being exceeded by a positive variance of 44%. Additional income was also generated by emergency projects undertaken for DOE/DSRAC.
The number of construction jobs created exceeded the target in spite of many of the external programmes facing major funding challenges. The success is attributed to a number of new projects established, particularly from the National Department of Public Works.
Key challenges faced by External Services are:
• Some of the clients are not paying the CDC on time which has a negative impact on the cash flow of the organisation. The CDC has approached the EC Provincial Treasury to intervene;
• The decrease in the allocation for the PTIP portfolio leading to a reduction in revenue;
• The DOH Facilities Programme came to an end in the financial year. The costs currently being incurred relate to the close-out of the programme;
• EDU had also come to an end in the financial year. The costs thus being incurred is to close out the programme. However, the costs will be recovered from the client; and
• Department of Public Work Mthatha Programme has been experiencing delays with the transfer of funding to CDC.
Shared Services
Shared Services (SSU) provides the efficient delivery of support services required by external services and the business units that support them.
Shared Services was established in 2013 with the aim of:
• Providing administrative support to the business’s implementing projects;
• Ensuring that all the Project Management documentation is uploaded on the developed systems (EDMS) and assists with the maintenance thereof;
• Assisting with meaningful archiving of the Project Management documentation, following the archiving protocols;
• Supporting Programmes’ client interactions and ensuring integrated product offering;
• Assisting with the adjudication of the procurement/CRC submissions from Programmes;
• Coordinating provision of support services (Legal, Finance, Audit, SHE, Procurement) to Programmes;
• Providing Relationship management between business divisions and Programmes;
• Measuring performance and productivity (HR, Finance); and• Generating revenue by offering consulting services to
external clients.
Shared Services currently has three clients: the EC Department of Health (ECDoH), the Mpumalanga Economic Growth Agency (MEGA) and the Chris Hani Development Agency (CHDA).
The achievements of Shared Services are outlined below:
Shared Services helped the CDC to achieve a 3.34 Project Maturity Audit Score for the period under review by establishing support mechanisms that promoted and optimised the effective use of project management systems. It plays a critical role in audit preparation and coordination by uploading of all paid invoices to EDMS, thus freeing the project managers and project administrators to focus on the core delivery of the projects.
During the 2016/17 financial year, SSU spearheaded the revision of the EDMS project file structure to bring it in line with the APM2 requirements.
LOOkING AHEAD
With the poor economic outlook for the region, and the threat of downgrades by credit ratings agencies, external revenue generation may face increased pressure in the next financial year. Government departments, especially Public Works, may delay the implementation of infrastructure projects due to the austerity measures announced earlier this year by the then Finance Minister, Mr Pravin Gordhan. Counterbalancing this is the positive growth in the IDZ, as the investment destination of choice, which has been delivering excellent results and value to shareholders.
EXTERNAL PROGRAMMES
SECT
ION
04
SECT
ION
03
PER
FOR
MAN
CE IN
FOR
MAT
ION
THIS
IS C
OEG
AAD
MIN
ISTR
ATIO
N
Key Performance Area 2016/17 TargetAnnual
Performance 2016/17
Variance
Strategic Objectives to Goal 2: fINaNCIal SuStaINabIlIty aND GROwth: Diversify and grow the CDC income streams to a sum of R2,47 billion by 2019/20
Revenue Generation R139,8 million R201 million +44%
Strategic Objectives to Goal 3: aDvaNCe SOCIO- eCONOmIC DevelOPmeNt: Realise 61,772 Jobs from all spheres of CDC operations by 2019/20
Number of Construction Jobs 7,515 7,913 +5%
SOD TURNING: The commencement of the Hamburg Clinic construction, a R26.5 million project implemented by the CDC on behalf of the Department of Health.
document Support CmO CSS SSU Consulting Projects
Uploaded 99% of all 2016/17 FY paid invoices on EDMS
Complaints Management Policy and Procedure
Signed Support Services BU/Programmes SLAs
Mega Project - SEZ Application and Feasibility Study (R1m revenue achieved) Inkomazi SEZ
97% of Jobs Validated were verified by Internal Audit
Complaints Management Committee Terms of Reference
SSU PrgD & External PrgD Meeting
Steve Tshwete SEZ Feasibility Study
84% of 2016/17 Procurement Documentation available
Updated Complaints Register
Establishment of New Programmes Framework
CHDA Komani Industrial Park Master Plan
Revised EDMS File Structure to align to APM2
Investigation and resolution of Complains
Review of Operating Models for BUs
DoH Project Accounting & Administration
Automation of the invoice approval and capturing process
Submission of Complaints Report to EXMA
Review operations of CDC Satellite Offices

90 91C O E G A D E V E L O P M E N T C O R P O R A T I O N I N T E G R A T E D R E P O R T 2 0 1 6 / 1 7
INTRODUCTION
Corporate Sustainability refers to the long-term strategy of an organisation for continued operations into the future, taking into consideration every dimension of how a business operates in the social, cultural and economic environment. The Sustainability targets have been set for the next 5 years and since the inception there is progress to-date. The Coega Development Corporation (CDC) intends to publish the Corporate Sustainability Report according to the guidelines of the Global Reporting Initiative (GRI) not later than 2020. The CDC has become increasingly aware of the need for and benefits of socially responsible behaviour. The objective of social responsibility is to contribute to sustainable development adopting the implementation of the ISO 26000 standard. A Sustainability Conceptualisation report has been completed and the purpose of the report was to look at the organisation’s current status comparing it with ISO 26000 standard which identifies seven core subjects that socially responsible organisations should address to assist in contributing to sustainable development. The seven elements are organisational governance, human rights, labour practices, consumer rights, the environment, community involvement and development and fair operating practices. It was concluded that only six out of the seven elements of ISO 26000 are applicable to the CDC and this is due to the nature of the organisations business. The consumer issues are not applicable to the CDC. In this regard, the CDC is guided by SANS 26000:2010 standard for the implementation of the Sustainability. The CDC then used the South African National Standards (Guidelines on Social Responsibility) to determine what is applicable or not. The organisation further progressed and identified gaps between planning and implementation of sustainability in the organisation especially when it comes to projects implemented. Additional to that the CDC has implemented a sustainability report framework (plan, do, check, improve, cross-check). The framework has assisted the CDC to develop a Sustainability Management Plan based on PRiSMTM (Projects Integrating Sustainable Methods). Sustainability based project delivery incorporates tangible tools and methods to manage the balance between finite resources, social responsibility, and delivering “green” project outcomes. This concept was assessed by PM Academy for the financial year 2016/17 and the organisation has performed remarkably well.
EIAs
1. Currently there are 10 EIAs being conducted for new developments in the Coega IDZ. The developments include a 440 ha aquaculture development zone, marine pipeline infrastructure to serve investors that require seawater, a gas-to-power generation project, a new wastewater treatment works and associated bulk sewer, a galvanising
plant, a fuel tank farm, a non-ferrous metal recycling facility, a poly-aluminium chloride production facility and the expansion of an existing operational steel smelter.
2. The CDC’s Aquaculture Development Zone EIA is an important step towards facilitating aquaculture in the IDZ. By conducting an EIA for the establishment of an ADZ, will greatly facilitate the establishment of aquaculture investments in the IDZ and thereby create much-needed employment.
3. The CDC is awaiting a decision from the National Department of Environmental Affairs on the issuing of the environmental authorisation and waste license for a new Regional Waste Management Facility in the Eastern Cape. This is a strategic project which the CDC has been involved since the early 2000’s.
Highlights
1. SHEQ’s vigorous implementation of our Air Quality Management Programme for the IDZ, consisting of an Air Dispersion Model and the monitoring & maintenance of the 3 air quality stations in the IDZ has gained nationwide applause. This was highlighted at the Annual Air Quality Lekgotla held in Nelspruit in October 2016. These activities provide key information to the CDC and allows effective management of air quality in the IDZ. Licensing authorities that issue air emissions licenses and other environmental permits consult the CDC’s Air Dispersion Model to enable decision-making for applications in the IDZ. To date, there have been no incidences of the National Ambient Air Quality Standards in the IDZ.
2. As part of the CDC’s Corporate Social Investment Programme, which supports the Animal Welfare Society (AWS), the CDC conducts the annual air quality monitoring and reporting for the AWS, in support of their Air Emissions License.
3. The CDC’s rehabilitation programme in the IDZ is progressing. Plants that are identified and rescued from construction areas are used in the rehabilitation of degraded areas in the IDZ. An area of approximately 3 ha has been rehabilitated during the 2016/2017 FY.
4. Plants from the Coega Nursery are also used in the landscaping of identified areas in the IDZ. The landscaping of the new Customs Entrance into Zone 2 of the IDZ was completed using plants from the Nursery and from the site that was cleared for the new BAIC project. The CDC also assisted General Motors, one of our investors, with a landscaping project on their premises in Zone 1. As a result of this project, GM received certification from the Wildlife Habitat Council in November 2016.
5. Alien Plant Eradication: The Coega Development Corporation has been implementing an Alien Plant Eradication program since 2004 in order to fulfill the conditions of the environmental authorization for the change in IDZ land use from agricultural to special purposes. This is an on-going program which aims to improve the habitat within the Open Space System, the maintenance of operational areas within the IDZ, as well as providing jobs for local SMME’s. The benefits of the program are the adherence to the legislated requirements and actual eradication of invasive alien plant species that negatively impact on the ecological process. The Coega Development Corporation successfully cleared and eradicated various types of alien plant species over a 272 ha piece of land within the Coega IDZ that created 22 job opportunities as part of the project.
6. The CDC offers clinic services to all CDC employees, IDZ
contractors Port & External contractors and also manages the corporate wellness programme. The services includes pre-placement Medical Evaluations, periodic medical, and return to work medical surveillance. Though its effort and ensuring compliance the CDC clinic is now accredited for the medical evaluations of South African Maritime Safety Authority (SAMSA).
On average the CDC Wellness Centre processes about 450 clients monthly. The last financial year World AIDS Day which is one of the most successful events was commemorated on the 25th November 2016 at the Vulindlela Accommodation and Conference Centre with the theme being “IT’S IN OUR HANDS TO END HIV & TB”. There were a total of thirteen soccer teams and two netball teams who competed against each other. A total of 214 attendees were registered on the day. A total of R6 200 worth of vouchers were given out on the day.
SUSTAINABILITY REPORT
SECT
ION
04
SECT
ION
03
PER
FOR
MAN
CE IN
FOR
MAT
ION
THIS
IS C
OEG
AAD
MIN
ISTR
ATIO
N
C O E G A D E V E L O P M E N T C O R P O R A T I O N I N T E G R A T E D R E P O R T 2 0 1 6 / 1 7
IT’S IN OUR HANDS TO END HIV & TB: As the theme of the World AIDS Day event held at the Vulindlela Accommodation and Conference Centre where 214 people attended.

92 93C O E G A D E V E L O P M E N T C O R P O R A T I O N I N T E G R A T E D R E P O R T 2 0 1 6 / 1 7
SECT
ION
04
SECT
ION
03
PER
FOR
MAN
CE IN
FOR
MAT
ION
THIS
IS C
OEG
AAD
MIN
ISTR
ATIO
N
SAFETY FIRST: Construction underway on the Hamburg Clinic, Eastern Cape.
Integrated Management System (IMS)
The purpose of the CDC’s IMS is to support the business so that processes, services and systems consistently and effectively meet customer expectations and applicable regulatory legal requirements as well as the provision of mechanisms for continual improvement. The external audit was conducted in April 2016 for the re-certification of ISO 9001:2015 Quality, ISO 14001: 2004 Environmental, and Occupational Health and Safety Act 85 of 1993 and Regulations 18001: 2007.
The CDC received clean audits in all four Standards. The CDC is the only parastatal to have been awarded the new Quality Standard certification.
ISO 9001 – Quality Management Systems introduced a new version, 2008 is now 2015 which focuses on clauses that guide the organisation to perform beyond the expected standard.
The clauses include the following:
1. Customer focused organisation – Understand current and future customer needs and expectations. Measure customer satisfaction and act on it.
2. Process Approach – Establish, control and maintain documented processes forming a network of various processes, where each process consists of Inputs, Outputs, Activities, Management and Enablers.
3. System approach to management – Understand independencies, aligns processes goals and targets. Measure results against key objectives.
4. Continual Improvement – Set realistic and challenging improvement goals, provide resources, provide tools opportunities and encouragement to contribute to continual improvement of the process.
5. Factual Approach to decision making – Decisions are action bases on the analyses of data and information to maximize and minimize productivity and minimize waste and rework. Minimize costs, improving performance and market share through the use of suitable tools and technology.
The opportunities are mitigating risks throughout the organisation and all levels working with the same standardisation. The key focus in this financial year is to ensure compliance with the four Standards for which the CDC is currently certified. Providing a platform of transparency and working side by side with all levels within CDC. Moving forward ISO 14001:2015 will be implemented and certified.
Current financial year – Internal and External audits conducted
Total non Conformances Per BU
Business Unit Total
Business Development 9
CDC Services 19
Centre of Excellence 4
CEO's Office 27
Total non Conformances Per BU (continued...)Business Unit Total
Corporate Services 19
DoH Facilities 1
Finance 28
Human Capital Solutions 14
Infrastructure Development 8
IT Support 1
Logistics Park 5
Operations 485
PTIP:ISIDP 1
Safety, Health and Environment 180
Shared Services Unit 1
Challenges
Obtaining timeous responses from environmental authorities in assisting investors can often cause delays.
LOOkING AHEAD
Corporate Sustainability is implemented as part of the long-term strategy of an organisation for continued operations into the future, taking into consideration every dimension of how a business operates in the social, cultural and economic environment. The Sustainability targets have been set for the next 5 years and since the inception there is progress to-date.
The PM Academy conducted an audit during the 2016/17 financial year considering the minimum essential building blocks in support of the implementation of the Sustainability Adapted from UN Guidelines. Minimum essential building blocks were considered to provide entity context in support of the implementation of the Sustainability Report Framework along with a description of their relevance to the delivery of environmental and social sustainability measures, and potential resource implications.
A Sustainability Framework for the organisation needs to be maintained and implemented looking ahead to enable a holistic approach throughout the organisation and integration at project levels. The observations and proposed solutions stated above based on audit conducted by the PM Academy must be implemented to assist the organisation to improve its performance for the 2017/18 financial year.

94 95C O E G A D E V E L O P M E N T C O R P O R A T I O N I N T E G R A T E D R E P O R T 2 0 1 6 / 1 7
As CDC reaches the successful completion of the second year of the 2019/20 Corporate Strategy, it is able to look ahead with some confidence, in spite of the continued weakening of the economy and the associated challenges to CAPEX funding for Capital Projects in the Coega IDZ.
The CDC plans to sustain its growth in investors to realise 50 operational investors by 2019/20 financial year. After a very successful 2016/17, where 40 operational investors were obtained, this goal is clearly within the CDC’s reach.
It is important to bear in mind, however, that the South African economy continued to weaken during the 2015 and 2016 financial years, with the economic growth having been revised from 3% to well below 1% in 2016, narrowly escaping recession. In 2017, the economists’ forecasts were for growth of no more than 1.5%, while the outlook by the International Monetary Fund (IMF) was even lower, at less than 1%. National Treasury was a little more optimistic, pegging its growth estimate at 1.3% for the year, improving to 2% in 2018 and 2.2% in 2019. The World Bank forecast for 2017 was economic growth of between 0.8% and 1.1%; the bank warned that the deterioration of the South African growth outlook in 2016 was both dramatic and rapid and, in fact, at the beginning of 2017 the country had slipped
into a technical recession.
Given the country’s fiscal budget constraints and subsequent austerity measures, CAPEX funding required for the implementation of Capital Projects in the Coega IDZ could prove to be a challenge in 2017/18. With the fiscal deficit running close to 4% of GDP, with debt close to 50% of GDP and only stabilizing by 2018, and with contingent liabilities of State-owned enterprises (SoEs) increasing, the levels of debt in South Africa have remained high and could negatively influence government spending on mega projects.
However, according to the Treasury, there is an expected budget deficit of 3.1% of GDP for 2017/18. In addition, government debt is expected to stabilise at about 48% of GDP.
The implication of these factors is that CAPEX projects’ funding for the SEZ will decline. The fiscal austerity has significant implications for OPEX budget for the CDC, which has continued to decline to zero during 2015 and 2016/17.
Notable transformational projects that are planned for the next financial period and beyond that would require funding are listed in the table below.
OUTLOOK
SECT
ION
04
SECT
ION
03
PER
FOR
MAN
CE IN
FOR
MAT
ION
THIS
IS C
OEG
AAD
MIN
ISTR
ATIO
N
# Project name description Investment Value
Jobs (indirect)
1 CCGT - Power Station DoE led Gas to power programme (3126MW+ 600MW) R 40 bn 8 140
2 Renewable Energy Renewables R 2.8 bn 2 500
3 Stainless Steel Thin Strip Mill Metallurgy R 0.5 bn 5730
4 Project Mthombo Oil Refinery R 100 bn 24 000
5 Aquaculture Complex Aquaculture Development Zone – 448 ha R 2 bn 5 605
6 Manganese export & Rail Upgrade Mn export capacity from 5.5 to 16mtpa. Rail upgrade R 27 bn 5 000
7 Kalagadi Manganese Smelter Manganese Smelter for beneficiation of SA minerals R 4.2 bn 1 500
8 Biodiesel Plant Clean Fuels, Environmentally Friendly R 3.5 bn 25 200
9 Return Effluent Recycled water for industrial use R 1.2 bn 1 500
While it is true that the performance of the CDC is at 101% of its target after less than half of the five year period, it is also clear that it is going to be very difficult to sustain the current performance without sufficient funding; the implications are serious for the socio-economic development of the NMBM and Eastern Cape economies, in terms of job creation, SMME development and support, and training and development.
Without government funding, the solution lies in the continued diversification and the pursuit of alternative revenue streams.
Therefore, the CDC will continue to implement innovative solutions that deliver an improved and better service to tenants and investors in the IDZ as well as to our clients. However, the focus of the organisation remains on its immediate goal to improve financial sustainability in line with its five year corporate strategy 2019/20 as well as improving the efficiency and effectiveness of its operations.
CREATING JOBS: Construction underway at the R78 million ready mix concrete plant Kenako Concrete site. The plant, once in full operation, will create over 59 sustainable jobs.

96 97C O E G A D E V E L O P M E N T C O R P O R A T I O N I N T E G R A T E D R E P O R T 2 0 1 6 / 1 7
CONSOLIDATED ANNUAL FINANCIAL STATEMENTS
03
SECT
ION
04
SECT
ION
03
PER
FOR
MAN
CE IN
FOR
MAT
ION
THIS
IS C
OEG
AAD
MIN
ISTR
ATIO
N
COEGA’S INVESTMENT VALUE TOPPED R11,685 BILLION DURING THE 2016/17 FY
R11,685 BILL
ION
2016
2015
2017
R541,8SELF-GENERATED REVENUE
CFO’s Review 98Certificate by Company Secretary 98General Information 100Statement of Directors’ Responsibilities and Approvals 101Independent Auditor’s Report 102Directors’ Report 108Statement of Financial Position 110Statement of Profit or Loss 111Statement of Changes in Equity 112Statement of Cash Flows 113Accounting Policies 114Notes to the Consolidated Annual Financial Statements 124Detailed Income Statement 158

98 99C O E G A D E V E L O P M E N T C O R P O R A T I O N I N T E G R A T E D R E P O R T 2 0 1 6 / 1 7
The success of the Coega IDZ has been growing at a terrific pace. This is amid the strong economic head- and tailwinds, a changing legislative and political landscape in the Nelson Mandela Bay, and constrained trading conditions. CDC continued to exploit opportunities for financial optimisation, with the aim of adapting to the economic challenges it faces. Simply put, the CDC remained judicious in weathering these storms. In keeping to its mandate, the organisation over the past four years was able to grow tenants in the IDZ as well as secure double-digits new investments that will yield future revenues. Concerning the ongoing management of the IDZ operations, management remained prudent and by being parsimonious kept expenditure in check. Improvements compared to the previous financial year were noted in a number of areas; in particular revenue and other income which increased by 4% to R549 million, an operating loss which improved by 70.5% to R47,4 million, trade payables that decreased by 43.6% and an overall strengthening of cash flows.
Operating profit for the year before interest, taxation and fair value reserves including government grants (for capital projects), decreased to R171,2 million from R389,1 million in 2015/16. However, if grants and revaluation reserves are stripped out an operating loss of R47,4 million (2015/16: R166,4 million) has been sustained.
Improved billing and revenue collection and better expenditure management has seen an overall improvement in working
capital management. The cost containment strategy introduced during the previous year is paying dividends and will be adapted as necessary to ensure that the CDC remains sustainable. An unencumbered balance sheet has also seen net assets increase by R171,2 million.
Looking forward the strength of the CDC’s balance sheet must be exploited to ensure adequate resources are available to sustain the growth trajectory. The funding limitations remains a challenge and will have an impact on the delivery capacity of the CDC. Given CDC’s significant capital investment requirements, an objective will be to ensure long-term, reliable, diversified and efficient sources of funding. Another important goal will be to build the organisation’s flexibility to manage the various risks and exposures the CDC faces. Focus will thus be on finding suitable and appropriate solutions that will enhance the CDC’s performance and sustains its operations.
For the year ending 31 March 2017
Declaration by Company Secretary in terms of Section 268G (D) of the Companies Act. The Company has lodged with the Registrar all such returns as required of a private company in terms of the Companies Act, and all such returns are true, correct and up-to-date.
Menzi MbinaCompany Secretary
CFO’S REVIEW
CERTIFICATE BY COMPANY SECRETARY
Lionel Billings Chief Financial Officer
ENERGY DEVELOPMENT: The dti, DEDEAT, Office of the Premier, Provincial & National Treasury visit to Coega and the DEDISA Peaking Power Plant located in zone 13 of the Coega IDZ.
SECT
ION
04
SECT
ION
03
PER
FOR
MAN
CE IN
FOR
MAT
ION
THIS
IS C
OEG
AAD
MIN
ISTR
ATIO
N
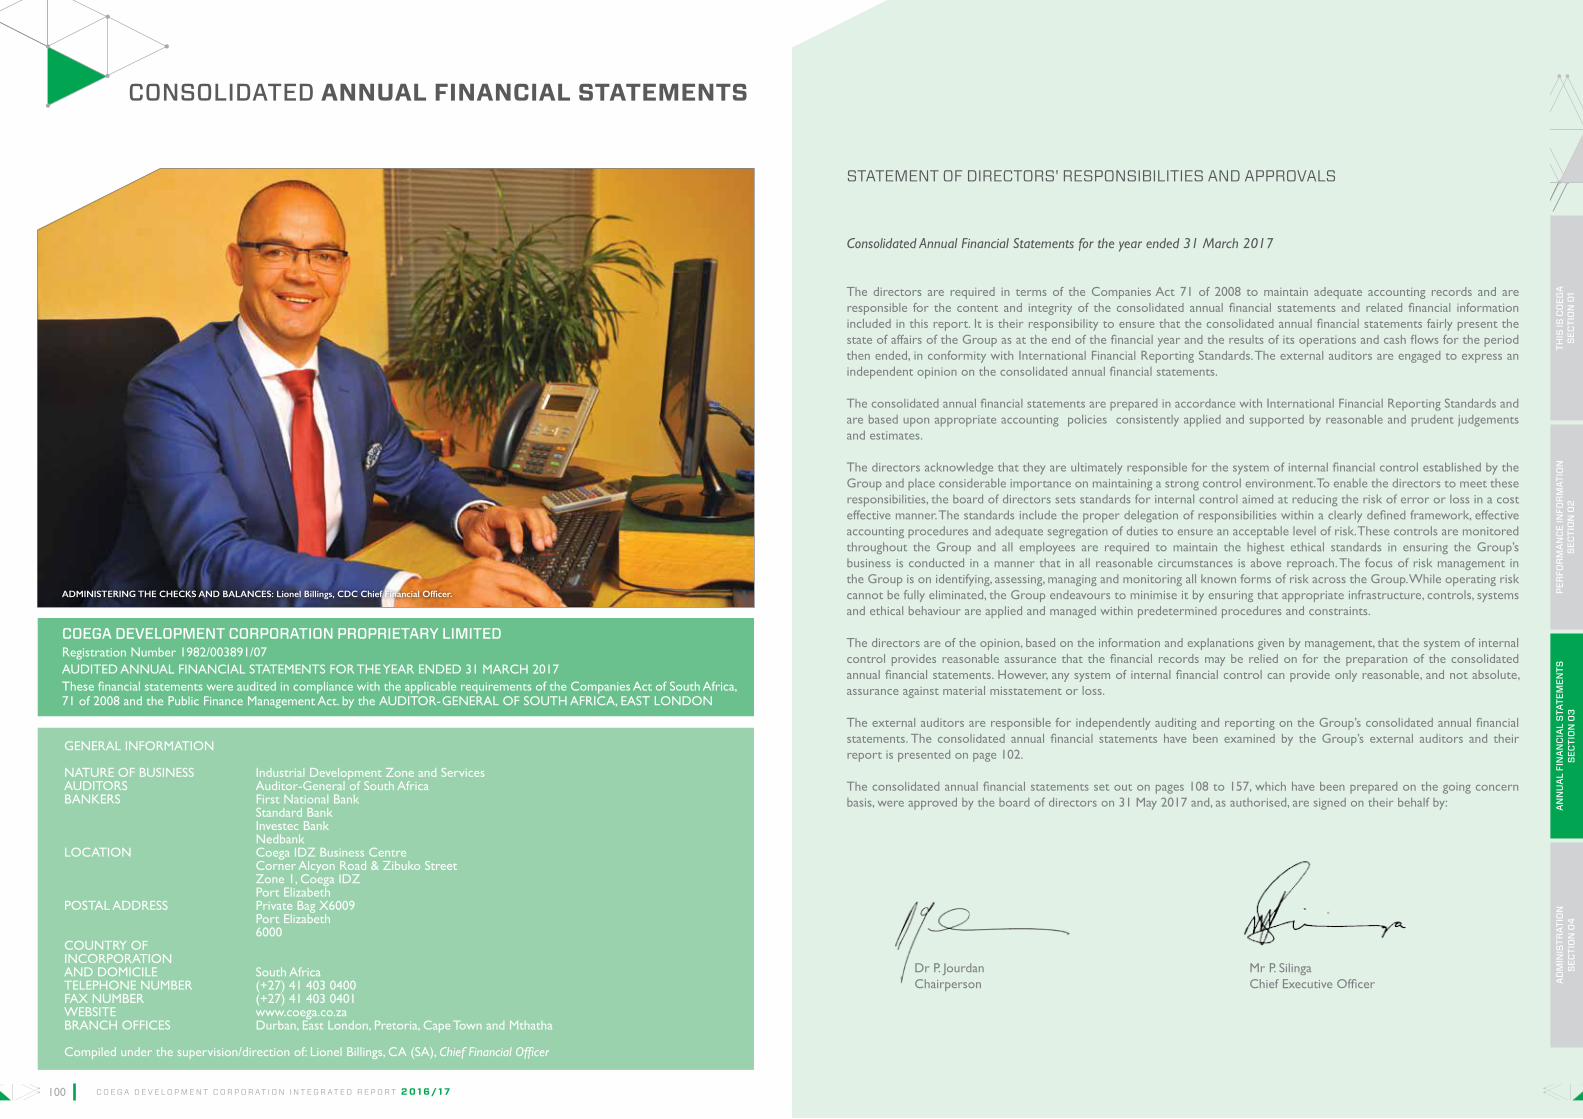
100 101C O E G A D E V E L O P M E N T C O R P O R A T I O N I N T E G R A T E D R E P O R T 2 0 1 6 / 1 7
COEGA DEVELOPMENT CORPORATION PROPRIETARY LIMITED
Consolidated Annual Financial Statements for the year ended 31 March 2017 The directors are required in terms of the Companies Act 71 of 2008 to maintain adequate accounting records and are responsible for the content and integrity of the consolidated annual financial statements and related financial information included in this report. It is their responsibility to ensure that the consolidated annual financial statements fairly present the state of affairs of the Group as at the end of the financial year and the results of its operations and cash flows for the period then ended, in conformity with International Financial Reporting Standards. The external auditors are engaged to express an independent opinion on the consolidated annual financial statements.
The consolidated annual financial statements are prepared in accordance with International Financial Reporting Standards and are based upon appropriate accounting policies consistently applied and supported by reasonable and prudent judgements and estimates.
The directors acknowledge that they are ultimately responsible for the system of internal financial control established by the Group and place considerable importance on maintaining a strong control environment. To enable the directors to meet these responsibilities, the board of directors sets standards for internal control aimed at reducing the risk of error or loss in a cost effective manner. The standards include the proper delegation of responsibilities within a clearly defined framework, effective accounting procedures and adequate segregation of duties to ensure an acceptable level of risk. These controls are monitored throughout the Group and all employees are required to maintain the highest ethical standards in ensuring the Group’s business is conducted in a manner that in all reasonable circumstances is above reproach. The focus of risk management in the Group is on identifying, assessing, managing and monitoring all known forms of risk across the Group. While operating risk cannot be fully eliminated, the Group endeavours to minimise it by ensuring that appropriate infrastructure, controls, systems and ethical behaviour are applied and managed within predetermined procedures and constraints.
The directors are of the opinion, based on the information and explanations given by management, that the system of internal control provides reasonable assurance that the financial records may be relied on for the preparation of the consolidated annual financial statements. However, any system of internal financial control can provide only reasonable, and not absolute, assurance against material misstatement or loss.
The external auditors are responsible for independently auditing and reporting on the Group’s consolidated annual financial statements. The consolidated annual financial statements have been examined by the Group’s external auditors and their report is presented on page 102.
The consolidated annual financial statements set out on pages 108 to 157, which have been prepared on the going concern basis, were approved by the board of directors on 31 May 2017 and, as authorised, are signed on their behalf by:
Dr P. Jourdan Mr P. Silinga Chairperson Chief Executive Officer
STATEMENT OF DIRECTORS' RESPONSIBILITIES AND APPROVALS
GENERAL INFORMATION
NATURE OF BUSINESS Industrial Development Zone and ServicesAUDITORS Auditor-General of South Africa BANKERS First National Bank Standard Bank Investec Bank NedbankLOCATION Coega IDZ Business Centre Corner Alcyon Road & Zibuko Street Zone 1, Coega IDZ Port ElizabethPOSTAL ADDRESS Private Bag X6009 Port Elizabeth 6000COUNTRY OFINCORPORATIONAND DOMICILE South AfricaTELEPHONE NUMBER (+27) 41 403 0400FAX NUMBER (+27) 41 403 0401WEBSITE www.coega.co.zaBRANCH OFFICES Durban, East London, Pretoria, Cape Town and Mthatha
Compiled under the supervision/direction of: Lionel Billings, CA (SA), Chief Financial Officer
Registration Number 1982/003891/07AUDITED ANNUAL FINANCIAL STATEMENTS FOR THE YEAR ENDED 31 MARCH 2017These financial statements were audited in compliance with the applicable requirements of the Companies Act of South Africa, 71 of 2008 and the Public Finance Management Act. by the AUDITOR-GENERAL OF SOUTH AFRICA, EAST LONDON
ADMINISTERING THE CHECkS AND BALANCES: Lionel Billings, CDC Chief Financial Officer.
CONSOLIDATED ANNUAL FINANCIAL STATEMENTS
SECT
ION
04
SECT
ION
03
PER
FOR
MAN
CE IN
FOR
MAT
ION
THIS
IS C
OEG
AAD
MIN
ISTR
ATIO
N

102 103C O E G A D E V E L O P M E N T C O R P O R A T I O N I N T E G R A T E D R E P O R T 2 0 1 6 / 1 7
REPORT OF THE AUDITOR-GENERAL TO THE EASTERN CAPE PROVINCIAL LEGISLATURE ON COEGA DEVELOPMENT CORPORATION
Report on the audit of the consolidated and separate financial statements
OPINION
1. I have audited the consolidated and separate financial statements of the Coega Development Corporation and its subsidiary (the group) set out on pages 108 to 157, which comprise the consolidated and separate statement of financial position as at 31 March 2017, the consolidated and separate statement of profit or loss, statement of changes in equity, statement of cash flows for the year then ended, as well as the notes to the consolidated and separate financial statements, including a summary of significant accounting policies.
2. In my opinion, the consolidated and separate financial statements present fairly, in all material respects, the consolidated and separate financial position of the group as at 31 March 2017, and their financial performance and cash flows for the year then ended, in accordance with International Financial Reporting Standards (IFRS) and the requirements of the Public Finance Management Act of South Africa, 1999 (Act No. 1 of 1999) (PFMA) and the Companies Act of South Africa, 2008 (Act No. 71 of 2008) (the Companies Act).
BASIS FOR OPINION
3. I conducted my audit in accordance with the International Standards on Auditing (ISAs). My responsibilities under those standards are further described in the auditor-general’s responsibilities for the audit of the consolidated and separate financial statements section of my report.
4. I am independent of the group in accordance with the International Ethics Standards Board for Accountants’ Code of ethics for professional accountants (IESBA code) and the ethical requirements that are relevant to my audit in South Africa. I have fulfilled my other ethical responsibilities in accordance with these requirements and the IESBA code.
5. I believe that the audit evidence I have obtained is sufficient and appropriate to provide a basis for my opinion.
MATERIAL UNCERTAINTY RELATED TO GOING CONCERN/FINANCIAL SUSTAINABILITY
6. As disclosed in note 36.2 to the consolidated and separate financial statements, as a result of changes in funding arrangements, some of the company’s key financial ratios have deteriorated in comparison to previous years. These key financial ratios include: • cash flow from operations• creditors’ payment days• available cash balances
In addition, the actions taken by management to mitigate the impact of these risks are disclosed in this note.
EMPHASIS OF MATTERS
7. I draw attention to the matters below. My opinion is not modified in respect of these matters.
CHANGES TO LEGISLATION
8. As disclosed in note 36.1 to the consolidated and separate financial statements, the introduction of the special economic zone (SEZ) legislation in May 2014 brought changes to the way that funding to the industrial development zones (IDZ), and therefore the company, is allocated – from that of MTEF allocation to specific project-based approvals, which will be given from time to time. Further, the Act states that funding for the operations of the IDZs/SEZs will be the responsibility of the provincial government and no longer that of the DTI. At the moment, the amount of further contributions to the company’s operations to be made by the Provincial Government in terms of this requirement is yet to be determined.
Furthermore, the company is currently considering the impact of the new SEZ Act on certain operating divisions and business units currently within the company. A strict interpretation of the Act may result in these operating divisions and business units being deemed to be outside the objectives and mandate of the new SEZ Act. In this scenario, the company would
most probably have to divest itself of these operating divisions and business units which would have a material negative impact on the company revenue, profitability and operating cash flows.
FRUITLESS AND WASTEFUL EXPENDITURE
9. As disclosed under note 38 to the consolidated and separate financial statements, the entity incurred fruitless and wasteful expenditure to the cumulative amount of R40,8 million relating to South African Revenue Service (SARS) penalties and interest, and interest on overdue trade payables as a result of funding pressures the entity experienced over the years.
RESTATEMENT OF CORRESPONDING FIGURES
10. As disclosed in note 39 to the consolidated and separate financial statements, the corresponding figures for 31 March 2015 and 31 March 2016 have been restated as a result of errors in the consolidated and separate financial statements of the entity at, and for the year ended, 31 March 2017.
RESPONSIBILITIES OF THE BOARD OF DIRECTORS FOR THE FINANCIAL STATEMENTS
11. The board of directors, which constitutes the accounting authority, are responsible for the preparation and fair presentation of the consolidated and separate financial statements in accordance with IFRS and the requirements of the PFMA and the Companies Act and for such internal control as the accounting authority determines is necessary to enable the preparation of consolidated and separate financial statements that are free from material misstatement, whether due to fraud or error.
12. In preparing the consolidated and separate financial statements, the accounting authority is responsible for assessing the Coega Development Corporation and its subsidiary’s ability to continue as a going concern, disclosing, as applicable, matters relating to going concern and using the going concern basis of accounting unless the intention is to liquidate the group or cease operations, or there is no realistic alternative but to do so.
AUDITOR-GENERAL’S RESPONSIBILITIES FOR THE AUDIT OF THE CONSOLIDATED AND SEPARATE FINANCIAL STATEMENTS
13. My objectives are to obtain reasonable assurance about whether the consolidated and separate financial statements as a whole are free from material misstatement, whether due to fraud or error, and to issue an auditor’s report that includes my opinion. Reasonable assurance is a high level of assurance, but is not a guarantee that an audit conducted in accordance with ISAs will always detect a material misstatement when it exists. Misstatements can arise from fraud or error and are considered material if, individually or in the aggregate, they could reasonably be expected to influence the economic decisions of users taken on the basis of these consolidated and separate financial statements.
14. A further description of my responsibilities for the audit of the consolidated and separate financial statements is included in the annexure to the auditor’s report.
Report on the audit of the annual performance report
INTRODUCTION AND SCOPE
15. In accordance with the Public Audit Act of South Africa, 2004 (Act No. 25 of 2004) (PAA) and the general notice issued in terms thereof, I have a responsibility to report material findings on the reported performance information against predetermined objectives for selected strategic objectives presented in the annual performance report. I performed procedures to identify findings but not to gather evidence to express assurance.
16. My procedures address the reported performance information, which must be based on the approved performance planning documents of the entity. I have not evaluated the completeness and appropriateness of the performance indicators included in the planning documents. My procedures also did not extend to any disclosures or assertions relating to planned performance strategies and information in respect of future periods that may be included as part of the reported performance information. Accordingly, my findings do not extend to these matters.
INDEPENDENT AUDITOR’S REPORT
SECT
ION
04
SECT
ION
03
PER
FOR
MAN
CE IN
FOR
MAT
ION
THIS
IS C
OEG
AAD
MIN
ISTR
ATIO
N
C O E G A D E V E L O P M E N T C O R P O R A T I O N I N T E G R A T E D R E P O R T 2 0 1 6 / 1 7

104 105C O E G A D E V E L O P M E N T C O R P O R A T I O N I N T E G R A T E D R E P O R T 2 0 1 6 / 1 7
17. I evaluated the usefulness and reliability of the reported performance information in accordance with the criteria developed from the performance management and reporting framework, as defined in the general notice, for the following selected strategic objectives presented in the annual performance report of the entity for the year ended 31 March 2017:
Strategic objectives Pages in the annual performance report
Secure 54 investors valued at R10,28 billion by 2019-2020 Page 58
Sustain tenant industries to realise 50 operational investors by 2019-2020
Page 58
Diversify and grow the CDC income streams to a sum of R2,47 billion by 2019-2020
Page 58
Realise 61,772 jobs from all spheres of CDC operations by 2019-2020
Page 58
Target 40% of procurement spend on SMME’s by 2019-2020 Page 58
Realise 29,227 people trained by 2019-2020 Page 58
18. I performed procedures to determine whether the reported performance information was properly presented and whether performance was consistent with the approved performance planning documents. I performed further procedures to determine whether the indicators and related targets were measurable and relevant, and assessed the reliability of the reported performance information to determine whether it was valid, accurate and complete.
19. I did not identify any material findings on the usefulness and reliability of the reported performance information for the following strategic objectives:• Securing 54 investors valued at R10,28 billion by
2019-2020.• Sustaining tenant industries to realise 50 operational
investors by 2019-2020• Diversifying and growing the CDC income streams
to a sum of R2,47 billion by 2019-2020• Realising 61,772 jobs from all spheres of CDC
operations by 2019-2020• Targeting 40% of procurement spend on SMME’s by
2019-2020• Realising 29,227 people trained by 2019-2020
OTHER MATTERS
20. I draw attention to the matters below.
achievement of planned targets
21. Refer to the annual performance report on page 58 for information on the achievement of planned targets for the year.
adjustment of material misstatements
22. I identified material misstatements in the annual performance report submitted for auditing. These material misstatements were on the reported performance information of:• Realise 61,772 jobs from all spheres of CDC
operations by 2019-2020, and• Realise 29,227 people trained by 2019-2020
As management subsequently corrected the misstatements, I did not raise any material findings on the usefulness and reliability of the reported performance information.
Report on audit of compliance with legislation
INTRODUCTION AND SCOPE
23. In accordance with the PAA and the general notice issued in terms thereof, I have a responsibility to report material findings on the compliance of the entity with specific matters in key legislation. I performed procedures to identify findings but not to gather evidence to express assurance.
24. The material finding in respect of the compliance criteria for the applicable subject matters is as follows:
expenditure management
25. In contravention of section 51(1)(b)(ii) of the PFMA, due to funding pressures, steps taken were not effective to prevent fruitless and wasteful expenditure amounting to R18,7 million as disclosed in note 38 to the annual financial statements.
Other information
26. The accounting authority is responsible for the other information. The other information comprises the information included in the annual report which includes the director’s report, the audit committee’s report and the company secretary’s certificate as required by the Companies Act. The other information does not include the consolidated and separate financial statements, the auditor’s report thereon and those selected strategic
objectives presented in the annual performance report that have been specifically reported on in the auditor’s report.
27. My opinion on the financial statements and findings on the reported performance information and compliance with legislation do not cover the other information and I do not express an audit opinion or any form of assurance conclusion thereon.
28. In connection with my audit, my responsibility is to read the other information and, in doing so, consider whether the other information is materially inconsistent with the consolidated and separate financial statements and the selected strategic objectives presented in the annual performance report, or my knowledge obtained in the audit, or otherwise appears to be materially misstated. If, based on the work I have performed on the other information obtained prior to the date of this auditor’s report, I conclude that there is a material misstatement of this other information, I am required to report that fact.
29. I have not yet received the annual report. When I do receive this information, if I conclude that there is a material misstatement therein, I am required to communicate the matter to those charged with governance and request that the other information be corrected. If the other information is not corrected I may have to re-issue my auditor’s report amended as appropriate.
Internal control deficiencies
30. I considered internal control relevant to my audit of the consolidated and separate financial statements, reported performance information and compliance with applicable legislation; however, my objective was not to express any form of assurance thereon. The matters reported below are limited to the significant internal control deficiencies that resulted in the findings on the annual performance report and the findings on compliance with legislation included in this report.
• The accounting authority did not always exercise adequate oversight responsibilities to ensure the annual performance report submitted for audit is free from material misstatements and that non-compliance with legislation is prevented.
SECT
ION
04
SECT
ION
03
PER
FOR
MAN
CE IN
FOR
MAT
ION
THIS
IS C
OEG
AAD
MIN
ISTR
ATIO
N
East London
31 July 2017

106 107C O E G A D E V E L O P M E N T C O R P O R A T I O N I N T E G R A T E D R E P O R T 2 0 1 6 / 1 7
SECT
ION
04
SECT
ION
03
PER
FOR
MAN
CE IN
FOR
MAT
ION
THIS
IS C
OEG
AAD
MIN
ISTR
ATIO
N
ANNEXURE – AUDITOR-GENERAL’S RESPONSIBILITY FOR THE AUDIT
1. As part of an audit in accordance with the ISAs, I exercise professional judgement and maintain professional scepticism throughout my audit of the consolidated and separate financial statements, and the procedures performed on reported performance information for selected strategic objectives and on the entity’s compliance with respect to the selected subject matters.
FINANCIAL STATEMENTS
2. In addition to my responsibility for the audit of the consolidated and separate financial statements as described in the auditor’s report, I also:
• identify and assess the risks of material misstatement of the consolidated and separate financial statements whether due to fraud or error, design and perform audit procedures responsive to those risks, and obtain audit evidence that is sufficient and appropriate to provide a basis for my opinion. The risk of not detecting a material misstatement resulting from fraud is higher than for one resulting from error, as fraud may involve collusion, forgery, intentional omissions, misrepresentations, or the override of internal control.
• obtain an understanding of internal control relevant to the audit in order to design audit procedures that are appropriate in the circumstances, but not for the purpose of expressing an opinion on the effectiveness of the entity’s internal control.
• evaluate the appropriateness of accounting policies used and the reasonableness of accounting estimates and related disclosures made by the board of directors, which constitutes the accounting authority.
• conclude on the appropriateness of the accounting authority’s use of the going concern basis of accounting in the preparation of the financial statements. I also conclude, based on the audit evidence obtained, whether a material uncertainty exists related to events or conditions that may cast significant doubt on the Coega Development Corporation and its subsidiary ability to continue as a going concern. If I conclude that a material uncertainty exists, I am required to draw attention in my auditor’s report to the related disclosures in the financial statements about the material uncertainty or, if such disclosures are inadequate, to modify the opinion on the financial statements. My conclusions
are based on the information available to me at the date of the auditor’s report. However, future events or conditions may cause the entity to cease operating as a going concern.
• evaluate the overall presentation, structure and content of the financial statements, including the disclosures, and whether the financial statements represent the underlying transactions and events in a manner that achieves fair presentation.
• obtain sufficient appropriate audit evidence regarding the financial information of the entities or business activities within the group to express an opinion on the consolidated financial statements. I am responsible for the direction, supervision and performance of the group audit. I remain solely responsible for my audit opinion.
COMMUNICATION WITH THOSE CHARGED WITH GOVERNANCE
3. I communicate with the accounting authority regarding, among other matters, the planned scope and timing of the audit and significant audit findings, including any significant deficiencies in internal control that I identify during my audit.
4. I also confirm to the accounting authority that I have complied with relevant ethical requirements regarding independence, and communicate all relationships and other matters that may reasonably be thought to have a bearing on my independence and where applicable, related safeguards.
APM Terminals located in Zone 1 of the Coega IDZ.
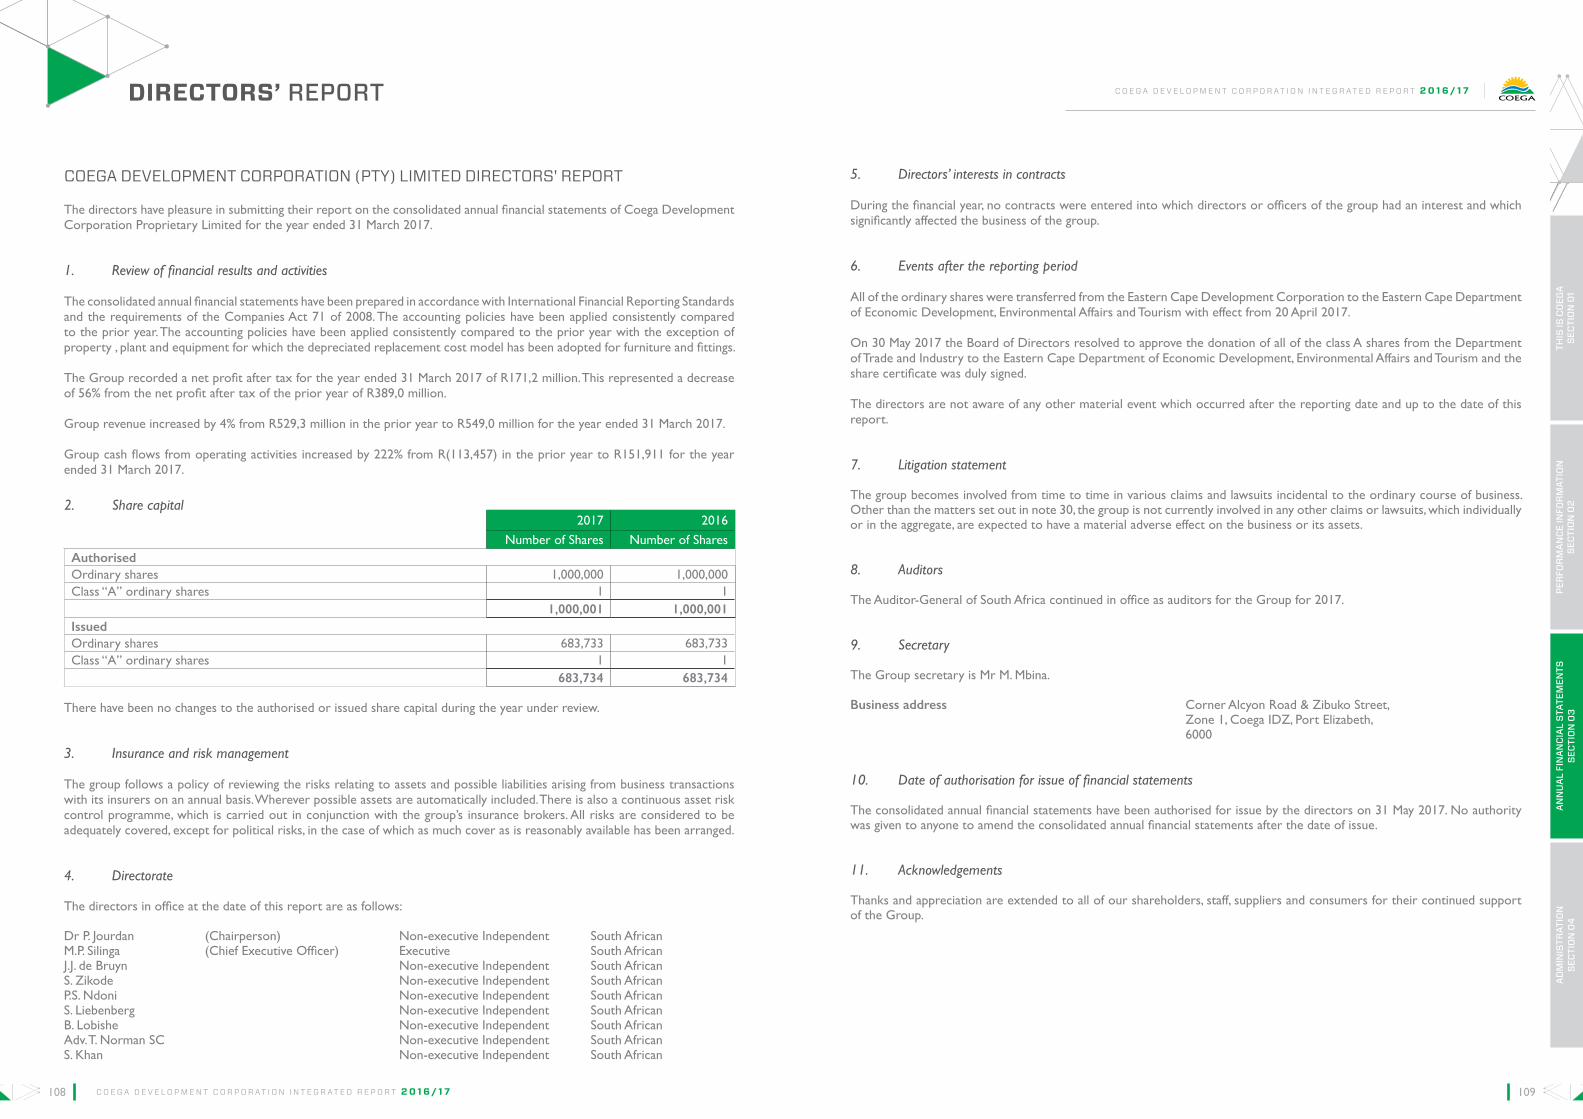
108 109C O E G A D E V E L O P M E N T C O R P O R A T I O N I N T E G R A T E D R E P O R T 2 0 1 6 / 1 7
COEGA DEVELOPMENT CORPORATION (PTY) LIMITED DIRECTORS' REPORT
The directors have pleasure in submitting their report on the consolidated annual financial statements of Coega Development Corporation Proprietary Limited for the year ended 31 March 2017.
1. Review of financial results and activities
The consolidated annual financial statements have been prepared in accordance with International Financial Reporting Standards and the requirements of the Companies Act 71 of 2008. The accounting policies have been applied consistently compared to the prior year. The accounting policies have been applied consistently compared to the prior year with the exception of property , plant and equipment for which the depreciated replacement cost model has been adopted for furniture and fittings.
The Group recorded a net profit after tax for the year ended 31 March 2017 of R171,2 million. This represented a decrease of 56% from the net profit after tax of the prior year of R389,0 million.
Group revenue increased by 4% from R529,3 million in the prior year to R549,0 million for the year ended 31 March 2017.
Group cash flows from operating activities increased by 222% from R(113,457) in the prior year to R151,911 for the year ended 31 March 2017.
2017 2016
Number of Shares Number of SharesAuthorisedOrdinary shares 1,000,000 1,000,000 Class “A” ordinary shares 1 1 1,000,001 1,000,001 IssuedOrdinary shares 683,733 683,733Class “A” ordinary shares 1 1
683,734 683,734
There have been no changes to the authorised or issued share capital during the year under review.
3. Insurance and risk management
The group follows a policy of reviewing the risks relating to assets and possible liabilities arising from business transactions with its insurers on an annual basis. Wherever possible assets are automatically included. There is also a continuous asset risk control programme, which is carried out in conjunction with the group’s insurance brokers. All risks are considered to be adequately covered, except for political risks, in the case of which as much cover as is reasonably available has been arranged.
4. Directorate
The directors in office at the date of this report are as follows:
Dr P. Jourdan (Chairperson) Non-executive Independent South African M.P. Silinga (Chief Executive Officer) Executive South AfricanJ.J. de Bruyn Non-executive Independent South AfricanS. Zikode Non-executive Independent South African P.S. Ndoni Non-executive Independent South AfricanS. Liebenberg Non-executive Independent South AfricanB. Lobishe Non-executive Independent South AfricanAdv. T. Norman SC Non-executive Independent South AfricanS. Khan Non-executive Independent South African
5. Directors’ interests in contracts
During the financial year, no contracts were entered into which directors or officers of the group had an interest and which significantly affected the business of the group.
6. Events after the reporting period
All of the ordinary shares were transferred from the Eastern Cape Development Corporation to the Eastern Cape Department of Economic Development, Environmental Affairs and Tourism with effect from 20 April 2017.
On 30 May 2017 the Board of Directors resolved to approve the donation of all of the class A shares from the Department of Trade and Industry to the Eastern Cape Department of Economic Development, Environmental Affairs and Tourism and the share certificate was duly signed.
The directors are not aware of any other material event which occurred after the reporting date and up to the date of this report.
7. Litigation statement
The group becomes involved from time to time in various claims and lawsuits incidental to the ordinary course of business. Other than the matters set out in note 30, the group is not currently involved in any other claims or lawsuits, which individually or in the aggregate, are expected to have a material adverse effect on the business or its assets.
8. Auditors
The Auditor-General of South Africa continued in office as auditors for the Group for 2017.
9. Secretary
The Group secretary is Mr M. Mbina.
Business address Corner Alcyon Road & Zibuko Street, Zone 1, Coega IDZ, Port Elizabeth, 6000
10. Date of authorisation for issue of financial statements
The consolidated annual financial statements have been authorised for issue by the directors on 31 May 2017. No authority was given to anyone to amend the consolidated annual financial statements after the date of issue.
11. Acknowledgements
Thanks and appreciation are extended to all of our shareholders, staff, suppliers and consumers for their continued support of the Group.
DIRECTORS’ REPORT
2. Share capital
SECT
ION
04
SECT
ION
03
PER
FOR
MAN
CE IN
FOR
MAT
ION
THIS
IS C
OEG
AAD
MIN
ISTR
ATIO
N
C O E G A D E V E L O P M E N T C O R P O R A T I O N I N T E G R A T E D R E P O R T 2 0 1 6 / 1 7

110 111C O E G A D E V E L O P M E N T C O R P O R A T I O N I N T E G R A T E D R E P O R T 2 0 1 6 / 1 7
Statement of Financial Position as at 31 March 2017
31-Mar 31-Mar 31-Mar
2017 2016Restated *
2015 Restated *
Notes R’000 R’000 R’000 ASSETS Non-current assets Property, plant and equipment 3 554,577 553,232 495,266Investment properties 4 5,112,622 4,882,988 4,464,730Intangible assets 5 7 345 1,674
5,667,206 5,436,565 4,961,670Current assets Inventories 257 - - Trade and other receivables 11 240,184 323,657 292,021Other financial assets 7 18 - -Prepayments - 12 -Loans and advances 10 17,944 9,148 1,146Cash and cash equivalents 12 755,149 291,142 482,354
1,013,552 623,959 775,521Total assets 6,680,758 6,060,524 5,737,191 EQUITY Capital and reserves Share capital 13 1,264,558 1,264,558 1,264,558Retained income 3,793,663 3,622,446 3,233,395
5,058,221 4,887,004 4,497,953 LIABILITIES Non-current liabilities Deferred income 18 374,303 30,963 156,460 Deferred tax 9 500,879 501,304 488,636Income received in advance 16 77,574 88,386 102,669
952,756 620,653 747,765Current liabilities Trade and other payables 17 640,877 524,769 438,225 Current tax payable 831 945 -Provisions 14 17,260 16,340 42,435Income received in advance - current portion 16 10,813 10,813 10,813
669,781 552,867 491,473Total liabilities 1,622,537 1,173,520 1,239,238Total equity and liabilities 6,680,758 6,060,524 5,737,191
* See Notes
STATEMENT OF FINANCIAL POSITION
Statement of Profit or Loss for the year ended 31 March 2017
31-Mar 31-Mar
2017 2016Restated *
Notes R’000 R’000
Revenue 19 549,052 529,352Other operating income 20 234,551 465,840Other operating gains (losses) 21 - 88,940Other operating expenses (593,776) (671,368)Operating profit / (loss) 22 189,827 412,764Investment income 25 3,006 1,323Finance costs 26 (21,579) (12,231)Profit / (loss) before taxation 171,254 401,856Taxation 27 (37) (12,805)Profit for the year 171,217 389,051
* See Notes
STATEMENT OF PROFIT OR LOSS
SECT
ION
04
SECT
ION
03
PER
FOR
MAN
CE IN
FOR
MAT
ION
THIS
IS C
OEG
AAD
MIN
ISTR
ATIO
N

112 113C O E G A D E V E L O P M E N T C O R P O R A T I O N I N T E G R A T E D R E P O R T 2 0 1 6 / 1 7
Statement of Changes in Equity as at 31 March 2017
Share
CapitalShare
Premium
Retained Income /
(Accumulated Loss)
TotalEquity
R’000 R’000 R’000 R’000
Opening balance as previously reported 7 1,264,551 3,212,266 4,476,824
Prior period errors - - 21,129 21,129
Restated * Balance at 1 April 2015 7 1,264,551 3,233,395 4,497,953
Total comprehensive income for the year - - 389,051 389,051
Restated * Balance at 1 April 2016 7 1,264,551 3,622,446 4,887,004
Profit for the year - - 171,217 171,217
Balance at 31 March 2017 7 1,264,551 3,793,663 5,058,221
Notes 13 13
* See Notes
STATEMENT OF CHANGES IN EQUITY
Statement of Cash Flows for the year ended 31 March 2017
31-Mar 31-Mar
2017 2016Restated *
Notes R’000 R’000Cash flows from operating activities Cash generated from (used in) operations 28 174,066 (102,034)Interest income - -Finance costs (21,579) (12,231)Tax paid (576) 808Net cash from operating activities 151,911 (113,457)
Cash flows from investing activities Purchase of property, plant and equipment 3 (137,884) (179,622)Purchase of investment property 4 (114,057) (249,494)Sale of investment property 4 - 21,470Purchase of other intangible assets 5 - (118)Sale of financial assets (18) -Interest Income 3,006 1,323Net cash from investing activities (248,953) (406,441)
Cash flows from financing activities Government grants received 552,631 320,188Interest earned on deferred income funds 8,418 8,497Net cash from financing activities 561,049 328,685
Total cash movement for the year 464,007 (191,213)Cash at the beginning of the year 291,142 482,354Total cash at end of the year 12 755,149 291,141
* See Notes
STATEMENT OF CASH FLOWS
SECT
ION
04
SECT
ION
03
PER
FOR
MAN
CE IN
FOR
MAT
ION
THIS
IS C
OEG
AAD
MIN
ISTR
ATIO
N

114 115C O E G A D E V E L O P M E N T C O R P O R A T I O N I N T E G R A T E D R E P O R T 2 0 1 6 / 1 7
1. SUMMARY OF SIGNIFICANT ACCOUNTING POLICIES
The principal accounting policies applied in the preparation of these consolidated annual financial statements are set out below.
1.1 Basis of preparation
The consolidated annual financial statements have been prepared on the going concern basis in accordance with, and in compliance with, International Financial Reporting Standards (“IFRS”) and International Financial Reporting Interpretations Committee (“IFRIC”) interpretations issued and effective at the time of preparing these consolidated annual financial statements and the Companies Act 71 of 2008 of South Africa, as amended.
These consolidated annual financial statements comply with the requirements of the SAICA Financial Reporting Guides as issued by the Accounting Practices Committee and the Financial Reporting Pronouncements as issued by the Financial Reporting Standards Council.
The consolidated annual financial statements have been prepared on the historic cost convention, unless otherwise stated in the accounting policies which follow and incorporate the principal accounting policies set out below. They are presented in South African Rands, which is the Company’s functional currency.
These accounting policies are consistent with the previous period.
1.2 Significant judgements and sources of estimation uncertainty
The preparation of consolidated annual financial statements in conformity with IFRS requires management, from time to time, to make judgements, estimates and assumptions that affect the application of policies and reported amounts of assets, liabilities, income and expenses. These estimates and associated assumptions are based on experience and various other factors that are believed to be reasonable under the circumstances. Actual results may differ from these estimates. The estimates and underlying assumptions are reviewed on an ongoing basis. Revisions to accounting estimates are recognised in the period in which the estimates are revised and in any future periods affected.
Critical judgements in applying accounting policies
The critical judgements made by management in applying accounting policies, apart from those involving estimations, that have the most significant effect on the amounts recognised in the financial statements, are outlined as follows:
Expected manner of realisation for deferred tax
Management have reviewed the investment property portfolio of the Group in order to determine the appropriate rate at which to measure deferred tax. Investment property is measured at fair value. The manner of recovery of the carrying amount, i.e. through use or sale, affects the determination of the deferred tax assets or liabilities. IFRS assumes that the carrying amount of investment property is recovered through sale rather than through continued use. Management considered the business model of the portfolio and concluded that the deferred taxation should be measured on the continued use basis.
Key sources of estimation uncertainty
Trade receivables
The Group assesses its trade receivables for impairment at the end of each reporting period. In determining whether an
impairment loss should be recorded in profit or loss, the Group makes judgements as to whether there is observable data indicating a measurable decrease in the estimated future cash flows from the financial asset.
The impairment (or loss allowance) for trade receivables is calculated on a portfolio basis, except for individually significant trade receivables which are assessed separately. The impairment test on the portfolio is based on historical loss ratios, adjusted for national and industry-specific economic conditions and other indicators present at the reporting date that correlate with defaults on the portfolio. These annual loss ratios are applied to loan balances in the portfolio and scaled to the estimated loss emergence period.
Impairment testing
The Group reviews and tests the carrying value of assets when events or changes in circumstances suggest that the carrying amount may not be recoverable. Assets are grouped at the lowest level for which identifiable cash flows are largely independent of cash flows of other assets and liabilities. If there are indications that impairment may have occurred, estimates are prepared of expected future cash flows for each group of assets. Expected future cash flows used to determine the value in use of tangible assets are inherently uncertain and could materially change over time. They are significantly affected by a number of factors.
Provisions
Provisions are inherently based on assumptions and estimates using the best information available. Additional disclosure of these estimates of provisions are included in note 14.
Taxation
Judgement is required in determining the provision for income taxes due to the complexity of legislation. There are many transactions and calculations for which the ultimate tax determination is uncertain during the ordinary course of business. The Group recognises liabilities for anticipated tax audit issues based on estimates of whether additional taxes will be due. Where the final tax outcome of these matters is different from the amounts that were initially recorded, such differences will impact the income tax and deferred tax provisions in the period in which such determination is made.
The Group recognises the net future tax benefit related to deferred income tax assets to the extent that it is probable that the deductible temporary differences will reverse in the foreseeable future. Assessing the recoverability of deferred income tax assets requires the Group to make significant estimates related to expectations of future taxable income. Estimates of future taxable income are based on forecast cash flows from operations and the application of existing tax laws. To the extent that future cash flows and taxable income differ significantly from estimates, the ability of the Group to realise the net deferred tax assets recorded at the end of the reporting period could be impacted.
Capitalisation of infrastructure costs
Management applies judgment in assessing whether infrastructure will be controlled by the company and whether future economic benefits are expected to flow to the company in determining whether costs incurred on infrastructure should be capitalised as assets.
1.3 Investment property
Investment property is recognised as an asset when, and only when, it is probable that the future economic benefits that are associated with the investment property will flow to the enterprise, and the cost of the investment property can be measured reliably.
Investment property is initially recognised at cost. Transaction costs are included in the initial measurement.
Costs include costs incurred initially and costs incurred subsequently to add to, or to replace a part of, or service a property. If a replacement part is recognised in the carrying amount of the investment property, the carrying amount of the replaced part is derecognised.
Fair value
Subsequent to initial measurement investment property is measured at fair value.
A gain or loss arising from a change in fair value is included in net profit or loss for the period in which it arises.
Coega Development Corporation Proprietary Limited is a public company incorporated and domiciled in South Africa.
The consolidated annual financial statements for the year ended 31 March 2017 were authorised for issue in accordance with a resolution of the directors on 31 May 2017:
ACCOUNTING POLICIES
N O T E S T O T H E C O N S O L I D A T E D A N N U A L F I N A N C I A L S T A T E M E N T S
SECT
ION
04
SECT
ION
03
PER
FOR
MAN
CE IN
FOR
MAT
ION
THIS
IS C
OEG
AAD
MIN
ISTR
ATIO
N

116 117C O E G A D E V E L O P M E N T C O R P O R A T I O N I N T E G R A T E D R E P O R T 2 0 1 6 / 1 7
1.4 Property, plant and equipment
Property, plant and equipment are tangible assets which the Group holds for its own use or for rental to others and which are expected to be used for more than one year.
An item of property, plant and equipment is recognised as an asset when it is probable that future economic benefits associated with the item will flow to the Group, and the cost of the item can be measured reliably.
Property, plant and equipment is initially measured at cost. Cost includes all of the expenditure which is directly attributable to the acquisition or construction of the asset, including the capitalisation of borrowing costs on qualifying assets and adjustments in respect of hedge accounting, where appropriate.
Expenditure incurred subsequently for major services, additions to or replacements of parts of property, plant and equipment are capitalised if it is probable that future economic benefits associated with the expenditure will flow to the Group and the cost can be measured reliably. Day to day servicing costs are included in profit or loss in the year in which they are incurred.
Depreciation of an asset commences when the asset is available for use as intended by management. Depreciation is charged to write off the asset’s carrying amount over its estimated useful life to its estimated residual value, using a method that best reflects the pattern in which the asset’s economic benefits are consumed by the Group. Leased assets are depreciated in a consistent manner over the shorter of their expected useful lives and the lease term. Depreciation is not charged to an asset if its estimated residual value exceeds or is equal to its carrying amount. Depreciation of an asset ceases at the earlier of the date that the asset is classified as held for sale or derecognised.
The useful lives of items of property, plant and equipment have been assessed as follows:
The residual value, useful life and depreciation method of each asset are reviewed at the end of each reporting year. If the expectations differ from previous estimates, the change is accounted for prospectively as a change in accounting estimate.
Each part of an item of property, plant and equipment with a cost that is significant in relation to the total cost of the item is depreciated separately.
The depreciation charge for each year is recognised in profit or loss unless it is included in the carrying amount of another asset.
Impairment tests are performed on property, plant and equipment when there is an indicator that they may be impaired. When the carrying amount of an item of property, plant and equipment is assessed to be higher than the estimated recoverable amount, an impairment loss is recognised immediately in profit or loss to bring the carrying amount in line with the recoverable amount.
An item of property, plant and equipment is derecognised upon disposal or when no future economic benefits are expected from its continued use or disposal. Any gain or loss arising from the derecognition of an item of property, plant and equipment, determined as the difference between the net disposal proceeds, if any, and the carrying amount of the item, is included in profit or loss when the item is derecognised.
1.5 Intangible assets
An intangible asset is recognised when:
• it is probable that the expected future economic benefits that are attributable to the asset will flow to the entity; and• the cost of the asset can be measured reliably.
Intangible assets are initially recognised at cost.
Expenditure on research (or on the research phase of an internal project) is recognised as an expense when it is incurred.
An intangible asset arising from development (or from the development phase of an internal project) is recognised when:
• it is technically feasible to complete the asset so that it will be available for use or sale.• there is an intention to complete and use or sell it.• there is an ability to use or sell it.• it will generate probable future economic benefits.• there are available technical, financial and other resources to complete the development and to use or sell the asset.• the expenditure attributable to the asset during its development can be measured reliably.
Intangible assets are carried at cost less any accumulated amortisation and any impairment losses.
An intangible asset is regarded as having an indefinite useful life when, based on all relevant factors, there is no foreseeable limit to the period over which the asset is expected to generate net cash inflows. Amortisation is not provided for these intangible assets, but they are tested for impairment annually and whenever there is an indication that the asset may be impaired. For all other intangible assets amortisation is provided on a straight line basis over their useful life.
The amortisation period and the amortisation method for intangible assets are reviewed every period-end.
Reassessing the useful life of an intangible asset with a finite useful life after it was classified as indefinite is an indicator that the asset may be impaired. As a result the asset is tested for impairment and the remaining carrying amount is amortised over its useful life.
Internally generated brands, mastheads, publishing titles, customer lists and items similar in substance are not recognised as intangible assets.
Amortisation is provided to write down the intangible assets, on a straight line basis, to their residual values as follows:
Item Useful life
Computer software, other 2 - 5 years
1.6 Financial instruments
Classification
The Group classifies financial assets and financial liabilities into the following categories:
• Loans and receivables
Classification depends on the purpose for which the financial instruments were obtained / incurred and takes place at initial recognition. Classification is re-assessed on an annual basis, except for derivatives and financial assets designated as at fair value through profit or loss, which shall not be classified out of the fair value through profit or loss category.
Initial recognition and measurement
Financial instruments are recognised initially when the Group becomes a party to the contractual provisions of the instruments.
The Group classifies financial instruments, or their component parts, on initial recognition as a financial asset, a financial liability or an equity instrument in accordance with the substance of the contractual arrangement.
SECT
ION
04
SECT
ION
03
PER
FOR
MAN
CE IN
FOR
MAT
ION
THIS
IS C
OEG
AAD
MIN
ISTR
ATIO
N
N O T E S T O T H E C O N S O L I D A T E D A N N U A L F I N A N C I A L S T A T E M E N T S
Item Depreciation method Average useful life
Buildings Straight line 25 years
Motor vehicles Straight line 5 - 15 years
Office equipment Straight line 3 - 15 years
IT equipment Straight line 3 - 10 years
Computer software Straight line 2 - 5 years
Other property, plant and equipment Straight line 2 - 15 years

118 119C O E G A D E V E L O P M E N T C O R P O R A T I O N I N T E G R A T E D R E P O R T 2 0 1 6 / 1 7
Financial instruments are measured initially at fair value, except for equity investments for which a fair value is not determinable, which are measured at cost and are classified as available-for-sale financial assets.
For financial instruments which are not at fair value through profit or loss, transaction costs are included in the initial measurement of the instrument.
Regular way purchases of financial assets are accounted for at trade date.
Subsequent measurement
Loans and receivables are subsequently measured at amortised cost, using the effective interest method, less accumulated impairment losses.
Derecognition
Financial assets are derecognised when the rights to receive cash flows from the investments have expired or have been transferred and the Group has transferred substantially all risks and rewards of ownership.
Fair value determination
The fair values of quoted investments are based on current bid prices. If the market for a financial asset is not active (and for unlisted securities), the Group establishes fair value by using valuation techniques. These include the use of recent arm’s length transactions, reference to other instruments that are substantially the same, discounted cash flow analysis, and option pricing models making maximum use of market inputs and relying as little as possible on entity-specific inputs.
Impairment of financial assets
At each reporting date the Group assesses all financial assets, other than those at fair value through profit or loss, to determine whether there is objective evidence that a financial asset or group of financial assets has been impaired.
For amounts due to the Group, significant financial difficulties of the debtor, probability that the debtor will enter bankruptcy and default of payments are all considered indicators of impairment.
In the case of equity securities classified as available-for-sale, a significant or prolonged decline in the fair value of the security below its cost is considered an indicator of impairment. If any such evidence exists for available-for-sale financial assets, the cumulative loss - measured as the difference between the acquisition cost and current fair value, less any impairment loss on that financial asset previously recognised in profit or loss - is removed from equity as a reclassification adjustment to other comprehensive income and recognised in profit or loss.
Impairment losses are recognised in profit or loss.
Impairment losses are reversed when an increase in the financial asset’s recoverable amount can be related objectively to an event occurring after the impairment was recognised, subject to the restriction that the carrying amount of the financial asset at the date that the impairment is reversed shall not exceed what the carrying amount would have been had the impairment not been recognised.
Reversals of impairment losses are recognised in profit or loss except for equity investments classified as available-for-sale.
Impairment losses are also not subsequently reversed for available-for-sale equity investments which are held at cost because fair value was not determinable.
Where financial assets are impaired through use of an allowance account, the amount of the loss is recognised in profit or loss within operating expenses. When such assets are written off, the write off is made against the relevant allowance account. Subsequent recoveries of amounts previously written off are credited against operating expenses.
Loans to (from) group companies
These include loans to and from holding companies, fellow subsidiaries, subsidiaries, joint ventures and associates and are recognised initially at fair value plus direct transaction costs.
Loans to group companies are classified as loans and receivables.
Loans from group companies are classified as financial liabilities measured at amortised cost.
Trade and other receivables
Trade receivables are measured at initial recognition at fair value, and are subsequently measured at amortised cost using the effective interest rate method. Appropriate allowances for estimated irrecoverable amounts are recognised in profit or loss when there is objective evidence that the asset is impaired. Significant financial difficulties of the debtor, probability that the debtor will enter bankruptcy or financial reorganisation, and default or delinquency in payments (more than 30 days overdue) are considered indicators that the trade receivable is impaired. The allowance recognised is measured as the difference between the asset’s carrying amount and the present value of estimated future cash flows discounted at the effective interest rate computed at initial recognition.
The carrying amount of the asset is reduced through the use of an allowance account, and the amount of the loss is recognised in profit or loss within operating expenses. When a trade receivable is uncollectable, it is written off against the allowance account for trade receivables. Subsequent recoveries of amounts previously written off are credited against operating expenses in profit or loss.
Trade and other receivables are classified as loans and receivables.
Trade and other payables
Trade payables are initially measured at fair value, and are subsequently measured at amortised cost, using the effective interest rate method.
Cash and cash equivalents
Cash and cash equivalents comprise cash on hand and demand deposits, and other short-term highly liquid investments that are readily convertible to a known amount of cash and are subject to an insignificant risk of changes in value. These are initially and subsequently recorded at fair value.
1.7 Tax
Current tax assets and liabilities
Current tax for current and prior periods is, to the extent unpaid, recognised as a liability. If the amount already paid in respect of current and prior periods exceeds the amount due for those periods, the excess is recognised as an asset.
Current tax liabilities (assets) for the current and prior periods are measured at the amount expected to be paid to (recovered from) the tax authorities, using the tax rates (and tax laws) that have been enacted or substantively enacted by the end of the reporting period.
Deferred tax assets and liabilities
A deferred tax liability is recognised for all taxable temporary differences, except to the extent that the deferred tax liability arises from the initial recognition of an asset or liability in a transaction which at the time of the transaction, affects neither accounting profit nor taxable profit (tax loss).
A deferred tax asset is recognised for all deductible temporary differences to the extent that it is probable that taxable profit will be available against which the deductible temporary difference can be utilised. A deferred tax asset is not recognised when it arises from the initial recognition of an asset or liability in a transaction at the time of the transaction, affects neither accounting profit nor taxable profit (tax loss).
A deferred tax asset is recognised for the carry forward of unused tax losses and unused STC credits to the extent that it is probable that future taxable profit will be available against which the unused tax losses and unused STC credits can be utilised.
Deferred tax assets and liabilities are measured at the tax rates that are expected to apply to the period when the asset is realised or the liability is settled, based on tax rates (and tax laws) that have been enacted or substantively enacted by the end of the reporting period.
N O T E S T O T H E C O N S O L I D A T E D A N N U A L F I N A N C I A L S T A T E M E N T S
SECT
ION
04
SECT
ION
03
PER
FOR
MAN
CE IN
FOR
MAT
ION
THIS
IS C
OEG
AAD
MIN
ISTR
ATIO
N

120 121C O E G A D E V E L O P M E N T C O R P O R A T I O N I N T E G R A T E D R E P O R T 2 0 1 6 / 1 7
1.8 Leases
A lease is classified as a finance lease if it transfers substantially all the risks and rewards incidental to ownership. A lease is classified as an operating lease if it does not transfer substantially all the risks and rewards incidental to ownership.
Operating lease - lessor
Operating lease income is recognised as an income on a straight-line basis over the lease term.
Initial direct costs incurred in negotiating and arranging operating leases are added to the carrying amount of the leased asset and recognised as an expense over the lease term on the same basis as the lease income.
Income for leases is disclosed under revenue in profit or loss.
Operating lease – lessee
Operating lease payments are recognised as an expense on a straight-line basis over the lease term. The difference between the amounts recognised as an expense and the contractual payments are recognised as an operating lease asset. This liability is not discounted.
Any contingent rents are expensed in the period they are incurred.
1.9 Impairment of assets
The Group assesses at each end of the reporting period whether there is any indication that an asset may be impaired. If any such indication exists, the Group estimates the recoverable amount of the asset.
Irrespective of whether there is any indication of impairment, the Group also:
• tests intangible assets with an indefinite useful life or intangible assets not yet available for use for impairment annually by comparing its carrying amount with its recoverable amount. This impairment test is performed during the annual period and at the same time every period.
• tests goodwill acquired in a business combination for impairment annually.
If there is any indication that an asset may be impaired, the recoverable amount is estimated for the individual asset. If it is not possible to estimate the recoverable amount of the individual asset, the recoverable amount of the cash-generating unit to which the asset belongs is determined.
The recoverable amount of an asset or a cash-generating unit is the higher of its fair value less costs to sell and its value in use.
If the recoverable amount of an asset is less than its carrying amount, the carrying amount of the asset is reduced to its recoverable amount. That reduction is an impairment loss.
An impairment loss of assets carried at cost less any accumulated depreciation or amortisation is recognised immediately in profit or loss. Any impairment loss of a revalued asset is treated as a revaluation decrease.
An entity assesses at each reporting date whether there is any indication that an impairment loss recognised in prior periods for assets other than goodwill may no longer exist or may have decreased. If any such indication exists, the recoverable amounts of those assets are estimated.
The increased carrying amount of an asset other than goodwill attributable to a reversal of an impairment loss does not exceed the carrying amount that would have been determined had no impairment loss been recognised for the asset in prior periods.
A reversal of an impairment loss of assets carried at cost less accumulated depreciation or amortisation other than goodwill is recognised immediately in profit or loss. Any reversal of an impairment loss of a revalued asset is treated as a revaluation increase.
1.10 Share capital and equity
An equity instrument is any contract that evidences a residual interest in the assets of an entity after deducting all of its liabilities.
1.11 Employee benefits
Short-term employee benefits
The cost of short-term employee benefits, (those payable within 12 months after the service is rendered, such as paid vacation leave and sick leave, bonuses, and non-monetary benefits such as medical care), are recognised in the period in which the service is rendered and are not discounted.
The expected cost of compensated absences is recognised as an expense as the employees render services that increase their entitlement or, in the case of non-accumulating absences, when the absence occurs.
The expected cost of profit sharing and bonus payments is recognised as an expense when there is a legal or constructive obligation to make such payments as a result of past performance.
Defined contribution plans
Payments to defined contribution retirement benefit plans are charged as an expense as they fall due.
Payments made to industry-managed (or state plans) retirement benefit schemes are dealt with as defined contribution plans where the Group’s obligation under the schemes is equivalent to those arising in a defined contribution retirement benefit plan.
1.12 Provisions and contingencies
Provisions are recognised when:
• the Group has a present obligation as a result of a past event;• it is probable that an outflow of resources embodying economic benefits will be required to settle the obligation; and• a reliable estimate can be made of the obligation.
The amount of a provision is the present value of the expenditure expected to be required to settle the obligation.
Where some or all of the expenditure required to settle a provision is expected to be reimbursed by another party, the reimbursement shall be recognised when, and only when, it is virtually certain that reimbursement will be received if the entity settles the obligation. The reimbursement shall be treated as a separate asset. The amount recognised for the reimbursement shall not exceed the amount of the provision.
Provisions are not recognised for future operating losses.
If an entity has a contract that is onerous, the present obligation under the contract shall be recognised and measured as a provision.
A constructive obligation to restructure arises only when an entity:
• has a detailed formal plan for the restructuring, identifying at least: - the business or part of a business concerned; - the principal locations affected; - the location, function, and approximate number of employees who will be compensated for terminating their services; - the expenditures that will be undertaken; and - when the plan will be implemented; and• has raised a valid expectation in those affected that it will carry out the restructuring by starting to implement that plan
or announcing its main features to those affected by it.
SECT
ION
04
SECT
ION
03
PER
FOR
MAN
CE IN
FOR
MAT
ION
THIS
IS C
OEG
AAD
MIN
ISTR
ATIO
N
N O T E S T O T H E C O N S O L I D A T E D A N N U A L F I N A N C I A L S T A T E M E N T S

122 123C O E G A D E V E L O P M E N T C O R P O R A T I O N I N T E G R A T E D R E P O R T 2 0 1 6 / 1 7
After their initial recognition contingent liabilities recognised in business combinations that are recognised separately are subsequently measured at the higher of:
• the amount that would be recognised as a provision; and• the amount initially recognised less cumulative amortisation.
Contingent assets and contingent liabilities are not recognised. Contingencies are disclosed in note 30.
1.13 Government grants
Government grants are recognised when there is reasonable assurance that:
• the Group will comply with the conditions attaching to them; and• the grants will be received.
Government grants are recognised as income over the periods necessary to match them with the related costs that they are intended to compensate.
A government grant that becomes receivable as compensation for expenses or losses already incurred or for the purpose of giving immediate financial support to the entity with no future related costs is recognised as income of the period in which it becomes receivable.
Government grants related to assets, including non-monetary grants at fair value, are presented in the statement of financial position by setting up the grant as deferred income or by deducting the grant in arriving at the carrying amount of the asset.
Grants related to income are presented as a credit in the profit or loss (separately).
Repayment of a grant related to income is applied first against any un-amortised deferred credit set up in respect of the grant. To the extent that the repayment exceeds any such deferred credit, or where no deferred credit exists, the repayment is recognised immediately as an expense.
Repayment of a grant related to an asset is recorded by increasing the carrying amount of the asset or reducing the deferred income balance by the amount repayable. The cumulative additional depreciation that would have been recognised to date as an expense in the absence of the grant is recognised immediately as an expense.
1.14 Revenue
Revenue from the sale of goods is recognised when all the following conditions have been satisfied:
• the Group has transferred to the buyer the significant risks and rewards of ownership of the goods;• the Group retains neither continuing managerial involvement to the degree usually associated with ownership nor
effective control over the goods sold;• the amount of revenue can be measured reliably;• it is probable that the economic benefits associated with the transaction will flow to the Group; and• the costs incurred or to be incurred in respect of the transaction can be measured reliably.
When the outcome of a transaction involving the rendering of services can be estimated reliably, revenue associated with the transaction is recognised by reference to the stage of completion of the transaction at the end of the reporting period. The outcome of a transaction can be estimated reliably when all the following conditions are satisfied:
• the amount of revenue can be measured reliably;• it is probable that the economic benefits associated with the transaction will flow to the Group;• the stage of completion of the transaction at the end of the reporting period can be measured reliably; and• the costs incurred for the transaction and the costs to complete the transaction can be measured reliably.
When the outcome of the transaction involving the rendering of services cannot be estimated reliably, revenue shall be recognised only to the extent of the expenses recognised that are recoverable.
Service revenue is recognised by reference to the stage of completion of the transaction at the end of the reporting period.
Stage of completion is determined by services performed to date as a percentage of total services to be performed.
Contract revenue comprises:
• the initial amount of revenue agreed in the contract; and• variations in contract work, claims and incentive payments: - to the extent that it is probable that they will result in revenue; and - they are capable of being reliably measured.
Revenue is measured at the fair value of the consideration received or receivable and represents the amounts receivable for goods and services provided in the normal course of business, net of trade discounts and volume rebates, and value added tax.
Interest is recognised, in profit or loss, using the effective interest rate method.
Royalties are recognised on the accrual basis in accordance with the substance of the relevant agreements. Dividends are recognised, in profit or loss, when the Company’s right to receive payment has been established.
Service fees included in the price of the product are recognised as revenue over the period during which the service is performed.
1.15 Borrowing costs
Borrowing costs that are directly attributable to the acquisition, construction or production of a qualifying asset are capitalised as part of the cost of that asset until such time as the asset is ready for its intended use. The amount of borrowing costs eligible for capitalisation is determined as follows:
• Actual borrowing costs on funds specifically borrowed for the purpose of obtaining a qualifying asset less any temporary investment of those borrowings.
• Weighted average of the borrowing costs applicable to the entity on funds generally borrowed for the purpose of obtaining a qualifying asset. The borrowing costs capitalised do not exceed the total borrowing costs incurred.
The capitalisation of borrowing costs commences when:
• expenditures for the asset have occurred;• borrowing costs have been incurred, and• activities that are necessary to prepare the asset for its intended use or sale are in progress.
Capitalisation is suspended during extended periods in which active development is interrupted.
Capitalisation ceases when substantially all the activities necessary to prepare the qualifying asset for its intended use or sale are complete.
All other borrowing costs are recognised as an expense in the period in which they are incurred.
SECT
ION
04
SECT
ION
03
PER
FOR
MAN
CE IN
FOR
MAT
ION
THIS
IS C
OEG
AAD
MIN
ISTR
ATIO
N
N O T E S T O T H E C O N S O L I D A T E D A N N U A L F I N A N C I A L S T A T E M E N T S

124 125C O E G A D E V E L O P M E N T C O R P O R A T I O N I N T E G R A T E D R E P O R T 2 0 1 6 / 1 7
2. NEw STANDARDS AND INTERPRETATIONS
2.1 Standards and interpretations not yet effective
The Group has chosen not to early adopt the following standards and interpretations, which have been published and are mandatory for the Group’s accounting periods beginning on or after 01 April 2017 or later periods:
IFRS 16 Leases
IFRS 16 Leases is a new standard which replaces IAS 17 Leases, and introduces a single lessee accounting model. The main changes arising from the issue of IFRS 16 which are likely to impact the Group are as follows:
Group as lessee:
• Lessees are required to recognise a right-of-use asset and a lease liability for all leases, except short term leases or leases where the underlying asset has a low value, which are expensed on a straight line or other systematic basis.
• The cost of the right-of-use asset includes, where appropriate, the initial amount of the lease liability; lease payments made prior to commencement of the lease less incentives received; initial direct costs of the lessee; and an estimate for any provision for dismantling, restoration and removal related to the underlying asset.
• The lease liability takes into consideration, where appropriate, fixed and variable lease payments; residual value guarantees to be made by the lessee; exercise price of purchase options; and payments of penalties for terminating the lease.
• The right-of-use asset is subsequently measured on the cost model at cost less accumulated depreciation and impairment and adjusted for any re-measurement of the lease liability. However, right-of-use assets are measured at fair value when they meet the definition of investment property and all other investment property is accounted for on the fair value model. If a right-of-use asset relates to a class of property, plant and equipment which is measured on the revaluation model, then that right-of-use asset may be measured on the revaluation model.
• The lease liability is subsequently increased by interest, reduced by lease payments and re-measured for reassessments or modifications.
• Re-measurements of lease liabilities are affected against right-of-use assets, unless the assets have been reduced to nil, in which case further adjustments are recognised in profit or loss.
• The lease liability is re-measured by discounting revised payments at a revised rate when there is a change in the
lease term or a change in the assessment of an option to purchase the underlying asset.
• The lease liability is re-measured by discounting revised lease payments at the original discount rate when there is a change in the amounts expected to be paid in a residual value guarantee or when there is a change in future payments because of a change in index or rate used to determine those payments.
• Certain lease modifications are accounted for as separate leases. When lease modifications which decrease the scope of the lease are not required to be accounted for as separate leases, then the lessee re-measures the lease liability by decreasing the carrying amount of the right of lease asset to reflect the full or partial termination of the lease. Any gain or loss relating to the full or partial termination of the lease is recognised in profit or loss. For all other lease modifications which are not required to be accounted for as separate leases, the lessee re-measures the lease liability by making a corresponding adjustment to the right-of-use asset.
• Right-of-use assets and lease liabilities should be presented separately from other assets and liabilities. If not, then the line item in which they are included must be disclosed. This does not apply to right-of-use assets meeting the definition of investment property which must be presented within investment property. IFRS 16 contains different disclosure requirements compared to IAS 17 leases.
Group as lessor:
• Accounting for leases by lessors remains similar to the provisions of IAS 17 in that leases are classified as either finance leases or operating leases. Lease classification is reassessed only if there has been a modification.
• A modification is required to be accounted for as a separate lease if it both increases the scope of the lease by adding the right to use one or more underlying assets; and the increase in consideration is commensurate to the stand alone price of the increase in scope.
• If a finance lease is modified, and the modification would not qualify as a separate lease, but the lease would have been an operating lease if the modification was in effect from inception, then the modification is accounted for as a separate lease. In addition, the carrying amount of the underlying asset shall be measured as the net investment in the lease immediately before the effective date of the modification. IFRS 9 is applied to all other modifications not required to be treated as a separate lease.
• Modifications to operating leases are required to be accounted for as new leases from the effective date of the modification. Changes have also been made to the disclosure requirements of leases in the lessor’s financial statements.
Sale and leaseback transactions:
• In the event of a sale and leaseback transaction, the requirements of IFRS 15 are applied to consider whether a performance obligation is satisfied to determine whether the transfer of the asset is accounted for as the sale of an asset.
• If the transfer meets the requirements to be recognised as a sale, the seller-lessee must measure the new right-of- use asset at the proportion of the previous carrying amount of the asset that relates to the right-of-use retained. The buyer-lessor accounts for the purchase by applying applicable standards and for the lease by applying IFRS 16
• If the fair value of consideration for the sale is not equal to the fair value of the asset, then IFRS 16 requires adjustments to be made to the sale proceeds. When the transfer of the asset is not a sale, then the seller-lessee continues to recognise the transferred asset and recognises a financial liability equal to the transfer proceeds. The buyer-lessor recognises a financial asset equal to the transfer proceeds.
The effective date of the standard is for years beginning on or after 01 January 2019.
The Group expects to adopt the standard for the first time in the 2020 consolidated annual financial statements.
The impact of this standard is currently being assessed.
Amendments to IAS 7: Disclosure initiative
The amendment requires entities to provide additional disclosures for changes in liabilities arising from financing activities. Specifically, entities are now required to provide disclosure of the following changes in liabilities arising from financing activities:
• changes from financing cash flows;• changes arising from obtaining or losing control of
subsidiaries or other businesses;• the effect of changes in foreign exchanges;• changes in fair values; and• other changes.
The effective date of the amendment is for years beginning on or after 01 January 2017.
The Group expects to adopt the amendment for the first time in the 2018 consolidated annual financial statements.
The impact of this amendment is currently being assessed.
Amendments to IAS 12: Recognition of Deferred Tax Assets for Unrealised Losses
In terms of IAS 12 Income Taxes, deferred tax assets are recognised only when it is probable that taxable profits will be available against which the deductible temporary differences can be utilised. The following amendments have been made, which may have an impact on the Group:
If tax law restricts the utilisation of losses to deductions against income of a specific type, a deductible temporary difference is assessed in combination only with other deductible temporary differences of the appropriate type.
Additional guidelines were prescribed for evaluating whether the Group will have sufficient taxable profit in future periods. The Group is required to compare the deductible temporary differences with future taxable profit that excludes tax deductions resulting from the reversal of those deductible temporary differences. This comparison shows the extent to which the future taxable profit is sufficient for the entity to deduct the amounts resulting from the reversal of those deductible temporary differences.
The amendment also provides that the estimate of probable future taxable profit may include the recovery of some of an entity’s assets for more than their carrying amount if there is sufficient evidence that it is probable that the entity will achieve this.
The effective date of the amendment is for years beginning on or after 01 January 2017.
The Group expects to adopt the amendment for the first time in the 2018 consolidated annual financial statements.
The impact of this amendment is currently being assessed.
NOTES TO THE CONSOLIDATED ANNUAL FINANCIAL STATEMENTS
SECT
ION
04
SECT
ION
03
PER
FOR
MAN
CE IN
FOR
MAT
ION
THIS
IS C
OEG
AAD
MIN
ISTR
ATIO
N
N O T E S T O T H E C O N S O L I D A T E D A N N U A L F I N A N C I A L S T A T E M E N T S
C O E G A D E V E L O P M E N T C O R P O R A T I O N I N T E G R A T E D R E P O R T 2 0 1 6 / 1 7

126 127C O E G A D E V E L O P M E N T C O R P O R A T I O N I N T E G R A T E D R E P O R T 2 0 1 6 / 1 7
Changes in estimates
The Group reassesses the useful lives and residual values of items of property, plant and equipment at the end of each end of the reporting period, in line with the accounting policy and IAS 16 Property, plant and equipment. These assessments are based on historic analysis, benchmarking, and the latest available and reliable information.
Details of properties
Registers with details of land and buildings are available for inspection by shareholders or their duly authorised representatives at the registered office of the Company.
2017 2016 Restated *
Cost or revaluation
Accumulated depreciation
Carrying value
Cost or revaluation
Accumulated depreciation
Carrying value
R’000 R’000 R’000 R’000 R’000 R’000 Land 28,550 - 28,550 28,550 - 28,550Buildings 261,004 (81,244) 179,760 260,974 (70,804) 190,170Furniture and fixtures 8,243 (5,724) 2,519 7,976 (5,157) 2,819Motor vehicles 42,049 (36,846) 5,203 43,033 (31,141) 11,892Office equipment - - - 2,003 (1,313) 690IT equipment 5,362 (2,541) 2,821 5,156 (1,786) 3,370Other property, plant and equipment 12,662 (7,329) 5,333 33,928 (26,856) 7,072Capital - Work in progress 330,391 - 330,391 308,669 - 308,669Total 688,261 (133,684) 554,577 690,289 (137,057) 553,232
* See Notes
2015 Restated *
Cost or revaluation
Accumulated depreciation
Carrying value
R’000 R’000 R’000 Land 28,550 - 28,550Buildings 260,684 (60,009) 200,675Furniture and fixtures 7,214 (3,923) 3,291Motor vehicles 43,033 (24,337) 18,696Office equipment 1,757 (1,184) 573IT equipment 4,343 (1,091) 3,252Other property, plant and equipment 35,507 (26,839) 8,668Capital - Work in progress 231,561 - 231,561Total 612,649 (117,383) 495,266
* See Notes
Opening balance Additions CWIP
transfers
Other changes,
movements Depreciation Total
R’000 R’000 R’000 R’000 R’000 R’000 Land 28,550 - - - - 28,550Buildings 190,170 29 - - (10,439) 179,760Furniture and fixtures 2,819 349 - 4 (653) 2,519Motor vehicles 11,892 - - (172) (6,517) 5,203Office equipment 690 - - (690) - -IT equipment 3,370 207 - - (756) 2,821Other property, plant and equipment 7,072 - - - (1,739) 5,333Capital - Work in progress 308,669 137,299 (115,577) - - 330,391Total 553,232 137,884 (115,577) (858) (20,104) 554,577
Opening balance Additions CWIP
transfers Depreciation Total
R’000 R’000 R’000 R’000 R’000 Land 28,550 - - - 28,550Buildings 200,675 290 - (10,795) 190,170Furniture and fixtures 3,291 - - (472) 2,819Motor vehicles 18,696 - - (6,804) 11,892Office equipment 573 117 - - 690IT equipment 3,252 813 - (695) 3,370Other property, plant and equipment 8,668 - - (1,596) 7,072Capital - Work in progress 231,561 178,402 (101,294) - 308,669Total 495,266 179,622 (101,294) (20,362) 553,232
* See Notes
Opening balance Additions CWIP
transfers Other
transfers Depreciation Total
R’000 R’000 R’000 R’000 R’000 R’000 Land 28,550 - - - - 28,550Buildings 209,471 1,089 - (160) (9,725) 200,675Furniture and fixtures 4,196 126 - - (1,031) 3,291Motor vehicles 24,324 1,176 - - (6,804) 18,696Office equipment 421 1,000 - - (848) 573IT equipment 2,523 1,260 - - (531) 3,252Other property, plant and equipment 2,668 7,486 - - (1,486) 8,668Capital - Work in progress 166,549 90,319 (25,644) 337 - 231,561Total 438,702 102,456 (25,644) 177 (20,425) 495,266
3. PROPERTY, PLANT AND EQUIPMENT
Reconciliation of property, plant and equipment - 2017
Reconciliation of property, plant and equipment - 2016 Restated *
Reconciliation of property, plant and equipment - 2015 Restated *
SECT
ION
04
SECT
ION
03
PER
FOR
MAN
CE IN
FOR
MAT
ION
THIS
IS C
OEG
AAD
MIN
ISTR
ATIO
N
N O T E S T O T H E C O N S O L I D A T E D A N N U A L F I N A N C I A L S T A T E M E N T S

128 129C O E G A D E V E L O P M E N T C O R P O R A T I O N I N T E G R A T E D R E P O R T 2 0 1 6 / 1 7
The company’s investment properties, comprising the Construction Village, Commercial Centre, tenanted properties, Developed Zones and Logistics Park, were last valued on 31 March 2016 by independent external valuers, Marsh (Pty) Limited, who are registered as Professional Valuers in terms of Section 22 of the Property Valuers Profession Act, 2000 (No. 47 of 2000). Management has reviewed the valuation for the current year and has taken into consideration the valuation that took place in the prior year in arriving at the fair value for investment property.
The individual land components within Zones 1 to 5 have been based on fully serviced land and leasehold improvements. Zone 6 was valued based on partially serviced land. Zones 7-14 were based on bulk land except for improvements to Cerebos and Electrawinds.
The Logistics Park was valued as leasehold land.
Tenanted properties were valued in terms of the investment method/income approach or using a discounted cash flow. The Construction Village has been valued using the comparable sales approach and the commercial centre on the depreciated replacement cost method. Serviced and bulk land were valued using the comparable sales approach.
A register containing the information required by Regulation 25(3) of the Companies Regulations, 2011 is available for inspection at the registered office of the Company.
5. INTANGIBLE ASSETS
The following amounts have been recognised in the income statement:2017
R'000
2016 Restated *
R'000
2015 Restated *
R'000Rental income 236,896 239,138 213,885Direct operating expenses that generated rental income 72,971 66,656 68,250
4. INVESTMENT PROPERTY
2017 2016 Restated *
Cost / Valuation
Accumulated depreciation
Carrying value
Cost / Valuation
Accumulated depreciation
Carrying value
R’000 R’000 R’000 R’000 R’000 R’000
Investment property 5,112,622 - 5,112,622 4,882,988 - 4,882,988
* See Notes
2015 Restated *
Cost / Valuation
Accumulated depreciation
Carrying value
R’000 R’000 R’000
Investment property 4,464,730 - 4,464,730
* See Notes
2017 2016 Restated *
Cost / Valuation
Accumulated depreciation
Carrying value
Cost / Valuation
Accumulated depreciation
Carrying value
R’000 R’000 R’000 R’000 R’000 R’000
Computer software, other 59,076 (59,069) 7 64,863 (64,518) 345
2015 Restated *
Cost / Valuation
Accumulated depreciation
Carrying value
R’000 R’000 R’000
Computer software, other 64,745 (63,071) 1,674
Opening balance Additions Disposals CWIP
Transfers Fair value
adjustments Total
R’000 R’000 R’000 R’000 R’000 R’000
Investment property 4,464,730 249,494 (32,600) 101,294 100,070 4,882,988
* See Notes
Opening balance Additions
Other changes,
movements Amortisation Total
R’000 R’000 R’000 R’000 R’000
Computer software, other 1,674 118 37 (1,484) 345
Opening balance Amortisation Total
R’000 R’000 R’000
Computer software, other 345 (338) 7
Opening balance Additions Transfers Total
R’000 R’000 R’000 R’000
Investment property 4,882,988 114,057 115,577 5,112,622
Opening balance Additions Transfers Transfers out Total
R’000 R’000 R’000 R’000 R’000
Investment property 4,349,287 89,976 25,644 (177) 4,464,730
Reconciliation of investment property - 2017
Reconciliation of intangible assets - 2017
Reconciliation of investment property - 2016 Restated *
Reconciliation of investment property - 2015 Restated *
Reconciliation of intangible assets - 2016 Restated *
SECT
ION
04
SECT
ION
03
PER
FOR
MAN
CE IN
FOR
MAT
ION
THIS
IS C
OEG
AAD
MIN
ISTR
ATIO
N
N O T E S T O T H E C O N S O L I D A T E D A N N U A L F I N A N C I A L S T A T E M E N T S

130 131C O E G A D E V E L O P M E N T C O R P O R A T I O N I N T E G R A T E D R E P O R T 2 0 1 6 / 1 7
6. INTERESTS IN SUBSIDIARIES
2017
R’000
2016 Restated *
R’000
2015 Restated *
R’000
Deferred tax liability Temporary differences (500,905) (501,304) (488,746)Deferred tax liability (500,905) (501,304) (488,746)Deferred tax asset 26 - 110 Total net deferred tax liability (500,879) (501,304) (488,636)
Reconciliation of deferred tax asset / (liability) At beginning of year (501,304) (488,636) (534,314)Taxable / (deductible) temporary difference movements (2,558) (12,368) 45,678Other 2,983 (300) - (500,879) (501,304) (488,636)
The deferred tax rate applied to the fair value adjustments of investment properties/ financial assets is determined by the expected manner of recovery. Where the expected recovery of the investment property/financial assets is through sale the capital gains tax rate of 19% (2016: 19% ; 2015: 19%) is used. If the expected manner of recovery is through indefinite use the normal tax rate of 28% (2016: 28% ; 2015: 28%) is applied.
If the manner of recovery is partly through use and partly through sale, a combination of capital gains rate and normal tax rate is used.
The deferred tax on the fair value adjustments on investment properties/financial assets comprises of:
R511million (2016: R511 million; 2015: R483 million) at the normal tax rate.
The Group has not reclassified any financial assets from cost or amortised cost to fair value, or from fair value to cost or amortised cost during the current or prior year.
There were no gains or losses realised on the disposal of held to maturity financial assets in 2017 and 2016, as all the financial assets were disposed of at their redemption date.
8. FINANCIAL ASSETS BY CATEGORY
7. OTHER FINANCIAL ASSETS
The accounting policies for financial instruments have been applied to the line items below:
Held by % voting
power 2017
% voting power
2016 Restated *
Carrying amount
2017
Carrying amount
2016 Restated *
Rapid Infrastructure Development Agency (Pty) Ltd
COEGADevelopmentCorporation
(Pty) Ltd
100% 100% - -
2017R’000
2016 Restated *
R’000
2015Restated *
R’000Loans and
receivablesLoans and
receivablesLoans and
receivablesTrade and other receivables 240,184 323,657 292,021
Cash and cash equivalents 755,149 291,142 482,354
Loans and advances 17,944 9,148 1,146
Other financial assets 18 - -
Total 1,013,295 623,947 775,521
2017R’000
2016 Restated *
R’000
2015Restated *
R’000
Loans and receivablesInterest receivable 18 - -
Current assetsInterest receivable 18 - -
9. DEFERRED TAX
SECT
ION
04
SECT
ION
03
PER
FOR
MAN
CE IN
FOR
MAT
ION
THIS
IS C
OEG
AAD
MIN
ISTR
ATIO
N
N O T E S T O T H E C O N S O L I D A T E D A N N U A L F I N A N C I A L S T A T E M E N T S
Opening balance Additions
Other changes,
movements Amortisation Total
R’000 R’000 R’000 R’000 R’000
Computer software, other 4,100 1,799 (1,448) (2,777) 1,674
Reconciliation of intangible assets - 2015 Restated *

132 133C O E G A D E V E L O P M E N T C O R P O R A T I O N I N T E G R A T E D R E P O R T 2 0 1 6 / 1 7
2017R’000
2016Restated *
R’000
2015Restated *
R’000
Trade receivables 242,559 194,344 122,650Provision for impairment (84,102) (78,698) (13,825)Net trade receivables 158,457 115,646 108,825Deposits 517 517 (7)VAT - - 9,122Other receivable 81,210 207,494 174,081 240,184 323,657 292,021
10. LOANS AND ADVANCES
11. TRADE AND OTHER RECEIVABLES
Credit quality of trade and other receivables
The company’s customers included in trade and other receivables comprise amounts due from tenants and state funded entities and other related parties. In determining the recoverability of trade receivables, the CDC considers any change in the credit quality of trade receivables from the date credit was initially granted up to the end of the reporting period.
Trade and other receivables past due but not impaired
Trade and other receivables which are less than 3 months past due are not considered to be impaired. At 31 March 2017, R30,3 million (2016: R18,1 million; 2015: R- of trade and other receivables were past due but not impaired.
The Group provides finance to small businesses that are contracted within the Development Zone to enable them to run their businesses. These loans are for variable amounts and finance terms and bear interest at 2,25% per month and 3,5% per month when terms are exceeded.
2017R’000
2016Restated *
R’000
2015Restated *
R’000 Loans and advances 18,069 9,148 1,146 Provision for impairment (125) - -
17,944 9,148 1,146
SECT
ION
04
SECT
ION
03
PER
FOR
MAN
CE IN
FOR
MAT
ION
THIS
IS C
OEG
AAD
MIN
ISTR
ATIO
N
N O T E S T O T H E C O N S O L I D A T E D A N N U A L F I N A N C I A L S T A T E M E N T S
The ageing of amounts past due but not impaired is as follows:
2017R’000
2016Restated *
R’000
2015Restated *
R’000
0 to 3 months 41,124 18,172 -over 6 months past due (10,787) - -
Reconciliation of provision for impairment of trade and other receivables
2017R’000
2016Restated *
R’000
2015Restated *
R’000 Opening balance 78,697 13,825 -Provision for impairment 5,405 64,872 (21,486)
84,102 78,697 (21,486)
The creation and release of provision for impaired receivables have been included in operating expenses in profit or loss (note 22). Amounts charged to the allowance account are generally written off when there is no expectation of recovering additional cash.
The maximum exposure to credit risk at the reporting date is the fair value of each class of loan mentioned above. The Group holds cash deposits from tenants in the IDZ as security for rental amounts due.
Trade and other receivables impaired
As of 31 March 2017, trade and other receivables of R213,5 million (2016: R139,5 million; 2015: R-) were impaired and provided for.
The amount of the provision was R84,1 million as of 31 March 2017 (2016: R78,7 million; 2015: R13,8 million).
The ageing of these is as follows:
2017R’000
2016Restated *
R’000
2015Restated *
R’000 0 to 3 months 130,526 40,858 -3 to 6 months 20,553 43,481 -over 6 months 62,396 55,191 -
2017 2016Restated *
2015Restated *
R’000 R’000 R’000 Cash on hand 945 25 33Bank balances 522,974 143,951 278,972Short-term deposits 231,230 147,166 203,349 755,149 291,142 482,354
12. CASH AND CASH EQUIVALENTS
The bank and cash balances above include funds held which is not available to the CDC amounting to R636 million (2016: R262 million; 2015: R220 million). R254 million (2016: R134 million; 2015: R208 million) of this is the SEZ Funds earmarked for special projects, and of which the corresponding liability is disclosed as deferred grant income. It should further be noted, to reconcile the deferred income of R354 million to the SEZ Fund cognisance should be taken that R64 million has been paid as input VAT to date and R51 million has been paid out to creditors based on judgments issued against the CDC.
Cash and cash equivalents consist of:

134 135C O E G A D E V E L O P M E N T C O R P O R A T I O N I N T E G R A T E D R E P O R T 2 0 1 6 / 1 7
SECT
ION
04
SECT
ION
03
PER
FOR
MAN
CE IN
FOR
MAT
ION
THIS
IS C
OEG
AAD
MIN
ISTR
ATIO
N
N O T E S T O T H E C O N S O L I D A T E D A N N U A L F I N A N C I A L S T A T E M E N T S
2017 2016Restated *
2015Restated *
R’000 R’000 R’000Authorised1 000 000 ordinary shares of 1 cent each - 10,000 10,000 1 “A” Class share of R1 each - 1 1 - 10,001 10,001 IssuedOrdinary shares 7 7 7Share premium 1,264,551 1,264,551 1,264,551
1,264,558 1,264,558 1,264,558
13. SHARE CAPITAL
Opening Balance
Accrued Paid out Additions Utilised
during the year
Adjustments Total
Reconciliations of provisions - 2017 Provision for leave pay 16,340 23,770 (2,517) - (19,709) (624) 17,260 16,340 23,770 (2,517) - (19,709) (624) 17,260
Reconciliations of provisions - 2016 Restated * Provision for leave pay 19,760 - - 23,325 (26,745) - 16,340 Provision for performance incentives 22,675 - - - (22,675) - - 42,435 - - 23,325 (49,420) - 16,340Reconciliations of provisions - 2015 Restated * Provision for leave pay 12,143 - - 23,133 (15,516) - 19,760 Provision for performance incentives 33,548 - - 29,337 (40,210) - 22,675 45,691 - - 52,470 (55,726) - 42,435
14. PROVISIONS
15. FINANCIAL LIABILITIES BY CATEGORY
The accounting policies for financial instruments have been applied to the line items below:
2017R’000
2016Restated *
R’000
2015Restated *
R’000Financial
liabilities atamortised
cost
Financialliabilities atamortised
cost
Financialliabilities atamortised
cost
Trade and other payables 640,877 524,769 438,225
Total 640,877 524,769 438,225
17. TRADE AND OTHER PAYABLES
2017 R'000
2016Restated *
R'000
2015Restated *
R'000
Trade payables 142,655 253,152 111,529
VAT 26,439 5,033 -
Other payables - projects 435,447 237,975 309,551
Accrued audit fees 53 - -
Other accrued expenses 8 - -
Deposits received 18,542 16,583 971
Other payables 17,733 12,026 16,174
640,877 524,769 438,225
2017
R’000
2016Restated *
R’000
2015Restated *
R’000
Non-current portion
On the 8th of December 2010, CDC concluded a 12 year agreement with Souvaris in respect of the General Motors South Africa property. Effectively CDC has ceded and assigned its rights, title and obligations in the GMSA lease to Souvaris. Souvaris in return paid an amount of R125 million to CDC.
59,028 69,445 83,331
On the 1st February 2015, CDC concluded a 50 year agreement with MSC, who made an upfront payment of R19.8 million for the lease contract. 18,546 18,941 19,338
77,574 88,386 102,669
2017R’000
2016Restated *
R’000
2015Restated *
R’000
Current portion
On the 8th of December 2010, CDC concluded a 12 year agreement with Souvaris in respect of the General Motors South Africa property. Effectively CDC has ceded and assigned its rights, title and obligations in the GMSA lease to Souvaris. Souvaris in return paid an amount of R125 million to CDC.
10,417 10,417 10,417
On the 1st February 2015, CDC concluded a 50 year agreement with MSC, who made an upfront payment of R19.8 million for the lease contract. 396 396 396
10,813 10,813 10,813
16. INCOME RECEIVED IN ADVANCE

136 137C O E G A D E V E L O P M E N T C O R P O R A T I O N I N T E G R A T E D R E P O R T 2 0 1 6 / 1 7
2017
R’000
2016Restated *
R’000
2015 Restated *
R’000
Government grants At beginning of the year 30,963 156,460 1,922 Grants received during the year 552,631 320,188 335,946Interest earned on unspent grant funds received 8,418 8,497 -Released to income (217,709) (454,182) (126,929)- to offset costs (37,719) (46,491) -- against investment properties - (46,478) (85,088)- against depreciation - - (9,300)- IDZ Projetcs (179,990) (361,213) (87,020) 374,303 30,963 156,460At end of the year - to be released / offset beyond one year 374,303 30,963 156,460 374,303 30,963 156,460
18. DEFERRED INCOME
Funding of R552,6 million was received from the SEZ Fund and R217,7 million was utilised / paid out during the year. The unused portion of R374,3 million is deferred to the next financial year as the funding is ringfenced for specific projects. The CDC may not use the funding other than as directed in the approvals.
19. REVENUE
20. OTHER OPERATING INCOME
2017R’000
2016Restated *
R’000
Rendering of services 98 200 Royalty income 57 - Other rental income 236,896 239,138Interest received (trading) 4,878 3,494Management fees 307,131 286,520Discount allowed (8) -
549,052 529,352
2017
R’000
2016Restated *
R’000
Sundry income 15,932 10,496 Government grants 218,619 455,344
234,551 465,840
Revenue from continuing operations is earned through rentals from investment properties (disclosed in note 4), interest resulting from the provision of working capital loans to SMMEs as well as fees from provisioning of management services. Revenue from management services includes fees from travel management services, infrastructure programme management services and other consulting services.
SECT
ION
04
SECT
ION
03
PER
FOR
MAN
CE IN
FOR
MAT
ION
THIS
IS C
OEG
AAD
MIN
ISTR
ATIO
N
N O T E S T O T H E C O N S O L I D A T E D A N N U A L F I N A N C I A L S T A T E M E N T S
21. OTHER OPERATING GAINS (LOSSES)
2017R’000
2016Restated *
R’000Gains (losses) on disposals, scrappings and settlements Investment property - (11,130)
Fair value gains (losses) Investment property - 100,070Total other operating gains (losses) - 88,940

138 139C O E G A D E V E L O P M E N T C O R P O R A T I O N I N T E G R A T E D R E P O R T 2 0 1 6 / 1 7
23. EMPLOYEE COST
The following items are included within employee costs:
2017
R'000
2016Restated *
R'000
Employee costs Basic 248,774 241,371Bonus 24,675 3,378Medical aid - group contributions 7,060 6,582UIF 9 9WCA 507 2,873SDL 2,674 2,618Leave pay provision charge 704 (4,924)Funeral benefit 293 53Short term benefits 38 42Other short term costs 6,645 6,680Retirement benefit plans 18,967 17,875 310,346 276,557Total employee costs Indirect employee costs - -Direct employee costs 310,346 276,557
310,346 276,557
Expenses by nature
SECT
ION
04
SECT
ION
03
PER
FOR
MAN
CE IN
FOR
MAT
ION
THIS
IS C
OEG
AAD
MIN
ISTR
ATIO
N
N O T E S T O T H E C O N S O L I D A T E D A N N U A L F I N A N C I A L S T A T E M E N T S
22. OPERATING PROFIT / (LOSS)
2017
R’000
2016Restated *
R’000Remuneration, other than employeesConsulting and professional services 11,303 16,159Technical services 5 -
11,308 16,159Employee costsSalaries, wages, bonuses and other benefits 284,403 251,907Short term benefits 293 53Short term benefits 2 38 42Other short term costs 6,645 6,680Retirement benefit plans: defined contribution expense 18,967 17,875Total employee costs 310,346 276,557
LeasesOperating lease charges Premises 3,292 4,850 Operating lease rentals 381 -Operating lease other 2,087 290
5,760 5,140Depreciation and amortisationDepreciation of property, plant and equipment 20,107 20,450Amortisation of intangible assets 339 1,422Total depreciation and amortisation 20,446 21,872
OtherOther operating gains (losses) 21 - 88,940Research and development costs 713 1,191
2017
R’000
2016 Restated *
R’000
Employee costs 310,346 276,557Operating lease charges 5,760 5,140Depreciation, amortisation and impairment 20,446 21,872Other expenses 257,224 367,799
593,776 671,368
The total cost of sales, selling and distribution expenses, marketing expenses, general and administrative expenses, research and development expenses, maintenance expenses and other operating expenses are analysed by nature as follows:
Operating profit (loss) for the year is stated after charging (crediting) the following, amongst others:

140 141C O E G A D E V E L O P M E N T C O R P O R A T I O N I N T E G R A T E D R E P O R T 2 0 1 6 / 1 7
Salary
Other Short Term
Benefits
Performance Incentive
Paid
Total Cost to Company
Total Cost to Company
2017 2016Restated *
R’000 R’000 R’000 R’000 R’000
L Billings 1,756 66 239 2,062 776
T Ngxekana 1,107 135 157 1,399 983
V Heynes 914 119 102 1,135 1,136
N Keti 1,158 144 126 1,428 1,096
Z Kunene 857 85 - 943 1,806
T Poswa 1,153 147 304 1,604 1,329
Z Mtanda 1,385 167 110 1,662 1,480
M van Zyl 1,144 139 130 1,413 1,437
Z Mqhathu 1,408 171 382 1,961 1,762
S Simayi 1,434 173 335 1,942 1,778
R Magotsi 1,265 328 - 1,593 1,741
H van der Kolf 1,769 452 394 2,615 3,084
T Gwintsa 2,314 331 555 3,200 2,531
T Koza 2,486 341 536 3,363 3,824
D Lefutso 1,656 283 464 2,404 2,136
C Mashigo 1,962 275 426 2,663 3,053
M Mawasha 1,879 222 550 2,651 2,341
C Mbande 1,873 363 616 2,852 3,084
B Mthembu 2,099 291 550 2,940 2,100
R Temmers 1,298 157 184 1,639 1,563
30,917 4,389 6,160 41,469 39,040
Key management personnel (other than directors):
Salary
Other Short Term
Benefits
Performance Incentive
Paid
Total Cost to Company
Total Cost to Company
2017 2016 Restated *
R’000 R’000 R’000 R’000 R’000
Executive management and programme directors 30,918 4,391 6,160 41,469 41,563
Other employees 215,629 28,634 18,968 263,231 254,367
246,547 33,025 25,128 304,700 295,930
Analysis of employee costs paid (excluding directors)
2017 2016
Restated *
Fixed term contract employees 387 401
Permanent employees 181 190
Temporary employees 19 22
587 613
Number of persons employed during the year was:
Included in the above-mentioned employee costs are costs for the following key management personnel:
SECT
ION
04
SECT
ION
03
PER
FOR
MAN
CE IN
FOR
MAT
ION
THIS
IS C
OEG
AAD
MIN
ISTR
ATIO
N
N O T E S T O T H E C O N S O L I D A T E D A N N U A L F I N A N C I A L S T A T E M E N T S
24. DEPRECIATION, AMORTISATION AND IMPAIRMENTS
The following items are included within depreciation, amortisation and impairments: 2017 R'000
2016Restated *
R'000Depreciation Property, plant and equipment 20,107 20,450
Amortisation Intangible assets 339 1,422
Total depreciation, amortisation and impairmentsDepreciation 20,107 20,450Amortisation 339 1,422Impairments - -
20,446 21,872
26. FINANCE COSTS
2017
R’000
2016 Restated *
R’000
Trade and other payables 21,571 12,231
Tax authorities 8 -
Total finance costs 21,579 12,231
25. INVESTMENT INCOME
2017
R’000
2016 Restated *
R’000
Interest income from investments in financial assets:Bank and other cash 3,006 1,323

142 143C O E G A D E V E L O P M E N T C O R P O R A T I O N I N T E G R A T E D R E P O R T 2 0 1 6 / 1 7
27. TAXATION
2017
R’000
2016Restated *
R’000
Current
Local income tax - current period 454 137
Local income tax - recognised in current tax for prior periods 8 -
462 137
Deferred
Originating and reversing temporary differences (425) 12,668
Other deferred tax - -
(425) 12,668
37 12,805
Major components of the tax (income) expense
Reconciliation of the tax expense
Reconciliation between accounting profit and tax expense.
No provision has been made for 2017 tax as the Group has no taxable income. The estimated tax loss available for set off against future taxable income is R16,4 million (2016: R163,3 million).
2017
R’000
2016Restated *
R’000
Accounting (loss) profit 171,254 401,856
Tax at the applicable tax rate of 28% (2016: 28%) 47,951 112,520
Tax effect of adjustments on taxable income
Non-temporary timing differences (44,938) (104,014)
Capital gain - 3,999
Prior year adjustment (2,976) 300
37 12,805
Deductible temporary differences, unused tax losses and unused tax credits for which no deferred tax asset has been recognised. - -
2017R’000
2016Restated *
R’000
(Loss) profit before taxation 171,254 401,856
Adjustments for:
Depreciation and amortisation 20,442 21,810
Losses on disposal, scrappings and settlements of assets and liabilities 858 11,130
Interest income (3,006) (1,323)
Finance costs 21,579 12,231
Fair value gains - (100,070)
Movements in provisions 920 (26,095)
Government grants released to income (217,709) (454,183)
Changes in working capital:
Inventories (257) -
Trade and other receivables 83,473 (31,636)
Prepayments 12 (12)
Loans and advances (8,795) (8,002)
Trade and other payables 116,108 86,543
Income received in advance released to income (10,813) (14,283)
174,066 (102,034)
28. CASH GENERATED FROM OPERATIONS
SECT
ION
04
SECT
ION
03
PER
FOR
MAN
CE IN
FOR
MAT
ION
THIS
IS C
OEG
AAD
MIN
ISTR
ATIO
N
N O T E S T O T H E C O N S O L I D A T E D A N N U A L F I N A N C I A L S T A T E M E N T S

144 145C O E G A D E V E L O P M E N T C O R P O R A T I O N I N T E G R A T E D R E P O R T 2 0 1 6 / 1 7
29. COMMITMENTS
2017
R’000
2016Restated *
R’000
Already contracted for but not provided for
Property, plant and equipment - -
Investment property 131,750 240,770
Not yet contracted for and authorised by directors - -
Authorised capital expenditure
This committed expenditure will be financed by grant funding, existing cash resources and other internally generated funds.
Investment properties
Operating lease payments represent rentals payable by the Group for certain of its office properties. Leases are typically negotiated for varying lease terms of between 1 and 5 years and rentals typically escalate annually over the lease term. No contingent rent is payable.
2017
R’000
2016Restated *
R’000
Minimum lease payments due
within one year 127,300 110,647
in second to fifth year inclusive 502,762 458,148
later than five years 1,050,692 1,224,014
1,680,754 1,792,809
Operating leases – as lessor (income)
2017
R’000
2016Restated *
R’000
Minimum lease payments due
within one year 1,502 3,799
in second to fifth year inclusive 695 2,513
later than five years - -
2,197 6,312
Operating leases – as lessee (expense)
30. CONTINGENCIES
The Group had claims by various third parties arising from contractual disputes which are still unresolved, and the outcome of these claims cannot be reliably assessed at year end. The total value of such potential claims is estimated at R110,4 million (2016: R58,2 million).
Land Arbitrations:
The price of certain land which has been acquired in the Coega Industrial Development Zone is subject to arbitration. The dispute is between Ntinga Property Investment (Pty) Ltd and CDC. The dispute arises out of a sale agreement entered into between Ntinga (the seller) and Coega (the purchaser) in respect of certain immovable property as well as the purchase and sale of mineral rights on the property and the mining license in relation to such mining rights. The matter was referred to arbitration as provided by the sale agreement. The claimant has not taken any further steps to pursue the matter. The matter is therefore dormant at this stage. Management’s assessment of the case is that the matter will not have an impact on the annual financial statements.
SARS Income Tax:
An audit of Income Tax was conducted by SARS during the 2013 financial year, which concluded that the treatment of government grants received by the CDC as exempt from Income Tax was incorrect. Assessments were issued for the Financial year of 2007 to 2011 for additional tax of R322 million and imposed interest and penalties. The CDC objected to the appeal during May 2014, the objection was concluded favourably, and the previous assessments were revised and the liability claimed was reduced to R18 million and penalties and interests were waived. The CDC accepted the decision by SARS but appealed against computation errors on the revised assessment which result from incorrect treatment of certain expenses. The CDC awaits the outcome of this appeal, and the resultant refund of the R15 million paid in March 2013 on initial conclusion of the audit which is yet to be refunded by SARS.
Following an audit, SARS raised an assessment requiring payment of tax of R53 million on the basis that the transaction where CDC sold rental streams to Redefine properties in order to fund for payment for infrastructure during 2012/2013 amounted to a lease premium in terms of the Income Tax Act. The CDC has objected to this assessment and has consulted widely and is confident that this will be concluded in favour of the CDC.
Guarantees and other credit facilities:
The CDC holds guarantees amounting to R765 000 with First National Bank, issued in favour of International Air Transport Association, the licensing authority for the Company’s travel licence. The guarantees do not have a maturity date. In addition, the CDC has credit card facilities with a combined limit of R350 000, petrol cards to the value of R520 000 held with Wesbank.
Claim against the Department of Trade & Industry:
The Group submitted a claim of R156 million against the dti for projects that the Group contended were approved prior to 2014/15 financial year. The dti disputed the claim and subsequently appointed Ernst Young (EY) to conduct an audit verification of the said expenditure. The EY report found that R130 million was valid which determination the Company accepted.
The Group has received R72 million to date and is continuing to engage the dti on the remainder being R59 million which is constituted by projects found to have been duly approved including costs to completions of abandoned projects to be submitted to the SEZ Fund panel by the dti SEZ team, without any additional submission required from the Company.
Had these funds been received the Group would have been able to meet the obligations which resulted in the judgements referred to in note 12 and the utilisation of the SEZ Fund bank account.
SECT
ION
04
SECT
ION
03
PER
FOR
MAN
CE IN
FOR
MAT
ION
THIS
IS C
OEG
AAD
MIN
ISTR
ATIO
N
N O T E S T O T H E C O N S O L I D A T E D A N N U A L F I N A N C I A L S T A T E M E N T S

146 147C O E G A D E V E L O P M E N T C O R P O R A T I O N I N T E G R A T E D R E P O R T 2 0 1 6 / 1 7
The Department of Trade and Industry is the Executive Authority in terms of the PFMA based on the A class share which confers majority voting control. All issued ordinary shares are held by the Eastern Cape Provincial Government through the Eastern Cape Development Corporation. Grants received from government during the year are fully disclosed in note 18. There were no further transactions with related parties during the year other than those disclosed in this note. Details regarding directors’ emoluments and key/executive management compensation are disclosed in note 32 as well as note 23.
Relationships:
Holding group: Eastern Cape Development CorporationSubsidiaries: Refer to note 6Members of key management: M Silinga T Ngxekana L Billings V Heynes B Mthembu N Keti T Koza Z Kunene D Lefutso T Poswa Z Mapoma Z Mtanda C Mashigo M van Zyl M Mawasha Z Mqhathu C Mbande S Simayi R Temmers R Magotsi T Gwintsa H van der Kolf
31. RELATED PARTIES
2017
R’000
2016Restated *
R’000
Loan accounts - Owing (to) by related parties:
Rapid Infrastructure Development Agency (Pty) Ltd 20,611 10,665
Included in above related party balances are transactions in respect of:
Expenses paid on behalf of Rapid Infrastructure Development agency (Pty) Ltd 3,946 2,520
Net amounts advanced to Rapid Infrastructure Development Agency (Pty) Ltd under loan agreement
6,000 8,145
Amounts owing to the Company by Related Parties:
Department of Economic Development, Environment and Tourism - 1,679
Grants received:
Department of Trade and Industry 514,910 273,698
Department of Economic Development, Environmental Affairs & Tourism 37,719 46,491
552,629 320,189
32. DIRECTORS’ EMOLUMENTS
Executive
Non-executive
Directors’
Fees
Total Cost to
Company
Directors’ Fees
Total Cost to
Company
2017 2017 2016Restated *
2016 Restated *
R’000 R’000 R’000 R’000
Dr P. Jourdan (Chairperson) 255 255 113 113
B. Lobishe 58 58 - -
P.S. Ndoni - - 14 14
J.J de Bruyn 268 268 141 141
S.T. Zakuza 78 78 15 15
S. Liebenberg 180 180 119 119
Adv. T. Norman SC 118 118 43 43
N.V. Qangule 155 155 76 76
A. Mjekula 192 192 94 94
1,304 1,304 615 615
Salary Performance
incentive
Total Cost to
Company Salary
Performance incentive
Total Cost to
Company
2017 2017 2017 2016Restated *
2016 Restated *
2016Restated *
R’000 R’000 R’000 R’000 R’000 R’000
M.P. Silinga 4,563 - 4,563 4,276 2,803 7,079
4,563 - 4,563 4,276 2,803 7,079
Related party balances
SECT
ION
04
SECT
ION
03
PER
FOR
MAN
CE IN
FOR
MAT
ION
THIS
IS C
OEG
AAD
MIN
ISTR
ATIO
N
N O T E S T O T H E C O N S O L I D A T E D A N N U A L F I N A N C I A L S T A T E M E N T S

148 149C O E G A D E V E L O P M E N T C O R P O R A T I O N I N T E G R A T E D R E P O R T 2 0 1 6 / 1 7
33. CATEGORIES OF FINANCIAL INSTRUMENTS
Debt instruments at amortised
cost
Financial liabilities at amortised
cost
Leases
Equity and non financial
assets and liabilities
Total
Notes R’000 R’000 R’000 R’000 R’000
ASSETS
Non-current assets
Property, plant and equipment 3 - - - 554,577 554,577
Investment property 4 - - - 5,112,622 5,112,622
Intangible assets 5 - - - 7 7
- - - 5,667,206 5,667,206
Current assets Inventories - - - 257 257
Other financial assets 7 - - - 18 18
Trade and other receivables 11 240,184 - - - 240,184
Loans and advances 10 - - - 17,944 17,944
Cash and cash equivalents 12 755,149 - - - 755,149
995,333 - - 18,219 1,013,552
Total assets 995,333 - - 5,685,425 6,680,758
EQUITY
Equity Attributable to Equity Holders of Parent
Share capital 13 - - - 1,264,558 1,264,558
Retained income 13 - - - 3,793,663 3,793,663
Total Equity - - - 5,058,221 5,058,221 LIABILITIES
Non-current liabilities Deferred income 18 - - - 374,303 374,303
Deferred tax 9 - - - 500,879 500,879
Income received in advance 16 - - - 77,574 77,574
- - - 952,756 952,756
Current liabilities Current tax payable - - - 831 831
Trade and other payables 17 - 667,318 (26,439) - 640,879
Provisions 14 - - - 17,260 17,260
Income received in advance 16 - - - 10,813 10,813
- 667,318 (26,439) 28,904 669,783
Total liabilities - 667,318 (26,439) 981,660 1,622,539Total equity and liabilities - 667,318 (26,439) 6,039,881 6,680,760
Debt instruments at amortised
cost
Financial liabilities at amortised
cost
Leases
Equity and non financial
assets and liabilities
Total
Notes R’000 R’000 R’000 R’000 R’000
ASSETS
Non-current assets
Property, plant and equipment 3 - - - 553,232 553,232
Investment property 4 - - - 4,882,988 4,882,988
Intangible assets 5 - - - 345 345
- - - 5,436,565 5,436,565
Current assets Trade and other receivables 11 323,657 - - - 323,657
Prepayments - - - 12 12
Loans and advances 10 9,148 - - - 9,148
Cash and cash equivalents 12 291,142 - - - 291,142
623,947 - - 12 623,959
Total assets 623,947 - - 5,436,577 6,060,524
EQUITY
Equity Attributable to Equity Holders of Parent
Share capital 13 - - - 1,264,558 1,264,558
Retained income 13 - - - 3,622,446 3,622,446
Total Equity - - - 4,887,004 4,887,004 LIABILITIES
Non-current liabilities Deferred income 18 - - - 30,963 30,963
Deferred tax 9 - - - 501,304 501,304
Income received in advance 16 - - - 88,386 88,386
- - - 620,653 620,653
Current liabilities Current tax payable - 808 - 137 945
Trade and other payables 17 - 529,802 (5,033) - 524,769
Provisions 14 - - - 16,340 16,340
Income received in advance 16 - - - 10,813 10,813
- 530,610 (5,033) 27,290 552,867
Total liabilities - 530,610 (5,033) 647,943 1,173,520Total equity and liabilities - 530,610 (5,033) 5,534,947 6,060,524
Categories of financial instruments - 2017 Categories of financial instruments - 2016 Restated *
SECT
ION
04
SECT
ION
03
PER
FOR
MAN
CE IN
FOR
MAT
ION
THIS
IS C
OEG
AAD
MIN
ISTR
ATIO
N
N O T E S T O T H E C O N S O L I D A T E D A N N U A L F I N A N C I A L S T A T E M E N T S

150 151C O E G A D E V E L O P M E N T C O R P O R A T I O N I N T E G R A T E D R E P O R T 2 0 1 6 / 1 7
34. RISk MANAGEMENT
Capital risk management
The Group’s objectives when managing capital are to safeguard the Group’s ability to continue as a going concern in order to provide returns for shareholder and benefits for other stakeholders and to maintain an optimal capital structure to reduce the cost of capital.
The capital structure of the Group consists of equity as disclosed in the statement of financial position. There are no externally imposed capital requirements.
There have been no changes to what the entity manages as capital, the strategy for capital maintenance or externally imposed capital requirements from the previous year.
Financial risk management
The Group’s activities expose it to a variety of financial risks: market risk (including currency risk, fair value interest rate risk, cash flow interest rate risk), credit risk and liquidity risk.
The Group’s overall risk management program focuses on the unpredictability of financial markets and seeks to minimise potential adverse effects on the Group’s financial performance. Risk management is carried out by a central treasury department (Group treasury) under policies approved by the board of directors. Group treasury identifies, evaluates and hedges financial risks in close co-operation with the Group’s operating units.
Liquidity risk
Prudent liquidity risk management implies maintaining sufficient cash and marketable securities, the availability of funding through an adequate amount of committed credit facilities and the ability to close out market positions. The Group’s risk to liquidity is a result of the funds available to cover future commitments. The Group manages liquidity risk through continuous monitoring of forecast and actual cash flows. Cash flow forecasts are prepared and adequate utilised borrowing facilities are monitored.
The table below analyses the Group’s financial assets and liabilities into relevant maturity groupings based on the remaining period at the statement of financial position to the contractual maturity date. The amounts disclosed in the table are the contractual undiscounted cash flows. Balances due within 12 months equal their carrying balances as the impact of discounting is not significant.
Less than 1 year
Between 1and 2 years
Between 2and 5 years
Over 5 years
Financial assets
Trade receivables 240,184 - - -
Loans and advances 17,944 - - -
Other financial assets 18 - - -
258,146 - - -
Trade liabilities
Trade payables 640,877 - - -
Current tax payable 831 - - -
641,708 - - -
Net position (383,562) - - -
At 31 March 2017
SECT
ION
04
SECT
ION
03
PER
FOR
MAN
CE IN
FOR
MAT
ION
THIS
IS C
OEG
AAD
MIN
ISTR
ATIO
N
N O T E S T O T H E C O N S O L I D A T E D A N N U A L F I N A N C I A L S T A T E M E N T S
Debt instruments at amortised
cost
Financial liabilities at amortised
cost
Leases
Equity and non financial
assets and liabilities
Total
Notes R’000 R’000 R’000 R’000 R’000
ASSETS
Non-current assets
Property, plant and equipment 3 - - - 495,266 495,266
Investment property 4 - - - 4,464,730 4,464,730
Intangible assets 5 - - - 1,674 1,674
- - - 4,961,670 4,961,670
Current assets Trade and other receivables 11 292,021 - - - 292,021
Loans and advances 10 - - - 1,146 1,146
Cash and cash equivalents 12 482,354 - - - 482,354
774,375 - - 1,146 775,521
Total assets 774,375 - - 4,962,816 5,737,191
EQUITY
Equity Attributable to Equity Holders of Parent
Share capital 13 - - - 1,264,558 1,264,558
Retained income 13 - - - 3,233,395 3,233,395
Total Equity - - - 4,497,953 4,497,953 LIABILITIES
Non-current liabilities Deferred income 18 - - - 156,460 156,460
Deferred tax 9 - - - 488,636 488,636
Income received in advance 16 - - - 102,669 102,669
- - - 747,765 747,765
Current liabilities Trade and other payables 17 - 438,225 - - 438,225
Provisions 14 - - - 42,435 42,435
Income received in advance 16 - - - 10,813 10,813
- 438,225 - 53,248 491,473
Total liabilities - 438,225 - 801,013 1,239,238Total equity and liabilities - 438,225 - 5,298,966 5,737,191
Categories of financial instruments - 2015 Restated *

152 153C O E G A D E V E L O P M E N T C O R P O R A T I O N I N T E G R A T E D R E P O R T 2 0 1 6 / 1 7
Interest rate risk
The Group’s interest bearing assets are included under cash and cash equivalents. The Group’s income and operating cash flows are substantially independent of changes in market interest rates due to the short term nature of interest bearing assets.
Balances with banks, deposits and all call and current accounts attract interest at rates that vary with the South African prime rate. The Group’s policy is to manage interest rate risk so that fluctuations in variable rates do not have a material impact on the surplus/deficit.
Interest rate sensitivity analysis
The sensitivity analysis below has been determined based on the Group’s financial instruments exposure to interest rates at reporting date.
The basis points increases or decreases, as detailed in the table below, were determined by management and represent management’s assessment of the potential change in interest rates.
A positive number below indicates an increase in profit or loss before taxation. A negative number below indicates a decrease in surplus.The sensitivity analysis shows reasonable expected changes in the interest rate, either an increase or decrease in theinterest percentage. The equal but opposite percentage adjustment to the interest rate would result in an equal but opposite effect on profit or loss before taxation and therefore has not been separately disclosed below. The disclosure only indicates the effect of thechange in interest rate on profit or loss before taxation.
2017
R’000
2016Restated *
R’000
Basis point increase 100 100
Estimated change in profit or loss before taxation 1,190 290
Less than 1 year
Between 1and 2 years
Between 2and 5 years
Over 5 years
Financial assets
Trade receivables 323,657 - - -
Loans and advances 9,148 - - -
332,805 - - -
Trade liabilities
Trade payables 524,769 - - -
Current tax payable 945 - - -
525,714 - - -
Net position (192,909) - - -
At 31 March 2016 Restated *Credit risk
Credit risk refers to the risk that a counterparty will default on its contractual obligations resulting in financial loss to the Group.
Credit risk consists mainly of cash deposits, cash equivalents and trade debtors.The carrying amounts of financial assets, represent the entity’s maximum exposure to credit risk in relation to these assets. The Group only deposits cash with major banks with high quality credit standing and limits exposure to any one counter-party.
Trade receivables comprise mainly of amounts owing from tenants. Management evaluated credit risk relating to tenants before they were incorporated into the zone. Management also evaluates credit risk relating to customers on an ongoing basis. If customers are independently rated, these ratings are used. Otherwise, if there is no independent rating, the Group assesses the credit quality of the customer, taking into account its financial position, past experience and other factors.
Tenants pay a deposit at the beginning of their lease terms.
Refer to note 33 for the Group’s exposure to credit risk by class of financial asset.
Fair value hierarchy
The table below analyses assets and liabilities carried at fair value. The different levels are defined as follows:
Level 1: Quoted unadjusted prices in active markets for identical assets or liabilities that the Group can access at measurement date.
Level 2: Inputs other than quoted prices included in level 1 that are observable for the asset or liability either directly or indirectly.
Level 3: Unobservable inputs for the asset or liability.
Levels of fair value measurements
Level 2
Recurring fair value measurements
Valuation processes applied by the Company
The fair value of investment properties is determined by external, independent property valuers, having appropriate recognised professional qualifications and recent experience in the location and category of property being values. The valuation provides the fair value of the Group’s investment portfolio every three years.
35. FAIR VALUE INFORMATION
2017 2016Restated *
2015Restated *
Notes R’000 R’000 R’000
ASSETS
Investment property 4Investment property 5,112,622 4,882,988 4,464,730
Total 5,112,622 4,882,988 4,464,730
SECT
ION
04
SECT
ION
03
PER
FOR
MAN
CE IN
FOR
MAT
ION
THIS
IS C
OEG
AAD
MIN
ISTR
ATIO
N
N O T E S T O T H E C O N S O L I D A T E D A N N U A L F I N A N C I A L S T A T E M E N T S

154 155C O E G A D E V E L O P M E N T C O R P O R A T I O N I N T E G R A T E D R E P O R T 2 0 1 6 / 1 7
36. GOING CONCERN
39. PRIOR PERIOD ADJUSTMENTS
37. EVENTS AFTER THE REPORTING PERIOD
38. FRUITLESS AND wASTEFUL EXPENDITURE
The consolidated annual financial statements have been prepared on the basis of accounting policies applicable to a going concern. This basis presumes that funds will be available to finance future operations and that the realisation of assets and settlement of liabilities, contingent obligations and commitments will occur in the ordinary course of business.
The ability of the Group to continue as a going concern is dependent on a number of factors. The most significant of these is that the directors continue to procure funding for the ongoing operations for the Group.
36.1 Changes to legislation
The introduction of the SEZ Legislation in May 2014 brought changes in the way that funding to the IDZs, and therefore the Group, is allocated - from that of MTEF allocations to specific project-based approvals, which will be given from time to time. Further, the Act states that the funding of the operations of the IDZs / SEZs will be the responsibility of the Provincial Government and no longer that of the dti. At the moment, the amount of further contribution to the Group’s operations to be made by Provincial Government in terms of this requirement for the 2017/18 financial year and subsequent thereto is yet to be determined.
Furthermore, the Group is currently considering the impact of the new SEZ Act on certain operating divisions and business units currently within the Group. Notwithstanding absence of any legal requirement or prescription for exclusion of non-SEZ activities in the SEZ, exercising of such a preference may result in these operating divisions and business units being deemed to be outside the objectives and mandate of the SEZ. In this scenario, the Group might have to divest itself of these operating divisions and business units which would have a materially negative impact on Group revenue, profitability and operating cash flows.
36.2 Financial sustainability
As a result of the changes in the funding arrangements, some of the Group’s key financial ratios have deteriorated in comparison to the previous year’s. These include the Group’s cash flows from operations, as well as creditors’ payment days and available cash balances. During 2016/17 the Group operated without receiving the full amount of requisite funding for operational expenditure but was able to sustain operations from external revenues generated by the Group. Management maintains detailed financial plans and forecasting processes and manages working capital elements as necessary to ensure that key operations of the business are fully delivered. The provision of the necessary additional funding required for the Group has been discussed with the shareholders and is receiving attention at the highest level.
The financial statements have been prepared in accordance with International Financial Reporting Standards on a basis consistent with the prior year. Where adjustments were done in the current annual financial statements, management considered the impact on the opening balances of the earliest comparative figures and these were adjusted accordingly. The aggregate effect of the prior period adjustments on the financial statements for the year ended 31 March 2017 is as follows:
All of the ordinary shares were transferred from the Eastern Cape Development Corporation to the Eastern Cape Department of Economic Development, Environmental Affairs and Tourism with effect from 20 April 2017.
On 30 May 2017 the Board of Directors resolved to approve the donation of all of the class A shares from the Department of Trade and Industry to the Eastern Cape Department of Economic Development, Environmental Affairs and Tourism and the share certificate was duly signed.
All of the above expenditure was incurred as a result of the funding pressures the Company experienced during the financial years in question and the write-off has been condoned by the Company’s board of directors.
Notwithstanding the requirement in terms of section 25 of the SEZ Act that the Company be fully funded by the relevant authority for annual operational expenditure shortfalls, the Company experienced operational funding shortfalls in both the current as well as prior financial years.
SARS penalties and interest relates mainly to interest on a 2012 income tax assessment raised by SARS which is currently the subject of a dispute in the Tax Court and secondly to late payment of certain monthly employees’ tax payments due to cash flow constraints prevailing at the time.
Interest on overdue trade payables arose mainly as a result of delays in receiving grant funding from the Department of Trade and Industry for approved SEZ capital expenditure.
Management identified that a significant number of invoices accrued for in the GRN suspense account were invalid accruals and needed to be reversed. This affected multiple prior financial years. Furthmore a number of corrections and/or write offs to Programme creditor accounts were required as were corrections to the mapping of GL accounts from prior years.
The above table sets out the deferred tax effect of the prior year adjustments set out in this note.
2017
R’000
2016Restated *
R’000
Opening balance 22,157 -SARS penalties and interest 5,516 9,926Interest on overdue trade and other payables 13,171 12,231
40,844 22,157
2016Restated *
R’000
2015Restated *
R’000
Trade and other payables Balance before restatement 490,344 430,332Adjustment 26,532 7,893Effect of prior year adjustment 7,893 -
524,769 438,225
2016Restated *
R’000
2015Restated *
R’000
Deferred tax Balance before restatement 515,685 504,355Adjustment 1,338 (15,719)Effect of prior year adjustments (15,719) -
501,304 488,636
SECT
ION
04
SECT
ION
03
PER
FOR
MAN
CE IN
FOR
MAT
ION
THIS
IS C
OEG
AAD
MIN
ISTR
ATIO
N
N O T E S T O T H E C O N S O L I D A T E D A N N U A L F I N A N C I A L S T A T E M E N T S

156 157C O E G A D E V E L O P M E N T C O R P O R A T I O N I N T E G R A T E D R E P O R T 2 0 1 6 / 1 7
Management identified assets which had previously incorrectly been classified as intangible Assets as well as errors in the calculation of depreciation.
Management identified various required corrections relating to the inter-divisional control account for Coega Village, VAT processing errors and journals to the debtors control account which caused the subsidiary debtors ledger to be out of balance with the GL.
Management identified certain errors in the classification of PPE as well as in the calculation of depreciation. In addition, a verification of Computer Hardware resulted in significant adjustments to the asset registers.
Management identified that certain prepayments should have been released to profit and loss in the prior financial year.
Management identified that releases of deferred income to profit and loss in prior years were based on payment of related expenditure instead of incurrance of expenditure.
Management identified certain capital additions not accrued for that related to prior years.
2016Restated *
R’000
2015Restated *
R’000
Trade and other receivables Balance before restatement 342,084 307,574Adjustment (2,871) (15,556)Effect of prior year adjustment (15,556) -
323,657 292,018
2016Restated *
R’000
2015Restated *
R’000
PPE Balance before restatement 560,491 503,489Adjustment 964 (8,223)Effect of prior year adjustment (8,223) -
553,232 495,266
2016Restated *
R’000
2015Restated *
R’000
Intangible assets Balance before restatement 1,756 3,122Adjustment 37 (1,448)Effect of prior year adjustment (1,448) -
345 1,674
2016Restated *
R’000
2015Restated *
R’000
Prepayments Balance before restatement 175 -Adjustment (163) -
12 -
2016Restated *
R’000
2015Restated *
R’000
Deferred Income Balance before restatement 215,747 218,011Adjustment (123,233) (61,551)Effect of prior year adjustment (61,551) -
30,963 156,460
2016Restated *
R’000
2015Restated *
R’000
Investment Property Balance before restatement 4,877,340 4,464,375Adjustment 5,293 355Effect of prior year adjustment 355 -
4,882,988 4,464,730
SECT
ION
04
SECT
ION
03
PER
FOR
MAN
CE IN
FOR
MAT
ION
THIS
IS C
OEG
AAD
MIN
ISTR
ATIO
N
N O T E S T O T H E C O N S O L I D A T E D A N N U A L F I N A N C I A L S T A T E M E N T S
The above table sets out the effect on retained income of the prior year adjustments set out in this note.
Management identified certain accounts relating to bank and cash which had been previously rolled up into trade and other receivables and/or trade and other payables. These accounts have been re-classified. Management also identified manual journals which had been incorrectly passed to Bank and Cash in prior years.
2016Restated *
R’000
2015Restated *
R’000
Retained income Balance before restatement 3,474,765 3,212,266Adjustment in 2016 financial year 126,552 21,129Effect of prior year adjustment 21,129 -
3,622,446 3,233,395
2016Restated *
R’000
2015Restated *
R’000
Bank and cash Balance before restatement 286,589 505,732Adjustment 27,931 (23,378)Effect of prior year adjustment (23,378) -
291,142 482,354

158 159C O E G A D E V E L O P M E N T C O R P O R A T I O N I N T E G R A T E D R E P O R T 2 0 1 6 / 1 7
DETAILED INCOME STATEMENT
31-Mar 31-Mar
2017 2016Restated *
Notes R’000 R’000
REVENUERendering of services 98 200Royalty income 57 -Other rental income 236,896 239,138Interest received (trading) 4,878 3,494Management fees 307,131 286,520Discount allowed (8) -
19 549,052 529,352Other operating incomeSundry income 15,932 10,496Government grants 218,619 455,344
20 234,551 465,840Other operating gains (losses)Losses on disposal of assets or settlement of liabilities - (11,130)Fair value gains - 100,070
21 - 88,940 EXPENDITURE (refer to next page) (593,776) (671,368) Operating profit (loss) 22 189,827 412,764Investment income 25 3,006 1,323Finance costs 26 (21,579) (12,231)Profit (loss) before taxation 171,254 401,856Taxation 27 (37) (12,805)Profit for the year 171,217 389,051
Notes
2017 R’000
2016Restated *
R’000
Other operating expensesAdvertising 782 (2,553)Amortisation (339) (1,422)Auditors remuneration - external auditors 22 (118) -Bad debts (8,492) (65,569)Bank charges (696) (423)Cleaning (3,115) (4,661)Computer expenses (5,169) (6,861)Consulting and professional fees - accounting (3,235) (4,568)Consulting and professional fees (4,539) (5,847)Consulting and professional fees - legal fees (3,529) (5,744)Consumables (3,063) (2,468)Delivery expenses (199) (271)Depreciation (20,107) (20,450)Employee costs (310,346) (276,557)Entertainment (40) (756)Other 1,735 (9,539)Minor assets (238) (107)Temporary workers (3,161) -Direct contract costs 9,003 (23,574)Health & Safety (777) (5,844)Project costs (15,710) (16,362)Training Programmes (4,654) (5,324)Office expenses (38) 17Credit Checks (8) (8)Fines and penalties (5,518) (9,926)Flowers 8 -Gifts 149 (368)Insurance (4,240) (5,326)IT expenses (11,678) (6,811)Lease rentals on operating lease (5,760) (5,140)Motor vehicle expenses (4,985) (5,143)Municipal expenses (67,502) (37,693)Placement fees (801) (1,345)Printing and stationery (764) (2,402)Promotions (240) (1,428)Repairs and maintenance (17,555) (16,212)Research and development costs (713) (1,191)Security (4,777) (1,879)Staff welfare (3,042) (2,414)Subscriptions (565) (78)Technical service fees (5) -Telephone and fax (25,240) (15,318)Training (856) (6,152)Travel - local (63,134) (92,929)Travel - overseas (505) (722)
(593,776) (671,368)
The supplementary information presented does not form part of the consolidated annual financial statements and is unaudited. The supplementary information presented does not form part of the consolidated annual financial statements and is unaudited.
SECT
ION
04
SECT
ION
03
PER
FOR
MAN
CE IN
FOR
MAT
ION
THIS
IS C
OEG
AAD
MIN
ISTR
ATIO
N
C O E G A D E V E L O P M E N T C O R P O R A T I O N I N T E G R A T E D R E P O R T 2 0 1 6 / 1 7

160 161C O E G A D E V E L O P M E N T C O R P O R A T I O N I N T E G R A T E D R E P O R T 2 0 1 6 / 1 7
ADMINISTRATION 04
6wON SIX HIGH-PROFILE AwARDS SE
CTIO
N 0
4SE
CTIO
N 0
3PE
RFO
RM
ANCE
INFO
RM
ATIO
NTH
IS IS
CO
EGA
ADM
INIS
TRAT
ION
Acronyms & Abbreviations 162
CDC SMME PROCUREMENT EXCEDED ITS SMME SHARE TARGET
OF 36% FOR OVERALL PROCUREMENT
38%

162 163C O E G A D E V E L O P M E N T C O R P O R A T I O N I N T E G R A T E D R E P O R T 2 0 1 6 / 1 7
ISO International Organisation for StandardisationITC International Institute for Aerospace Survey and Earth SciencesKPI’s Key Performance IndicatorsKZN KwaZulu-NatalLEP Local Empowerment ParticipationLLB Bachelor of LawLRU Legal and Risk UnitMBSA Mercedes Benz South AfricaMBA Master of Business AdministrationMBL Master of Business LeadershipMBSA Manufacturing Board of South AfricaMDP Management Development ProgrammeMEGA Mpumalanga Economic Growth AgencyMSc. Master of ScienceMDB Manufacturing Development BoardMNE Multinational Enterprises and Social PolicyMVA Manufacturing Value AddMW Mega WattsNAPDI Northern Areas People Development InitiativeNDBE National Department of Basic EducationN-DoH National Department of HealthN-DoT National Department of TransportNDPW National Department of Public WorksNIASA Nuclear Industry Association of South AfricaNMB Nelson Mandela BayNMBLP Nelson Mandela Bay Logistics ParkNMBM Nelson Mandela Bay MunicipalityNMMU Nelson Mandela Metropolitan UniversityNQF National Qualifications FrameworkNSF National Skills FundOEM Original Equipment ManufacturerOps Operations - a BU of the CDCOSISC One Stop Investor Service CentreOSMP Open Space Management PlanOTP Office of the PremierPCC Port Consultative CommitteesPCS Payment Communication SystemPDOT Provincial Department of TransportPFMA Public Finance Management ActPGDS Provincial Growth and Development StrategyPFMA Public Finance Management ActPhD. Doctor of PhilosophyPIMS Project Information Management SystemPPM Preventative Planned MaintenancePr. Eng. Professional EngineerPRS Project Registration SystemRE Return EffluentREDP Roads Enterprise Development ProgrammeREIPPPP Renewable Energy Independent Power Producer Procurement ProgrammeRIC Recruitment and Information CentreROI Return on InvestmentRU Rhodes UniversitySA South AfricaSAAE South African Academy of EngineersSAICA South African Institute of Chartered AccountantsSAMSA South African Maritime Safety AuthoritySANDF South African National Defence ForceSANParks South African National ParksSANRAL South African National Roads Agency LimitedSANS South African National StandardSARS South African Revenue ServiceSCM Supply Chain ManagementSDI Spatial Development InitiativeSDP Site Development PlansSDU Spatial Development UnitSEDA Small Enterprise Development AgencySET Science, Engineering and TechnologySETA Sector Education and Training AuthoritySEZ Special Economic ZoneSLA Service Level AgreementSHEQ Safety, Health and Environmental QualitySHEQMS Safety, Health and Environmental Quality Management SystemsSMME Small, Micro and Medium EnterprisesSoE State-Owned EnterpriseSSU Strategic Services UnitTASA Tooling Association of South AfricaTEE Tyre Energy Extraction (SA)TFR Transnet Freight RailTNPA Transnet National Ports AuthorityTPT Transnet Port TerminalsUCT University of Cape TownUFH University of Fort HareUK United KingdomUNECA United Nations Economic Commission for AfricaUnisa University of South AfricaVACC Vulindlela Accommodation and Conference CentreVWSA Volkswagen South AfricaWSU Walter Sisulu UniversityWEO Women Empowered OrganisationZAR South African Rands
ABASA Association for the Advancement of Black Accountants of South AfricaARC Audit and Risk CommitteeAMP Advanced Management ProgrammeAsgiSA Accelerated and Shared Growth-South AfricaASIDI Accelerated Schools Infrastructure Delivery InitiativeBA Bachelor of ArtsBAIC Beijing Automobile International CorporationB-BBEE Broad-Based Black Economic EmpowermentBCom Bachelor of CommerceBD Business Development - a BU of the CDCBPO Business Process OutsourcingBSc. Bachelor of ScienceBU Business UnitCA (SA) Chartered Accountant of South AfricaCCA Customs Controlled AreaCCT Coega Corporate TravelCDA Core Development AreaCDC Coega Development Corporation (Pty) LtdCDC-S Coega Development Corporation ServicesCEO Chief Executive OfficerCETA Construction Education and Training AuthorityCHC Community Health CentreCHDA Chris Hani Development AgencyCHDM Chris Hani District MunicipalityCIDB Construction Industry Development BoardCFO Chief Financial OfficerCoE Centre of ExcellenceCMMS Computerized Maintenance Management SystemCSI Corporate Social InvestmentCSIR Council for Scientific and Industrial ResearchCSS Central Support ServicesDBE Department of Basic EducationDEDEAT Department of Economic Development, Environmental Affairs & TourismDES Desired End StateDFP Development Framework PlanDRDLR Department of Rural Development and Land ReformDoE Department of EducationDoH Department of HealthDoHS Department of Human SettlementsDSRAC Department of Sport, Recreation, Arts and CultureDRPW Department of Roads and Public Worksthe dti Department of Trade and IndustryDWA Department of Water AffairsEA Environmental AuthorisationEC Eastern CapeECDC Eastern Cape Development CorporationEC-DoH Eastern Cape Department of HealthEC-DRPW Eastern Cape Department of Roads and Public WorksECSBP Eastern Cape School Building ProgrammeEDMS Electronic Document Management SystemEDRS Economic Development and Recreational ServicesEIA Environmental Impact AssessmentEIMS Electronic Invoice Management SystemEM Executive ManagerEPWP Expanded Public Works ProgrammeEXMA Executive Management CommitteeFAW First Automotive WorksFDI Foreign Direct InvestmentFET Further Education and TrainingFPL Forensic Pathology LaboratoriesFY Financial YearG2O Gateway to OpportunitiesGBCSA Green Building Council South AfricaGDP Gross Domestic ProductGIS Geographic Information SystemHCS Human Capital SolutionsHDI Historically Disadvantaged IndividualHRD Human Resource DevelopmentHR+R Human Resources and RemunerationIA Implementing AgentICT Information and Communication TechnologiesICASA Institute of Chartered Accountants South AfricaID Infrastructure DevelopmentIDC Industrial Development CorporationIDZ Industrial Development ZoneIIRC International Integrated Reporting CouncilILO International Labour OrganisationIMS Integrated Management SystemIPAP Industrial Policy Action Plan<IR> Integrated ReportingIRC Integrated Reporting Committee (South Africa)IRS ICT, Research and Strategy
ABBREVIATIONS & ACRONYMS
SECT
ION
04
SECT
ION
03
PER
FOR
MAN
CE IN
FOR
MAT
ION
THIS
IS C
OEG
AAD
MIN
ISTR
ATIO
N
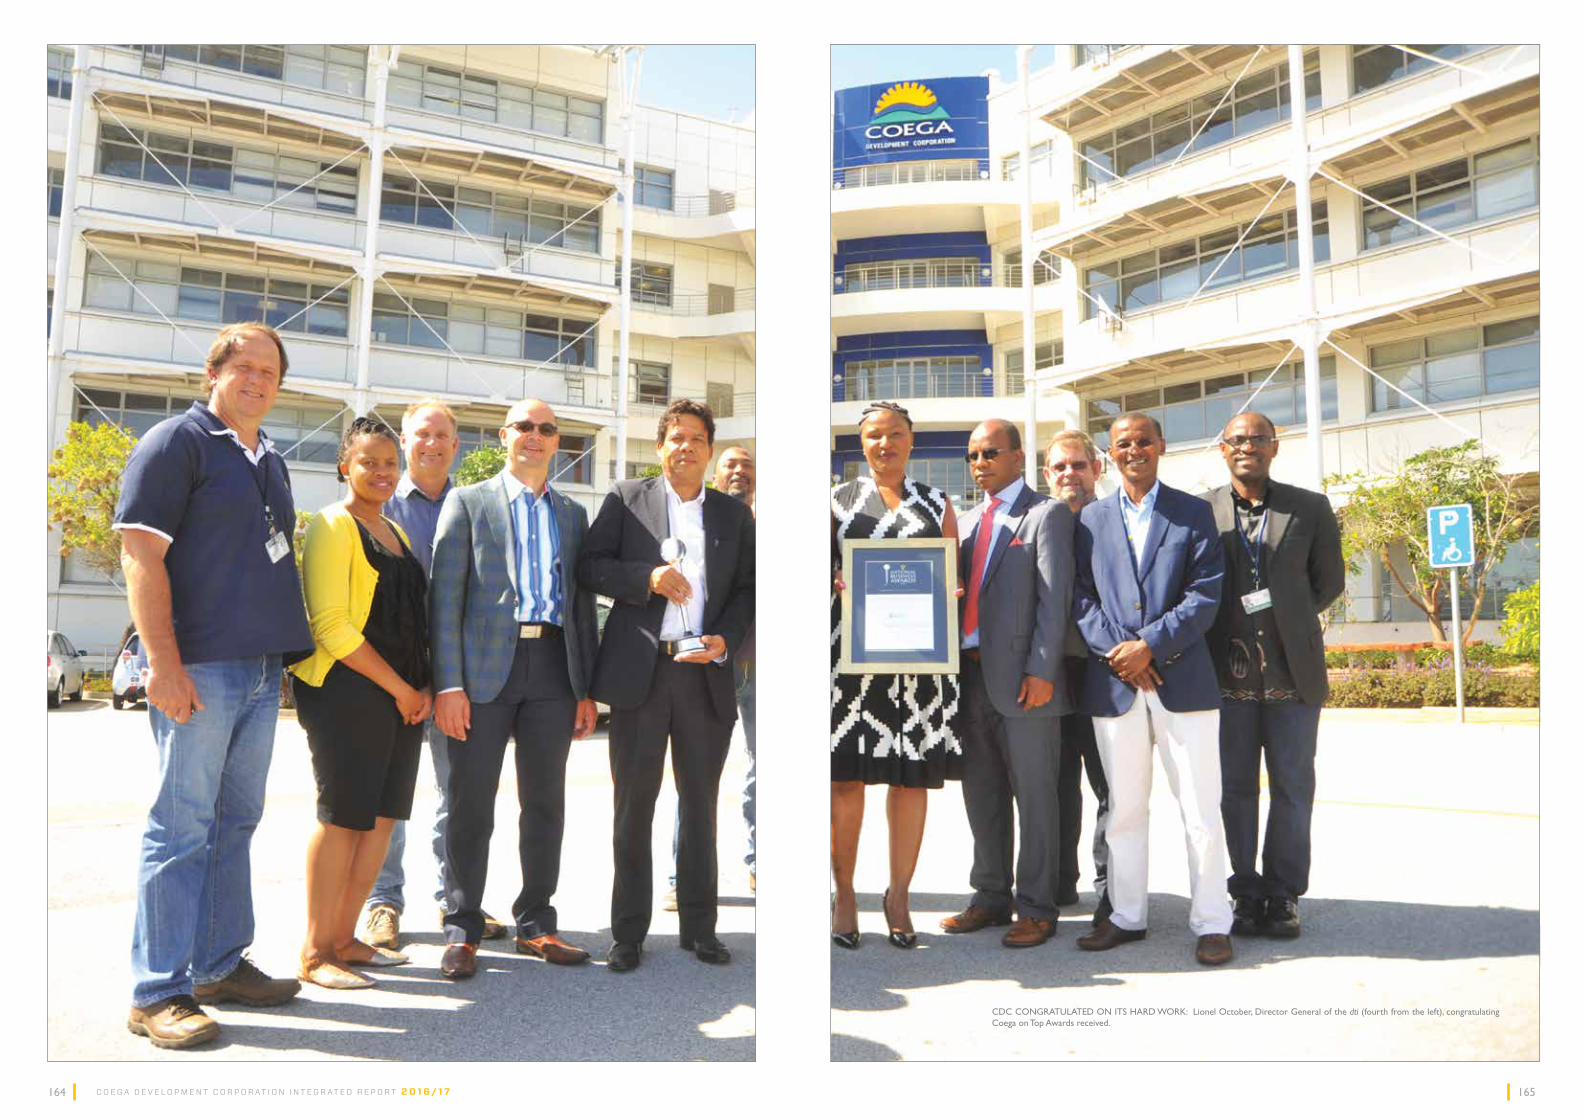
164 165C O E G A D E V E L O P M E N T C O R P O R A T I O N I N T E G R A T E D R E P O R T 2 0 1 6 / 1 7
CDC CONGRATULATED ON ITS HARD WORK: Lionel October, Director General of the dti (fourth from the left), congratulating Coega on Top Awards received.

E-mail: [email protected] | website: www.coega.co.za
B-BBEE LEVEL 3 CONTRIBUTOR ISO 9001 14001 20001 27001 31000 OHSAS 18001
Help us change your bad experience into a positive encounter
STOP: THEFT / FRAUD / DISHONESTY / BRIBERY / BLACKMAIL / INTIMIDATION / CORRUPTION
Call Toll-free TODAY: 0800 007 035 and remain anonymous.
DO YOU BELIEVE IN FAIR TREATMENT/ ETHICAL AND TRANSPARENT BUSINESS PRACTICES/ RESOLVING PROBLEMS AMICABLY? For effective and efficient resolution of your complaint, please contact the CDC Complaints Management office on:
Call Centre: +27 (0)86 000 4278 | Mobile: +27 (0)73 443 5195 | Fax: +27 (0)41 403 0401 | Email: [email protected] Address: Complaints Management Office, Coega Development Corporation, Private bag X6009, Port Elizabeth, 6000
Free fax: 0800 200 796 | Email: [email protected] | Website: www.thornhill.co.za/kpmgethicslinereportPostal Address: BNT 371, P.O Box 14671, Sinoville, 0129
The KPMG Ethics Line service allows all stakeholders to report concerns of misconduct.
Complaints Management
Tip-Off Anonymous
Corner Alcyon Road & Zibuko Street, Zone 1, Coega IDZ, Port Elizabeth, 6100Coega Development Corporation. P/B X6009, Port Elizabeth, 6000, South AfricaTel: +27 (0)41 403 0400 - Fax: +27 (0)41 403 0401E-mail: [email protected]: www.coega.co.za
Copyright
All rights reserved. No part of this document may be reproduced or distributed in any form or by any means, electronic, mechanical, photocopying, recording or otherwise, nor stored in a database or retrieval system, without the prior written permission of the Coega Development Corporation (Pty) Ltd. ©
Printed on Recycled Paper
B-BBEE LEVEL 3 CONTRIBUTOR ISO 9001 14001 20001 27001 31000 OHSAS 18001