sesame site effects assessment using ambient excitations
TRANSCRIPT

Project n° EVG1-CT-2000-00026 SESAME
European Commission – Research General Directorate
SESAME
Site EffectS assessment using AMbient Excitations
Second progress report
1 May 2001 – 30 April 2002
SESAME Partnership
1 UJF University Joseph Fourier Grenoble 2 Resonance Résonance Ingénieurs-Conseils SA Geneva 3 UP University of Potsdam - Potsdam 4 ULg University of Liège Liège 5 UiB University of Bergen Bergen 6 ETHZ Polytechnic School of Zürich Zürich 7 ITSAK Institute of Engineering Seismology and Earthquake Engineering Thessaloniki 8 ICTE/UL Institute of Earth and Space Sciences Lisbon 9 INGV National Institute of Geophysics and Volcanology Roma
10 CNR.GSAQ National Research Counsil Milano 11 GPISAS Geophysical Institute – Slovak Academy of Sciences Bratislava 12 CETE.Nice Center of Technical Studies Nice 13 CNRS National Center for Scientific Research Grenoble 14 LCPC Central Laboratory for Bridges and Roads Paris
Co-ordinator: Pierre-Yves BARD - LGIT, Observatoire de Grenoble, BP 53 - 38041 Grenoble Cedex – France
Signature of the co-ordinator:

SESAME, Progress report : may 01 – april 02
Project n°EVG1-CT-2000-00026 - SESAME Page 2
Content
Introduction ................................................................................... p. 3 Progress of the work ..................................................................... p. 4
WP01 – T01.01: co-ordination – year 1 p. 5 WP02 – T01.02: H/V technique – experimental conditions – year 1 p. 8 WP03 – T01.03: H/V technique – data processing – year 1 p. 9 WP04 – T01.04: H/V technique – empirical evaluation – year 1 p. 16 WP05 – T01.05: instrument layout for array measurements – year 1 p. 21 WP06 – T01.06: array measurements – derivation of dispersion curves – year 1 p. 22 WP07 – T01.07: array measurements – inversion of velocity profile – year 1 p. 25 WP08 – T01.08: nature of noise wavefield – year 1 p. 27 WP09 – T01.09: numerical simulation of noise – year 1 p. 29 References p. 31
Sesame synopsis ......................................................................... p. 33
Co-ordination p. 33 Scientific and technical achievements p. 35 Dissemination of results p. 36
SESAME important dates ........................................................... p. 37 Annexes ...................................................................................... p. 38
Minutes of the meetings or workshops p. 38 Presentations to International conferences p. 38 Papers p. 41 Deliverables p. 41 Others p. 41
Co-ordinator: Pierre-Yves BARD LGIT, Observatoire de Grenoble tel: +33 (0)4 76 82 80 61 BP 53 fax: +33 (0)4 76 82 81 01 F-38041 Grenoble Cedex e-mail: [email protected]
SESAME, Progress report : may 01 – april 02
Project n°EVG1-CT-2000-00026 - SESAME Page 3
Introduction
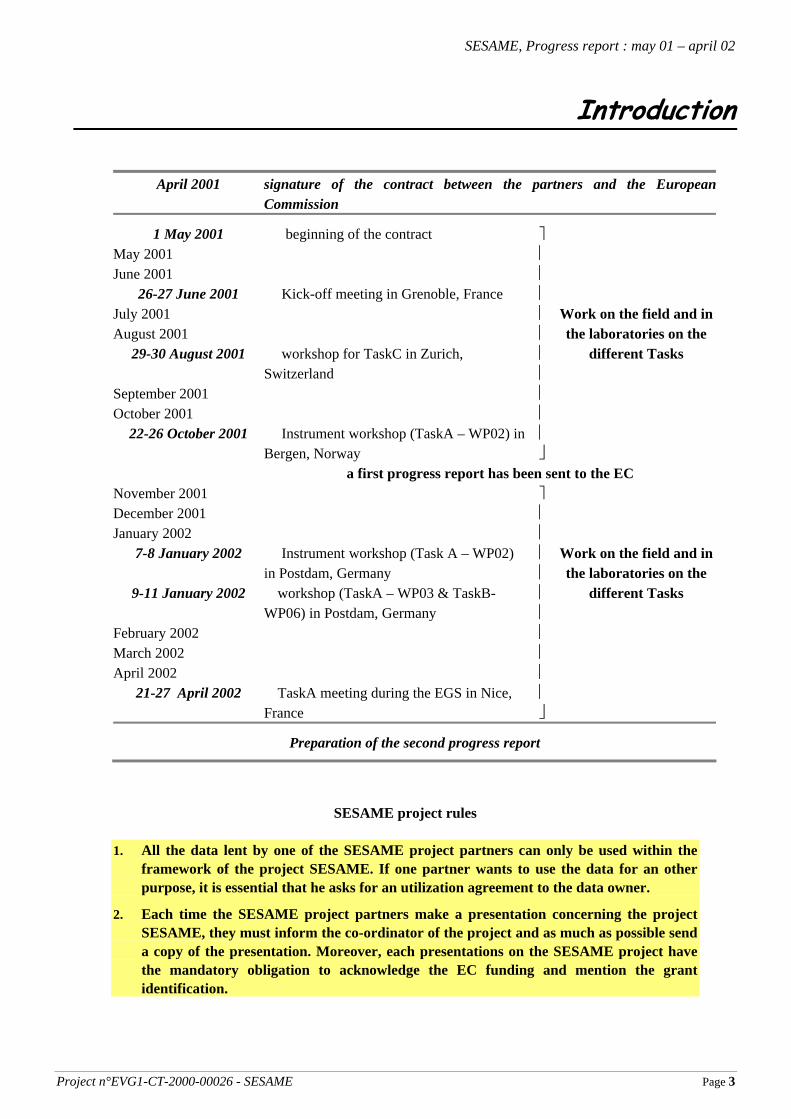
April 2001 signature of the contract between the partners and the EuropeanCommission
1 May 2001 ë beginning of the contract ⎤ May 2001 ⎥ June 2001 ⎥
26-27 June 2001 ë Kick-off meeting in Grenoble, France ⎥ July 2001 ⎥ Work on the field and inAugust 2001 ⎥ the laboratories on the
29-30 August 2001 ë workshop for TaskC in Zurich, Switzerland
⎥ ⎥
different Tasks
September 2001 ⎥ October 2001 ⎥
22-26 October 2001 ë Instrument workshop (TaskA – WP02) in Bergen, Norway
⎥ ⎦
a first progress report has been sent to the EC November 2001 ⎤ December 2001 ⎥ January 2002 ⎥
7-8 January 2002 ë Instrument workshop (Task A – WP02) in Postdam, Germany
⎥ ⎥
Work on the field and inthe laboratories on the
9-11 January 2002 ë workshop (TaskA – WP03 & TaskB-WP06) in Postdam, Germany
⎥ ⎥
different Tasks
February 2002 ⎥ March 2002 ⎥ April 2002 ⎥
21-27 April 2002 ë TaskA meeting during the EGS in Nice, France
⎥ ⎦
Preparation of the second progress report
SESAME project rules
1. All the data lent by one of the SESAME project partners can only be used within the framework of the project SESAME. If one partner wants to use the data for an other purpose, it is essential that he asks for an utilization agreement to the data owner.
2. Each time the SESAME project partners make a presentation concerning the project SESAME, they must inform the co-ordinator of the project and as much as possible send a copy of the presentation. Moreover, each presentations on the SESAME project have the mandatory obligation to acknowledge the EC funding and mention the grant identification.

SESAME, Progress report : may 01 – april 02
Project n°EVG1-CT-2000-00026 - SESAME Page 4
Progress of the Work The following table shows the time table of the SESAME project. We have highlighted in yellow the work which was planned to be in progress – and effectively is - at the date of April, 30, 2002
TABLE : Project planning and time table
Phases
WP
Tasks
Year 1
Year 2
Year 3
Deliverables of Year 1
P01 xxxxxxxxxxxx xxxxxxxxxxxx xxxxxxxxxxxx WP01 xxxxxxxxxxxx xxxxxxxxxxxx xxxxxxxxxxxx T01.01 xxxxxxxxxxxx D03.01 T02.01 xxxxxxxxxxxx T03.01 xxxxxxxxxxxx P02 xxxxxxxxxxxx xxxxxxxxxxxx xxxxxx WP02 xxxxxxxxxxxx xxxxxx T01.02 xxxxxxxxxxxx D01.02 T02.02 xxxxxx WP03 xxxxxxxxx xxxxxxxxx T01.03 xxxxxxxxx T02.03 xxxxxxxxx WP04 xxxxxx xxxxxxxxxxxx xxxxxx T01.04 xxxxxx T02.04 xxxxxxxxxxxx T03.04 xxxxxx P03 xxxxxxxxxxxx xxxxxxxxxxxx xxxxxxxx WP05 xxxxxxxxxxxx xxxxxx T01.05 xxxxxxxxxxxx T02.05 xxxxxx WP06 xxxxxxxxxxxx xxxxxxxxxxxx xxx T01.06 xxxxxxxxxxxx T02.06 xxxxxxxxxxxx T03.06 xxx WP07 xxxxxxxxxxxx xxxxxxxxxxxx xxxxxxxx T01.07 xxxxxxxxxxxx T02.07 xxxxxxxxxxxx T03.07 xxxxxxxx P04 xxxxxxxxxxxx xxxxxxxxxxxx xxx WP08 xxxxxxxxxxxx xxxxxxxxxxxx T01.08 xxxxxxxxxxxx T02.08 xxxxxxxxxxxx WP09 xxxxxxxxxxxx xxxxxxxxxxxx T01.09 xxxxxxxxxxxx D02.09 T02.09 xxxxxxxxxxxx WP10 xxxxxxxxx xxx T01.10 xxxxxxxxx T02.10 xxx P05 xxxxxxxxxxxx WP11 xxxxxxxxxxxx T01.11 xxxxxxxxxxxx WP12 xxxxxxxxxxxx T01.12 xxxxxxxxxxxx WP13 xxxxxxxxxxxx T01.13 xxxxxxxxxxxx

SESAME, Progress report : may 01 – april 02
Project n°EVG1-CT-2000-00026 - SESAME Page 5
I WP01 – T01.01: co-ordination – year 1
The co-ordination is followed by two persons: Pierre-Yves Bard for the scientific part and Laurence Bourjot for the administrative and financial part.
During the first year, 61 persons have been involved in the project SESAME for a minimum of 108,06 man-months: 38 researchers or engineers, 10 students, 12 technicians and 1 assistant-coordinator (Table 1) All these persons have meet several times to exchange their work and also to do experiments together. ë 26-27 June 2001 - Kick-off meeting in Grenoble (France):
• to recall the general administrative and scientific frameworks of this project, • to recall the main objectives of each task and work packages, • to agree on immediate actions (next months to first year), • to establish a tentative schedule for the whole duration of the project (especially for meetings dates and locations).
ë 29-30 August 2001 – Task C meeting in Zürich (Switzerland):
• to review the modelling experience and available numerical tools for modelling seismic noise, • to look at available computing facilities, • to define seismic noise generation, • to define canonical models of local surface geological structures, • to plan future meetings of TASK C, • to review the available methods of the time-frequency analysis.
ë 22-26 October 2001 – Instrument Workshop (TaskA-WP02) in Bergen (Norway):
• to investigate the influence of different instruments in estimating the local site response using H/V technique on microtremor data. There were 4 major tasks performed during the workshop, which consisted of testing the digitizers (Task 1), sensors (Task 2), simultaneous recordings both outside in the free-field (Task 3) and at the lab (Task 4) for comparisons. In addition, an initial test data (Task 0), were also collected to provide individual noise data sets for each system.
ë 7-8 January 2002 - Instrument Workshop (TaskA-WP02) in Postdam (Germany):
• to set the final work that has to be done to write the final report concerning Instrument workshop (Bergen Oct 2001).
ë 9-11 January 2002 – TaskA-WP03 Workshop in Postdam (Germany):
• to present the existing processing software, • to discuss about the basic structure of the SESAME software.
ë 20-21 March 2002 – TaskC-Meeting in Bratislava (Slovakia):
• to revise canonical models and the algorithm for seismic noise generation • to discuss noise simulation for the Colfiorito and Grenoble valleys • to discuss the publishing of the project results
ë 21-27 April 2002 – Task A meeting in Nice (France)
• to discuss about the instrument influence on H/V ratio (WP02). The partners have presented the results they obtained with their own experiment and their own process for the test they performed. Then, for each parameter, preliminary conclusions were drawn. A time table for work was established: to attribute to each team the test that are still needed, to define a common data format, to have an agreement for the principle of a common process and make clear the dead-lines;
• to discuss about the software development (WP03) and in particular on the two modules: (i) Main Processing Module and (ii) Display Module;
• to present and discuss the available data on Existing Ambient Noise & Earthquake Recordings (WP04), and to see which data has to be acquired on Ambient Noise Recordings.

SESAME, Progress report : may 01 – april 02
Project n°EVG1-CT-2000-00026 - SESAME Page 6
The minutes of the different meetings or workshops are available on the web site:
http://SESAME-FP5.obs.ujf-grenoble.fr During this first year, the partners, in parallel to their work on the project, have participated to different national or international meeting where they have presented a part of the scientific work done in the SESAME project. ë AGU in San Francisco (USA), 10-14 December 2001: presentation of a poster by Matthias Ohrnberger
M. Ohrnberger, F. Scherbaum, K.-G. Hinzen, S.-K. Reamer & B. Weber – Vibrations on the roll-Mana, a roll along array experiment to map local site effects across a fault system.
ë Assemblea Hispano-Portuguesa de Geodesia y Geofisica in Valencia (Spain), 4-8 Feb 2002: presentation
of a communication by Paula Teves-Costa
P. Teves-Costa, C. Riedel, J.L. Gaspar, D. Vales, G. Queiroz, M.L. Senos, N. Wallenstei, F. M. Sousa e M. Escuer - Ensaios para a interpretação de anomalias de intensidades sísmicas nos Açores: estudos de ruído ambiental no Concelho da Povoação (ilha de S. Miguel) - Tests for the interpretation of seismic intensities anomalies at the Azores: Microtremor survey on Povoação County (S. Miguel island)
ë EGS meeting in Nice (France), 21-27 April 2002: presentation of a poster by Bertrand. Guillier.
B. Guillier, K. Atakan, A-M. Duval, M. Ohrnberger, R. Azzara, F. Cara, J. Havskov, G. Alguacil, P. Teves-Costa, Nikos Theodulidis and the SESAME Project WP02-Team – Influence of instruments on H/V spectra of ambien noise.
ë EGS meeting in Nice (France), 21-27 April 2002: presentation of a communication by Paula Teves-Costa.
P. Teves-Costa, C. Riedel, D. Vales, N. Wallenstein, A. Borges, M.L. Senos, J.L. Gaspar, G. Queiroz – Microtremor survey on Povoação County (S. Miguel island, Azores): data analysis and interpretation.
The summary of the different communications and posters are presented in the annexes of the report p. 38

SESAME, Progress report : may 01 – april 02
Project n°EVG1-CT-2000-00026 - SESAME Page 7
TABLE 1 : List of the persons working in the project since the beginning
Partners Name of the person Task or WP Time spent
1 Bruno Bettig S WP 06 4 M 1 Fabien Blarel T WP 02 0,7 M 1 Sylvette Bonnefoy S WP 08 8 M 1 Laurence Bourjot ACo WP 01 1,3 M 1 Fabrice Cotton R WP 08 0,8 M
1 (13) Jean-Luc Chatelain R WP 02 1,7 M 1 (13) François Dunand S WP 02 0,25 M 1 (13) Bertrand Guillier R WP 02 5,15 M 1 (14) Pierre-Yves Bard R WP01, Task A,C 4,5 M 1 (14) Philippe Guéguen R WP01, WP02 2 M
2 Martin Koller R WP01, WP03 0,45 M 2 Corinne Lacave R WP01, WP03 0,43 M 2 Julien Rey R WP 03 0,79 M 3 Matthias Ohrnberger R WP 02, TaskB 12 M 3 Frank Scherbaum R Task B AC 3 Daniel Vollmer T WP 02 AC 4 Denis Jongmans R TaskB AC 4 Marc Wathelet S WP07 6 M 5 Kuvvet Atakan R Task A AC 5 Margaret Grandison S WP 02 0,44 M 5 Jens Havskov R Task A AC 5 Bladimir Moreno S WP02, WP03 1,42 M 5 Eirik Tvedt S WP02, WP03 2,67 M 5 Terje Utheim T Task A AC Gerardo Aguacil R Task A AC 6 Cécile Cornou R Task A, C 1 M 6 Donat Faeh R Task A, B, C AC 6 Francesca Bay R Task A, C 1,5 M 6 Fortunat Kind R Task A, B 4 M 6 Ivo Oprsal R Task C AC 6 Jochen Woessner R Task A AC 7 Nikolaos Adam T WP02, WP04 AC 7 Anastasios Anastasiadis R WP02, WP04 1 M 7 Petros Dimitriu R WP02, WP04 2 M 7 Apostolos Marinos T WP02, WP04 AC 7 Bassilios Margaris R WP04 0,5 M 7 Areti Panou S WP04 1 M 7 Nikos Theodulidis R WP02, WP04 8,3 M 7 Eleftherios Vorias T WP02, WP04 AC 7 Stratos Zacharopoulos T WP02 1 M 8 Antonio Borges S WP02,WP03,WP04 7 M 8 Pedro Roquette R WP03 2,25 M 8 Paula Teves-Costa R WP02 AC (4,6 M) 9 Catello Acerra T WP02 AC 9 Riccardo Azzara R WP02 AC 9 Fabrizio Cara R WP02, WP04 6 M 9 Giovanna Cultrera R WP02, WP04 AC 9 Giuseppe di Giulio R WP02, WP04 AC 9 Sandro Rao T WP02 AC 9 Antonio Rovelli R WP02, WP04 AC
10 Rosastella Daminelli T WP03, WP04 0,32 M 10 Roberto de Franco R WP04 0,15 M 10 Alberto Marcellini R WP03, WP04 0,27 M 10 Antonio Morrone T WP04 0,16 M 10 Marco Pagani R WP04 10 Alberto Tento T WP03, WP04 2,44 M 11 Lucia Fojtikova S Task C 0,83 M 11 Josef Kristek R WP 09 2,4 M 11 Miriam Kristekova R Task C 0,99 M 11 Peter Moczo R Task C 2,7 M 12 Anne-Marie Duval R WP02,WP03,WP04 4,3 M 12 Sylvain Vidal T WP02 1,85 M
• R = Researcher, S = Student, T = Technician, ACo = Assistant Coordinator

SESAME, Progress report : may 01 – april 02
Project n°EVG1-CT-2000-00026 - SESAME Page 8
II WP02 – T01.02: H/V technique – experimental conditions – year 1 Leader : Anne-Marie Duval (Partner 12 : CETEMED.LRE – Nice – France)
The aim of WP02 is to evaluate the influence of experimental parameters in stability and reproducibility of “H/V on ambient vibrations”. This means that we have to test various type of parameters and to check the variations both in frequency and in amplitude of the “H/V curves”. One of the numerous parameters to test (the recording instrument in itself) has been evaluated separately during this first year under the main direction of UiB.ISI (Bergen, Norway). The other parameters are tested in a common and global survey performed simultaneously by all partners. During the first year, this WP was divided into two parts: the influence of the instrument in itself and (simultaneously), the influence of all other experimental parameter.
1. The influence of the instrument in itself on H/V on ambient noise • After the kick off meeting (May, 2001), each team had to prepare the “SESAME instrument workshop”:
listing the instrument available for each team, choosing which instrument had to be evaluated, gathering specifications from the manufacturer.
• In October 2001, the “instrument workshop” took place in Bergen (UiB.ISI, Bergen - Norway) where an intensive experimental evaluation has been performed. A great amount of data was collected by each team. Individual measurements were performed as well as common experiments following protocols set up by UiB.ISI Bergen. Each team wrote a preliminary report during this workshop. (see Bergen Meeting WP02 minutes)
• After the workshop, partners had to gather their individual results in a preliminary common report concerning the instrument evaluation.
• A SESAME workshop was organized in Potsdam (Germany) in early January. One day and half were devoted to the instrument evaluation. The aim was to take stock on this evaluation and to share the work to produce the final report. We decided to affect the responsibility of each chapter of the final report to specific persons (see Potsdam Meeting WP02 minutes). Additional experiments were required to each team (in their own laboratory) to produce data needed for evaluation. Many other decisions were taken to achieve the comparison of instrument. We had to improve the data processing in order to fit as much as possible our aim. For instance, as SEISAN software was chosen to process “instrument” data, Bergen UiB.ISI partner (SEISAN designer) was asked to adapt SEISAN software to the required process. The calibration files of each instrument had also to be checked to progress in the instrument comparison.
• During February 2002, most of the required added data were collected and gathered. • During March 2002, SEISAN software and calibration files were adapted, all the data set could be processed
in a common way. Another SESAME workshop was organized in Nice in April 2002 (see Nice meeting minutes). During the first 2 days of this workshop, the persons implied in the final process of the instrument data gathered their results. A poster was produced and presented during EGS meeting in Nice (2002, April the 23rd- see EGS 2002 poster). The last process and graphs to complete the final report were produced. Then the final report was written. It is the first deliverable D01.02 “Controlled instrumental specifications” of the SESAME project.
2. The influence of the other experimental parameter • Although the time spent for “instrument” comparison has been quite large, “recording instrument” is only one
of the numerous experimental parameters that can have an influence on the “H/V on ambient vibration” curves, as was already emphasized during the kick off meeting.
• That is why, immediately after this SESAME kick-off meeting, all partners had intensive exchange to: − make clear the problem to solve, − prepare an exhaustive list of experimental parameter to test, − design the surveys, − set common and strict experimental protocol, − define common forms to be filled to build a common data base, − share the instrumental work.

SESAME, Progress report : may 01 – april 02
Project n°EVG1-CT-2000-00026 - SESAME Page 9
• Many documents were established and regularly updated to take into account new remarks. • During the Potsdam SESAME meeting (2002 Jan the 5th), we agreed to work following the directions
described in several documents: − list of parameter to test (file: “directions.WP02.v3.doc”), − direction for use (also included in the file: “directions.WP02.v3.doc”), − excel file forms to be filled for each record (file: “team.parameters.vX.xls”), − data base design, − a table was established to summarize tests that had to be performed by each partner following the former
procedures. • In February, Nice (CETEMED.LRE) and Grenoble (UJFG.LGIT) partners had a meeting to detail more
precisely their own tests (file: Grenoble-Nice.testWP02.v1.doc). • During February and March 2002, each partner performed several tests, processed the results with their own
software and noted all experimental conditions as required. It has to be noticed that the required tests are very numerous and time consuming. Furthermore, some of them can not be performed at any time. This is the case for instance for the test concerning the influence of the water table, or the weather. That is why many tests were not completed in April 2002.
• Another SESAME workshop concerning this task was organized in Nice the 23rd and 24th of April 2002 (see Nice meeting Minutes). This meeting aimed at:
− checking the result of the tests already performed, − deciding which tests are needed after these first results, − attributing these tests to each team, − organizing the data processing, − plan the work to be done until the final report.
During the meeting, all partners presented first the results obtained with their own experiments and their own process for the tests they performed during the previous weeks as planned in Potsdam (Germany) in January 2002. For each parameter, preliminary conclusions were drawn. To conclude a planning of work was established:
ë to attribute to each team the test that are still needed, ë to define a common data format (in relation with WP03-sofware), ë to have an agreement for the principle of a common process and make clear the dead-lines.
☺ Up to now, the time table is respected and there is no problem. A first deliverable has been produced D01.02 “Controlled instrumental specifications” in the form of a report. The next step will be the deliverable D08.02 “Measurement guidelines” for November 2002.
III WP03 – T01.03: H/V technique – data processing – year 1 Leader : Kuvvet Atakan (Partner 5: UIB.ISI – Bergen – Norway)
In the following, we summarize the status of the WP03 dedicated to development of a multiplatform H/V software. The status was discussed during the meeting at CETE-Nice, France, 26-27 April 2002 and the details can be found in the minutes. During the Potsdam meeting in January 2002, it was considered mandatory that this software be really usable in any part of the world on any platform. As a consequence, the software is designed as two separate modules (i) a Main Processing Module written in Fortran, and (ii) a Display Module written in Java. Since that time, the work regarding the first module was then organized and performed by the ETHZ-Zurich and CNR-Milano groups, whereas for the latter module, the work was organized and performed by the ICTE/UL-Lisbon group. Further work will be coordinated between the UiB-Bergen and the ICTE/UL-Lisbon groups regarding the integration of the display modules into the browsing and the graphical user interface. A preliminary design of the graphical user interface and the browsing modules has been performed, and is given in the following. In addition, an automatic window selection routine will be integrated to the browsing routine. This will require that the window selection routine of the LGIT-Grenoble group will be modified and adopted to the browsing part of the software. LGIT-Grenoble and the UiB-Bergen groups will coordinate the implementation of this.

SESAME, Progress report : may 01 – april 02
Project n°EVG1-CT-2000-00026 - SESAME Page 10
1. Graphical user interface and the browsing module It was suggested that the browser module would organize groups of files in a project file. The organization is made interactively, and the project file created. Following is a synthetic list of the most common usage scenarios that were identified. Usage Scenario 1 – creating a new project You create a new project by using the option in the menu (Figure 1).
Figure 1
Then the windows changes to include the project tree (Figure 2). Figure 2
The user should then use the menu (Figure 1) and insert the files (in GSE –CM6 or SESAME ASCII format ‘SAF’) that will be used in this project (one can repeat this operation as often as desired, to take files from several different places). (Figure 3).
Figure 3
SESAMEProject Config Process Help
Open
Save As
Close
Exit
New
Insert Data File
Save

SESAME, Progress report : may 01 – april 02
Project n°EVG1-CT-2000-00026 - SESAME Page 11
The files go into a general group, the unassigned files group. It is the place where the user leaves its files if he/she wants to process single files, which means that one-file represent one-site. Next, the user can organize its files in groups (sites). This can be done by using the group by code button – it will read the file header and create groups based on the site id information – or he/she can organize them interactively by creating site nodes (using the new site button) and dragging files from one group to the other. Grouping can also be done using the code from the file-name (i.e. the first 6 characters). The user has the possibility to eliminate a site node or a file node – using the delete button. When the user eliminates one site the files that it owns go into the unassigned group again. When the user eliminates one file from the project it is deleted from the tree. Once the project is structured the user can save it, using the corresponding menu option. To make changes to a project already built the user opens the project and makes the necessary changes – add new files, delete files, reassign files to sites, … - and then he saves the project again.
Usage Scenario 2 – data preview and window selection The user can preview the data in the project by selecting the data file in the tree. The data is shown in the right panel (Figure 4).
Figure 4 The user can select more than one file to preview them together. If there are time windows associated with the data – already calculated by the automatic windowing module or selected manually by the user – the time windows are shown. The user can also define time windows interactively, if he selected manual window selection in the config menu (Appendix A - p. 12). When the user clicks the mouse on the time series a window is added, with the project default window length. When the user presses and drags the left mouse button on the time series, the browser will calculate the number of windows to define and adds those windows in the interval defined with even spacing. By using the right mouse button the user accesses a popup menu with which he can choose to delete the selected window or all windows.
Usage Scenario 3 –processing the files in a project After having configured the window selection and input parameters (or at least confirmed the acceptance of the default values) the user can process the project files. He/she selects the process menu option and the browser calls the processing routines. If the processing runs without problems the browser calls the display modules to allow the user to view the results from the processing. If the processing produces a warning or an error the browser displays the resulting log file. In the simplest of scenarios the user opens a project already created and just selects the process option. If desired the user can review and change the window selection and the processing parameters (by calling the config menu- Appendix A).
SESAMEProject Config Processing Help
Group by code Add new site Delete
Unassigned filesFile 1File 2
Site 1
Site 2File 1File 2
# ofwindowsProject Window
lengthOutput file
name
File 1File 2File 3

SESAME, Progress report : may 01 – april 02
Project n°EVG1-CT-2000-00026 - SESAME Page 12
- Appendix A: Screen snapshots -
2. Main Processing Module
Status of the work A preliminary version of the main processing module is developed by the ETHZ-Zurich and CNR-Milano groups in a coordinated effort. Two meetings were held in Milano during the 14-15 March and 18-19 April 2002 for the coordination of the work. Otherwise, the work was performed individually by each group, and the information was exchanged electronically. The first approach of a command line module is finished, processing a set of default parameters. Not all options are yet included, tested platforms are currently Windows-PC and Linux. Currently only the Cityshark data format is read, GSE is not yet ready. Further development will continue during May and June and it is envisaged that the first test version of the main module will be available for the participants by the end of June 2002. It will be possible to have comments, suggestions and the report of possible bugs until mid-September 2002. Information about the processing options and the different files (parameter file and the output files) can be found in the Nice meeting minutes. The current version of the main processing module works through the following command line call:
hvproc0_1 winfile parfile outfile defparfile The instrumental correction is requested to be included, such that the spectra written out for the single window output are meaningful and can be included into publications. An agreement is reached that the processing of multiple sites is steered through the browsing module and not the main processing module.
SESAMEFile Config Process Help
Window selection
Input parameters

SESAME, Progress report : may 01 – april 02
Project n°EVG1-CT-2000-00026 - SESAME Page 13
Window input files ("winfile") example of window file: /home/acmt/HVtest/Mt/12121112.tst 5 25 one two thr /home/acmt/HVtest/Mt/12121112.tst 15 35 one two thr /home/acmt/HVtest/Mt/12121112.tst 30 55 one two thr /home/acmt/HVtest/Mt/12121112.tst 30 59 one two thr /home/acmt/HVtest/Mt/12120826.stc 39 59 one two thr Blank-lines and blanks at any location do not matter. Comment lines beginning with a ‘#’ character are ignored as well. The two numbers after the file names represent the index of the samples at the start of the window and at the end of the window. The format of the window file is kept like this strictly. The processing of multiple sites has to be done through some form of batch processing, steered from the browser module. The window length in the window file is defined as being fixed as an input parameter to the window selection. The anti-trigger method has this implied already, for the manual window selection a ‘post-windowing’ should be implemented, subdividing long time windows into windows of the fixed length (with some optional overlap). Parameter file ("parfile") A major change is that currently the error estimates are only the standard deviations – arithmetic averaging – or the log-standard deviation – in case of logarithmic window averaging. Output files ("outfile") They contain the window specifications (window file), the parameter definitions and the output data.
More details concerning all these files (Parfile, Outfile as well as Defparfile – Default parameter files) are given in the minutes of the Nice WP03 meeting available on the web sites http://SESAME-FP5.obs.ujf-grenoble.fr. Format of the input waveform file: SESAME ASCII It had been agreed that two forms of data files are to be used; GSE and a specific SESAME ASCII format. The SESAME ASCII format will be structured into a header, separated from the data by a line of the type: ####------------------------------------------- As the data has to be converted anyway, the definition of the format can be arbitrary. For simplicity the ‘Pitsa’ codes should be used as much as possible. But each information is put on a separate line. The data arrangement will be in 3 columns, strictly in the order Vertical, NS, EW. The following keywords/codes should be available from the header:
− site code of exactly six characters (eg. BSL_12), − sampling_rate in Hertz (eg. 125Hz), − date and time: start time of the trace as accurate as possible, − accuracy of timing, − acquisition system, − instrument-ID digitizer (serial number), − sensor type (accelerometer/seismometer), − instrument-ID sensor (serial number), − reference code of the sensor response (instrument response file), − conversion factor: counts -> Volt (V/count), − transduction: Volt -> physical meaning (V/m/s), − units of data in file (counts, or whatever, just identifying it), − number of data points, − comment line defining Vertical, NS, EW, − saturation of digitizer, − Station coordinates on separate lines, X,Y,Z, − project name, − arbitrary number of comment lines,

SESAME, Progress report : may 01 – april 02
Project n°EVG1-CT-2000-00026 - SESAME Page 14
− separator line before the data, − earthquake information as defined for the Pitsa format.
In general the processing should be possible without most of the above information. But the following are strictly required:
− sampling_rate in Hertz (eg. 125Hz), − number of data points, − channel information is needed, but it is fixed in the format.
The following two options are of interest for the processing and it is highly desired to have them in the data: − reference code of the sensor response (instrument response file) − saturation of digitiser in units of data
The remaining options are recommended. Additional codes should be possible but ‘Pitsa’ codes are strongly recommended and additions of codes should be used very restrictively. Filenames of SESAME ASCII Free file name, extension of the name will be .saf, such that the format can be identified from the extension. The suggested filename contains site code (6 characters), date and time: NNNNNN_yyyyMMdd_hhmm.saf Response file The instrument response is in a separate file, in a default directory of the installation. The header contains a reference to the response file. The response contains the response of the sensor. The format of the response file is taken from ‘Pitsa’ or GSE. The name of the response file is the name of the instrument, as defined in Xpitsa, the same codes are used, and a default directory belongs to the installation of the H/V software, where the response files are stored. The developers decide on the format of the response file so as to minimize the work amount to include the instrument correction.
3. The Display Module The status of the ‘Display Module’ was summarized by the ICTE/UL Lisbon group. During the preparations interactions were made with groups working on the main processing module to coordinate the data input and output. The preliminary version of the display modules were developed as agreed on the Potsdam meeting and presented. The developments were done in Java code. In the following, summary of the suggestions made during the meeting, as well as the snapshots of the different graphical displays are given (Appendix B – p.16). − In the output window (Ap. B-1) the title used will be the name of the output file. − In the output window (Ap.B-1) we should show all processing parameters present in the parameter file. − In the time series window (Ap.B-2) we should include the start time. − Place a button in all of the windows to open the HTML version of the manual (to be written within Task D). − Possibility (by pressing a button) to show the header of the input file. − Show a legend with the meaning of each of the curves. − It should be possible to change the settings of each chart. The settings include: - the colors, - the line patterns
and thickness, - showing (or not) the chart gridlines, - showing (or not) box axis, - the font properties of the various fonts, - which curves to show.
− The windows should be resizable. Options that are being implemented
• User option to change between logarithmic and linear scales. The user will also be able to change the limits in the scale
• Possibility to show the wave graphics using a common vertical scale or one scale for each component (Ap. B-2). This will be accomplished using a check box which will link/unlink the scales
The suggestions for improvements from the participants will be made until June 15, 2002.

SESAME, Progress report : may 01 – april 02
Project n°EVG1-CT-2000-00026 - SESAME Page 15
- Appendix B: Snapshots of the Display Module -
Parameters window: This window is being discussed by the three development teams as to which parameters should be used, the default values to be used in each case, as well as the limits of each parameter.
Ap. B-1 - Graphic window (output window): the title used will be the name of the output file

SESAME, Progress report : may 01 – april 02
Project n°EVG1-CT-2000-00026 - SESAME Page 16
Ap. B-2 - Graphic window (time series window): the start time should be included.
☺ In general the progress is satisfactory and the further actions are scheduled to be done until October 2002, in order to discuss them during the project meeting that will take place in Rome. The deliverable D09.03 “Multi-platform H/V processing software” is thus still foreseen for February 2003.
IV WP04 – T01.04: H/V technique – empirical evaluation – year 1 Leader: Nikos Theodulidis (Partner 7 – IESEE – Thessaloniki – Greece)
This work package is intended to perform an objective, purely experimental assessment of the reliability of the H/V technique, by comparing its results with those of other, well established experimental techniques, based on a homogeneous data set of ambient noise and earthquake recordings. It will also compare H/V results with observed damage on recent earthquakes. During the period November 2001 to April 2002 each Partner participating in WP04 prepared an inventory of all the existing data sets, both for ambient noise and earthquake recordings at the same site. A preliminary catalogue of this data was sent to the WP04 leader and all data was presented at the SESAME-Nice meeting on April 25th, 2002. In that meeting the data presented in Appendix A (p. 18) were decided to be used for further analysis according to the project. The data format of all the data sets (ambient noise, earthquake recordings) was decided to be either SESAME–ASCII or GSE-ASCII. Parallel to the aforementioned, all Partners have performed or will perform in the next few months additional ambient noise measurements at selected sites in order to enhance the existing data set. In addition, a few damaged cities - mainly in Greece and Italy - will serve as experimental sites where ambient noise measurements have been performed or will be performed in order to compare them with damage distribution. These sites are given in Appendix B (p. 20).

SESAME, Progress report : may 01 – april 02
Project n°EVG1-CT-2000-00026 - SESAME Page 17
For each experimental site a Standard Information Sheet was prepared and adopted by the Partners during the Nice meeting, both for ambient noise data vs earthquake recordings (example is given in Appendix C-1, p. 20) and ambient noise data vs damage levels (example is given in Appendix C-2, P. 21).
- Appendix A: available data (Earthquake & Noise Recordings) - 1. ITSAK (Thessaloniki)
No Site (Name/Code) Ambient Noise
Earthquake Records -Weak:
vg or ag
Earthquake Records -Strong: ag
≥0.1g
vp-vs-{Q} Other Info
01 Edessa[EDE] N Y Y Y Reference 02 Almiros[ALM] N Y N Y 03 Patra [PAT1] N Y Y Y 04 Lefkas[LEF] N Y Y Y 05 Kyparissia[KYP] N Y Y Y 06 Argostoli[ARG] N Y Y Y 07 Pyrgos[PYR] N Y Y Y 08 Kozani[KOZ] N Y Y Y 09 Kalamata[KAL1] N Y Y Y 10 Kalamata[KAL2] N Y Y Y 11 Kalamata[KAL3] N Y Y Y 12 Euroseistest[STE] Y Y N Y 13 Euroseistest[STC] Y Y N Y 14 Euroseistest[FRM] Y Y N Y 15 Euroseistest[TST] Y Y N Y 16 Euroseistest[GRA] Y Y N Y 17 Euroseistest[GRB] Y Y N Y 18 Euroseistest[PRO] Y Y N Y 19 Thessaloniki[OBS] Y Y N Y 20 Thessaloniki[THE] N Y N Y 21 Thessaloniki[KAL] Y Y N Y 22 Thessaloniki[POL] N Y N Y 23 Thessaloniki[TIF] Y Y N Y 24 Thessaloniki[LEP] N Y N Y 25 Thessaloniki[LAB] N Y N Y 26 Thessaloniki[ROT] Y Y N Y 27 Thessaloniki[AGO] N Y N Y 28 Thessaloniki[OTE] Y Y N Y 29 Thessaloniki[AMP] N Y N Y 30 Athens[ALS] N Y N Y 31 Athens[MND] N Y N Y 32 Athens[FRN] N Y N Y Available in the near future 33 Korinthos[KOR] N Y Y Y 34 Zakynthos[ZAK] N Y Y Y 35 Athens[ATH2] N Y Y Y 36 Athens[ATH3] N Y Y Y 37 Athens[ATH4] N Y Y Y
In addition there are ~35sites of ITSAK’s strong motion network: − strong motion recordings (weak & strong) − surface geology information − noise measurements (existing & in next months)
2. CSGAQ-CNR (Milano) Fabriano data set − Umbria - Marche 1997 earthquake − Network installed in the urban area of Fabriano (~ 2 Km x 2 Km) (Marche region) − 21 sites mainly on fluvio-lacustrine deposits (thickness < 30 m) except for two stations on outcrops of the Umbro-Marchigiana series − sensors : Mark L4C-3D 1 Hz, Mark L22-3D 2 Hz, Lennartz LE-3D 0.2 Hz − ~ 40 events, 2.1 < ML < 4.6, 25 < hypocentral distance < 40 Km − 2 Hz < F0 < 6 Hz − Noise recordings (10 minutes continuous) for 5 stations − Vs profiles up to 15 – 25 m available for 3 locations (down hole and SASW), nearest stations at ~ 250 m.
Nocera data set − Umbria - Marche 1997 earthquake − Two temporary arrays deployed in localities around Nocera Umbra (Umbria region). − 13 and 10 sites respectively − All the stations with sensors Mark L4C-3D 1 Hz − ~ 20 events, 1.5 < ML < 3.7, 5 < hypocentral distance < 40 Km. − 4 Hz < F0 < 8 Hz − Noise recordings (10 minutes continuous) for 7 stations − Accelerometric site with main shocks recordings and velocimetric aftershocks recordings − Vs profiles up to 10 – 15 m available for 2 locations (down hole and SASW) near stations.

SESAME, Progress report : may 01 – april 02
Project n°EVG1-CT-2000-00026 - SESAME Page 18
Predappio ( Emilia Romagna region) data set − Weak motion recordings in 20 sites – shallow alluvial deposits (thickness<10m) − sensor Mark L4C-3D 1 Hz − Noise recording (10 minutes continuous) in each site − 5 Hz < F0 < 12 Hz − Vs profile up to 15 m available in 1 station site (cross hole)
Noise recordings along seismic reflection lines − reflection profiles across glacial valleys in Valtellina and Val Seriana (Lombardia), - valley width ~ 1 Km, - bedrock depth ~ 300 – 400 m − Vp in fluvial and glacial deposits 700 m/s 2500 m/s, - Vp bedrock ~ 4000 m/s − Noise recording (10 minutes continuous) − Sensor Lennartz LE-3D 0.2 Hz 3. LGIT (Grenoble)
Site Team Hmax Amplification Sites (indicative) Band-width Range alluvial rock
Annecy LGIT 100 m 1 – 10 4 - 10 3 2 Ebron CETE 100 m 1 – 10 10 - 20 3 2 Grenoble LGIT 800 m 0.3 – 5 5 - 20 9 2 Nice CETE/LGIT 60 m 1 – 10 8 - 20 4 1 Pointe-à-Pitre (Guadeloupe) LGIT+ CETE 30 m 1 – 6 5 - 15 4 2 Thessaloniki (common with ITSAK) LGIT + AUTH 100 m 0.5 – 10 3 - 8 8 2 Volvi 1997 LGIT + AUTH 200 m 0.7 – 10 4 - 12 5+10 1
TOTAL 30-800 m 0.3 – 10 3 - 20 46 12
Other data possibly available Other experiments RAP station pairs in
- Chambéry (2 sites) - Guadeloupe / BRGM (?upon request)
- Lourdes (8 sites, shallow quaternary deposits) - Tehran (10 sites, under way till June 2002) - Mexico (Chavez-Garcia / Ordaz) (?upon request)
For each series of sites, both earthquake and microtremor recordings are available 4. INGV (Roma)
Sites Earthquake recordings Geological or/and Geophysical data Noise Velocity Acceleration
≥0.1g Srati-
graphy Litho-logy
SPT values
Vp Vs Q ρ
1 Benevento Yes Yes No No Yes Yes Yes Yes Yes No Yes 2 Catania Yes Yes Yes No Yes Yes No Yes No No No 3 Colfiorito Yes Yes No Yes Yes Yes No Yes Yes No No 4 Verchiano Yes Yes Yes No Yes Yes No Yes No No No 5 Città di Castello Yes Yes Yes No Yes Yes No Yes Yes No No 6 Ferrara Yes Yes No No Yes Yes No Yes Yes Yes Yes
Site Number of stations
Recording period
Sensors Digital acquisition
Sample frequency
Data format
1 3 12/07/00-05/12/01 Lennartz 3d 5sec MarsLite 31,25 (until 04/10/00) 62,5
SAC-linux
6 (From Jan.02 8 stations at Ben)
since 05/12/01 Lennartz 3d 5sec MarsLite 62,5 SAC-linux
2 7 (3 without GPS information)
since 02/11/00 Guralp cmg40t – cmg5t 3d
Reftek 72A07-72A08
50 (velocimeter) 100 (accelerometer)
SEGY-Unix / SAC- Unix
3 4 (3 in the middle of basin, 1 at the edge)
17-24/02/98 Guralp cmg40t 3d Reftek 72A07 100 SEGY-Unix / SAC – Linux
5 (4 in the middle of basin, 1 on bedrock)
24/02- 03/03/98 Guralp cmg40t 3d Reftek 72A07 100 SEGY-Unix / SAC - Linux
3 (2 in the middle of basin, 1 in the edge)
10-19/03/98 Guralp cmg40t 3d Reftek 72A07 100 SEGY / SAC
4 11 (6 channels), linear array
20-24/10/97 L22 CMG40t 3d
Reftek 250 SEGY / SAC
5 7 19/5-4/6/98 Lennartz 3d 5sec Reftek 125 SEGY / SAC 6 27, linear array continuos recording 14-
25/05/2001 Lennartz 3d 5sec Lennartz 5800,
Lennartz Mars88, Reftek 72A07
125 SAC- SEGY
68 sites each 10 minutes 14-25/05/2001
Lennartz 3d 5sec Reftek 72A07, Lennartz 5800, Marslite
125 SAC- SEGY
12 trigger recording 7/4-28/6/2000
Mark L4C/3D Lennartz Mars88/FD62,5
7 trigger recording 28/6-5/12/2001
Mark L4C/3D Lennartz Mars88/FD62,5
7 2 (1 at the surface, 1 in a borehole 130 m deep -bedrock-)
10/1996 CMG3 100s Mars88/ Guralp system
100 - 125 SAC
Among the mentioned sites, (1) Benevento, (3) Colfiorito and (7) Ferrara are well documented while the others are poorly documented.

SESAME, Progress report : may 01 – april 02
Project n°EVG1-CT-2000-00026 - SESAME Page 19
5. ETHZ (Zürich) Swiss Seismological Service operates a network of 59 stations throughout the country. All of them belong to “poorly” documented sites with respect to geotechnical / geophysical data. For about 10 sites, data from earthquake recordings and ambient noise measurements are available and will be sent to WP04 leader. In conclusion, there are two categories of sites: - well documented & Earthquake & Noise - poorly documented (Surface geology) & Earthquake & Noise It was proposed by P-Y. Bard - and accepted - that two additional sub-categories of earthquake data should be established, namely: - well documented data with reference site, - poorly documented data with reference site.
- Appendix B: available data (Damage & Noise Recordings) -
Sites Damage Noise recording 1. ITSAK (Thessaloniki) Thessaloniki
(20/6/1978, M6.5, R=30km)
Detailed Damage per Block Equal Damage Map Cost of Repair Map
noise will be measured
Kalamata (13/9/1986, M6.4, R=9km)
Detailed Damage per Block Equal Damage Map
noise will be measured
Athens Suburbs (7/9/1999, M5.9, R<10km)
Equal Damage Map noise may be measured ???
2. INGV (Roma) Roma (Umbria-Marche 1997 earthquake)
Equal damage map of the city noise will be measured
Palermo (destructive event of the 19th century)
Equal damage map of the historical centre (3 levels)
noise will be measured
3. CETE (Nice) Caracas-Venezuela (Caracas 1997 earthquake)
Equal damage map of the city noise measurements already done
- Appendix C-1: Ambient noise data vs earthquake recordings (Standard Information Sheet for
each experimental site) -
Information No Records Ref. Site Remarks SITE [Name/Code/Coordinates] Lefkas[LEF]
Noise Measurements (min) 30 Available Continuous
Exctracted for SESAME 30min Earthquake Recordings
Weak Motion (velocity) - No Records 100 25 PRO Weak Motion (acceleration) - No Records 100 Strong Motion (PGA >0.1g) - No Records 20
Magnitude Range Distance Range (km)
Geological Data Surface Geology(Rock-Stiff-Soft)
Stratigraphy & Lithology Y Bedrock Depth (m) 10 to 15
Geotechnical - Geophysical Data SPT-values Y up to 10m CPT-values N Vp (m/sec) Y up to 10m Cross-HoleVs (m/sec) Y up to 10m
Q N r (gr/cm**3) Y up to 10m
Basin Geometry fo (hz) 0.3 Shape Cylindrical
Width (km) 5 Depth (km) 0.5
Length (km) 5 Closest Distance from Edge (km) 0.3
Surface Topography Flat Site Description
Ground Coupling Information on Noise Measurements

SESAME, Progress report : may 01 – april 02
Project n°EVG1-CT-2000-00026 - SESAME Page 20
Recorder Type Sensor Type
Sampling Frequency Gain
Data Format SESAME -ASCII Recording Period
Information on Earthquake Measurements Recorder Type
Sensor Type Sampling Frequency
Gain Data Format SESAME -ASCII
Recording Period GPS
Contact Infornation [Institute/Person] CETE/A-M. Duval - Appendix C-2: Ambient noise data vs damage level (Standard Information Sheet for each
experimental site) -
Information Remarks Site [Name/ Location]
Causative Earthquake Date
Magnitude Focal Mechanism(N-T-SS)
Coordinates Depth (km)
Intensity Distribution Discrete in Space
Equal-Damage Map Intensity Scale
Other Type of Losses Type of Constructions
RC Masonry
Stone Wooden
Noise Measurements No of Sites
Existing Planned (when?) Recorder Types
Sensor Types Sampling Frequencies
Gain(s) Data Format
Recording Period Earthquake Recordings
No of Sites Weak Motion (<0.1g) Strong Motion(>0.1g)
Recorder Types Sensor Types
Sampling Frequencies Gain(s)
Data Format Recording Period
☺ Up to now, the time table is respected. The first stage of the WP including the gathering of already available earthquake recordings and noise data, and the performing of experimental measurements and preliminary processing of ambient vibrations at the strong motion sites and at selected sites of the cities affected by strong earthquakes is going on. A first deliverable D04.04 “Homogeneous data set of noise and earthquake recordings at many sites” will be produced for September2002.

SESAME, Progress report : may 01 – april 02
Project n°EVG1-CT-2000-00026 - SESAME Page 21
V WP05 – T01.05: instrument layout for array measurements – year 1 Leader: Frank Scherbaum (Partner 3 – UPOTS.GEO – Postdam – Germany)
Within the context of this work package the dependence of the array performance (for phase velocity determination) on the experimental conditions (array geometry, aperture, number of sensors, sensor types, timing accuracy) shall be assessed. The input needed for this task are:
− existing array measurement data sets from within the consortium, − array measurements performed at well known test sites within the consortium, − relative calibration of instruments with respect to a broadband sensor (phase response), − computer codes for the calculation of the array transfer functions.
In a pilot study performed at the Institute of Geosciences, University of Potsdam (Streich and Scherbaum, 2001), the dependence of array geometry, array aperture, distribution of noise sources and the influence of uncertainties of sensor phase responses on the phase velocity determination by standard f-k analysis (e.g. Kvaerna and Ringdahl, 1986) have been investigated. For the evaluation of the array performance a set of synthetic seismograms have been calculated by passing a broadband input signal through an allpass filter with frequency dependent phase delays derived from the dispersion relation for a realistic site. Several conclusions could be made from this work: within an intermediate frequency band all investigated array geometries give a satisfactory result in terms of the derived dispersion curve. Phase response distortions of seismometers resulting from up to 1% deviation in the calibration information have little influence for the apertures and station distances considered. However, besides natural limitations in the performance for higher frequencies due to spatial aliasing effects, the performance for lower frequencies has not been satisfying. It has been shown, that for a dominating noise source region (source-receiver azimuths not equal distributed), the dispersion curve could be recovered, whereas for an azimuth random distribution, the derived apparent velocity values are highly overestimated. As possible explanation for these findings it has been suggested that the superposition of array transfer functions for signals arriving from different azimuths always lead to a bias in the slowness estimate. Conclusions to be drawn are the following:
1. For f-k analysis of ambient noise in lower frequency bands it is necessary to preselect time windows which contain a dominant surface wave train from a single azimuth for the analysis.
2. Test array methods providing higher resolution (e.g. Capon, 1969) 3. Test array methods using different assumptions about the observed wavefield, i.e. random wavefield (i.e.
spatial auto-correlation method SPAC, Aki, 1957). These conclusions have lead to the selection of array analysis methods to be studied within WP06 (compare: SESAME 2nd progress report, May 2002). In order to test various array analysis methods within the given task, a new set of synthetic seismograms has been calculated (compare SESAME 2nd progress report, WP06, May 2002). Furthermore, the SESAME partners have decided on four main test sites within the consortium where field experiments will be conducted. Until present, field data has been acquired for the main test site in Belgium by the Laboratoire de Géologie de l’Ingénieur - Université de Liège - and the Observatoire Royal de Belgique - sub-contractor of SESAME project and in the German-Switzerland border region close to Basle by the University of Postdam. The corresponding field experiments for the remaining sites in Colfiorito (Italy) and Thessaloniki (Greece) will be conducted at the end of July, beginning of August 2002. ☺ Up to now, the time table is respected. In November 2002, two deliverables, one on a tentative strategy for array deployment and performance evaluation D06.05 “Array data set for different sites”, and a second on field survey D07.05 “Optimum deployment strategy and quality measure for array layout in view of obtaining surface wave” will be produced.

SESAME, Progress report : may 01 – april 02
Project n°EVG1-CT-2000-00026 - SESAME Page 22
VI WP06 – T01.06: array measurements – derivation of dispersion curves – year 1 Leader: Frank Scherbaum (Partner 3 – UPOTS.GEO – Postdam – Germany)
Within the context of this work package a semi-automatic processing system for the array analysis of ambient vibrations shall be developed. The array processing has the final objective to derive the dispersion curve characteristics for the investigated site. We have selected four standard array methods for the analysis of ambient vibrations. The four selected methods differ both in the assumptions made for the analyzed wavefield as well as in the feasibility of the method-specific experimental setup. Three of those four methods, the “slantstack analysis” (SL, e.g. Louie, 2000), the “f-k analysis” (FK, e.g. Kvaerna and Ringdahl, 1986) and the “high-resolution f-k” (HRFK, Capon, 1969) assume the arrival of coherent plane waves crossing the seismic array. Whereas for the SL method only a one-dimensional array setup is required - thus one of the preferred methods in terms of logistical considerations - both FK and CAPON need a two-dimensional array setup. The last method to be investigated is the spatial autocorrelation method (SPAC, Aki, 1957). This method assumes a stationary random wavefield and provides a theoretical relationship between the correlation of sensor pairs for differing azimuths and spatial distances and the dispersion characteristics of surface waves. The logistical demand for the experimental setup of the array configuration is high for the SPAC method. A dense semicircular array configuration with a large number of sensors and very exact positioning is required, resulting in a severe drawback for the feasibility of this method within the context of field campaigns in densely populated areas (cities). A modification of Aki’s SPAC has been presented by Bettig et al. (2001) which relaxes the necessity for an exact deployment of a semicircular array. At Institute of Geosciences, University of Potsdam (IGUP) the algorithms mentioned above have been implemented as a standalone C-program named „cap“. The field data is organized in a database (GIANT, Rietbrock and Scherbaum, 1998) and checked interactively within the GIANT/ PITSA (Scherbaum and Johnson, 1992) analysis environment for suitable time windows. Once the time windows are extracted, cap is started to process this time window with a few command line options and method specific parameters given via a configuration file. In Figure 1 a flow chart of the main processing steps in cap are shown. Figure 1: Flow chart of main processing steps in cap software module. The uppermost block describes the information retrieval from the GIANT database system. Besides the raw waveform data, station specific information (geographical coordinates and instrument calibration) has to be retrieved. The preprocessing block performs at first a check for data gaps and station dropouts. Then an offset removal is applied to the total length of the selected data. In order to make the individual waveforms comparable within the array, a simulation of a common instrument response is performed after Seidl (1980). The optional prefiltering of the waveforms is implemented as a user configurable Butterworth bandpass filter. The last block shows schematically the data processing in a sliding window. The step width between successive analysis windows is dt, and the analysis is performed over the whole trace length from t=start to t=end.
query GIANT database
preprocessing • offset removal• seismometer simulation (optional)
• retrieve waveform data• retrieve station coordinates• retrieve calibration information
• bandpass filtering (optional)
• data consistency check: check for data gaps, missing stations
apply selected method
in sliding window -
init: t 1 = start, t2 = start+winlen
t 2<end
process window [t 1,t2]
store t 1, results
t1 = t1 + dtt2 = t2 + dt
STOP
YES
NO(SL,FK, HRFK,SPAC)
perform statistic andderive dispersion curvewith error estimates

SESAME, Progress report : may 01 – april 02
Project n°EVG1-CT-2000-00026 - SESAME Page 23
As output cap provides the derived dispersion wave curve for the time window under consideration with additional error estimates. Currently under development is an automatic extraction of suitable time windows for processing. Furthermore the database interface is to be ported to a free available SQL-database (i.e. mySQL, www.mysql.org). As database structure we will use the CSS3.0 tables which is a standard in seismological applications (PIDC, CTBT). Furthermore we intend to use not only vertical component data (as done so far), but also the information of the horizontal components to check the data automatically for the assumption of arriving surface waves (e.g. as suggested in Tokimatsu, 1997). Both Rayleigh and Love type waves shall be considered. Other partners within the consortium have also implemented several array methods within their own processing schemes (Table 1). During the software workshop held in Potsdam in January 2002, all partners agreed on the interchange of source codes and the testing of the consortium partners’ software with both synthetic and real data sets.
SESAME Partner Array analysis algorithm coding/platform 3 - University of Potsdam - UPOTS.GEO
Slantstack f-k high-resolution f-k modified SPAC (vertical component)
C / Linux, Solaris
1 - Université Joseph Fourier - UJFG.LGIT modified SPAC (3 components) Fortran / Solaris 6 - Polytechnic School of Zürich – ETH.GEOP Beamforming f-k
high-resolution f-k Matlab signal processing toolbox / MS Windows, Linux, Unix.
Table 1: Contribution of array analysis software within the SESAME consortium In the current phase of the project, the algorithms are tested with both real data sets obtained from test sites and synthetic noise data. For the real data sets used it has been a requirement that for the test sites under consideration a number of geotechnical information is available in order to confirm the results of the dispersion curve inversion.
Figure 2: a) 100 discrete event locations (circles) distributed randomly around the station configuration in the center (red rectangle). The maximum source-receiver distance for this synthetic data is 10 km from the center of the station configuration. The azimuthal coverage of the source location resembles an equal distribution.

SESAME, Progress report : may 01 – april 02
Project n°EVG1-CT-2000-00026 - SESAME Page 24
The simulation of ambient noise from synthetic data has been achieved as follows: we have calculated a set of 100 discrete events with random azimuthal and distance distribution for a set of 222 receivers (Figure 2). The source-receiver distance range for the discrete events has been restricted to lie between 0.1 km to 10 km. In all cases the seismic source has been a vertical single force at the surface (radial symmetric radiation within 1D-velocity model). The 1D-velocity models used resemble typical site conditions. Within the software meeting in Potsdam, all partners involved in the array processing work package agreed on those site conditions where field experiments have been or will be performed during this year (Liege, Grenoble, Thessaloniki). Thus a comparison between real data sets and synthetic data sets is possible. For the calculation of the synthetic seismograms for each source-receiver combination we have used a modal summation technique implemented by R.B. Herrmann (Herrmann, 1987). In order to simulate synthetic ambient noise, the single discrete events have been shifted randomly in time and summed with different configurable weights (Figure 3). By applying this superposition principle a “controllable ambient noise” situation can be achieved (i.e. non-random distribution of noise sources). A comparison of the results obtained for the SL, FK and HRFK techniques for a single event and a circular array configuration is shown in Figure 4. (a) (b) Figure 3: a) Set of synthetic seismograms for discrete event. b) Synthetic simulation of ambient noise seismograms obtained via superposition of weighted discrete events shifted randomly in time.
Figure 4: Comparison of array analysis methods for synthetic example for the source-receiver configuration shown in the right panel (upper: station geometry; lower: source receiver geometry - red circles show the radial wave propagation from point source location). The color coded map shows the result for the slantstack analysis from low (violet) to high (red) beampower values displayed in the frequency-apparent velocity plane (1-dimensional wavenumber along event-receiver line). Superimposed is the theoretical dispersion curve for an arbitrary velocity model. White bars with
black diamond symbol indicate the results obtained for the f-k algorithm (bar width indicates the frequency band of analysis, diamond the center frequency). The white dots in the upper half of the f-v plane show the results of the high resolution f-k algorithm for each discrete frequency. Dots are reflected to the upper half plane for display reasons only. A good agreement of the dispersion curve results is found for all algorithms within the frequency band from 0.1 to 3 Hz.

SESAME, Progress report : may 01 – april 02
Project n°EVG1-CT-2000-00026 - SESAME Page 25
☺ Up to now, the time table is respected. In November 2002, one deliverable D05.06 “Quality control software for in-situ checks” will be produced. This software will be designed so that it can be used on a small workstation or a PC during field experiments as well as for post-processing. VII WP07 – T01.07: array measurements – inversion of velocity profile – year 1
Leader: Denis Jongmans (Partner 4 – ULGG.DGO – Liège – Belgium)
The aim of this WP is to extract the S (Vs) and P (Vp) wave velocity profiles from the dispersion curve calculated by the WP06. Usually, Herrmann’s codes (Hermann, 2001) are used to perform this inversion but some strong limitations led us to look for another way of converging towards the solution(s). At the beginning of this WP, we made a literature review to consider all possible options about the inversion scheme: linear methods, Monte-Carlo, Simulated Annealing, Genetic and Neighbourhood. The last three methods appeared to be a good compromise between the time consumption and the solving of the problem. In order to implement these methods, it is important to have a quick and robust algorithm to solve the direct problem, i.e. the calculation of the dispersion curve of a theoretical geological model. A C++ program, mainly inspired by the Herrmann’s code, has been developed during this year. It presents some slight differences in the way the curve are calculated to overcome the lacks of the former code. Very good performances compared to the Herrmann’s code were observed during the first tests. Intensive runs were performed to correct all bugs; the actual version is stable and ready for the next stage of the development. Until now, only the Neighbourhood algorithm has been used on very simple synthetics models (a soft sediments layer over a hard bed rock) with promising results for the inversion of Vs and Vp. Further tests have to be done in the next weeks to extend it to more sophisticated geological configurations where the non-uniqueness of the solution will appear. The a-priori information is very important and can help discriminating among all models that equally comply with the measured dispersion curve. We are looking for a rational way of including it in the inversion process. Real data sets are necessary to test the performances of all possible approaches. This is why we conducted a series of array measurements with the collaboration of Matthias Orhnberger and Frank Scherbaum in Liège and Uccle (Belgium, March 2002). Many interesting a-priori information are available for both sites: PSV and SH refraction profiles, surface wave’s measurements with artificial sources, boreholes with geological description are well distributed over the area and various Cone Penetration Tests are available. The analysis process has just started. The main items developed during the first year are detailed below.
1. Inversion method: Neighbourhood Algorithm This method, developed by M. Sambridge in 1999, searches a zone within the parameter space for the minima of the cost function. The dimension of the space is normally limited to 30 or 40. For more degrees of freedom the program loose efficiency and does not converge easily to the solution. It does not calculate any derivative of the cost function. The computation is divided into several iterations (parameter “Itmax”). Each iteration adds “ns” new models to the global set according to the results calculated so far. The newly generated models are randomly chosen over the “nr” most promising areas of the parameter space. The Voronoy geometry is used to map the cost function in the parameter space. The “nr” areas are the Voronoy cells where the cost function is minimum. “ns”, “nr” and “itmax” are the only tuning parameters of the method. This is a great advantage compared to the Genetic algorithm and the Simulated Annealing. As “nr” increases, more areas are explored and the algorithm behaves more as a sampler with slower convergence. Voronoy cells have a very interesting property: if the convergence is trapped in a local minimum, there are good chances to get out of it as new models are generated. The final result of the method is not only the best model parameters but also an estimation of the density of probability around this solution. It is also possible to investigate the non-uniqueness of the solution as the final

SESAME, Progress report : may 01 – april 02
Project n°EVG1-CT-2000-00026 - SESAME Page 26
set of models can contain various items with the same value for the cost function. Statistical analysis of the resulting set of model is used to quantify the information provided by the ambient vibration measurements (uncertainties and resolution). The a-priori knowledge may be merged with the dispersion curve information to reduce the uncertainties.
2. Direct Problem or forward calculation: C++ developments First tests on a simple model show that a wrong calculation of the dispersion curve (e.g. mode jumping) can drastically slow down the convergence. This is why a new robust algorithm has been studied. For Love and Rayleigh waves, the problem consists of finding the couples (frequency, wave number) where a certain determinant vanishes. It is a function of model parameters calculated using the Thomson-Haskell method or the propagator matrix method. The Herrmann’s implementation was simply translated from Fortran77 to C++. The forward calculation adopted here differs from the Herrmann’s one in the way the roots are searched. Herrmann’s code always constructs the dispersion curve from the higher frequency where all modes tend to merge (except the fundamental in the Rayleigh case) causing mode jumping if the search step for roots is too large. Lower values for this step increase CPU time needed. Thus, before calculating the curve at the desired sample points (frequency or period), we construct a stair function that separates each mode from the next one. As in Herrmann’s code, we need to define a search step. Mode jumping occurs when the step is too high. However, it automatically produces oscillations in the dispersion curve that are detected before sending the results to Neighbourhood algorithm. The stair function construction accepts all “special” shapes of the dispersion curve that arise when the ratio Vp/Vs is high or when the contrast between the half space and the superficial layers is weak. Finally, the roots can be found without any confusion of mode. To speedup the forward calculations, automatic adjustment of the parameters of the stair function construction are still under study.
3. Inversion of a basic model using components of §1 and §2 We started testing the Neighbourhood algorithm with the forward calculation described here above. A basic RMS function was taken as the cost function. The design of the program allows any other choice without great modification. The theoretical dispersion curve was calculated using our algorithm and Herrmann’s code on the following model (results are identical):
Thickness Vp Vs Density Soft Layer H1=50 m Vp1=500 m/s Vs1=250 m/s 2 Hard layer infinite Vp2=2000 m/s Vs2=1000 m/s 2.5
Then, from the calculated curve, we tried to find back Vp1, Vs1, Vs2 and H using inversion. Good recovery was achieved (1 or 2% error depending on the parameter). The parameters must be rescaled to fit in a parameter space with fixed boundaries: every parameter can vary between two fixed values. But Vs2 must be greater than Vs1 and the Poisson’s coefficient for the first layer must be consistent. Vp2 is calculated with a fixed Poisson’s coefficient. Those conditions generate a parameter space with irregular boundaries. The influence of the parameterization will be analysed in the next year, especially for models with a greater number of layers. ☺ Up to now, the time table is respected. During the first year test of existing methods on synthetic 1D models and development of an effective and reliable inversion technique allowing a priori information has been done. During the next year, the work will focus on processing and inversion of the dispersion curve obtained during experiments and in May 2003, a first deliverable D14.07 “Report on the inversion of velocity profile and Version 0 on the inversion software” will be produced.

SESAME, Progress report : may 01 – april 02
Project n°EVG1-CT-2000-00026 - SESAME Page 27
VIII WP08 – T01.08: nature of noise wavefield – year 1 Leader: Pierre-Yves Bard (Partner 1 – UJF.LGIT – Grenoble – France)
The first year has been basically devoted to a literature survey, in order to determine the main research directions for the following. This work has been achieved mainly within LGIT Grenoble by Sylvette Bonnefoy-Claudet, a PhD student funded by the SESAME project, under the scientific supervision of Pierre-Yves Bard and Fabrice Cotton. This section will thus summarize the main aspects of this literature survey, as well as its conclusions regarding the nature of noise wavefield, and the work to be done in the next year.
1. General overview Microtremors have been observed early during the nineteenth century. In 1872, Bertelli installed a pendulum and observed during many years that sometimes the pendulum moved continuously for hours or days. He noticed a correlation between the “microseisms” and disturbed air pressure (Gutenberg 1958). Since this date many studies about microtremor have been carried out. We can distinguish three predominant time periods. Until the middle of the twentieth century, studies were more qualitative than quantitative: progress in knowledge was limited by instrumental techniques. However, some authors highlighted important characteristics of microtremor. Relations between microseisms, meteorological conditions and oceanic waves have been pointed out by Banerji (Banerji 1924-1925). He observed in south Asia, microseisms associated with Indian Monsoon, and suggested that they are due to Rayleigh waves set up at the bottom of the sea by the train of water waves maintained by the monsoon currents. In 1958, Gutenberg (Gutenberg 1958) quoted a bibliography containing 600 references about microseisms. Unfortunately, the major part of these references are in foreign language (German, Italian …) and they were published in local scientist journal. It is difficult to obtain microtremor references until the 50’s. During the 50-70’s, improvements in instrumental technique allowed lots of noise survey. In order to understand noise wavefield composition, several techniques have been used: particule motion (Toksoz 1964), arrays techniques led to F-K analysis (Capon et al., 1967; Capon, 1969 Lacoss et al., 1969) and SPAC analysis (Aki 1957), boreholes techniques coupling with arrays analysis (Douze 1964-1967, Gupta 1965). The vast majority of works on noise wavefield composition has been done in this time period. Different conclusion about origin (oceanic, meteorological, human …) and nature (P waves, surfaces waves) of microtremor have been drawn. It is detailed in the following section "Nature of noise wavefield". From the 80’s up to now, the number of microtremor publications increase every year. Since it is not always easy to list these publications (especially Japanese publications), we can just estimate the number of microtremor publications: about 500. Some of them are devoted to the nature of noise wavefield, but an overwhelming majority (about 95%) is dealing with the applicability of microtremor, and/or their direct applications to some specific case studies. The most important application is the microzonation in the cities. There are two major techniques: site to reference spectral ratios, and H/V ratio. The second method is largely using than the first one. The H/V ratio technique was proposed first by Nogoshi in 1971, and then strongly emphasized by Nakamura (Nakamura 1989). Since this date, many authors have published a lots of papers about microzonation using H/V ratio (see Bard, 1999 for a review). Although few authors (Lachet and Bard 1994, Kudo 1995) attempted to find qualitative explanations about Nakamura’s technique, the major part of the authors assume that basements of the method are right. An other application of noise background vibration is array technique to obtain velocity profile. Studies started in the late 50's, but improvements in computer, and instrumental techniques (3-components seismometer, numeric data), in the last 3 decades, allow an increase in quantity and quality of data recording during array surveys (Malagnini et al. 1993; Matshushima and Okada 1996, Miyakoshi and Okada 1996; Chouet et al., 1998; Liu et al. 2000; Kudo et al. 2002; Bettig et al. 2002). Unfortunately, in these studies authors assume that nature and origin of microtremor are (well) known, and do not care about this issue. It is usual to read in paper « we assume that microtremor consisting in surface waves », and no more explanation !

SESAME, Progress report : may 01 – april 02
Project n°EVG1-CT-2000-00026 - SESAME Page 28
2. Nature of noise wavefield As mentioned in the previous section, most of the knowledge about microtremor was obtained during the 60-70’s. Most authors seem to agree about the origin of microtremor. There conclusions may be summarized as follows:
− at long periods (T>2s) microtremor are due to large scale oceanic meteorological conditions; − at intermediate periods (1<T<2s) they are mainly generated by effect of wind and local meteorological
conditions; − at short periods (T<1s) they are linked to human activities.
The distinction between long period (T>1s) and short period (T<1s) noise corresponds to the traditional distinction between « microseisms » with natural origin, and « microtremor » with an artificial origin. However, the 1s border line between these two domains may be shifted to longer periods, as shown by Seo (Seo 1997): in urban areas characterized by low frequency, high impedance-contrast subsoils , artificial microtremor may be more energetic than natural microseisms even at intermediate periods (up to a few second). An easy way to distinguish microseisms from microtremor is the significant daily amplitude variations (with a factor of 3 to 4 between day and night) of the microtremor. Concerning the composition of noise wavefield, this literature survey does not allow to conclude to a unique, unambiguous solution. It is usually admitted and demonstrated that microseisms (natural origin) consist mainly in fundamental Rayleigh waves (which may, however, include a few higher modes) (Longuet-Higgins 1950,). It is more difficult to define the nature of microtremor (T<1s): some authors conclude that urban noise consist of P waves (Gupta 1965, Li 1984), while other conclude in surface waves (Toksoz 1964, Douze 1964, Horike 1985, Liu 2000), and sometimes a mixed of them (Li 1984). Moreover, when noise wavefield consist in surface waves, authors do not agree on whether Rayleigh waves (fundamental and/or higher modes) or Love waves, are predominant A major conclusion of this literature survey is therefore that authors do not draw the same conclusions about composition of noise wavefield! More work must thus be done, in order to quantify several proportions concerning the nature of microtremor:
− surface waves / body waves, − rayleigh waves / love waves, − fundamental (rayleigh) mode / higher modes.
Some author attempted to give partial responses at these questions. Chouet (Chouet et al. 1998) analysed the volcanic tremor wavefield on the Stromboli volcano (SPAC arrays method). He found very significant proportion of surface waves in the total noise power, and amongst them, about 30% of Rayleigh waves and 70% of Love waves. More recently, Cornou (2002) has analysed noise wavefield in the basin of Grenoble (France) with MUSIC arrays analysis, she finds a proportion of 60% of Rayleigh waves and 40% of Love waves. One must be aware, however, these measurements are not homogeneous as they not always represent the same quantities. These first quantitative results have been obtained, in all cases, through array measurements. Therefore, our work in the next year will be essentially relying on a detailed analysis of the array data obtained in various sites (Grenoble, Volvi, Colfiorito, Basel, Liège, and Nice) within the SESAME consortium, and on the comparative analysis of synthetic noise simulations performed on those sites and on a number of canonical models as well. ☺ Up to now, the time table is respected. The first year has been basically devoted to a literature survey, in order to determine the main research directions for the following and to data gathering. During the next year, the work will focus on the analysis of array data available within the consortium. A deliverable D13.08 “Report on the nature of noise” will be produced for May 2003.

SESAME, Progress report : may 01 – april 02
Project n°EVG1-CT-2000-00026 - SESAME Page 29
IX WP09 – T01.09: numerical simulation of noise – year 1 Leader: Peter Moczo (Partner 11 – IGSAS.SD – Bratislava – Slovakia)
This WP focuses on the development and validation of numerical models producing realistic noise synthetics. It mainly uses Finite-Difference technique (FD) with spatially and temporally random surface sources, and include parameter studies to investigate the ability of H/V and array techniques, applied on synthetics, to recover the information on he structure. During this first year, the Fortran95 Program Package NOISE for numerical generation and simulation of seismic noise in 3D heterogeneous viscoelastic media has been developed. This package is much more powerful than the tool that has been used for preliminary tests in WP06, since it accounts for lateral structure variations. The program package consists of two programs: program RANSOURCE and program FDSIM. The flowchart of the Program Package NOISE can be found in the report of the first deliverable D02.09 “FD code to generate noise synthetics”. Program RANSOURCE is designed for random space-time generation of point sources of seismic noise. The output files serve as input files for the program FDSIM. The algorithm of random noise generation assumes regular spatial distribution of potential point sources inside of a specified source volume. The spatial distribution is controlled by the prescribed minimum distance between two neighbour point sources, minimum distance between a point source and a receiver, and maximum distance between a point source and a receiver. The temporal distribution of point sources is controlled by the prescribed minimum and maximum numbers of point sources acting at the same time. For each generated position of a point source, a direction of acting single body force at the position, time function and maximum amplitude are randomly generated. The time function is either delta-like signal or pseudo-monochromatic signal (a harmonic carrier with the Gaussian envelope). Spectrum of the delta-like signal is low-pass filtered in order to fit the prescribed frequency range. In the case of the pseudo-monochromatic signal, first its duration, then its predominant frequency are randomly generated. The maximum amplitude of the signal is randomly generated from the interval (0,1> according to a chosen distribution. The program has to be run before the finite-difference simulation of the noise itself. The program generates two files for all delta-like sources and as many files as the number of generated pseudo-monochromatic sources. All the files serve as the input data files for the program FDSIM. Program FDSIM is designed for the finite-difference simulation of seismic wave propagation and seismic ground motion in a 3D surface heterogeneous viscoelastic structure with a planar free surface. The computational algorithm is based on the explicit heterogeneous finite-difference scheme solving equations of motion in the heterogeneous viscoelastic medium with material discontinuities. The scheme is 4th-order accurate in space and 2nd-order accurate in time. The displacement-velocity-stress scheme is constructed on a staggered finite-difference grid. The computational region is represented by a volume of a parallelepiped with the top side representing a planar free surface, and bottom, rear, front, left and right sides representing either non-reflecting boundaries or planes of symmetry. Different types of non-reflecting boundaries can be chosen on different sides of the computational region. The discontinuous spatial grid is used to cover the computational region. The upper part of the grid has three times smaller grid spacing than the lower part. Each part itself is a uniform rectangular grid. The rheology of the medium corresponds to the generalised Maxwell body. This makes possible to account both for spatially varying quality factors of the P and S waves and for arbitrary Q-omega law. The wavefield is excited by a set of randomly generated point sources, each representing a single force acting in an arbitrary direction. The core memory optimisation is applied in order to significantly reduce requirements of the computer’s core memory.

SESAME, Progress report : may 01 – april 02
Project n°EVG1-CT-2000-00026 - SESAME Page 30
A set of canonical models for seismic noise simulations has been defined. The set consists of the following models (each being described in detail in the first deliverable D02.09 “FD code to generate noise synthetics”):
• M1 : homogeneous halfspace, • M2 : single layer over halfspace
parameter study with several mechanical parameters single layer over halfspace – Grenoble, single layer over halfspace – Liege,
• M3 : dipping layer, semiinfinite layer over halfspace, • M4 : semi-infinite layer over halfspace, • M5 : single layer with a rough layer-halfspace interface, • M6 : deep sediment valley
A – 2D case B – 3D, axisimmetric case
• M7 : shallow sediment valley A – 2D case B – 3D, axisimmetric case
• M8 : single layer with a trough at the bottom A – 2D case B – 3D, axisimmetric case
• M9 : buried fault • M10 : two-layer models
A – thick and shallow layers B – two shallow layers, with and without velocity inversion
• M11 : shallow layer, gradient model A – with increasing velocity B – with decreasing velocity
The set of canonical models will serve for extensive parametric study of synthetic seismic noise which will create a basis for deducing systematic features of the noise and decisive factors determining peak H/V and HT (VT) frequencies and corresponding amplitudes. This list is, however, subject to changes after the first computations with the NOISE program: the main unknown concerns the computer time. If it proves to be too heavy for the resources available within the consortium, then only part of this "ideal" set will be considered. Several methods of time-frequency analysis, including traditional windowed Fourier transform, Wigner distribution, continuous and discrete wavelet transform, wavelet packets, windowed Fourier transform with the reassignment method, continuous wavelet transform with the reassignment, and the matching pursuit decomposition with the redundant Gabor dictionary, were implemented and numerically compared. The properties of the above methods were compared for a set of simple canonical synthetic test signals and for a complicated non-stationary synthetic signal with a known time-frequency content. Though the Wigner distribution has many excellent properties, due to cross-terms it is not good for TFA of complicated multi-component signals. The windowed Fourier transform is not suitable due to the fixed window width. Suitable methods are, e.g., the continuous wavelet transform and its combination with the reassignment. The reassignment method can improve localisation properties and readability of the time-frequency representation. A very promising method is the matching pursuit decomposition with the Gabor dictionary. An improvement of the matching pursuit decomposition has been developed. With the extended Gabor dictionary the method is capable to correctly represent a linear dispersion in an analysed signal. ☺ Up to now, the time table is respected. The first year has been devoted to the development of computation method(s), and computer codes for 3D modelling of seismic-noise wavefield for realistic models of source-structure configurations. A first deliverable D02.09 “FD code to generate noise synthetics” in the form of a CD ROM with a report describing the flow chart of the software and canonical structural models has been produced and presenting with this first year progress report. The next step will be to perform numerical simulations for the selected set of canonical models. A next deliverable D12.09 “Report on parameter studies” is foreseen for May 2003.

SESAME, Progress report : may 01 – april 02
Project n°EVG1-CT-2000-00026 - SESAME Page 31
X References Aki, K., 1957. Space and time spectra of stationary stochastic waves with special reference to microtremors, Bull. Earthq.
Res. Inst., 35, 415-456. Banerji, S.K., 1924-1925. Microseisms associated with SW monsoon, Nature, 114:576, 116:866. Bard, P.-Y., 1999. Microtremor measurements: a tool for site effect estimation ?, State-of-the-art paper, Second
International Symposium on the Effects of Surface Geology on seismic motion, Yokohama, December 1-3, 1998, Irikura, Kudo, Okada & Sasatani, (eds), Balkema 1999, 3, 1251-1279.
Bettig, B., P.-Y. Bard, F. Scherbaum, J. Riepl, F. Cotton, C. Cornou and D. Hatzfeld, 2001. Analysis of dense array noise measurements using the modified SPatial Auto-Correlation method (SPAC) . Applicatio to the Grenoble area. Invited paper, Boletin de Geofisica Teorica e Applicata, in press.
Capon, J., 1969. High-Resolution Frequency-Wavenumber Spectrum Analysis, Proceedings of the IEEE, Vol. 57, No. 8, pp.1408-1419.
Capon, J., R.J. Greenfield and R.J. Kolker, 1967. Multidimensional maximum-likelihood processing of a large-aperture seismic array, Proc. IEEE, 55, 192-211.
Chouet, B., G. De Luca, G. Milana, P. Dawson, M. Martini and R. Scarpa, 1998. Shallow velocity structure of Stromboli Volcano, Italy, derived from small-aperture array measurements of strombolian tremor, Bull. seism. Soc. Am., 88-3, 653-666.
Cornou, C., 2002 : Traitement d’antenne et imagerie sismique dans l’agglomération grenobloise : implications pour le risque sismique, Thèse de doctorat de l’Université Joseph Fourier, Grenoble-I.
Cornou, C., P.-Y. Bard, M. Dietrich, 2002. Contribution of dense array analysis to basin-edge-induced waves identification and quantification. Methodology (I), submitted to BSSA.
Cornou, C., P.-Y. Bard, M. Dietrich, 2002. Contribution of dense array analysis to basin-edge-induced waves identification and quantification. Application to Grenoble basin, French Alps (II), submitted to BSSA.
Douze, E. J., 1964. Rayleigh waves in short-period seismic noise, Bull. seism. Soc. Am., 54-4, 1197-1212. Douze, E. J., 1967. Short-period seismic noise, Bull. seism. Soc. Am., 57-1, 55-81. Gupta, I.N., 1965. Standing-wave phenomena in short-period seismic noise, Geophysics, 30-6, 1179-1186. Gutenberg, B. 1958. Advances in geophysics, Vol.5, p. 53, Academic press, New-York. Herrmann, R.B., 1987. Computer programs in Seismology, Volume IV, Department of Earth & Atmospheric Sciences,
Saint Louis University. Herrmann, R.B., 2001. Computer programs in seismology: an overview of synthetic seismogram computation, Version
3.1, 08/03/2001, Department of Earth and Atmospheric Sciences, St-Louis University. http://www.eas.slu.edu/People/RBHerrmann/ComputerPrograms.html
Horike, M. 1996. Geophysical exploration using microtremor measurements. In: Eleventh World Conference on Earthquake Engineering, CD-ROM, Paper n° 2033, Acapulco, Mexico, Elsevier Science Ltd.
Horike, M., 1985. Inversion of phase velocity of long-period microtremors to the S-wave velocity structure down to the basement in urbanized areas, Journal of Physics of the Earth, 38, 59-96.
Kudo, K., 1995. Practical estimates of site response, State-of-the-Art report, Proceedings of the Fifth International Conference on Seismic Zonation, Nice, October 1995.
Kudo, K., T. Kanno, H. Okada, O. Özel, M. Erdik, T. Sasatani, S. Higashi, M. Takahashi, and K. Yoshida, 2002. Site specific issues for strong ground motions during the Kocaeli, Turkey, earthquake of August 17, 1999, as inferred from array observations of microtremors and aftershocks, Bull. seism. Soc. Am., 92-1, in press.
Kværna, T., and Ringdahl, F., 1986. Stability of various f-k estimation techniques, in: Semiannual Technical Summary, 1 October 1985 - 31 March 1986, NORSAR Scientific Report, 1-86/87, Kjeller, Norway, pp. 29-40, 1986. Lachet, C., and P.-Y. Bard, 1994. Numerical and theoretical investigations on the possibilities and limitations of the
"Nakamura's" technique, Journal of Physics of the Earth, 42, 377-397. Lacoss, R.T., E.J. Kelly M.N. Toksöz, 1969. Estimation of seismic noise using arrays. Geophysics, 34-1, 21-38. Li, T.M.C., J.F. Ferguson, E. Herrin & H.B. Durham, 1984. High-frequency seismic noise at Lajitas, Texas, Bull. seism.
Soc. Am., 74-5, 2015-2033. Liu,H.-P., D.M. Boore, W.B. Joyner, D.H. Oppenheimer, R.E. Warrick, W. Zhang, J.C. Hamilton & L.T. Brown,
2000. Comparison of phase velocities from array measurements or Rayleigh waves associated with microtremors and results calculated from borehole shear-wave velocities, Bull. seism. Soc. Am., 90-3, 666-678.
Longuet-Higgins, M.S., 1950. A theory on the origin of microseisms, Philos.Trans. R. Soc. Lond., A243: 1-35.

SESAME, Progress report : may 01 – april 02
Project n°EVG1-CT-2000-00026 - SESAME Page 32
Louie, J.N., 2001. Faster, Better: shear-Wave Velocity to 100 Meters Depth From Refraction Microtremor Arrays, Bull.
Seism. Soc. Am., Vol. 91, No. 2, pp. 347-364. Malagnini, L., A. Rovelli, S.E. Hough and L. Seeber, 1993. Site amplification estimates in the Garigliano valley, central
Italy, based on dense array measurements of ambient noise, Bull. seism. Soc. Am., 83, 1744-1744. Matshushima, T. and H. Okada, 1990. Determination of deep geological structures under urban areas using long-period
microtremors. BUTSURI-TANSA, 43-1, 21−33. Miyakoshi, K., and H. Okada, 1996. Estimation of the site-response in the Kushiro City, Hokkaido, Japan, using
microtremors with seismometer arrays, Xth World Conf. Earthq. Engng., Acapulco, # 900, Elsevier Science Ltd. Nakamura, Y, 1996. Real-time information systems for seismic hazard mitigation UrEDAS, HERAS and PIC, Q.R. of
RTRI, 37-3, 112- 127. Nakamura, Y., 1989. A method for dynamic characteristics estimation of subsurface using microtremor on the ground
surface. QR of R.T.R., 30-1 . Nakamura, Y., 1996. Real-time information systems for hazards mitigation, Xth World Conf. Earthq. Engng., Acapulco, #
2134, Elsevier Science Ltd. Nogoshi, M. and T. Igarashi, 1971. On the amplitude characteristics of microtremor (Part 2), Jour. seism. Soc. Japan, 24,
26-40 (in Japanese with English abstract) Rietbrock, A. and Scherbaum, F., 1998. The GIANT analysis system, Seismological Research Letters, Vol. 69, No. 6,
pp. 40-45. Sambridge, M, 1999. "Geophysical inversion with a neighbourhood algorithm: I. Searching a parameter space", 1999,
Geophysical Journal International, Vol 138, pp 479-494. Scherbaum, F. and Johnson, J., 1992. PITSA, Programmable Interactive Toolbox for Seismological Analysis, IASPEI
Software Library, Vol. 5. Seo, K., 1997. Comparison of measured microtremors with damage distribution, JICA Research and Development project
on Earthquake Disaster prevention , 306-320. Seo, K., 1997. Cooperative observation of microtremors in Kobé-Hanshin district, Japanese document, in Japanese with
English abstract, 38-46 Streich, R., and Scherbaum, F., 2001. Optimierung der Anordnung seismischer Mikro-Arrays für Boden-
unruhemessungen, 61. Jahrestagung der Deutschen Geophysikalischen Gesellschaft, Frankfurt. Tokimatsu, K., 1997. Geotechnical site characterization using surface waves, in: Earthquake Geotechnical Engineering,
Ishihara (ed.), pp. 1333-1368, Balkema, Rotterdam. Toksöz, M.N., 1964. Microseisms and an attempted application to exploration. Geophysics, 29-2, 154-177.
SESAME, Progress report : may 01 – april 02
Project n°EVG1-CT-2000-00026 - SESAME Page 33
SESAME synopsis As outlined in the sections describing each active work package, the project is progressing normally, according to the schedule, and there does not exist any major problem that jeopardize the chance of success of this project. I will therefore only emphasize the major achievements of this first year, after stating some general comments.
I Co-ordination
1. General atmosphere First of all, my overall feeling is that the general atmosphere of the project has been very good, cooperative and enthusiastic from the very beginning. The sharing of responsibilities between the coordinator, task leaders, and WP leaders, has been working smoothly and efficiently. The workpackage and task leaders have organized their WP and established work plans clearly assigning responsibilities and roles of every involved partner. All participants – scientists and technicians - from the 14 partner teams did perform very efficiently their assigned work according to the schedule, with extensive exchanges with other participants through electronic mails and work meetings. As a consequence of that good atmosphere, this project involves many individuals (more than 60 during the first year, see the participant list), who, obviously, are only part time on the project. Of course, in such a large group, the ideas and viewpoints are never unanimous; but up to now, when decisions had to be made involving large groups, it was done after extensive exchanges of viewpoints and arguments, and decisions have been made on a compromise / consensual basis rather than on an authoritarian basis. The coordinator feels very much concerned that such a situation will continue till the end of the project. The very good organizational work performed by our "assistant manager" Laurence Bourjot allows everybody to focus on the scientific and technical part of the work.
2. Test sites In order to check thoroughly the two techniques that are concerned in this project (H/V and array), it was decided during the first general meeting to apply them to a number of well-known sites, where detailed geotechnical and geophysical information is already available. These test-sites were selected from the experience and background of some consortium teams. They are five:
• Volvi (Greece): the European test site is one of the best known in Europe, thanks to two previous projects where two SESAME partners have been involved (EUROSEISTEST, EUROSEISMOD). It is relatively deep and soft (h = 200 m, f0 = 0.7 Hz, 2D site)
• Grenoble (France) : this very thick, relatively stiff site (h > 500 m, f0 = 0.3 Hz, 3D site) has been thoroughly studied by the Grenoble team in recent years because of observed very large, broad band amplifications. It is typical of large alpine valleys.
• Colfiorito (Italy) : this site has been extensively studied by the Italian partner after the Umbria-Marche sequence of 1997-1998, because of spectacular 2D/3D amplifications and ringing . It is a good example of many small alluvial basins in the Appenine and in "intermediate mountain" areas. It is however, rather deep, and low frequency (h > 100 m, f0 = 1 Hz).
• Basel (Switzerland) : this important urban and industrial area is, alike the Grenoble area, the object of extensive investigations by the Zurich partner. It is also a rather thick site (h > 200 m, f0 < 1 Hz).
• Liège (Belgium) : this is the only shallow site (h < 20 m, f0 = 5 Hz), and it is typical of many urban sites with thin alluvial / fluvial deposits.

SESAME, Progress report : may 01 – april 02
Project n°EVG1-CT-2000-00026 - SESAME Page 34
In addition, some attention will be paid also to two other sites:
• Uccle (near Brussels, site of the Royal observatory), • Nice (another urban area, typical of many coastal cities along the Mediterranean Sea).
3. Coordination tools
• A project logo has been chosen through a vote during the Potsdam meeting from several proposals. The propositions were from inside the consortium, in order to save money. This logo is extensively used in this progress report, on the web site, and in all the deliverables.
• A web site has been set up (http://SESAME-FP5.obs.ujf-grenoble.fr) and is maintained by the Grenoble group (coordinator), on which are posted a description of the project, the minutes of the various meetings, the deliverables, and a number of intermediate work documents.
• Despite an extensive use of electronic mails, "physical" meetings are still irreplaceable: the number of general meetings has been willingly limited to 3 throughout the whole duration of the project, but there have been, during this first year, a rather large number of work meetings (Bergen, Zurich, Potsdam, Milano, Grenoble, Nice): this has induced a significant amount of travel costs, although all participants tried their best to limit them at the lowest possible level (group travels by car, over week-end stays, …).
4. Administrative information
• Partner 1 - UJF: nothing to declare • Partner CR2 - Résonnace: Corinne Lacave being on maternity leave from May 2002 to November 2002,
Martin Koller will be during this time the scientific in charge of the work done in the project. For this reason, he is the only one who have signed the first year cost statement.
• Partner CR3 – UP: The chancellor of the University of Postdam changes the 18 October 2001. Mr Alfred Klein was replaced by Mrs Steffi Kirchner, who signed the first year cost statement.
• Partner CR4 – ULGG: The cost statement has been signed by the Financial Manageress of the University of Liège, Anne Girin, and not by the Rector Willy Legros.
• Partner CR5 – UiB: nothing to declare. • Partner CR6 – ETH: nothing to declare. • Partner CR7 – ITSAK: The cost statement has been signed by the Financial Officer Panagiota
Papadimitriou and not by the President of the Board of Directors Basil Papazachos. • Partner CR8 – ICTE/UL: nothing to declare. • Partner CR9 – INGV: nothing to declare. • Partner AC10.9 – CNR-CSGAQ/IDPA The Milano partner has changed its status: it remains a CNR
institute, but is has been joined with another CNR center based in Venezia, and its name has thus changed from "Centro di Studio per le Geodinamica Alpina e Quaternaria (CSGAQ)" to "Istituto per la Dinamica dei Processi Ambientali (IDPA)". A copy of the corresponding decree by the CNR President is enclosed (Appendix p. 41).
• Partner CR11 – GPISAS: nothing to declare. • Partner AC12.1 –CETE.Nice: nothing to declare. • Partner CR14 – LCPC: nothing to declare.

SESAME, Progress report : may 01 – april 02
Project n°EVG1-CT-2000-00026 - SESAME Page 35
II Scientific and technical achievements
1. Task A Although far from its end, Task A has already provided significant results. The instrumental results described in Deliverable D01.02 very clearly assess the performance of the various sensors and their limitations (see Table 9 in D01.02), and allow to recommend some and to advise against some others; similar results have also been reached for data acquisition systems (see Tables 7 and 8 in D01.02). We will have to be careful for the publication of those results, since some manufacturers (well ranked) already asked for these reports, very probably in order to take a commercial advantage from our results. We plan to send an individual letter to each of the various manufacturers, with a copy of the deliverable, before submitting a synthesis paper for publication. The ongoing series of tests about the field experimental protocol have also already yielded somewhat surprising results on soil/sensor coupling conditions. They bear an outmost importance for the practical implementation of the method: they will be therefore crosschecked carefully before being reported in the next deliverable from Task A (D04.02). The development of the H/V software was designed in view of optimizing its portability and simplicity for field or lab uses in developed AND developing countries. This led the consortium to take difficult decisions, - after an internal, passionate but democratic debate - , regarding a) the possible extension of the software for other more sophisticated uses, and b) the default data formats to be built-in the software. In both cases, the final decisions were made by attributing a heavy weight to the final goal of designing a simple tool for routine use by non-specialists all over the world. Finally, for the empirical assessment of the H/V technique (WP04), the ongoing gathering of all data already existing within the various teams of the consortium (Greece, Italy, France, Switzerland, Portugal) will allow to build up a very large data set, which will in turn allow to derive very meaningful statistical results.
2. Task B This task has faced some early difficulties linked with the physical move of the Liège responsible scientist to another place (another laboratory of the Grenoble University), and the resulting resign of the other Liège scientist who was initially scheduled to work on the project. These difficulties could, however, be solved after some months, with the appointment of a new PhD student (M. Wathelet), whose thesis is done under the co-supervision of Liège and Grenoble universities. No deliverable is due at the end of the first year, so results are only preliminary. The optimization of the instrumental layout will derive from a series of theoretical tests (already performed), and from the lessons from the ongoing measurements on the various test sites decided within the consortium. Field measurements have already been performed in Liège, Grenoble and Basel (+ another series in Nice); for the two remaining sites (Colfiorito and Volvi), the measurements are scheduled for late July / early August. The various array analysis techniques already developed in different teams of the consortium have been listed (f-k, high resolution, SPAC); they all focus on the derivation of the dispersion curve for the fundamental Rayleigh mode. The corresponding computer codes given to the Task leader, who is organizing them in a single package for a thorough comparison. The requirements for this "array software" are very different from those on the H/V software: the simplicity of use is not so important, since the techniques are rather sophisticated and cannot be operated by non-specialists. The tests will be performed on both real data (from the well-known test sites), and on synthetics from well-controlled models. Finally, the inversion of the velocity profile is being approached with a new inversion algorithm, that allows to take into account in a simple way some other information than the sole dispersion curve. Preliminary tests are encouraging but much work remains to be done, as scheduled. The discussions during the first general meeting outlined a new opportunity which had not been considered in the initial workplan: after an idea from the Zurich partner (Fäh et al., 2002), it seems possible also to get additional and strong constraints on the velocity profile directly from the H/V curve (provided this latter one is

SESAME, Progress report : may 01 – april 02
Project n°EVG1-CT-2000-00026 - SESAME Page 36
derived in a special way to be representative of the elliptic curve of Rayleigh waves). It has thus been decided to include some work on this technique within Task B and not within Task A.
3. Task C The main outcome of this task for the first year is the deliverable D02.09 “FD code to generate noise synthetics”, consisting in a program package to generate noise synthetics for arbitrary 3D media. This program is now being installed on three sites (Bratislava, Zurich and Grenoble) in order to share the very heavy computational work corresponding to a set of canonical models (as also detailed in deliverable D02.09). This set of canonical models, agreed upon in the Zürich meetings, comprises reference 1D models, 2D and 3D models. It will serve for extensive parametric study of synthetic seismic noise which will create a basis for deducing systematic features of the noise. The literature review accomplished during this first year confirmed the fact that little has been learnt in recent years about the actual composition of noise wave field. Moreover, different conclusions are reached by different authors! Very little is known as to the proportions between surface and body waves, between Rayleigh and Love waves, between fundamental and higher modes; and actually no robust, well accepted method presently exists that can directly lead to these ratios. The only systematic fact is that all the (few) existing quantitative results have been obtained through array measurements. Therefore, our work in the next year will be essentially relying on a detailed analysis of the array data obtained in the various test sites (Grenoble, Volvi, Colfiorito, Basel, Liège, Uccle and Nice) within the SESAME consortium, and on the comparative analysis of synthetic noise simulations performed on those sites and on a number of canonical models as well.
III Dissemination of results
This is the basic aim of Task D, scheduled to start after the end of the second year. However, a number of presentations have already been done in several conferences (see the list in the appendix), one paper has been published, another one has been submitted.
Kristek, K., P. Moczo, and R. Archuleta, 2002. Efficient methods to simulate planar free surface in the 3D 4th –order staggered-grid finite-difference schemes. Stud.. geophys. geod., 46, 2002, 355-381.
Fäh, D., F. Kind and D. Giardini, 2002. Inversion of local S-wave velocity structures from average H/V ratios, and their use for the estimation of site effects. submitted to Journal of Seismology, January 2002.
Other conferences are planned to advertise the project results (amongst which a key-note lecture during the next meeting of the European Seismological Commission – Genoa, September 2002 - will be partially devoted to the SESAME project). Also, the time and location of the scientific workshop scheduled for the beginning of the third year have been decided: it will take place in the Smolenice Castle in Slovakia on September 21-23, 2003. This facility, owned and operated by the Slovak Academy of Sciences, offers very cheap accommodation; it cannot, however, host more than 80 participants. We will therefore have very soon to decide our policy for the opening of this workshop to "non-SESAME" scientists, considering that
a) we do not have within the project the financial resources to invite foreign visitors; b) as outlined before, there already exist a large number of scientists participating in the project from
within the consortium c) our initial will was to have in the attendance both a few renown scientists from all over the world,
and "potential users" from developing countries. The final decision on the attendance policy will be taken during the next general meeting in Rome.

SESAME, Progress report : may 01 – april 02
Project n°EVG1-CT-2000-00026 - SESAME Page 37
SESAME important dates
Months Week 1 Week 2 Week 3 Week 4 1 May 2001 2 June 2001 Kick-off Meeting-Grenoble 3 July 2001 4 Aug. 2001 Zürich – Aug 29-30
Task C meeting 5 Sept. 2001 6 Oct. 2001 Bergen – Oct 22-26
Instrument workshop TaskA - WP02
7 Nov. 2001 First progress report 8 Dec. 2001 (AGU) 9 Jan. 2002 Postdam – Jan 7-8
Instrument workshop Preparation of report
TaskA-WP02
Postdam – Jan 9-11 Software & Array processing
techniques TaskA-WP03 & TaskB-WP06
10 Feb. 2002 11 March 2002 12 April 2002 During the EGS – Nice – April 21-27
Ap 21-22:Instrument workshop Finalisation of report Ap 23-24: WP02 Experimental conditions Ap 25: WP04 Data compilation Ap 26-27: WP03 Software development
Task A- WP02- WP 03- WP 04 D1, D2
13 May 2002 Zürich Task C meeting
D3: Progress report 1 (due on 30/06/02)
June 2002 Second report: first yearprogress report 14 June 2002 D4 15 July 2002 16 Aug. 2002 17 Sept 2002 (ECEE London) 18 Oct. 2002
Roma – Oct 23-26
Oct 22 : WP09-10 meeting Oct 23: WP04 Empirical evaluation Oct 24: WP03 Software development Oct. 25-26: General SESAME meeting
D5, D6, D7, D8
19 Nov. 2002 20 Dec. 2002 (AGU) 21 Jan. 2003 D9 22 Feb. 2003 23 March 2003 EGS – Nice 24 April 2003 D11, D12, D13,D14, D1525 May 2003 D10: Progress report 2
(due on 30/06/03) 26 June 2003 27 July 2003 D16, D17, D18, D19 28 Aug. 2003 29 Sept. 2003 Bratislava – Sept 22-24
Scientific Workshop
30 Oct. 2003 D20,D21 31 Nov. 2003 32 Dec. 2003 (AGU) 33 Jan. 2004 34 Feb. 2004 EGS – Nice 35 March 2004 36 April 2004 General Meeting - Nice D22, D23, D24 37 May 2004 D25: Progress report 3 38 June 2004 D25; Final report

SESAME, Progress report : may 01 – april 02
Project n°EVG1-CT-2000-00026 - SESAME Page 38
SESAME annexes
I Minutes of the meetings or workshops The minutes of the different meetings or workshops are available on the web site:
http://SESAME-FP5.obs.ujf-grenoble.fr
II Presentations to International conferences 1.Communication to the AGU in San Francisco (USA), 10-14 December 2001
VIBRATIONS ON THE ROLL-MANA, A ROLL ALONG ARRAY EXPERIMENT TO MAP LOCAL SITE EFFECTS
ACROSS A FAULT SYSTEM
M. Ohrnberger,(1), F. Scherbaum (1), K.-G. Hinzen (2), S.-K. Reamer (2), B. Weber (2) (1) Institut für Geowissenschaften, Universität Postdam, POB 601553, Potsdam, Germany, [email protected]. (2) Abt. für Erdbebengeologie des Instituts für Geologie der Universität zu Köln, Vinzens-Palotti-Str.26, Bergisch-Gladbach, 51429 Germany. The effects of surficial geology on seismic notion (site effects) are considered one of the major controlling factors to the damage distribution during earthquakes. Qualitative and quantitative estimates of local site amplifications provide important information for the identification of potential high risk areas. In this context, the analysis of ambient vibrations is an attractive tool for the mapping of site conditions. It is low-cost alternative to expensive active seismic experiments or geophysical well-logging and especially well suited for the use within urban areas. Within the MANA experiment we conducted ambient vibration measurements at roughly 100 sites in the Lower Rhine Embayement (NW-Germany) to test various aspects of site effect determination, especially the feasibility of a roll along technique. A total of 13 three-component seismometers (5s corner period) have been used in a linear array configuration (station distance ~ 100 m). At all times during the roll-along experiment at least 8 stations (mostly 10) were operating simultaneously, meanwhile the other stations were moved from the rear to the front of the line and re-installed. Thus, a total progress of almost 10 km could be obtained within two days. The line stretched across the NW-SE striking Erft fault system, one of the major faults in the eastern part of the Lower Rhine Embayement. The thickness of cenozoic soft-sediments overlying the basement of paleozoic age increase at the individual branches of the fault in abrupt steps of uncertain magnitude from around 200 m in the east to almost 100 M in the west. The results of single station horizontal to vertical spectral ratios (HVSR) along the line are presented as well as the spatial evolution of local dispersion curves obtained from a slantstack analysis (SSA). The spatial variation of feature along the line in both the HVSR and SSA are discussed in terms of sedimentary thickness and modifications of the wavefield properties of the ambient vibrations.
The following page is a presentation of the complete poster.

SESAME, Progress report : may 01 – april 02
Project n°EVG1-CT-2000-00026 - SESAME Page 39
Mettre le poster de Matthias (1 page de fichier pdf)

SESAME, Progress report : may 01 – april 02
Project n°EVG1-CT-2000-00026 - SESAME Page 40
2. Communication to the 3a Assemblea Hispano-Portuguesa de Geodesia y Geofisica, Valencia, Spain, 4-8 Feb 2002
TESTS FOR THE INTERPRETATION OF SEISMIC INTENSITIES ANOMALIES AT THE AZORES: MICROTREMOR SURVEY ON POVOAÇÃO COUNTY (S. MIGUEL ISLAND)
Ensaios para a interpretação de anomalias de intensidades sísmicas nos Açores: estudos de ruído ambiental no Concelho da Povoação (ilha de S. Miguel)
Paula Teves-Costa(1), C. Riedel(2,3), J.L. Gaspar(2), D. Vales(4), G. Queiroz(2), M.L. Senos(4,5), N. Wallenstein(2), F. M. Sousa(5) e M.
Escuer(5) (1) Centro de Geofísica da Universidade de Lisboa e Departamento de Física da Faculdade de Ciências da Universidade de Lisboa, Campo Grande, Edifício C8, 1749-016 Lisboa, Portugal, [email protected]. (2) Centro de Vulcanologia e Avaliação de Riscos Geológicos, Universidade dos Açores, 9501 801 – Ponta Delgada. (3) Instituto de Geofísica, Universidade de Kiel, Alemanha. (4) Instituto de Meteorologia, Rua C do Aeroporto, 1700 Lisboa, Lisboa. (5) Instituto de Meteorologia, Delegação Regional dos Açores, Ponta Delgada. Presentation done in Spanish with a summary in English. The seismic activity of the Azores Islands is known since the beginning of their settlement in the middle of the XV century. About 30 earthquakes produced social and economical important damages. The analysis of the damage distribution, for several earthquakes, shows systematically the existence of site effects. In order to understand the initial cause of these effects, we selected three different zones, with different geological and geomorphological characteristics, in the Povoação County, and we performed a microtremor survey. Pseudo-transfer functions for each site, H/V, were calculated according to the Nakamura methodology. The interpretation of the dominant frequencies must take into consideration not only the geological characteristics, but also the structural geomorphology.
3. Communication to the EGS, Nice, France, 22-26 Apr. 2002
INFLUENCE OF INSTRUMENTS ON H/V SPECTRA OF AMBIENT NOISE B. Guillier (1), K. Atakan (2), A-M. Duval (3), M. Ohrnberger (4), R. Azzara (5), F. Cara (5), J. Havskov (2), G. Alguacil (6), P. Teves-
Costa (7), Nikos Theodulidis (8) and the SESAME Project WP02-Team. (1) LGIT, Observatoire de Grenoble, BP 53 – 38041 Grenoble Cedex - France, [email protected] (2) UiB, Bergen, Norway, (3) CETE, Nice, France, (4) IGUP, Potsdam, Germany, (5) INGV, Rome, Italy, (6) UG, Granada, Spain, (7) CGUL, Lisbon, Portugal, (8) ITSAK, Thessaloniki, Greece. Microtremor measurements are commonly used in microzonation studies for hazard assessment and engineering purposes. In this respect a very widely used methodology in recent years is the computation of H/V spectral ratio of ambient excitations. SESAME project aims to investigate the reliability of this technique, both from the experimental and theoretical point of view. The first step is to check the stability and reproducibility of the measurements. Before testing the experimental conditions that may influence the H/V ratio, a workshop was devoted to perform a set of tests in order to compare the performance of different equipments currently used (13 digitizers and 15 sensors). All data collected for instrument tests were converted into a common format and processed using a common software for homogeneity. The first set of tests was devoted to analyse the physical properties of the digitizers (internal noise, time stability, sensitivity, channel consistency) and the minimum noise value able to be recorded for different gains and with different sensors. The second set of tests was dedicated to the sensor analysis. We check the performance of each sensor connected to the same digitizer. The last set of tests consisted of simultaneous measurements of noise by all the systems (digitizer-sensor combinations), performed on a concrete pier coupled directly with the bedrock in the laboratory, as well as outside in the free-field, in two different ground coupling conditions (grass and concrete). The preliminary results indicate that significant differences may occur between the different systems, depending upon the digitizer-sensor combinations. In general, the digitizer tests showed consistency with the manufacturers specifications. However, the combination with different sensors yielded variable results, indicating the importance of the system performance as a whole and the level of sensitivity required for the type of data collected. The sensor tests revealed the importance of the sensitivity required by the input ambient excitations at frequency levels down to 0.1 Hz. Broad-band sensors gave higher resolution at lower frequencies, but they are difficult to implement in a microtremor experiment, due to stability and portability problems. In general, sensors with 1-5 sec period are more suitable for microtremor measurements. The H/V spectral ratios performed on the simultaneous measurements, showed clear limitations on some of the sensor-digitizer combinations.

SESAME, Progress report : may 01 – april 02
Project n°EVG1-CT-2000-00026 - SESAME Page 41
MICROTREMOR SURVEY ON POVOAÇÃO COUNTY (S. MIGUEL ISLAND, AZORES): DATA ANALYSIS AND INTERPRETATION
P. Teves-Costa (1), C. Riedel (2,3), D. Vales (4), N. Wallenstein (2), A. Borges (1,5), M.L. Senos (4), J.L. Gaspar (2), G. Queiroz (2)
(1) Centro de Geofísica da Universidade de Lisboa e DF-FCUL, Campo Grande, Edifício C8, 1749-016 Lisboa, Portugal, [email protected], (2) Centro de Vulcanologia e Avaliação de Riscos Geológicos, Universidade dos Açores, Ponta Delgada, Portugal, (3) Institut für Geowissenschaften, Kiel, Germany, (4) Instituto de Meteorologia, Lisboa, Portugal, (5) Instituto de Ciências da Terra e do Espaço, Lisboa, Portugal. The seismic activity of the Azores Islands is known since the beginning of their settlement in the middle of the XV century. About 30 earthquakes produced social and economical important damages. The analysis of the damage distribution, for several earthquakes, shows systematically the existence of site effects. In order to understand the initial cause of these effects, three different zones were selected, with different geological and geomorphological characteristics, in the Povoação County, to perform a microtremor survey. Seismic data were recorded on a grid of 50 m in the three regions, using a 3-component Lennartz 1 Hz seismometer, with a sampling rate of 8 ms. The stations were deployed for 5 minutes or more to record microtremor imposed on the topmost layers by natural and anthropogenic sources. The data were processed using two different subroutine packages, in order to estimate the H/V ratio, defined according to the Nakamura methodology. However, the two processing routines gave different results, which forced us to revise all the procedures and to identify the main factors that caused it. Three portable seismic stations were installed in three fixed points, for about three months, aiming to record some earthquakes. Several small magnitude earthquakes (m < 3.0) were recorded and these data were processed in the same way as the noise data, obtaining reference H/V ratios. The interpretation of the dominant frequencies, for noise and small magnitude earthquakes, was performed taking into consideration not only the geological characteristics, but also the structural geomorphology.
III Papers Kristek, K., P. Moczo, and R. Archuleta, 2002. Efficient methods to simulate planar free surface in the 3D 4th –
order staggered-grid finite-difference schemes. Stud.. geophys. geod., 46, 2002, 355-381. Fäh, D., F. Kind and D. Giardini, 2002. Inversion of local S-wave velocity structures from average H/V ratios,
and their use for the estimation of site effects. submitted to Journal of Seismology, January 2002.
IV Deliverables
D01.02 “Controlled instrumental specifications”: a report of 34 pages + 5 appendices. The complete report will be available on a CD ROM. At this moment, it is on the anonymous ftp site of the University of Bergen at the following address: ftp://ftp.ifjf.uib.no/pub/sesame/REPORT/FINALREPORT
D02.09 “FD code to generate noise synthetics”: in the form of a CD ROM with a report describing the
flow chart of the software and canonical structural models.
D03.01 “First year progress report”: the following report with the cost statements.
V Other
Copy of the decree signed by the CNR President (Partner AC10.9 – CNR-CSGAQ/IDPA)