session 2 archanun how aec promote intra_asean trade evidence from thailand
TRANSCRIPT

How AEC promote Intra-ASEAN Trade: Evidence from Thailand
by
Archanun Kohpaiboon Faculty of Economics, Thammasat University
Bangkok, Thailand [email protected]
and Juthathip Jongwanich
Faculty of Economics, Thammasat University Bangkok, Thailand
Abstract: To gain better understanding of prospects and challenges of AEC, the paper examines whether and how exporters actually respond to tariff preferential schemes of AEC. The core analysis in this paper is an analysis of FTA administrative records of Thailand over the decade ending in 2015. Firms applying AEC preferential schemes were for market access into the original ASEAN members. Products exported under the FTA preferential schemes are highly concentrated, dominated by 4 sectors, i.e. Automotive (both vehicles and auto parts), electrical appliances, petrochemical products, and processed foods. Among ASEAN members, Indonesia had the highest utilization rate, followed by the Philippines and Vietnam. By contrast, Malaysia, another major trading partners of Thailand within ASEAN, recorded rather low utilization rate, i.e. about one-fourth of total export. The high cost of compiling with ROO would explain the low utilization rate to a certain extent. There are also cumbersome in government procedures. The key policy inference is that ROO and their related administrative procedures would be an area where policy makers should pay attention. Key words: Free Trade Agreement, Rules of Origin, Thailand, Unbalanced Panel Data
Econometric Analysis JEL: F15, F53, O19, O53 Paper prepared for Trade and Foreign Investment of ASEAN Symposium held on December 2, 2016 organized by National Taiwan University (NTU) Taipei, Taiwan.

1. Issues The proliferation of free trade agreements (FTAs) is one of the most notable phenomena in the
world economy since the new millennium (Baldwin and Jaimovich, 2012). A number of FTAs
notified to the World Trade Organization (WTO) rapidly increased from around 124 in 1994 to
625 by February 2016, nearly 70 per cent of which are currently in force.1 Such proliferation is
sweeping the world trade system and become a crucial factor for firms to take into consideration
in governing their operation around the world as well as conducting cross-border trade.
Whether and how exporters actually respond to FTA preferential schemes remain an
opened empirical question with immense policy implication. This is due to the fact that it is not
all exports eligible for such preferential schemes. Products must compile with the rules of origins
(ROOs), the rules to prove the origin of good for the purpose of determining eligibility for tariff
concessions. In addition, there is burden induced by administrative procedures in receiving the
preferential to a certain extent. All in all, actual impact on export is not as straightforward as we
usually expect from multilateral and/or unilateral liberalization.
There are sparse empirical studies examining determinants of preferential schemes
utilization2 due to the fact that administrative records of FTA implementation at the product level
are available for few countries including Thailand and Malaysia (Ing et al 2014). Interestingly,
there is increasing concern that ROO in practice has been used as a vital commercial policy
instruments and eventually deter firms to use FTA preferential schemes.3
This is immense policy relevant for ASEAN members as they strengthened their existing
economic integration through ASEAN Economic Community initiative. This aims to place the
region as the center of global production network. Interestingly, ASEAN members as a group
become an important jigsaw for two competing mega FTAs, namely Trans-pacific partnership
(TPP) and Regional Comprehensive Economic Partnership (RCEP). In the former, Brunei,
Malaysia, Singapore and Vietnam are membership (out of 12) but many including Indonesia, the
1 Further details are available at
https://www.wto.org/english/tratop_e/region_e/region_e.htm 2 Most of them were drawn on Generalized System of Preferences (GSP) schemes offered
by developed countries to developing ones (e.g. Keck and Lendle, 2012; Cadot and Ing, 2015). 3 There are a number of studies arguing that ROO have been used as vital commercial policy instruments to mould ROOs to the benefit of especial interest groups (Vermulst & Waer 1990, Krueger 1999, Bhagwati et al. 1999, Falvey & Reed 2002, Estevadeordal & Suominen 2004, James 2005, and Krishna 2005).

Philippines, and Thailand have expressed their interest for possible membership. The latter could
be regarded the successor of ASEAN plus 6 economic cooperation with more ambituous targets.
Both of them set their ambiguous target to be the global production bases. The difference is that
China is absent in TPP and the US are not included in RCEP. This makes ASEAN members to be
highlighted.
Against this backdrop, we undertake an analysis how AEC is used to promote export, using
evidence of Thailand. Thailand is chosen because of the obvious reason, the availability of data
on FTA adminstrative records for over the decade (2006-15).
The organization of this paper is as follows: Section 2 discusses brief history of economic
integration effort within ASEAN members. In Section 3, we analyze trade pattern among ASEAN
members with a particular interest on Thai export to ASEAN, followed by the extent to which
AEC is used for export is analyzed (Section 4). In the final section, conclusions and challenges of
AEC are discussed.
2. Brief History of ASEAN Economic Community (AEC)
ASEAN was originally founded in 1967 by five economies, Indonesia, Malaysia, the
Philippines, Singapore, and Thailand. Brunei joined in 1984, and four relatively poor economies
(often referred to as CLMV economies: Cambodia, Laos, Myanmar, and Vietnam) joined in 1995-
1999. In 1967, ASEAN economies were relatively small and poor, but most of them grew rapidly
in the subsequent 25 years.
Regard to formal/government-induced economic integration, ASEAN made relatively little
progress toward formal economic integration. There was a preferential trade agreement (PTA)
under ASEAN framework, namely ASEAN PTA. While it covered more than 10,000 product
lines but only 350 product lines was actually applied. 19 per cent of total value of these 350
product lines was benefited from preferential schemes in ASEAN PTA (Pangestu et al. 1992). The
popular example of eligible products was snowplows trade among ASEAN members located in
tropical areas, reflecting seriousness of ASEAN members had toward ASEAN PTA.
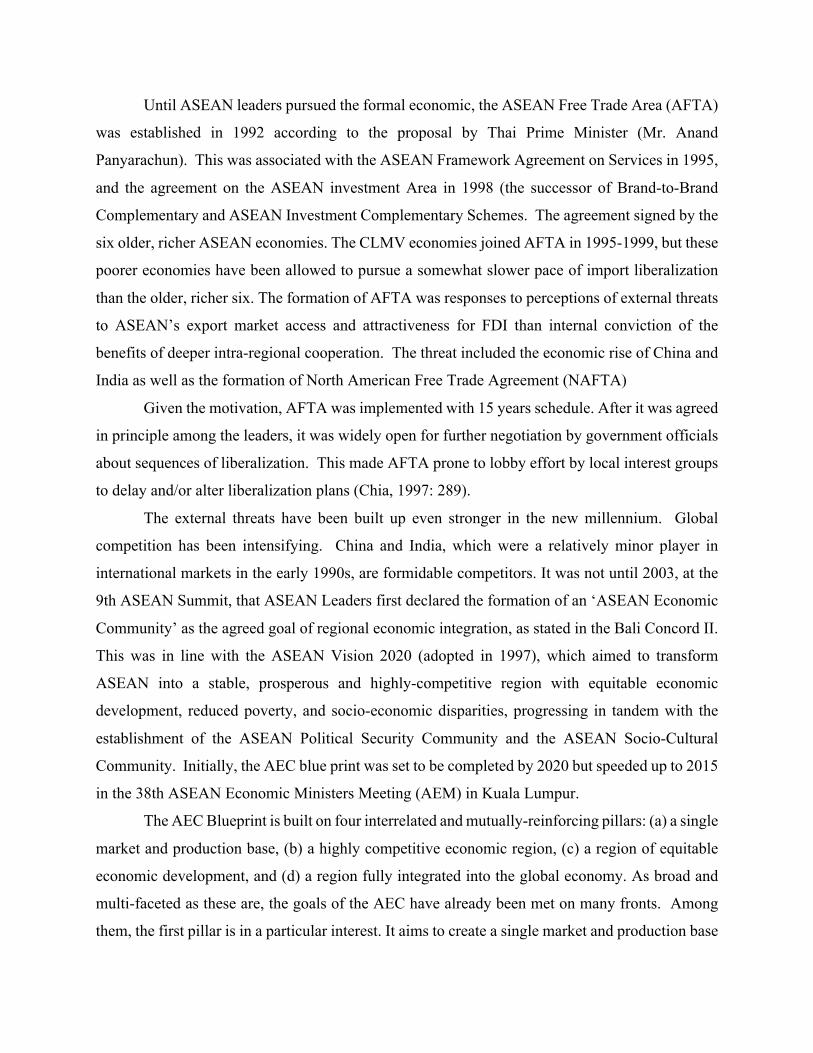
Until ASEAN leaders pursued the formal economic, the ASEAN Free Trade Area (AFTA)
was established in 1992 according to the proposal by Thai Prime Minister (Mr. Anand
Panyarachun). This was associated with the ASEAN Framework Agreement on Services in 1995,
and the agreement on the ASEAN investment Area in 1998 (the successor of Brand-to-Brand
Complementary and ASEAN Investment Complementary Schemes. The agreement signed by the
six older, richer ASEAN economies. The CLMV economies joined AFTA in 1995-1999, but these
poorer economies have been allowed to pursue a somewhat slower pace of import liberalization
than the older, richer six. The formation of AFTA was responses to perceptions of external threats
to ASEAN’s export market access and attractiveness for FDI than internal conviction of the
benefits of deeper intra-regional cooperation. The threat included the economic rise of China and
India as well as the formation of North American Free Trade Agreement (NAFTA)
Given the motivation, AFTA was implemented with 15 years schedule. After it was agreed
in principle among the leaders, it was widely open for further negotiation by government officials
about sequences of liberalization. This made AFTA prone to lobby effort by local interest groups
to delay and/or alter liberalization plans (Chia, 1997: 289).
The external threats have been built up even stronger in the new millennium. Global
competition has been intensifying. China and India, which were a relatively minor player in
international markets in the early 1990s, are formidable competitors. It was not until 2003, at the
9th ASEAN Summit, that ASEAN Leaders first declared the formation of an ‘ASEAN Economic
Community’ as the agreed goal of regional economic integration, as stated in the Bali Concord II.
This was in line with the ASEAN Vision 2020 (adopted in 1997), which aimed to transform
ASEAN into a stable, prosperous and highly-competitive region with equitable economic
development, reduced poverty, and socio-economic disparities, progressing in tandem with the
establishment of the ASEAN Political Security Community and the ASEAN Socio-Cultural
Community. Initially, the AEC blue print was set to be completed by 2020 but speeded up to 2015
in the 38th ASEAN Economic Ministers Meeting (AEM) in Kuala Lumpur.
The AEC Blueprint is built on four interrelated and mutually-reinforcing pillars: (a) a single
market and production base, (b) a highly competitive economic region, (c) a region of equitable
economic development, and (d) a region fully integrated into the global economy. As broad and
multi-faceted as these are, the goals of the AEC have already been met on many fronts. Among
them, the first pillar is in a particular interest. It aims to create a single market and production base

through free flow of goods, services, investment, skilled labour and freer flow of capital (especially
direct investment ones). Cumulatively, these aim for a more liberalized market that provides its
population with greater opportunities to trade and do business within the region, with reduced trade
costs and improved investment regimes that make ASEAN a more attractive investment
destination for both international and domestic investors.
By 2015, ASEAN leaders have repeatedly conveyed their political will and commitment
to building an ASEAN Economic Community (AEC). They signed the ASEAN Charter in 2007,
which puts in place the institutions and mechanism to build up an ASEAN Community. The AEC
blueprint acted as an implementation roadmap to make ASEAN members to be a single market
and production base, a competitive economic region with equitable development and a region that
is engaged with the global economy. Figure 1 summary milestones of government-induced
economic integration in ASEAN.
3. ASEAN Intra-regional Trade: Trends and Patterns.
Dollar value of intra-ASEAN trade (export plus import) tripled between 2002 and 2014,
from 132 billion $ in 2002 to 590 billion $ in 2014 (Figure 2). Its share to the world trade, however,
exhibited a slightly decreasing trend. Its share in 2002 was 24.2 per cent and increased to 25.6 per
cent in 2005. And then the share continuously declined to 23.7 per cent in 2014. The declining
trend would be a reflection of the relative importance of global production sharing within the
region. When world trade performed well between 2002 and 2005, it promoted intra-ASEAN
trade through the network trade and vice versa.
Intra-ASEAN trade was dominated by three economies, Singapore, Malaysia and Thailand.
By 2014, they accounted for 34.4, 20.2 and 17.4 per cent, respectively. Between 2010 and 2014,
while these three economies remained at the top, ASEAN became the increasing importance of
trading partners of Thailand and Malaysia (Table 1).
The relative importance of intra-ASEAN trade noticeably varied across member countries.
Table 2 presents the share of intra-ASEAN trade to world trade between 2002 and 2014. Note that
data used in Table 2 are based on Harmonized System 2002 version. In some countries, HS 2002
version was gradually adopted over periods so that there were some missing data. Analysis on the
early years of HS 2002 version must be done with care. Interestingly, there are two countries,
Thailand and Malaysia, experiencing the share of intra-ASEAN trade. In Thailand, the share

increased from 19.1 per cent in 2002 to 22.6 per cent in 2014. Malaysia’s share was 26.9 per cent
in 2014, from 24.7 per cent in 2002.
Interestingly, when focusing intra-ASEAN exports suggests that ASEAN become
increasing important export destination of ASEAN members (Figure 3). Figure 3.1 presents total
trade (export plus import) and export value from 2002 to 2014 so the difference indicates import
value. What revealed in Figure 3.1 is that export and import are par important to intra-ASEAN
trade in terms of value. As illustrated in Figure 3.2, the share of intra-ASEAN export was above
that of intra-ASEAN total trade from 2002 to 2014. Another interesting pattern in Figure 3.2 is
that the observed declining importance of intra-ASEAN export share was from 2003 to 2009.
From then on, it was stable, moving in a narrow range between 25 and 26 per cent. This was
different from the intra-ASEAN trade, implying the declining importance of ASEAN as import
source.
Table 3 provide insights on export composition of Thailand in each region in three periods,
2006, 2012 and 2014. The key export items accouting for nearly 70 per cent of total export were
listed, including foods (frozen and processed seafoods), plastic products, rubber products,
garments, electrical appliances, electronics, and automotives (vehicles and auto parts). What
revealed in Table 3 is the product composition in each region started diversifying from each other
between 2006 and 2014. Some products like foods and garments were still important in the
traditional export destinations like the US and Europe both of which Thailand has not signed any
FTAs with. The others and automotives in particular relied more on regional markets like ASEAN
and RCEP where Australia and New Zealand are included. It is these markets where FTAs have
been in effect for certain years. Such diversification would highlight the role of FTAs in promoting
export. In particular, the relative importance of exports in each region was not much different by
2006. Product diversification was observed since then, largely found in the automotive sector. It
takes place in few product categories, plastic auto parts (partly captured in HS 39), rubber auto
parts (partly in HS 40), and vehicles and auto parts(combined in HS 87).
4. Analysis of Administrative FTA Records This section’s analysis is based on official records of preferential export administered in
Thailand by the Bureau of Preferential Trade (BPT), Department of Foreign Trade, Ministry of
Commerce. This is due to the fact that all exporters who want to apply for a FTA preferential
tariff must fill in a form in order to provide necessary information related to product originality.
If products comply with FTA ROO, official records of certificate of origin (c/o) will be issued.
Our analysis focuses the period from 2006 to 2015. The 2006 is chosen as it was the year where
original ASEAN economies offered substantial tariff cuts to other members.
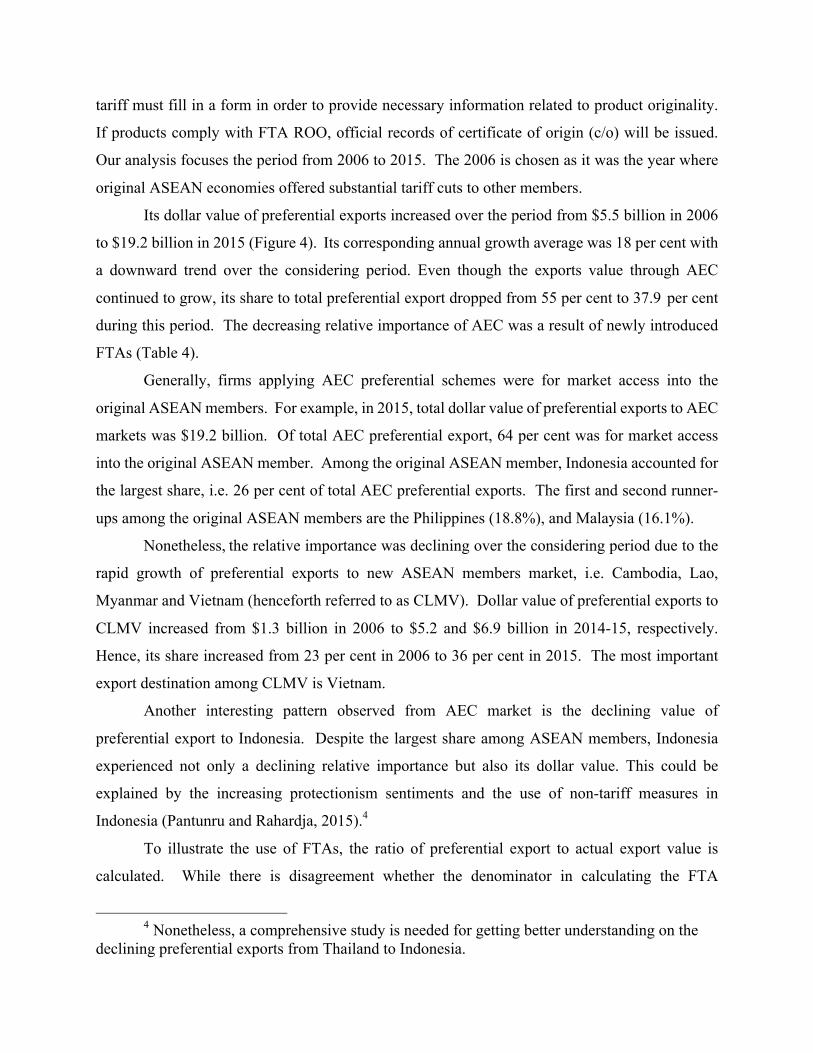
Its dollar value of preferential exports increased over the period from $5.5 billion in 2006
to $19.2 billion in 2015 (Figure 4). Its corresponding annual growth average was 18 per cent with
a downward trend over the considering period. Even though the exports value through AEC
continued to grow, its share to total preferential export dropped from 55 per cent to 37.9 per cent
during this period. The decreasing relative importance of AEC was a result of newly introduced
FTAs (Table 4).
Generally, firms applying AEC preferential schemes were for market access into the
original ASEAN members. For example, in 2015, total dollar value of preferential exports to AEC
markets was $19.2 billion. Of total AEC preferential export, 64 per cent was for market access
into the original ASEAN member. Among the original ASEAN member, Indonesia accounted for
the largest share, i.e. 26 per cent of total AEC preferential exports. The first and second runner-
ups among the original ASEAN members are the Philippines (18.8%), and Malaysia (16.1%).
Nonetheless, the relative importance was declining over the considering period due to the
rapid growth of preferential exports to new ASEAN members market, i.e. Cambodia, Lao,
Myanmar and Vietnam (henceforth referred to as CLMV). Dollar value of preferential exports to
CLMV increased from $1.3 billion in 2006 to $5.2 and $6.9 billion in 2014-15, respectively.
Hence, its share increased from 23 per cent in 2006 to 36 per cent in 2015. The most important
export destination among CLMV is Vietnam.
Another interesting pattern observed from AEC market is the declining value of
preferential export to Indonesia. Despite the largest share among ASEAN members, Indonesia
experienced not only a declining relative importance but also its dollar value. This could be
explained by the increasing protectionism sentiments and the use of non-tariff measures in
Indonesia (Pantunru and Rahardja, 2015).4
To illustrate the use of FTAs, the ratio of preferential export to actual export value is
calculated. While there is disagreement whether the denominator in calculating the FTA
4 Nonetheless, a comprehensive study is needed for getting better understanding on the
declining preferential exports from Thailand to Indonesia.

utilization is total value or value of non-zero tariff items only.5 On the one hand, there is argument
that there are many items whose tariff is already zero. In these items, there is no incentive for
firms to use FTAs. Including them in the denominator would underestimate the FTA utilization.
Hence, it would be more appropriate to use non-zero-tariff items value in the denominator. On
the other hand, there are at least three reasons running against the use of non-zero tariff items as
the denominator. Firstly, in every FTA negotiation, potential trade highlighted in press is often
based on total trade, regardless how many products are tariff-free.6 Hence, to reveal the relative
importance of FTAs, total trade should be the benchmark. Secondly, negotiation in designing
ROOs is done in all HS items, regardless their existing most-favor-nation (MFN) tariff. If zero-
tariff items are not relevant for FTA uses, ROO negotiation should focus those of non-zero tariff
items only. This is not true in ROO negotiation. Finally, it remains unclear the appropriate
definition of non-zero-tariff items when there are other tariff exemption schemes in place. The
clear example is export processing zone where tariffs of inputs used for export can be exempted.
As the argument in favor of using only non-zero tariff items goes, such exempted items should be
excluded from the denominator. If so, it is very difficult to exclude them in practice as it is not
clear how much import values are subject to tariff exemption schemes. Therefore, in the following
discussion which focuses on the aggregate analysis, total actual export is used in the denominator
in calculating the utilization rate.
Table 6 presents the overall assessment how firms utilize FTA preferential schemes
between 2006 and 2015. Among ASEAN members, Indonesia had the highest utilization rate.
From 2006 to 2015, the utilization rate in a case of Indonesia was in a range between 50.9 and 67.9
per cent. The Philippines and Vietnam are the first and second runners-up in applying for AEC
preferential schemes. The average of their utilization rates during the period of 2006-2015 were
5 Plummer et al. (2010) distinguish the measures how much FTAs are used by firms into
three categories. They are utilization rate, utility rate and usage rate. Utilization rate is referred to the ratio of dutiable imports that use FTA preferences to total imports. When the denominator is changed to dutiable imports (MFN greater than zero), it is referred to utility rate. Usage rate is dutiable imports that use FTA preferences to dutiable imports with MFN tariff rate greater than FTA rate. Choosing one over the other among these three depends largely on the main purpose of the study.
6 See, for example, EU-Thailand FTA press release, usually referring to total trade between two partners worth of 32 billion EURO, available at http://europa.eu/rapid/press-release_MEMO-13-179_en.htm.

55.2 and 46.6 per cent, respectively. There is no clear pattern observed from these ASEAN top-3
in FTA utilization over the considering period. Malaysia, another major economy in ASEAN,
recorded rather low utilization rate at around 24.3 per cent between 2006 and 2015. As seen below,
the high cost of compiling with ROO would explain the low utilization rate to a certain extent.
The low utilization rate found in Singapore was not surprised given the fact that the country is
tariff-free. Hence, most of transaction would reflect the increasing important role of Singapore as
the location of many MNEs’ regional headquarter (Channel New Asia, 2016). For Cambodia,
Lao, and Mynamar, the utilization rate registered less than 10 per cent averaging between 2006
and 2015. This would be due to their gradual adjustment in tariff reduction.
Products exported under the FTA preferential schemes are highly concentrated, presented
in Table 5. In the Table, a number of product lines, applying for FTA preferential schemes for
three different years, i.e. 2006, 2012 and 2015 are discussed. Clearly, a number of products
applying for FTA preferential schemes vary vastly across ASEAN members. The number was
high in Indonesia, Malaysia, Philippines, and Vietnam where tariff cuts in the associated FTAs
were substantial, averaging out at around 1,000 product lines. These numbers were rather constant
over the considering periods.
To make inference on the extent to which FTA preferential schemes are beneficial to
exporters widely, the product number under FTA preferential schemes is calculated as a (per cent)
ratio of total products Thailand actually export to a given FTA partner. We find that the ratio was
around 40 per cent for major FTA partners. It was much lower for other partners at around 10 per
cent. The observed low ratio reflects the nature of highly concentrated product lines that benefit
from FTAs.
Analysis focusing on a number of products applying for the preferential schemes might
mislead the scope of products that benefits from the signed FTAs because in some products their
preferential export value might be negligible. Hence, we supplement it with the cumulative share
of preferential exports of top-10 products as revealed in last three columns of Table 5. The higher
the cumulative share, the narrower the product scope benefiting from the signed FTAs.
The main finding is that the cumulative share of top-10 products was high over the
considering period. FTA preferential schemes tend to benefit a rather narrow range of product
lines. These products are dominated by 4 sectors, i.e. Automotive (both vehicles and auto parts),
electrical appliances, petrochemical products, and processed foods, all of which share the

following characteristics. Firms in these sectors are generally large in size. These products exhibit
high level of local content. Interestingly, tariff margin in these product is substantial (Kohpaiboon
and Jongwanich, 2014).
As revealed in Kohpaiboon and Jongwanich (forthcoming), the established firms which
already exported are likely to apply for FTA concessions. This is indicated by the positive and
statistical significance of historical export performance in determining FTA utilization. If they
never export to FTA partner before, it is less likely for FTAs to entice them to alter their marketing
portfolio. Such a finding highlights the potential role of FTAs in facilitating instead of creating
trade. Products must be traded substantially before (i.e. in the pre- signing FTAs period) to ensure
that FTA export creation is considerable. To a certain extent, it would also imply the low
possibility trade diversion from FTAs would take place.
It is not necessarily that products traded under MNEs’ production networks are likely to be
applied for FTA preferential as opposed to the other. As long as there are adequate tariff margin
to cover costs incurred by ROO and economic fundamentals are supportive, these products can be
traded through the preferential scheme like FTAs. Arguably, final products of the product
networks like vehicles and electrical appliances are the good example to be traded under the
preferential scheme. It is more difficult for parts and components which are subject to relatively
low tariff as a success of the information and technology agreement (ITA) launched in the mid-
1990s. In addition, it would be less likely for parts and components to comply with any forms of
rules of origin imposed in a given FTA.
It seems that products foreign firms are intensively involved are more likely to apply for
FTA preferential schemes. This would reflect to the fact that multinationals in Thailand have to
deal various government agencies in Thailand to operate their affiliates. Dealing with few
additional agencies to obtain c/o would not incur much additional costs. This is especially true for
multinationals in the automotive industry whose final products, i.e. completely built-up (CBU)
vehicles, are the most important preferential exports from Thailand. These firms have long
experience in compiling with government regulations and local content requirements imposed
between 1975 and 2000. In particular, when local content requirement was in place (1975-2000),
all car assemblers in Thailand had to share cost structure breakdown with government agencies to
compile with local content requirement imposed on locally manufactured vehicles. This would
make these firms familiar and less reluctant to declare cost structure breakdown to obtain c/o. This

is opposite to indigenous and rather small firms which are sensitive to reveal any information
related to cost structure.
Another key finding in Kohpaiboon and Jongwanich (forthcoming) is that cost of
compiling ROO from FTA importing countries matters. Costs in terms of tariff equivalence in
complying ROO vary from country to country. The cost is highest in Vietnam at 12.6 per cent and
the lowest in 5.1 per cent in the Philippines result varies noticeably. While the cost in case of
Indonesia is slightly greater than 3 per cent, it might reflect self-selection in which products that
are less likely to be adversely affected by the growing protectionism sentiment are traded under
the preferential scheme with moderate costs incurred by presence of ROOs. In the meantime,
products under heavily protectionism sentiments are likely to experience high costs and eventually
firms less likely to apply for the preferential scheme.
As revealed in Kohpaiboon and Jongwanich (2014), there are four problems in using FTAs.
First, the main burden to firms applying the preferential tariff schemes is providing detailed
information of the production process as a compulsory to obtain certificate of origin. This can be
sensitive for firms in some industries, which treat such information part of their business secret
and, hence, are reluctant to share it. For some firms with long experienced sharing the production
process with government officials like car makers, it is regarded as usual business practice. For
some firms/ industries, details of the production process are highly sensitive for some businesses,
such as those trading in chemical compounds, as revealing input compositions could negatively
affect their competitive position. This would explain the highly product concentration found in
preferential trade patterns, as discussed above. This would also be a big obstacle for SMEs.
Although their production process is straightforward, sharing such information might be new to
them. To a certain extent, this would also be related to issues of income tax as some firms
underreport their true income to pay less corporate tax.
Second, the process of obtaining a reference number is rather cumbersome. A given
reference number is for a product (e.g. HS six digits) and applicable for only a given FTA. For
firms with mature production technology and a stable input structure, there would be no problem
– applying in another FTA would be costless. This is applicable to products that have their own
niche market. But for those firms with production technologies that are subject to rapid change
and with an input structure that evolves over time, such a process could be costly. In addition, new
products require separate documents of good origin as proof. How to define new products is still

subject to discretion. For example, when there are changes in input structure, would it be regarded
as a new product? If so, firms must resubmit all required documents.
Third, firms would find it difficult to identify the HS code at a very disaggregate level, e.g.
HS 6 digits. This can be a more serious problem for firms with limited experience of international
trade and/or new products. Frequent changes in HS versions (from 2002 to 2007 and now 2012)
make the problems more severe.
Finally, there is no guarantee that the COO issued by the exporting country’s government
would be fully recognised by customs officials in the importing FTA counterparts. In other word,
preferential trade is prone to protectionism sentiments that are growing worldwide (IMF, 2016).
5. Conclusions and Policy Inferences
To gain better understanding of prospects and challenges of AEC, the paper examines whether and
how exporters actually respond to tariff preferential schemes of AEC. This is immense policy
relevant for ASEAN members as they as a group become an important jigsaw for two competing
mega FTAs, namely Trans-pacific partnership (TPP) and Regional Comprehensive Economic
Partnership (RCEP). The core analysis in this paper is an analysis of FTA administrative records
of Thailand over the decade ending in 2015.
While intra-ASEAN trade increased between 2002 and 2014, its share to the world trade
exhibited a slightly decreasing trend, reflecting the relative important role of global production
sharing within the region. The decreasing trend was largely driven by import. Intra-ASEAN trade
was dominated by three economies, Singapore, Malaysia and Thailand. In particular, southeast
Asian region becomes an important export destination for Malaysia and Thailand.
Generally, firms applying AEC preferential schemes were for market access into the
original ASEAN members. While CLMV are potential, it has not yet been realized. Another
interesting pattern observed from AEC market is the declining value of preferential export to
Indonesia. This could be explained by the increasing protectionism sentiments and the use of non-
tariff measures in Indonesia. Products exported under the FTA preferential schemes are highly
concentrated, dominated by 4 sectors, i.e. Automotive (both vehicles and auto parts), electrical
appliances, petrochemical products, and processed foods, all of which share the following
characteristics. Firms in these sectors are generally large in size. These products exhibit high level
of local content. Interestingly, tariff margin in these product is substantial. Among ASEAN

members, Indonesia had the highest utilization rate, followed by the Philippines and Vietnam. By
contrast, Malaysia, another major trading partners of Thailand within ASEAN, recorded rather low
utilization rate, i.e. about one-fourth of total export. The high cost of compiling with ROO would
explain the low utilization rate to a certain extent. There are also cumbersome in government
procedures. There was evidence that cost of compiling ROO from FTA importing countries was
substantial. Costs in terms of tariff equivalence in complying ROO vary from country to country.
The cost is highest in Vietnam but the lowest in the Philippines.
Three policy inferences could be drawn from this study. Firstly, what revealed in this paper
suggests that the effect in promoting intra-ASEAN trade by AEC occurs in a rather narrow product
range. This highlights the relatively importance role of economic fundamentals in each ASEAN
members to place the region as the center of global production network. Secondly, it is large and/or
multinational firms which are those likely to apply for the preferential schemes, This is largely due
to procurement cumbersome, over and above other key determinants e.g. linkages, tariff margin.
It can be mitigated by streamlining the processes, and establishing better communication channels.
This is an area where policy makers should pay attention to make use of the already signed FTA.
Thirdly, this raises caution in using actual trade as a proxy for preferential trade. The former is
grossly overestimated the latter. In fact, how FTAs are designed matters tremendously for its net
impact on trade amongst members.
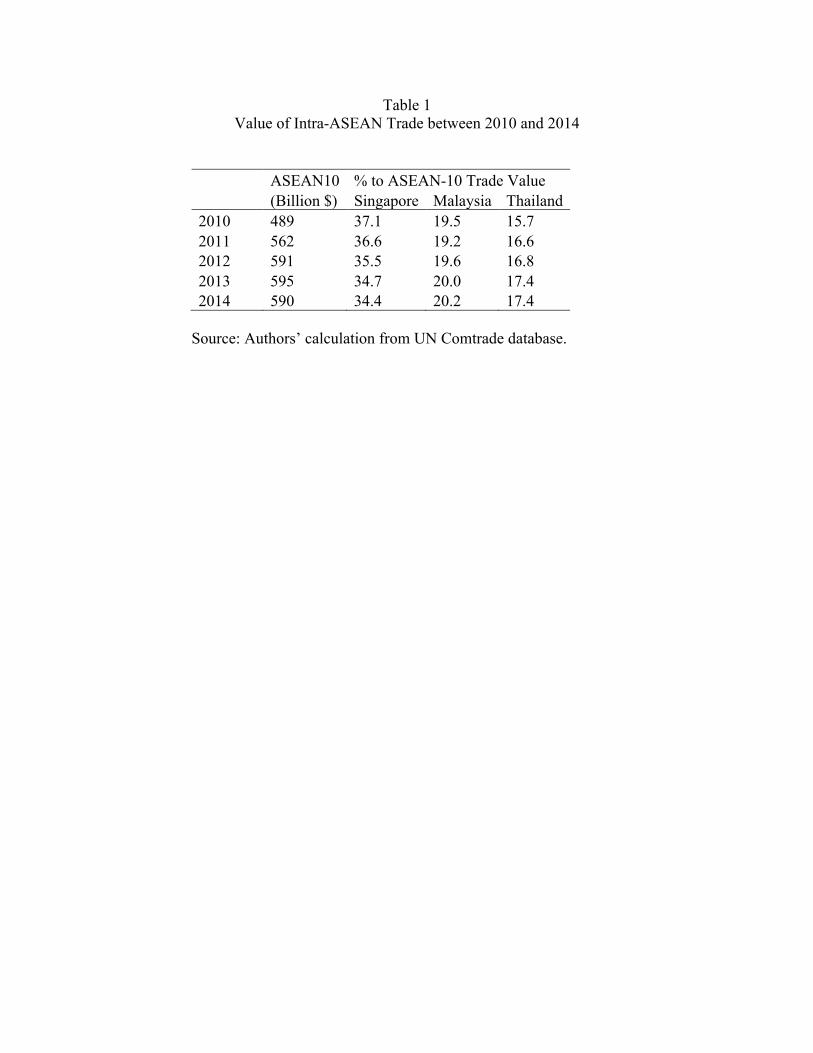
Table 1 Value of Intra-ASEAN Trade between 2010 and 2014
ASEAN10 % to ASEAN-10 Trade Value (Billion $) Singapore Malaysia Thailand 2010 489 37.1 19.5 15.7 2011 562 36.6 19.2 16.6 2012 591 35.5 19.6 16.8 2013 595 34.7 20.0 17.4 2014 590 34.4 20.2 17.4
Source: Authors’ calculation from UN Comtrade database.

Table 2 Percentage Share of Intra-ASEAN Trade to World
2002 2006 2012 2013 2014 ASEAN10 24.2 25.4 24.1 23.9 23.7 ASEAN-6 24.2 25.7 24.9 25.0 25.1 Brunei Darussalam n.a. n.a. 22.7 29.8 27.2 Cambodia n.a. 19.3 23.6 22.3 19.8 Indonesia n.a. n.a. 25.1 25.6 25.6 Malaysia 24.7 25.3 27.3 27.4 26.9 Myanmar n.a. n.a. n.a. n.a. n.a. Philippines n.a. n.a. 21.1 18.9 19.6 Singapore 26.7 28.6 26.6 26.4 26.2 Thailand 19.1 20.2 20.8 21.6 22.6 Viet Nam n.a. 22.4 16.8 15.1 14.1 Note: n.a., not available, is due to the delay in implementing HS 2002 version. Source: Authors’ calculation from UN Comtrade database.

Table 3 Product Composition of Thai Export Across Regions, 2006, 2012 and 2014
(% to total export to a given destination) 2006 RCEP ASEAN
plus 3 ASEAN10 EU 27 NAFTA World
Frozen seafood (HS 03) 1.4 1.4 0.4 1.6 3.7 1.7 Processed seafood (HS16) 1.9 1.8 0.3 4.7 6.0 3.1 Plastics products (HS 39) 5.2 5.1 5.1 2.4 3.0 5.0 Rubber products (HS 40) 8.1 8.7 6.1 5.7 6.0 6.7 Knitted wears (HS 61) 0.3 0.3 0.1 3.5 5.0 1.6 Woven wears (HS 62) 0.2 0.2 0.2 2.1 3.8 1.2 Electrical appliances (HS 84) 17.2 17.5 16.9 22.3 19.5 18.3 Electronics (HS 85) 17.4 18.4 14.8 17.7 20.7 17.8 Vehicles (HS87) 7.4 5.2 8.9 9.7 1.7 7.7 All products 100 100 100 100 100 100
(Cont.)

Table 3 (Cont.)
2012 RCEP ASEAN
plus 3 ASEAN10 EU 27 NAFTA World
Frozen seafood (HS 03) 1.2 0.5 1.1 1.2 0.4 1.8 Processed seafood (HS16) 2.0 0.3 2.2 2.2 0.3 6.9 Plastics products (HS 39) 6.2 5.5 6.7 6.5 5.0 2.6 Rubber products (HS 40) 8.6 5.5 8.9 9.6 4.9 7.0 Knitted wears (HS 61) 0.3 0.1 0.3 0.4 0.1 2.2 Woven wears (HS 62) 0.2 0.1 0.2 0.2 0.2 1.4 Electrical Appliances (HS 84) 16.1 14.7 15.0 15.0 13.8 21.6 Electronics (HS 85) 12.8 10.3 10.4 11.1 9.1 16.4 Vehicles (HS87) 7.2 13.7 10.5 8.1 12.8 6.5 All products 100 100 100 100 100 100
(Cont.)

Table 3 (Cont.) 2014 RCEP ASEAN
plus 3 ASEAN10 EU 27 NAFTA World
Frozen seafood (HS 03) 0.8 0.9 0.3 0.2 1.4 1.8 Processed seafood (HS16) 1.9 1.9 0.3 0.4 5.8 5.0 Plastics products (HS 39) 8.1 7.9 6.2 6.4 2.7 2.2 Rubber products (HS 40) 7.1 7.5 3.8 4.3 6.0 7.4 Knitted wears (HS 61) 0.4 0.4 0.1 0.1 1.8 2.8 Woven wears (HS 62) 0.2 0.2 0.1 0.1 1.1 1.2 Electrical appliances (HS 84) 13.7 13.4 13.7 15.4 24.4 24.7 Electronics (HS 85) 11.7 12.5 10.9 12.3 15.5 21.1 Vehicles (HS87) 10.8 7.9 12.2 14.2 8.4 4.6 All products 100 100 100 100 100 100
Source: Authors’ calculation from UN Comtrade database.

Table 4 Preferential Export from Thailand to ASEAN Members under AEC
(% of total preferential export) 2006 2007 2008 2009 2010 2011 2012 2013 2014 2015 AEC 55.0 53.4 48.0 42.9 41.2 38.3 35.6 37.4 36.2 37.9 Original AEC Member 42.0 40.5 37.2 30.5 31.3 29.5 28.0 29.2 26.2 24.3 Brunei 0.0 0.0 0.0 0.0 0.0 0.0 0.0 0.0 0.0 0.0 Indonesia 17.0 17.6 17.0 11.9 13.2 15.0 14.6 14.2 11.9 9.9 Malaysia 14.0 12.2 11.2 9.7 8.8 7.8 6.9 6.7 7.3 6.1 Philippines 10.0 8.8 7.2 7.5 7.9 5.5 5.7 7.7 6.5 7.1 Singapore 2.0 2.0 1.8 1.3 1.2 1.3 1.0 0.8 0.8 1.4 New Member 13.0 12.8 10.8 12.4 9.6 8.8 7.7 8.3 10.0 13.6 Cambodia 0.0 0.0 0.0 0.0 0.3 0.3 0.2 0.4 0.8 0.8 Laos 0.0 0.0 0.0 0.4 0.3 0.3 0.2 0.2 0.4 0.4 Myanmar 0.0 0.0 0.0 0.0 0.0 0.0 0.2 0.6 0.8 1.4 Viet Nam 12.0 12.2 10.3 11.9 9.1 8.0 6.7 7.1 8.2 11.3
Source: Kohpaiboon and Jongwanich (forthcoming)

Table 5 Analysis of Product Concentration under FTA Preferential Schemes.
Number of Product Lines Applying for FTA Preferential Schemes
Per cent to Number of Product Lines Actually Traded
Top-10 Cummulative Share (%)
2006 2012 2015 2006 2012 2015 2006 2012 2015 Brunei 90 165 160 10.8 17.9 16.6 77 73 64 Cambodia 25 186 356 1.4 8.2 14.3 88 77 70 Indonesia 840 1140 1330 40.2 43.4 50.8 56 53 49 Laos 90 256 303 3.7 9.4 10.1 81 71 59 Malaysia 1254 1288 1321 45.7 40.3 42.9 48 46 46 Myanmar 35 116 345 1.6 4.2 11.7 94 81 73 Philippines 841 991 1026 42.3 42.0 43.6 62 51 63 Singapore 404 470 492 14.2 13.9 15.3 62 64 74 Vietnam 1264 1356 1522 50.8 44.0 49.9 39 34 44
Note: * indicates figure of 2007. Source: Kohpaiboon and Jongwanich (forthcoming)

Table 6 Aggregate FTA Utilization Rate (% of Export Value from Thailand to FTA Partners)
2006 2007 2008 2009 2010 2011 2012 2013 2014 2015 2006-2015 AEC 20.5 24.0 27.1 29.8 31.8 28.1 26.3 32.9 31.8 35.4 29.5 Original AEC Member 20.4 23.8 28.2 29.9 33.6 30.4 29.7 37.7 35.4 38.1 31.4 Brunei 8.3 10.0 9.7 6.9 10.9 20.9 13.5 11.4 17.2 16.4 11.5 Indonesia 50.9 53.6 61.5 57.9 61.5 59.5 54.1 67.9 64.8 65.2 60.6 Malaysia 20.6 23.7 25.2 28.7 28.7 24.9 23.1 26.5 29.9 30.6 24.3 Philippines 38.1 43.4 46.9 56.1 55.9 46.6 48.6 78.6 58.6 61.8 55.2 Singapore 2.5 2.7 3.9 3.7 5.0 4.5 4.0 3.7 4.1 8.3 3.9 New Member 20.8 24.9 23.8 29.6 27.0 22.3 18.4 22.6 25.1 31.5 24.9 Cambodia 0.0 0.0 0.5 2.2 3.9 3.9 3.6 5.3 7.9 8.1 4.7 Laos 2.3 2.3 2.6 4.0 4.3 3.9 3.6 3.8 4.1 4.4 3.7 Myanmar 0.4 1.0 1.7 1.3 1.0 0.9 2.7 6.7 9.8 16.0 6.0 Viet Nam 40.1 46.6 46.6 57.3 53.8 45.7 42.1 51.2 54.0 64.9 46.6
Source: Kohpaiboon and Jongwanich (forthcoming)

22
Figure 1
AEC milestones
Source: ASEAN Secretariat (2015).

23
Figure 2
Importance of Intra-ASEAN trade
Source: Authors’ calculation from UN Comtrade database.
22.0
22.5
23.0
23.5
24.0
24.5
25.0
25.5
26.0
26.5
0
100
200
300
400
500
600
700
2002 2003 2004 2005 2006 2007 2008 2009 2010 2011 2012 2013 2014
Trade value (Billion$)
Share (% to total trade) RHS Axis

24
Figure 3 Analysis of Intra-ASEAN Export between 2002 and 2014
Figure 3.1: Export vs. Total Trade in terms of Value (Billion $)
Figure 3.2: Export vs. Total Trade in terms of share to total (% of total export and trade, respectively)
Source: Authors’ calculation from UN Comtrade database.
0.0
100.0
200.0
300.0
400.0
500.0
600.0
700.0
2002 2003 2004 2005 2006 2007 2008 2009 2010 2011 2012 2013 2014
Export Total trade
21.0
22.0
23.0
24.0
25.0
26.0
27.0
28.0
2002 2003 2004 2005 2006 2007 2008 2009 2010 2011 2012 2013 2014
Export Total trade

25
Figure 4
Preferential Export Value (Billion $) from Thailand between 2006 and 2015
Source: Kohpaiboon and Jongwanich (forthcoming)
0
5
10
15
20
25
2006 2007 2008 2009 2010 2011 2012 2013 2014 2015
AEC Original AEC Member Brunei
Indonesia Malaysia Philippines
Singapore New Member Cambodia
Laos Myanmar Viet Nam

26
References Ando, M. (2007), ‘Impacts of Japanese FTAs/EPAs: Post Evaluation from the Initial Data’,
RIETI Discussion Paper Series 07-E-041, Research Institute of Economy, Trade and Industry (REITI), Tokyo.
Athukorala, P. (2006), ‘Product Fragmentation and Trade Patterns in East Asia’, Asian Economic Papers, 4(3): 1-27.
Athukorala, P. and A. Kohpaiboon (2015), Athukorala, P. and N. Yamashita (2006), ‘Product Fragmentation and Trade Integration:
East Asia in a Global Context’, North American Journal of Economic and Finance, 17(3), 233-256.
Augier, P., M. Gasiorek and C. L. Tong (2005), The Impact of Rules of Origin on Trade Flows’, Economic Policy, 20(43): 567-624.
Baier, S. L. and J. H. Bergstrand (2007), ‘Do Free Trade Agreements Actually Increase members’ International Trade?’, Journal of International Economics, 71(1): 72-95.
Baldwin, R. and D. Jaimovich (2012), ‘Are Free Trade Agreements Contagious?’, Journal of International Economics, 88: 1-16.
Bayoumi, T. and B. Eichengreen (1995), ‘Is Regionalism Simply a Diversion? Evidence from the Evolution of the EC and EFTA’, NBER Working Paper, 5283, National Bureau of Economic Research, Cambridge..
Bhagwati, J., P. Krisna, and A. Panagariya (1999), Trading Blocs: Alternative Approaches to Analyzing Preferential Trade Agreements, MIT Press, Cambridge.
Cadet, O., J. de Melo, A. Estevadeordal, A. Suwa-Eisenmann, and B. Tumurchudur (2002), ‘Assessing the Effect of NAFTA’s Rules of Origin’, Research Unit Working Papers from Laboratoire d'Economie Appliquee, INRA
Cadet, O., and L. Ing (2015), ‘How Restrictive Are ASEAN’s Rules of Origin?’, in L. Ing (ed) East Asian Integration, Economic Research Institute for ASEAN and East Asia, Jakatra.
Chia, S.Y. (1997), ‘ASEAN: Free Trade Areas and Growth Triangles’, in T. Ito and A. Krueger (eds.), Regionalism versus Multilateral Trade Arrangements, University of Chicago Press, Chicago.
Channel New Asia (2016), ‘More Firms Setting Up Regional Headquarters in Singapore Even as Others Relocate’, available for downloading at http://www.channelnewsasia.com/news/singapore/more-firms-setting-up/2566738.html
Estevadeordal, A. and K. Suominen (2004), ‘Rules of Origin: A World Map and Trade Effects’, in A. Estevadeordal, O. Cadot, A. Suwa-Eisenmann, and D.C.T. Verdier (eds.), The Origin of Goods: Rules of Origin in Preferential Trade Agreements, Inter-American Development Bank.
Falvey, R. and G. Reed (2002), ‘Rules of Origin as Commercial Policy Instruments’, GLM Reserch Paper 2000/18, Centre for Research on Globalization and Labour Markets, University of Nottingham.
Fane, G. and P. Warr (2006), Distortions to Agricultural Incentives in Indonesia, Agricultural Distortions Research Project, World Bank.
Fliess, B.A. and P. Sauve (1997), ‘Of Chips, Floppy Disks, and Great Timing: Assessing the Information Technology Agreement’, Paper prepared for the Institut Francis des

27
Relations Internationales (IFRI) and the Tokyo Club Foundation for Global Studies.
Herin, Jan (1986), “Rules of Origin and Differences between Tariff Level in EFTA and in the EC”, EFTA Occasional Paper 13.
International Monetary Fund (IMF), (1993), Balance of Payments Manual 5th Edition, Washington, DC: IMF.
James, W. (2005), ‘Rules of Origin and Rules of Preference and the World Trade Organization: the Challenge to Global Trade Liberalization’, in P. Macrory, A. Applegate and M. Plummer (eds.), The World Trade Organization: Legal, Economics and Political Perspectives Vol.2, New York, Springer.
James, W. (2006), ‘Rules of Origin in Emerging Asia-Pacific Preferential Trade Agreements: Will PTAs Promote Trade and Development’, Asia-Pacific Research and Training Network on Trade Working Paper Series, No.19,
JETRO (2003), Current Status of AFTA and Corporate Responses, November, Tokyo, JETRO.
Jones, R. W. (2000), Globalization and the Theory of Input Trade, Cambridge, Mass.: MIT Press.
Jones, R. W. and Henryk Kierzkowski (2001), ‘Globalization and the Consequences of International Fragmentation’, in Rudigar Dornbusch and G. Calvo and M. Obstfeld (eds), Money, Factor Mobility and Trade: The Festschrift in Honor of Robert A. Mundell, Cambridge, Mass.: MIT Press, 365-381.
Jongwanich, J. and A. Kohpaiboon (2007), ‘Determinants of Protection in Thai Manufacturing’, Economic Papers, September 2007.
Kawai, M. and G. Wignaraja (2010), ‘Asian FTAs: Trends, Prospects, and Challenges’, ADB Economics Working Paper Series No. 226, Asian Development Bank, Manila.
Keck, A. and A. Lendle (2012), ‘New Evidence on Preference Utilization’, Staffs Working Paper, World Trade Organization (WTO), Economic Research and Statistics Division, Geneva.
Kohpaiboon, A. (2006a), Multinational Enterprises and Industrial Transformation: Evidence from Thailand, Cheltenham: Edward Elgar.
Kohpaiboon, A. (2006b), ‘Automotive Sector and FTA Opportunities’ in S. Tangkitvanich and others, Free Trade Agreements involved in Thailand: Impacts and Policy Formulation (in Thai).
Kohpaiboon, A. (forthcoming), ‘Does Export Creation from FTAs Exist?: Evidence from Thailand’, in M. Kaosa-ard and J. Dore (eds.), Flying with the Dragon, White Lotus Publishers, Bangkok.
Kohpaiboon, A. and E.D. Ramstetter (2008), ‘Producer Concentration, Conglomerates, Foreign Ownership, and Import Protection: Thai Manufacturing Firms a Decade after the Crisis’, ICSEAD Working Paper, March 2008, International Centre for the Study of East Asian Development, Kokura.
Koskinen, M. (1983), ‘Excess Documentation Costs as a Non-tariff Measure: an Empirical Analysis of the Import Effects of Documentation Costs’, Working Paper, Swedish School of Economics and Business Administration.
Krishna, K. (2005), ‘Understanding Rules of Origin’, NBER Working Paper No.11150, National Bureau of Economic Research, Cambridge.

28
Krueger, A. (1999), Are Preferential Trading Agreement Trade-liberalizing or protectionists?, Journal of Economics Perspectives, No.4., pp.105-125.
Krugman, P. (1993), ‘Regionalism versus Multilateralism: Analytical Notes’, in J. de Melo and A. Panagariya (eds.) New Dimensions in Regional Integration, Cambridge University Press, Cambridge.
Kumar, N. (2005), ‘Asian Economic Community: Toward Pan-Asian Economic Integration’, in M.B. Lamberte, Asian Economic Cooperation and Integration: Progress-Prospects-Challenges, , ADB, Manila.
Kumar, N. (2005), ‘Asian Economic Community: Toward Pan-Asian Economic Integration’, in M.B. Lamberte, Asian Economic Cooperation and Integration: Progress-Prospects-Challenges, Manila, ADB.
Lipsey, R.E. (2001), ‘Foreign Direct Investment and the Operations of Multinational Firms: Concepts, History and Data’, in H. James (ed.), Handbook of International Trade, Cambridge: Basil Blackwell.
Magee, C. (2003), ‘Endogenous Preferential Trade Agreements: An Empirical Analysis, Contribution to Economic Analysis and Policy, 2(1) Article 15.
Magee, C. (2008), ‘New Measures of Trade Creation and Trade Diversion’, Journal of International Economics, 75, p. 349-362
Patunru, A. and S. Rahardja (2015), ‘Trade Protectionism in Indonesia: Bad Times and Bad Policy’, Lowy Institute for International Policy available for downloading at http://www.lowyinstitute.org/files/patunru_and_rahardja_trade_protectionism_in_indonesia_0.pdf
Pangestu, M., H. Soesastro and M. Ahmad (1992), ‘A New Look at Intra-ASEAN Economic Cooperation’, ASEAN Economic Bulletin, 8(3) , 333-352.
Plummer, M.G. (2006), ‘ASEAN-EU Economic Relationship: Integration and Lessons for the ASEAN Economic Community’, Journal of Asian Economics, 17, p.427-447.
Shibata, H. (1967), ‘The Theory of Economic Unions: A Comparative Analysis of Customs Unions, Free Trade Areas, and Tax Unions’, in C.S. Shoup (ed.), Fiscal Harmonization in Common Markets, Columbia University Press, New York.
Soloaga, I. and Winters, L.A. (2001), ‘Regionalism in the nineties: What effect on trade?’, North American Journal of Economics and Finance, 12(1): 1-29.
Takahashi, K. and S. Urata (2010), ‘On the Use of FTAs by Japanese Firms: Further Evidence’, RIETI Discussion Paper Series 09-E-028, Research Institute of Economy, Trade and Industry (REITI), Tokyo.
The Economist (2014), ‘FTAs: Fantastic, Fine or Futile?: Business Views on Trade Agreements in Asia’, available from download at https://globalconnections.hsbc.com/downloads/ftas_fantastic_fine_or_futile.pdf
The Nation (2007) ‘Thai Constitution Could Complicate ASEAN-EU FTA Talks’, 27 November available at http://www.bilaterals.org/spip.php?page=print &id_article=10510 (download by 17 March 2010).
Tongzon, J.L. (2005), ‘ASEAN-China Free Trade Area: A Bane or Boon for ASEAN Countries?’, World Economy,28(2), p.191-210.
Vermulst, E. and P. Waer (1990), ‘European Community Rules of Origin as Commercial Policy Instruments’, Journal of World Trade, Vol. 24, No.3, p55-100.
Viner, J. (1950), The Custom Union Issue, Carnegie Endowment for International Peace, New York.

29
Urata, S. (2004), ‘The Emergence and Proliferation of Free Trade Agreements in East Asia’, Japanese Economy, 32(2, Summer): 5-52.
Wylie, P. (1995), Partial Equilibrium Estimates of Manufacturing Trade Creation and Diversion due to NAFTA’, North American Journal of Economics and Finance, 6: p.65-84.
Wignaraja, G., R. Olfindo, W. Pupphavesa, J. Panpiemras, and S.Ongkittikul (2010), ‘How Do FTAs Affect Exporting Firms in Thailand?’, ADBI Working Paper Series, Asian Development Bank Institute (ADBI), Tokyo.