session overview session overview presentation (20 mins.) examples (20 mins.) break (10 mins.)...
TRANSCRIPT
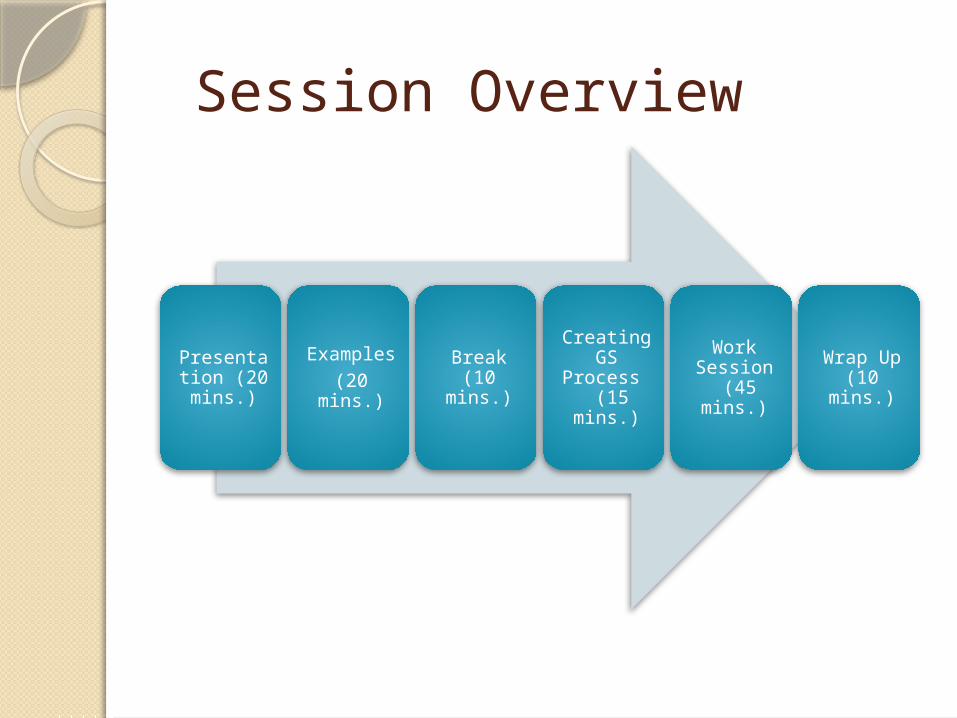
Session Overview
Presentation (20 mins.)
Examples(20 mins.)
Break(10 mins.)
Creating GS
Process (15 mins.)
Work Session
(45 mins.)
Wrap Up(10 mins.)
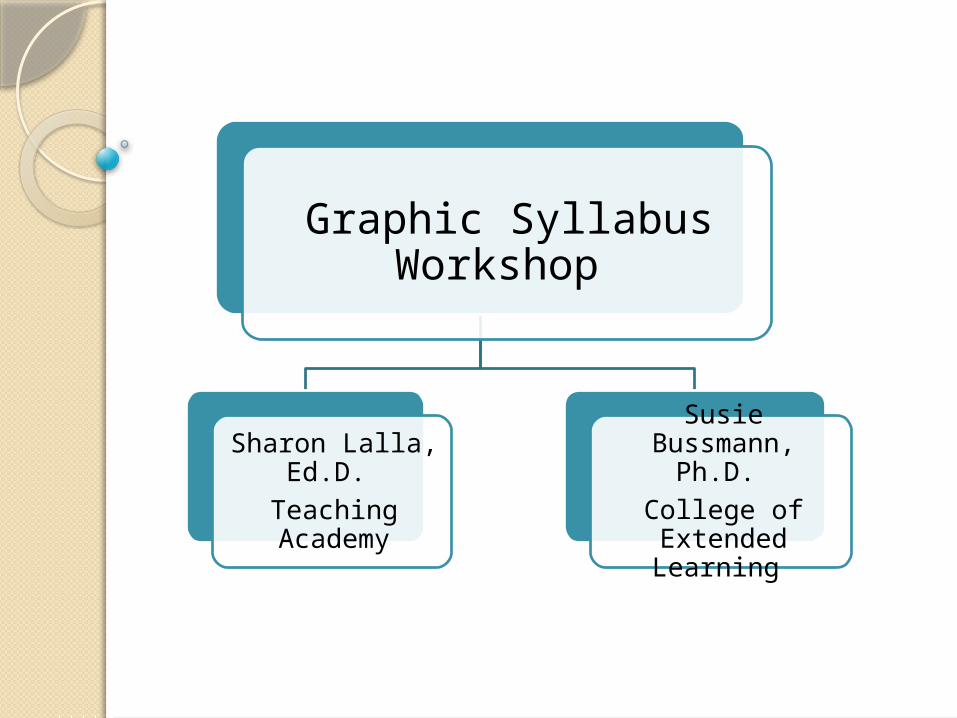
Graphic Syllabus Workshop
Susie Bussmann, Ph.D.
College of Extended Learning
Sharon Lalla, Ed.D.
Teaching Academy
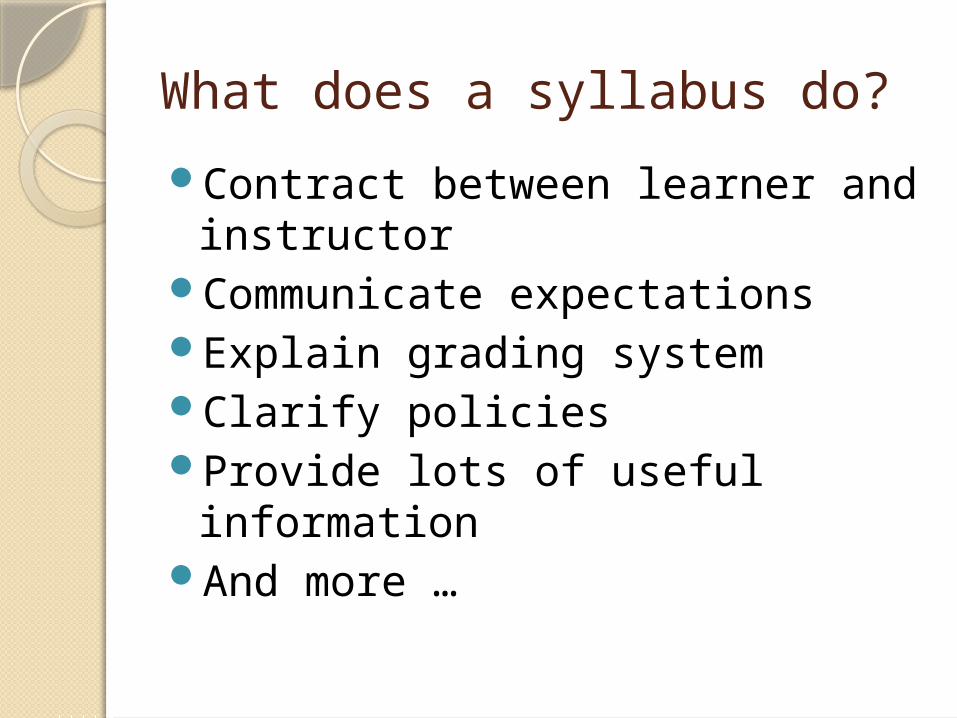
What does a syllabus do?Contract between learner and
instructorCommunicate expectationsExplain grading systemClarify policiesProvide lots of useful informationAnd more …
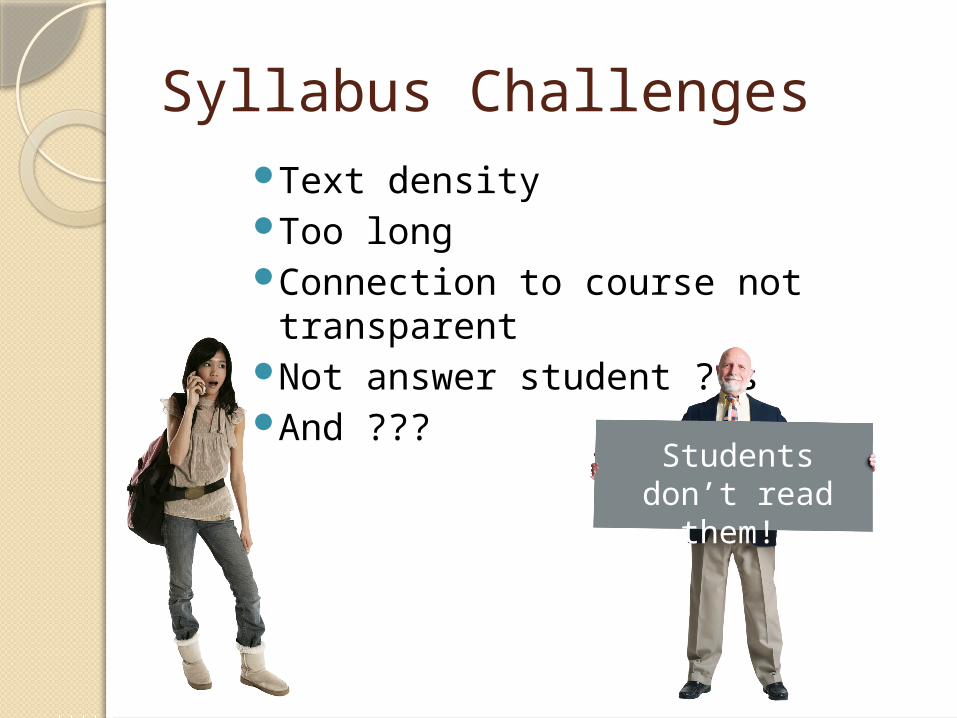
Syllabus Challenges Text densityToo longConnection to course not
transparentNot answer student ??sAnd ??? Students
don’t read them!
Graphic Syllabus (GS)A visual representation of the course
topics showing how they’re organized and connected.
SupplementPluses for students
& instructor Research basisQM Standard I
◦ Course Overview & Introduction◦1.2 Students are introduced to the purpose
and structure of the course.
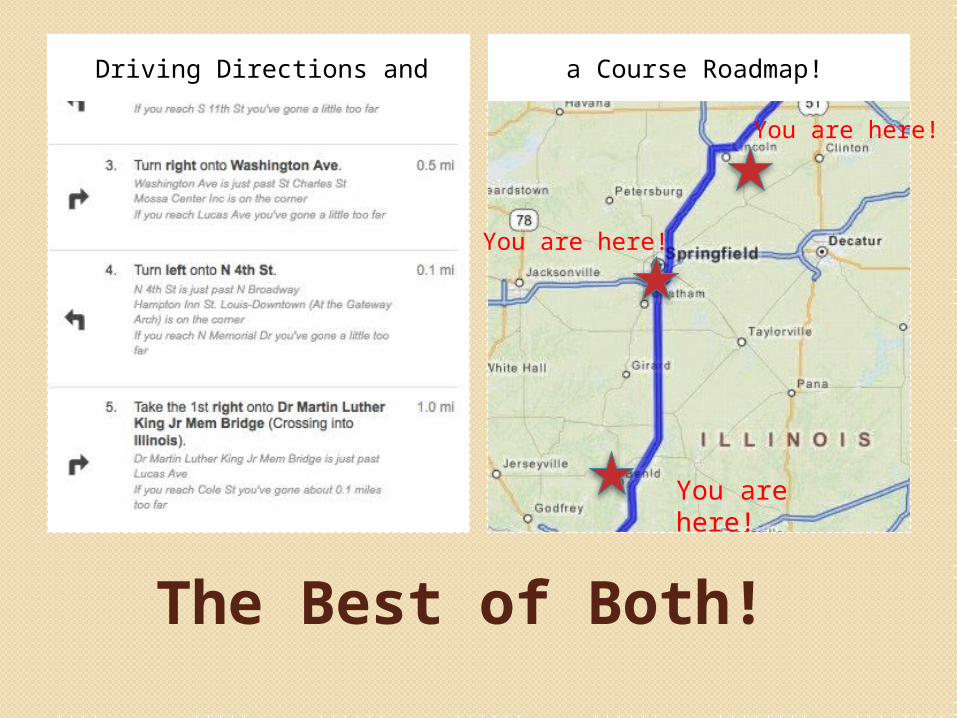
The Best of Both!
Driving Directions and a Course Roadmap!
You are here!
You are here!
You are here!
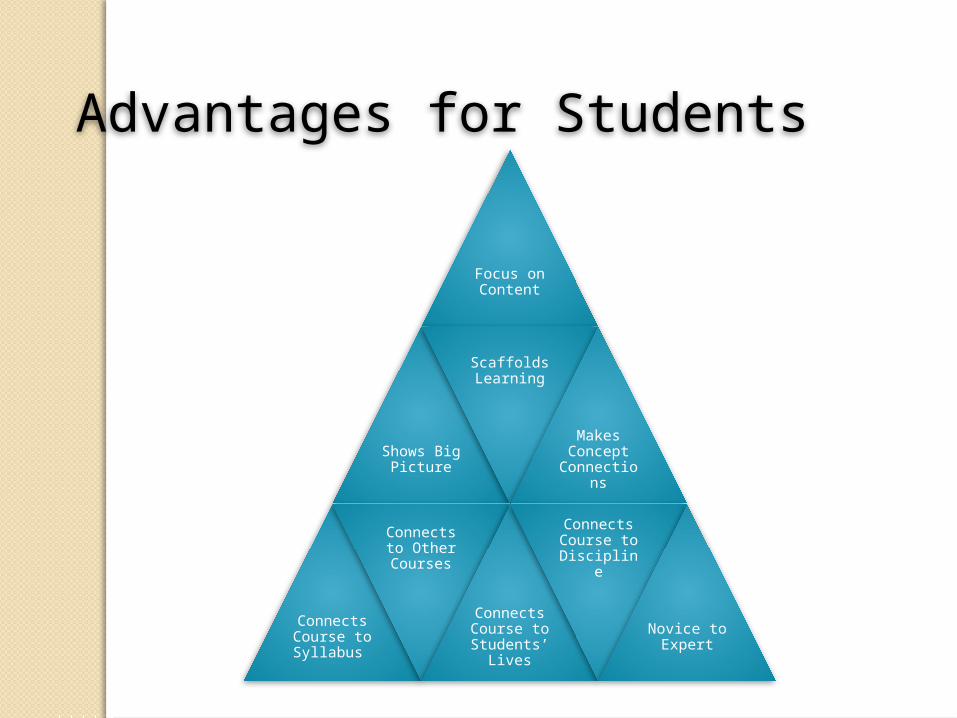
Focus on Content
Shows Big Picture
Scaffolds Learning
Makes Concept
Connections
Connects Course to Syllabus
Connects to Other Courses
Connects Course to Students’
Lives
Connects Course to Discipline
Novice to Expert
Advantages for Students

Sharing Your Understanding
Novice Expert
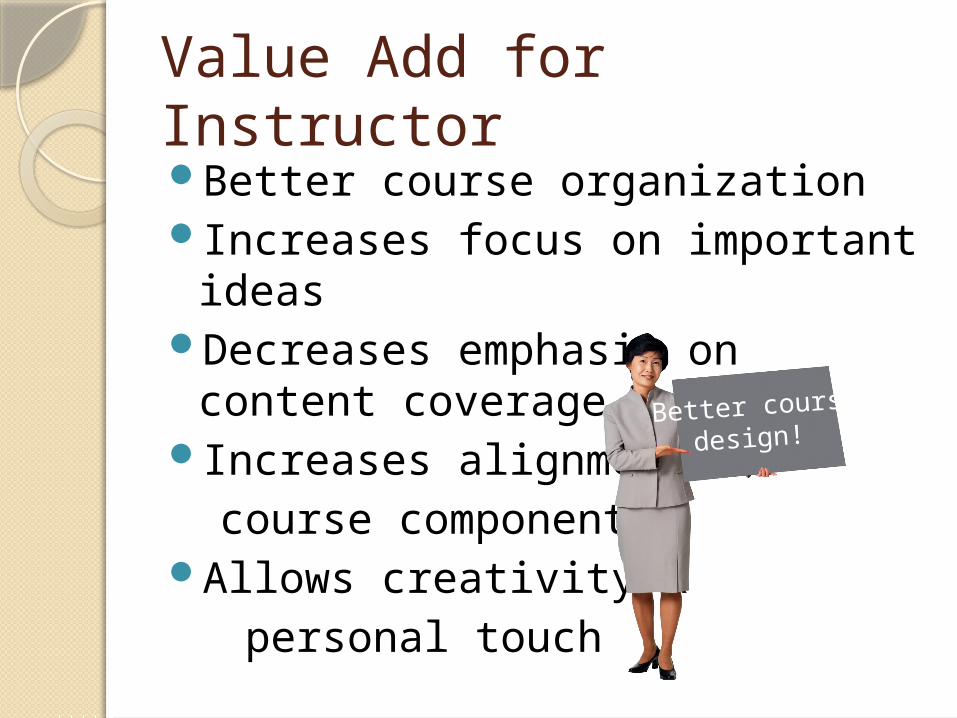
Value Add for Instructor Better course organizationIncreases focus on important
ideasDecreases emphasis on content
coverageIncreases alignment of course componentsAllows creativity & personal touch
Better course
design!
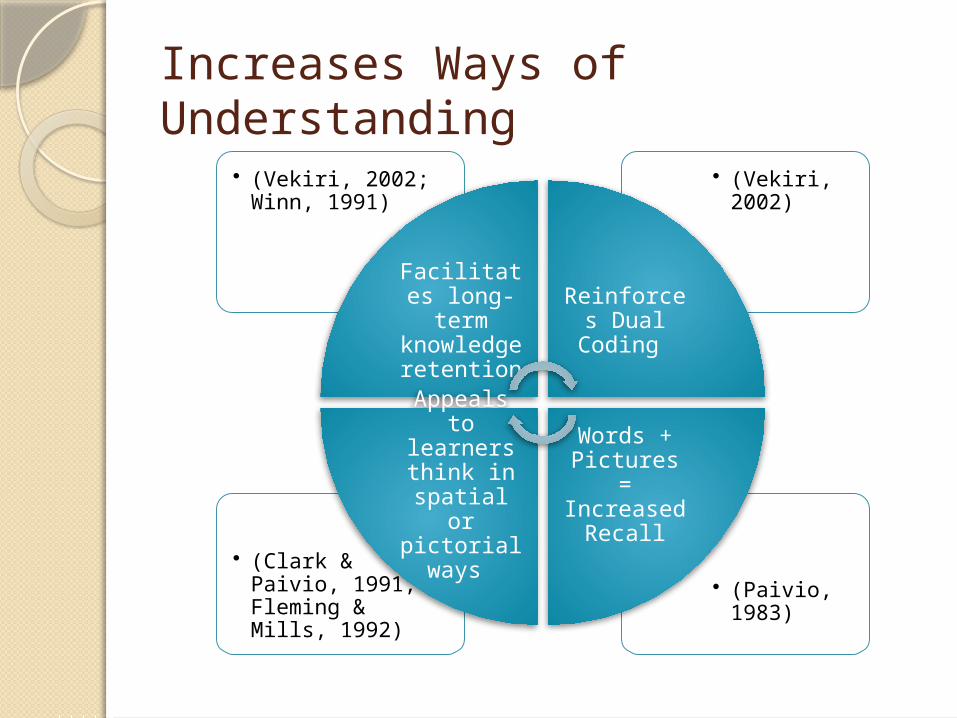
Increases Ways of Understanding
• (Paivio, 1983)
• (Clark & Paivio, 1991; Fleming & Mills, 1992)
• (Vekiri, 2002)
• (Vekiri, 2002; Winn, 1991)
Facilitates long-term knowledge retention
Reinforces Dual
Coding
Words + Pictures = Increased
Recall
Appeals to learners think in
spatial or pictorial ways
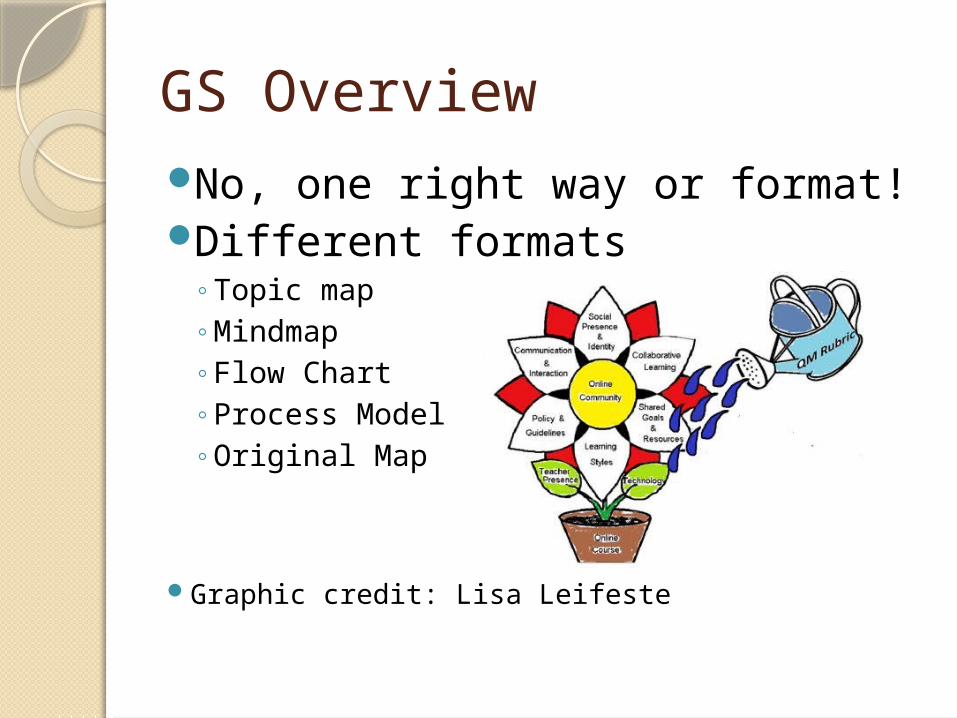
GS Overview No, one right way or format!Different formats
◦Topic map◦Mindmap◦Flow Chart◦Process Model ◦Original Map
Graphic credit: Lisa Leifeste
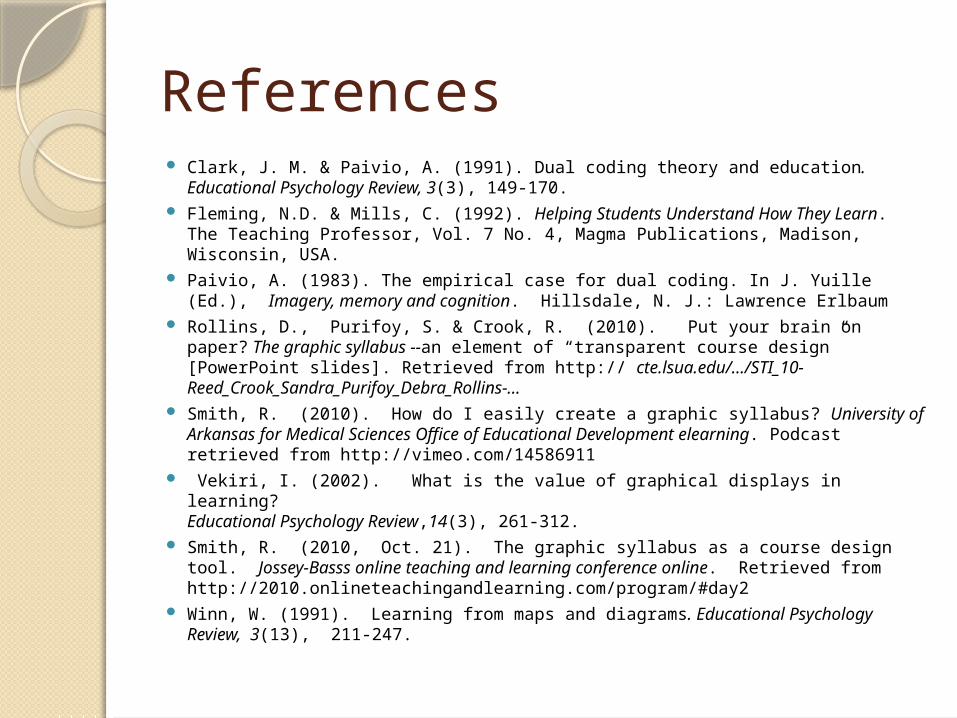
References Clark, J. M. & Paivio, A. (1991). Dual coding theory and education. Educational
Psychology Review, 3(3), 149-170. Fleming, N.D. & Mills, C. (1992). Helping Students Understand How They
Learn. The Teaching Professor, Vol. 7 No. 4, Magma Publications, Madison, Wisconsin, USA.
Paivio, A. (1983). The empirical case for dual coding. In J. Yuille (Ed.), Imagery, memory and cognition. Hillsdale, N. J.: Lawrence Erlbaum
Rollins, D., Purifoy, S. & Crook, R. (2010). Put your brain on paper? The graphic syllabus --an element of “transparent course design” [PowerPoint slides]. Retrieved from http:// cte.lsua.edu/.../STI_10-Reed_Crook_Sandra_Purifoy_Debra_Rollins-...
Smith, R. (2010). How do I easily create a graphic syllabus? University of Arkansas for Medical Sciences Office of Educational Development elearning. Podcast retrieved from http://vimeo.com/14586911
Vekiri, I. (2002). What is the value of graphical displays in learning?Educational Psychology Review,14(3), 261-312.
Smith, R. (2010, Oct. 21). The graphic syllabus as a course design tool. Jossey-Basss online teaching and learning conference online. Retrieved from http://2010.onlineteachingandlearning.com/program/#day2
Winn, W. (1991). Learning from maps and diagrams. Educational Psychology Review, 3(13), 211-247.
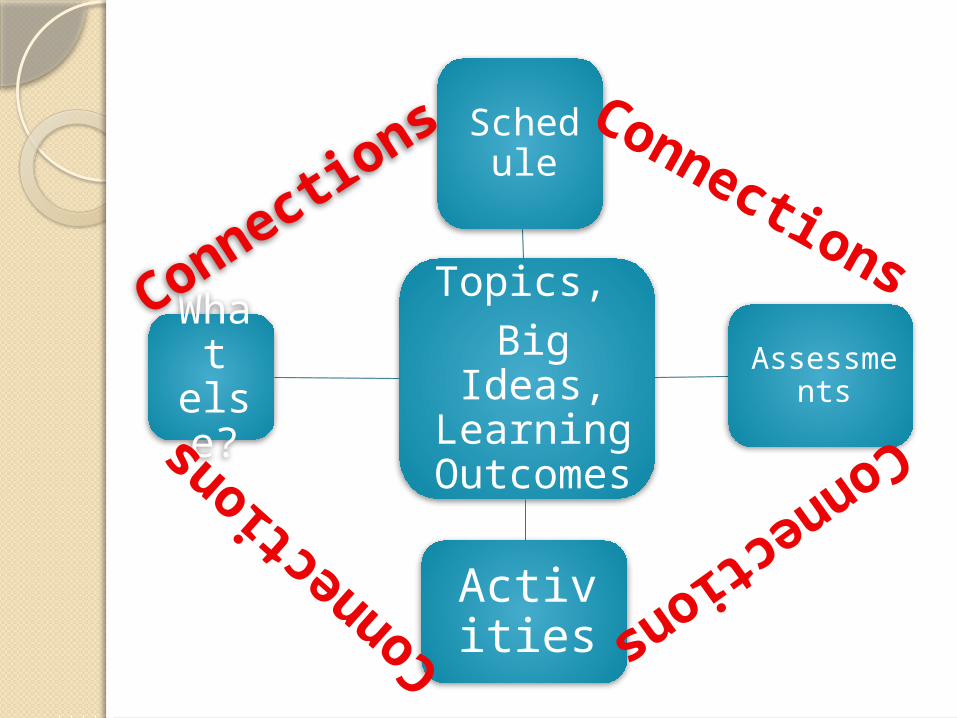
Topics, Big Ideas, Learning
Outcomes
Schedule
Assessments
Activities
What
else?
Connection
sConnection
s
Connections
Connec
tion
s
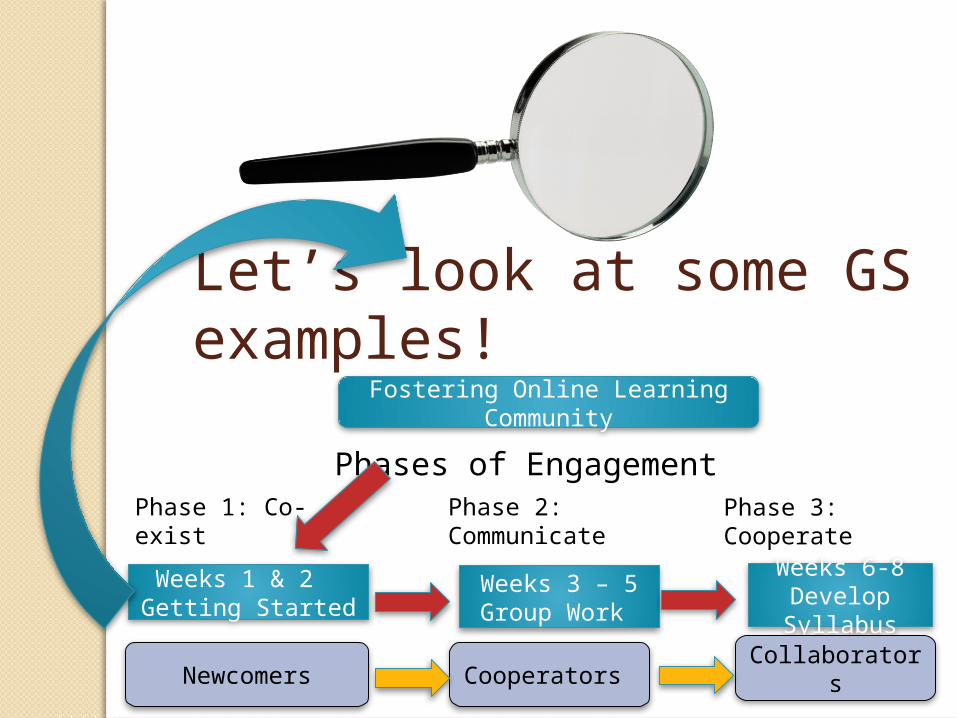
Let’s look at some GS examples!
Fostering Online Learning Community
Weeks 1 & 2 Getting Started
Weeks 3 – 5 Group Work
Weeks 6-8Develop Syllabus
Phases of Engagement Phase 1: Co-exist
Phase 2: Communicate
Phase 3: Cooperate
Newcomers Cooperators Collaborators