session # title of your presentation. ©if appropriate, insert your organization’s copyright...
TRANSCRIPT

Session #Title of Your Presentation

©If appropriate, Insert your organization’s copyright information
Know Your Bounds: Mapping Your Wireless Network Using Satellite
Imagery
Session # 6Tuesday, Sept. 10, 3:30-5:00PMTony Bautts - BerkeleyWireless.net
David Zendzian - DMZ Services

©If appropriate, Insert your organization’s copyright information
Key Points 802.11b – The Radio Station Wireless detection schemes Perceptions of overall range Current mapping methods Why should you care about
range? Description of new technique Demonstration

©If appropriate, Insert your organization’s copyright information
802.11b – A Primer
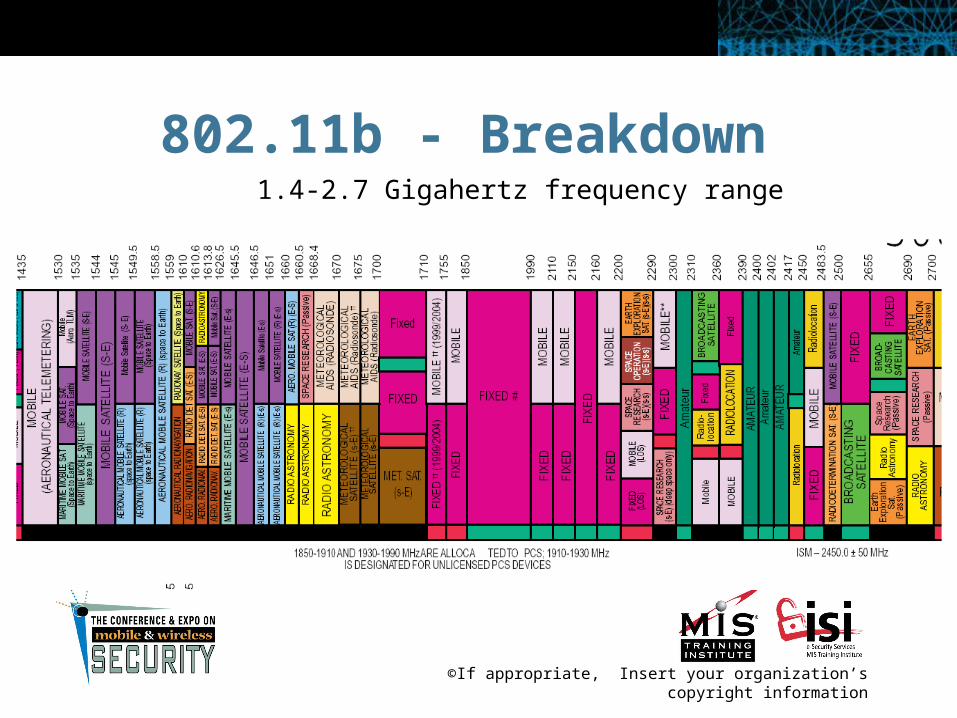
Runs on the 2.4Ghz frequency
Spread spectrum - history, frequency hopping
Signal travels through many materials
©If appropriate, Insert your organization’s copyright information
802.11b - Breakdown1.4-2.7 Gigahertz frequency range

©If appropriate, Insert your organization’s copyright information
802.11 – A Primer cont’d
Close to the AP its fast Can travel long distances Even at greater distance the
slower 1MB is still fast enough for most apps

©If appropriate, Insert your organization’s copyright information
802.11b – The Protocol
802.11b communication process
Associate / Disassociate requests
Netstumbler and other wireless scanners look for 802.11 management frames

©If appropriate, Insert your organization’s copyright information
Signal For All
Your wireless network signal is being broadcast for all to see
This is good for your employees and your investment, but bad for your security

©If appropriate, Insert your organization’s copyright information
The Signal Travels…
802.11b signal can travel much farther than manufacturer estimates
Intercepting signal from building to building is not uncommon
‘Yagi’ antennas make intercepting far away signals possible

©If appropriate, Insert your organization’s copyright information
Varied Results – Deployment Issues
Access points next to windows are much more accessible
Concrete, steel and water interfere with signal
Some glass can interrupt signal

©If appropriate, Insert your organization’s copyright information
Why Map?
Aerial visualization helps when troubleshooting wireless deployments
Graphical signal representations are useful to everyone, not just ‘techies’
Knowing where your signal is actually traveling gives security staff an edge

©If appropriate, Insert your organization’s copyright information
Current Mapping Methods
Current mapping methods center around “hotspots”
Hotspots are basically just points at which a signal was detected
Not very accurate since they don’t take into account signal strength
Inconsistent results since visibility can vary from day to day

©If appropriate, Insert your organization’s copyright information
Wireless Map by Peter Shipley

©If appropriate, Insert your organization’s copyright information
Signal Strength mapping
There are many different methods, some better than others
Basic strength mapping can be done with most client manager software, like Orinoco Client manager
More advanced mapping can be done with other tools like NetStumbler or AiroPeek

©If appropriate, Insert your organization’s copyright information
Client Manager Screenshot

©If appropriate, Insert your organization’s copyright information
Mapping with Client Managers
Rudimentary, but effective Doesn’t generally allow
saving of data Doesn’t generally support
GPS
©If appropriate, Insert your organization’s copyright information
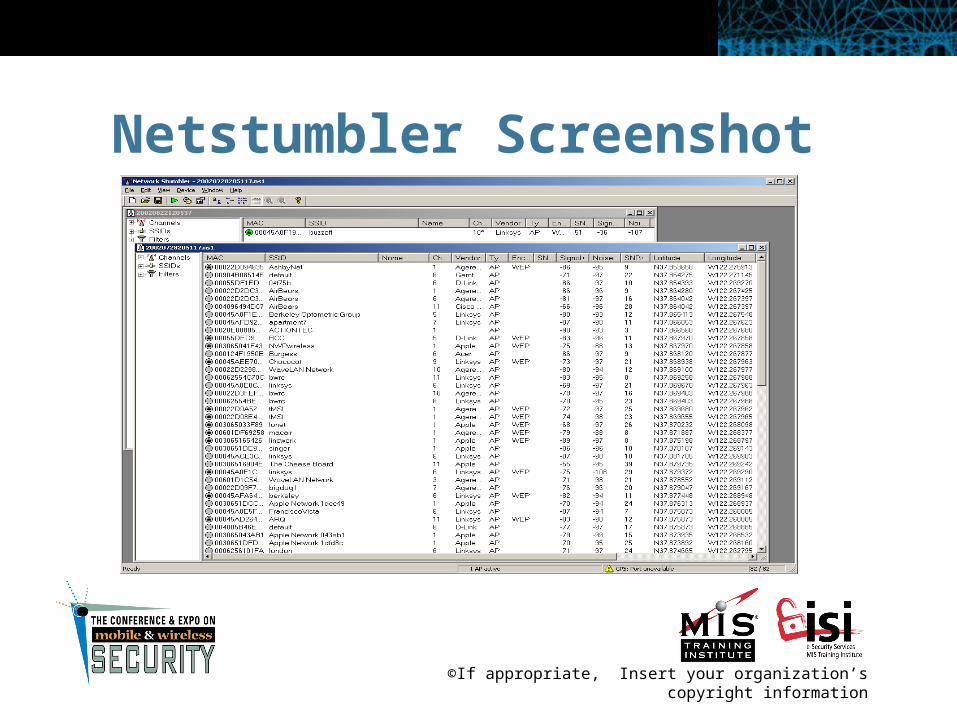
Netstumbler Screenshot

©If appropriate, Insert your organization’s copyright information
Mapping with NetStumbler
Allows the saving and exporting of collected data into multiple formats
Supports GPS and will store GPS data with other stats
Supports MIDI for AP location

©If appropriate, Insert your organization’s copyright information
Airopeek screenshot

©If appropriate, Insert your organization’s copyright information
Mapping with Airopeek
Airopeek lists signal strength per packet as a percentage
Data can be exported in many formats
GPS isn’t supported Co$tly

©If appropriate, Insert your organization’s copyright information
Kismet Screenshot

©If appropriate, Insert your organization’s copyright information
Mapping with Kismet Comes with
own gpsmap program
Does signal strength guessing and interpolation
Not so accurate

©If appropriate, Insert your organization’s copyright information
Mapping with KismetWireless Kismet is a Linux wireless tool It’s free Captures all packets received Supports GPS and mapping Logging is flexible and configurable Installation can be difficult Requires driver and kernel patches

©If appropriate, Insert your organization’s copyright information
University of Kansas
GIS Based WLAN Map
Project
©If appropriate, Insert your organization’s copyright information
GIS Mapping methods
Some map makers are using GIS programs. (ArcView, Grass)
Incredibly difficult Requires strong knowledge of
GIS and geographic mapping techniques
Overlay generally done manually
©If appropriate, Insert your organization’s copyright information
carte.pl
Netstumbler output required GPS is a must Tool runs on Linux and Win2k Utilizes internet connection to
grab the satellite image

©If appropriate, Insert your organization’s copyright information
Application requirements
Perl Image::Magick Image::Grab Web connection

©If appropriate, Insert your organization’s copyright information
Usage Overview Data collection using NetStumbler Data exported as text carte.pl
– Parse exported data– Process data setting variables, etc– Grab satellite image from Internet– Generate simple ‘circle’ & IDW
overlay images– Graphical output is overlaid on
satellite image

©If appropriate, Insert your organization’s copyright information
Data Collection using NetStumbler
Connect GPS device to PC Launch NetStumbler Begin collecting data by moving
around your signal area, until signal weakens
Try to find the limits of the signal in all directions – Need at least 6 good readings from different (~50 meters) locations

©If appropriate, Insert your organization’s copyright information
Exporting Data in NetStumbler

©If appropriate, Insert your organization’s copyright information
NetStumbler Output
©If appropriate, Insert your organization’s copyright information
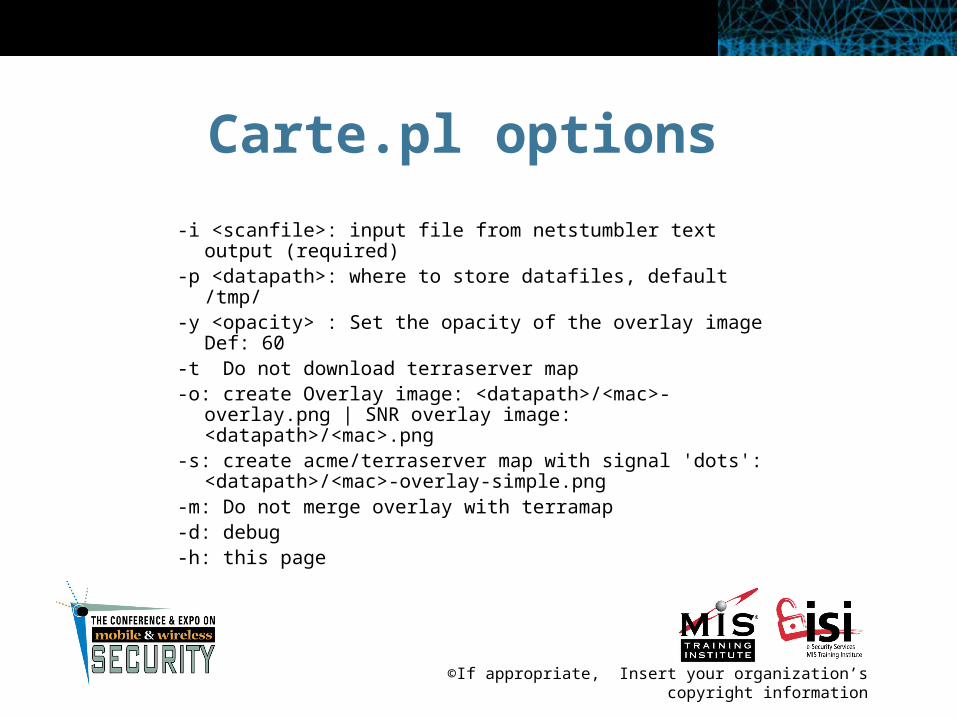
Carte.pl options
-i <scanfile>: input file from netstumbler text output (required)
-p <datapath>: where to store datafiles, default /tmp/ -y <opacity> : Set the opacity of the overlay image Def:
60-t Do not download terraserver map-o: create Overlay image: <datapath>/<mac>-
overlay.png | SNR overlay image: <datapath>/<mac>.png
-s: create acme/terraserver map with signal 'dots': <datapath>/<mac>-overlay-simple.png
-m: Do not merge overlay with terramap-d: debug-h: this page

©If appropriate, Insert your organization’s copyright information
Carte – Parsing the data
Tool calculates central position of each access point
Based on central position, grabs satellite image from www.acme.com/mapper/

©If appropriate, Insert your organization’s copyright information
#####################################################
####### Finding Max & Min | 00-40-96-44-93-03 ##################################################
###coord# | lat_1 | lat | long_1| long1 | N | 37.7054167 | W | -121.92245672 | N | 37.7054150 | W | -121.92245673 | N | 37.7054150 | W | -121.92245674 | N | 37.7054133 | W | -121.9224555 | N | 37.7054133 | W | -121.9224556 | N | 37.7054133 | W | -121.9224557 | N | 37.7054117 | W | -121.9224533
maplat=37.7040425 | maplong=-121.92289415 | max_lat=37.7057400 | min_lat=37.7023450 | max_long=-121.9224533 | min_long=-121.923335
data range: 37.7023450,-121.923335-37.7057400,-121.9224533

©If appropriate, Insert your organization’s copyright information
##############################################
####### Getting acme/terraserver map for | 00-40-96-44-93-03
##############################################
URL | http://www.acme.com/mapper/save.cgi?lat=37.7040425&long=-121.92289415&scale=10&theme=Image&width=3&height=3&dot=No
Filename | output/00-40-96-44-93-03-terramap.png

©If appropriate, Insert your organization’s copyright information

©If appropriate, Insert your organization’s copyright information
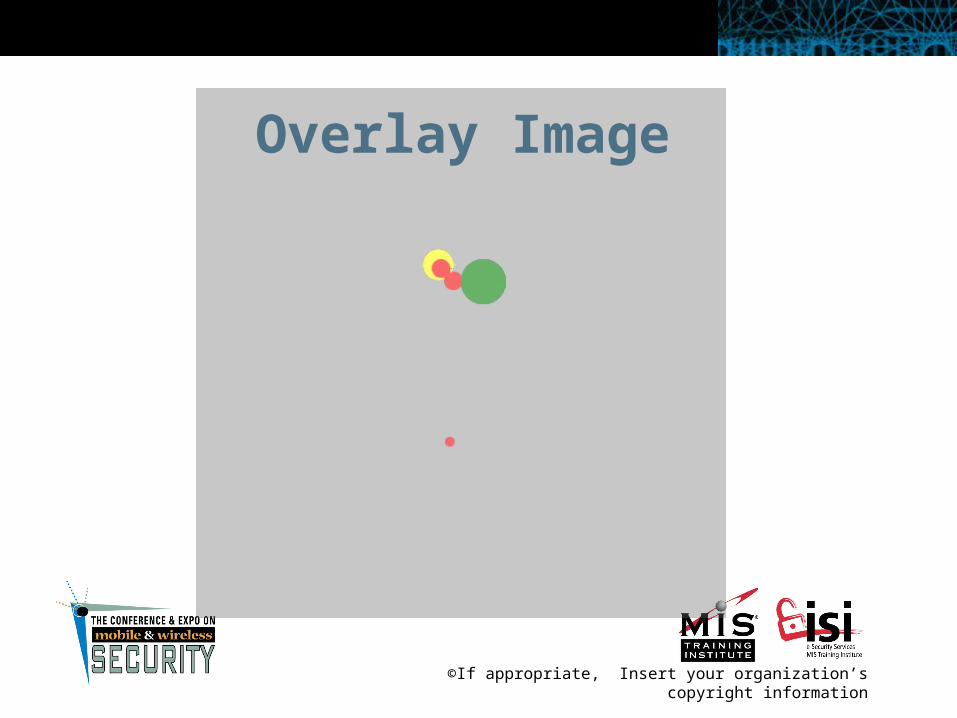
Carte - Processing the data
Calculates signal strength per lat/long reading
If there are multiple SNR readings at a single point, it uses only the strongest
Generates overlay showing only dots to indicate reading position and signal strength

©If appropriate, Insert your organization’s copyright information
Only map the strongest signal############################################################ Creating Overlay Image | 00-40-96-44-93-03 #####################################################
1 | N | 37.7054167 | W | -121.92245672 | N | 37.7054150 | W | -121.92245673 | N | 37.7054150 | W | -121.92245674 | N | 37.7054133 | W | -121.9224555 | N | 37.7054133 | W | -121.9224556 | N | 37.7054133 | W | -121.9224557 | N | 37.7054117 | W | -121.92245338 | N | 37.7054083 | W | -121.92245339 | N | 37.7054083 | W | -121.922453310 | N | 37.7054967 | W | -121.92247

©If appropriate, Insert your organization’s copyright information
Convert signal location to map x,y
min=37.7023450 | min_long=-121.923335 | | max_lat=37.7057400| max_long=-121.9224533
data range: 37.7023450,-121.923335-37.7057400,-121.9224533original width * 3=0.00264509999998097, height *
3=0.0101849999999928adjusted width=0.0101849999999928, height=0.0101849999999928middle_lat=37.7040425, middle_long=-121.92289415one pixel is 1.6974999999988e-05 degrees of longitude.xy=324,214| 8xy=325,219| 24xy=287,400| 0xy=325,219| 21xy=291,218| 12xy=274,200| 14

©If appropriate, Insert your organization’s copyright information
Create ‘circle’ overlay################################################################ Creating Simple Image | 00-40-96-44-93-03 #########################################################
Draw( fill=>red, stroke=>red, strokewidth=>1, primitive => 'circle', points => 324,214 329,214Draw( fill=>green, stroke=>green, strokewidth=>1, primitive => 'circle', points => 325,219
345,219Draw( fill=>red, stroke=>red, strokewidth=>1, primitive => 'circle', points => 287,400 292,400Draw( fill=>green, stroke=>green, strokewidth=>1, primitive => 'circle', points => 325,219
345,219Draw( fill=>red, stroke=>red, strokewidth=>1, primitive => 'circle', points => 291,218 296,218Draw( fill=>yellow, stroke=>yellow, strokewidth=>1, primitive => 'circle', points => 274,200
286,200
©If appropriate, Insert your organization’s copyright information
Overlay Image

©If appropriate, Insert your organization’s copyright information
Overlay On Satellite
©If appropriate, Insert your organization’s copyright information
Carte - Creating the IDW overlay
Uses Inverse Distance Weighted (IDW) algorithm to generate signal strength overlay
Accuracy based on number of data points collected

©If appropriate, Insert your organization’s copyright information
Calculate weights for overlay image
######################################################## Done Creating Simple Image | 00-40-96-44-93-03 #################################################
for 0, 0, weight=0.0554937521561633, minweight=0.0554937521561633for 1, 1, weight=0.0559136672229048, minweight=0.0215136506150052for 2, 2, weight=0.0563383386355446, minweight=0.0215136506150052for 3, 3, weight=0.0567678380916948, minweight=0.0215136506150052for 4, 4, weight=0.0572022386385329, minweight=0.0215136506150052for 5, 5, weight=0.0576416147010413, minweight=0.0215136506150052

©If appropriate, Insert your organization’s copyright information
Create Overlay Image
Generating overlay image:x=0,y=0 | colorstring = #ffffffx=1,y=1 | colorstring = #ffffffx=2,y=2 | colorstring = #ffffffx=3,y=3 | colorstring = #ffffffx=4,y=4 | colorstring = #ffffff…x=287,y=287 | colorstring = #ac9877x=288,y=288 | colorstring = #ac9877x=289,y=289 | colorstring = #ac9877x=290,y=290 | colorstring = #ac9877…

©If appropriate, Insert your organization’s copyright information
Overlay Image

©If appropriate, Insert your organization’s copyright information
Overlay Merged

©If appropriate, Insert your organization’s copyright information
Summary 802.11b networks are both
convenient and dangerous Wireless signal mapping is critical Visual tools aren’t common and
similar mapping tools don’t offer the same functionality
Know your wireless bounds, improve your security

©If appropriate, Insert your organization’s copyright information
Project Websites
Updated versions and documentation can be found at:
http://www.berkeleywireless.net/carte http://www.dmzs.com/tools/network/