seti search with meerkat

1
SETI Search with MeerKAT Student: Jiapeng Zhang Carleton University ([email protected] ) Department of Physics Git repository: https://github.com/ZaynAmell/result.git Supervisor: Dr. Cherry Ng University of Toronto, ([email protected] ) Dunlap Institute for Astronomy and Astrophysics SETI stands for search for extraterrestrial intelligence. We look for technosignatures that suggest the existence of ET. A good example of what technosignature might look like is by considering human technology in space like voyager-1. Figure 1. Drifting signal from voyager-1 detected by Green Bank Telescope (GBT). We speculate that narrow bandwidth drifting signals like this are likely to be signals from other civilization if they share some similarities in radio technology as human. Thus, we choose to detect radio signals with such pattern. The drifting pattern is caused by the relative motion between the transmitter and the receiver, due to doppler effect. Four of the most pronounced factors are rotational acceleration of the Earth, orbital acceleration of the Earth, rotational acceleration of the observed object, and orbital acceleration of the observed object. [1] A telescope array locates in radio-quiet reserve in Northern Cape, South Africa, consisting of 64 antennas with diameter of 13.5m. There are two frequency bandwidth currently for MeerKAT detection, L-band (856-1712 MHz) and UHF-band (544-1088 MHz). It has a field of view of 1 square deg of sky. Breakthrough Listen (BL) is deploying a user supplied equipment (BLUSE) that will enable all 64 beams, 24/7, conducting SETI research in a commensal fashion. We search for drifting signals from data collected by radio telescope. Radio frequency interference (RFI) is radio waves emitted from human technologies and could contaminate our observational data so should be excluded when possible.. These RFI tend to be relatively stationary (small drift rate) and can exist in both narrowband or broadband form, for example, GPS, GLONASS and satellite uplinks and downlinks. To determine the RFI region within the bandwidth of MeerKAT detecting range, I made an algorithm with a peakutils package and spline fitting algorithm to remove the baseline of the power spectrum of each observation and identifying all the RFI above a certain threshold, 1.0 standard deviation for max power above 10000 and 0.1 standard deviation for max power below 10000. Figure 2. A comparison of a MeerKAT test data taken on 2020-03-26 before and after baseline removal Figure 3. Overall RFI from all available observations. A total of 98 observations comprised of 85 sets from L-band (left) and 13 sets from UHF-band (right). The overall percentage of RFI in L-band is around 30%, whereas in UHF is 5% TurboSETI is a python package used to search for drifting signals. It was originally designed for GBT and Parkes, implementing Taylor tree dedoppler algorithm. [2] Figure 4. A simple illustration of Taylor tree dedoppler algorithm. [2] Because of its incompatibility with MeerKAT, not only does the files need to acquire a high frequency resolution (100 Hz), but also it require to input a parameter: n_coarse_chan, which the number of coarse frequency channel and arises due to the FFT fine channelization applied to the input data. I was working on a pipeline to automatically calculate this parameter and generating results with TurboSETI. This function is conveniently enough that it is from a previous package peakutils . Figure 5. Zoomed-in power spectrum of a high frequency resolution file In Fig.5, it shows that between two valleys is one coarse channel. Calculate number of times when threshold intercepts the power line and divided by two to get n_coarse_chan. Currently, I’m working on a pipeline with turboSETI and the function for acquisition of n_coarse_chan to automatically produce hits and determine if a hit is inside RFI region, with plotting possible candidates in waterfall plot (under construction). By benchmarking the runtime of this pipeline on Berkeley machine blpc0 on files with same time resolution but different frequency resolution and observation time of 4.7 min. Figure 6. Runtime of the pipeline on blpc0. The pipeline should be more automatic, if used in real time. A few features should be added, such as detecting if an observation data file is generated and starting the search, and attaching the hits found to the data file for future comparison. Even though the pipeline runtime is lower than observation time , if we try to use the automatic process in real time (searching while observing) the runtime should be 1/64 of the observation time, therefore the pipeline should be further improved on its performance efficiency Currently there are not many files for the benchmarking, so running pipeline on more data and checking if the trend stays overall the same should be an important goal. [1] Sheikh, S. Z., Wright, J. T., Siemion, A., and Enriquez, J. E., “Choosing a Maximum Drift Rate in a SETI Search: Astrophysical Considerations”, The Astrophysical Journal, vol. 884, no. 1, 2019. doi:10.3847/1538-4357/ab3fa8. [2] Taylor, J. H., “A Sensitive Method for Detecting Dispersed Radio Emission”, Astronomy and Astrophysics Supplement Series, vol. 15, p. 367, 1974. Since all these observations are planned to have a duration of 5min and in order to efficiently search for candidates with this pipeline, the runtime should best be below the observation time. Thus, for an overall efficiency, I recommend running this pipeline with snr above 15 in general.

Upload: others

Post on 23-Feb-2022

6 views

Category:

Documents


0 download

TRANSCRIPT

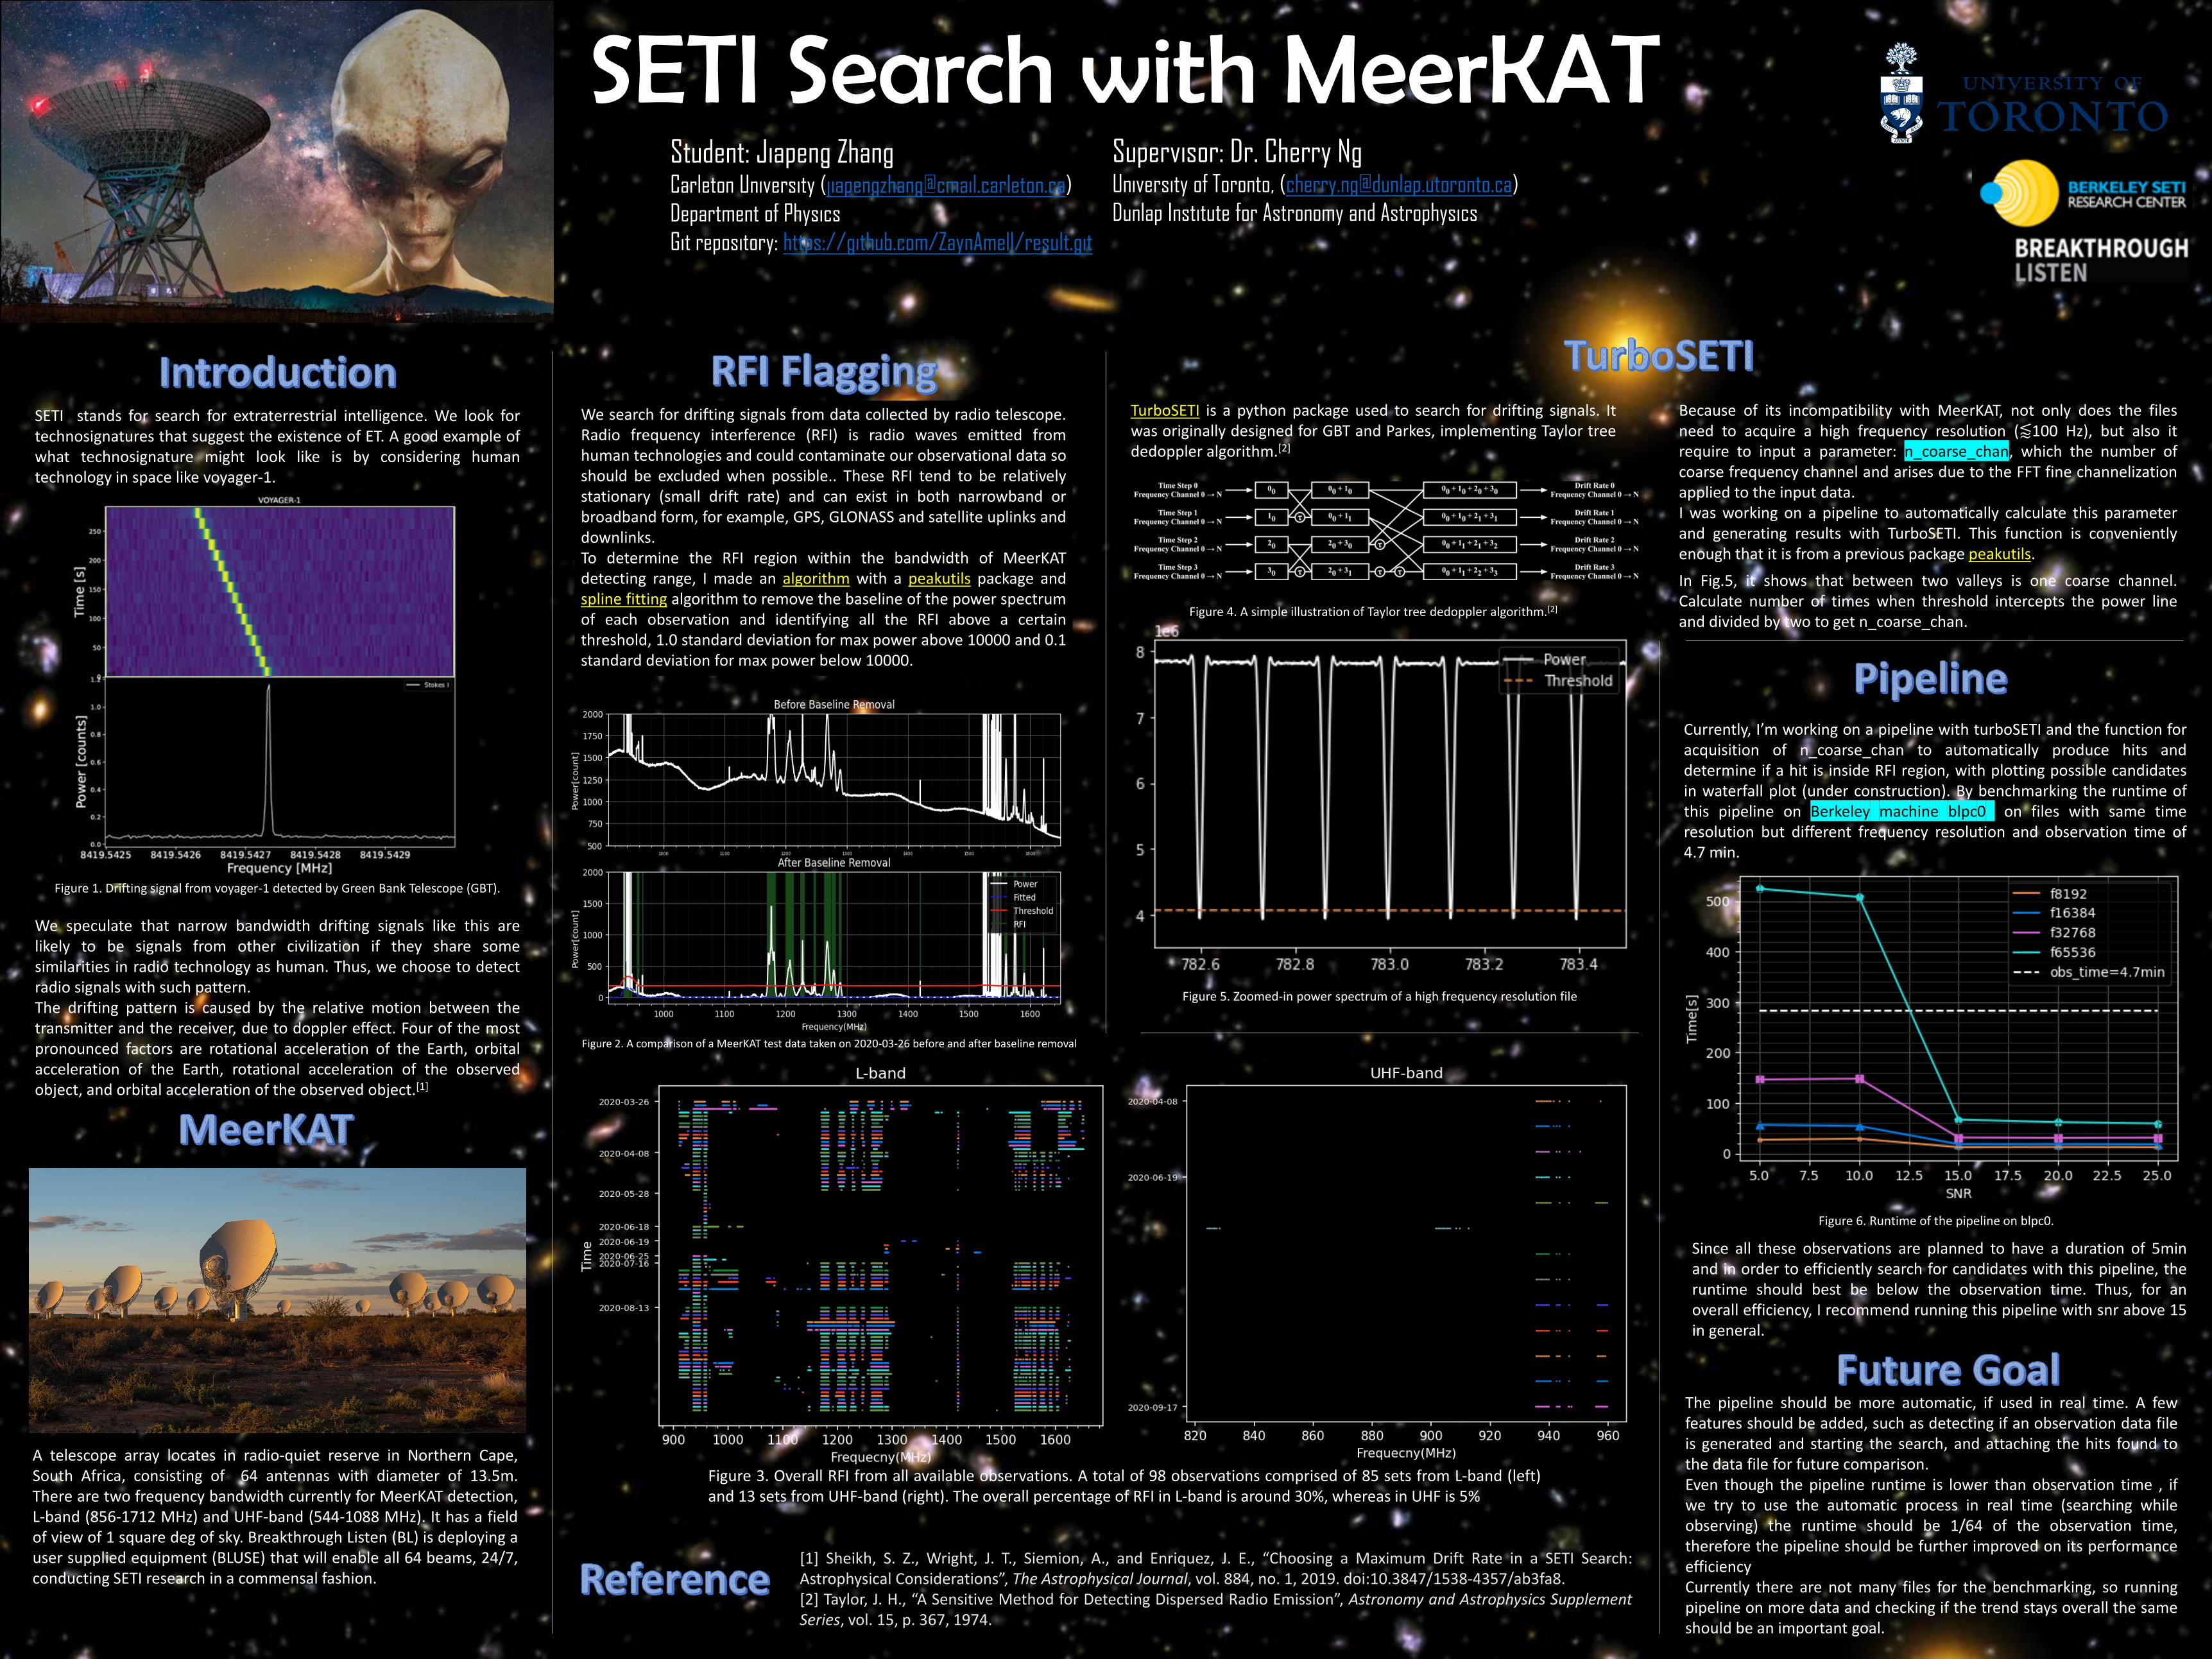
SETI Search with MeerKATStudent: Jiapeng ZhangCarleton University ([email protected])

Department of Physics

Git repository: https://github.com/ZaynAmell/result.git

Supervisor: Dr. Cherry NgUniversity of Toronto, ([email protected])

Dunlap Institute for Astronomy and Astrophysics

SETI stands for search for extraterrestrial intelligence. We look fortechnosignatures that suggest the existence of ET. A good example ofwhat technosignature might look like is by considering humantechnology in space like voyager-1.

Figure 1. Drifting signal from voyager-1 detected by Green Bank Telescope (GBT).

We speculate that narrow bandwidth drifting signals like this arelikely to be signals from other civilization if they share somesimilarities in radio technology as human. Thus, we choose to detectradio signals with such pattern.The drifting pattern is caused by the relative motion between thetransmitter and the receiver, due to doppler effect. Four of the mostpronounced factors are rotational acceleration of the Earth, orbitalacceleration of the Earth, rotational acceleration of the observedobject, and orbital acceleration of the observed object.[1]

A telescope array locates in radio-quiet reserve in Northern Cape,South Africa, consisting of 64 antennas with diameter of 13.5m.There are two frequency bandwidth currently for MeerKAT detection,L-band (856-1712 MHz) and UHF-band (544-1088 MHz). It has a fieldof view of 1 square deg of sky. Breakthrough Listen (BL) is deploying auser supplied equipment (BLUSE) that will enable all 64 beams, 24/7,conducting SETI research in a commensal fashion.

We search for drifting signals from data collected by radio telescope.Radio frequency interference (RFI) is radio waves emitted fromhuman technologies and could contaminate our observational data soshould be excluded when possible.. These RFI tend to be relativelystationary (small drift rate) and can exist in both narrowband orbroadband form, for example, GPS, GLONASS and satellite uplinks anddownlinks.To determine the RFI region within the bandwidth of MeerKATdetecting range, I made an algorithm with a peakutils package andspline fitting algorithm to remove the baseline of the power spectrumof each observation and identifying all the RFI above a certainthreshold, 1.0 standard deviation for max power above 10000 and 0.1standard deviation for max power below 10000.

Figure 2. A comparison of a MeerKAT test data taken on 2020-03-26 before and after baseline removal

Figure 3. Overall RFI from all available observations. A total of 98 observations comprised of 85 sets from L-band (left)and 13 sets from UHF-band (right). The overall percentage of RFI in L-band is around 30%, whereas in UHF is 5%

TurboSETI is a python package used to search for drifting signals. Itwas originally designed for GBT and Parkes, implementing Taylor treededoppler algorithm.[2]

Figure 4. A simple illustration of Taylor tree dedoppler algorithm.[2]

Because of its incompatibility with MeerKAT, not only does the filesneed to acquire a high frequency resolution (⪅100 Hz), but also itrequire to input a parameter: n_coarse_chan, which the number ofcoarse frequency channel and arises due to the FFT fine channelizationapplied to the input data.I was working on a pipeline to automatically calculate this parameterand generating results with TurboSETI. This function is convenientlyenough that it is from a previous package peakutils.

Figure 5. Zoomed-in power spectrum of a high frequency resolution file

In Fig.5, it shows that between two valleys is one coarse channel.Calculate number of times when threshold intercepts the power lineand divided by two to get n_coarse_chan.

Currently, I’m working on a pipeline with turboSETI and the function foracquisition of n_coarse_chan to automatically produce hits anddetermine if a hit is inside RFI region, with plotting possible candidatesin waterfall plot (under construction). By benchmarking the runtime ofthis pipeline on Berkeley machine blpc0 on files with same timeresolution but different frequency resolution and observation time of4.7 min.

Figure 6. Runtime of the pipeline on blpc0.

The pipeline should be more automatic, if used in real time. A fewfeatures should be added, such as detecting if an observation data fileis generated and starting the search, and attaching the hits found tothe data file for future comparison.Even though the pipeline runtime is lower than observation time , ifwe try to use the automatic process in real time (searching whileobserving) the runtime should be 1/64 of the observation time,therefore the pipeline should be further improved on its performanceefficiencyCurrently there are not many files for the benchmarking, so runningpipeline on more data and checking if the trend stays overall the sameshould be an important goal.

[1] Sheikh, S. Z., Wright, J. T., Siemion, A., and Enriquez, J. E., “Choosing a Maximum Drift Rate in a SETI Search:Astrophysical Considerations”, The Astrophysical Journal, vol. 884, no. 1, 2019. doi:10.3847/1538-4357/ab3fa8.[2] Taylor, J. H., “A Sensitive Method for Detecting Dispersed Radio Emission”, Astronomy and Astrophysics SupplementSeries, vol. 15, p. 367, 1974.

Since all these observations are planned to have a duration of 5minand in order to efficiently search for candidates with this pipeline, theruntime should best be below the observation time. Thus, for anoverall efficiency, I recommend running this pipeline with snr above 15in general.