setting goals and measuring performance of your economic development website
TRANSCRIPT

1
Smarter Software for Communities
July 9, 2015
SETTING GOALS AND MEASURING THE PERFORMANCE OF YOUR ED WEBSITE
REVIEW PERFORMANCE, INTERPRET ANALYTICS, AND INCREASE PERFORMANCE OVER TIME

2
In this session you will learn to…
1. Review available performance benchmarks for economic development websites
2. Interpret website analytics
3. Interpret GIS analytics
4. Interpret lead conversion analytics to your CRM
5. Recommended analytics for small and midsized organizations

3
About Your Presenter
Ben WrightCEO, Product Visionary, Metrics Thought Leader

4
Smarter Software for Communities
How to review the available benchmarks for website analytics?

5
Understanding the key metrics for economic development
Source: Putting High Performance Economic Development into Practice, 2014 Atlas Advertising

6
Understanding the average EDO
Source: Putting High Performance Economic Development into Practice, 2014 Atlas Advertising

7
How to set appropriate goals for your website based on your size
Source: Putting High Performance Economic Development into Practice, 2014 Atlas Advertising

8
How do you get this report?
Website: www.atlas-advertising.com

9
Smarter Software for Communities
Enter answer into your questions box: What is your
most important organizational metric?

10
Smarter Software for Communities
How to interpret website and GIS analytics?

11
Metric Recommended Goal
Total online advertising impressions
20 x your target website sessions
Total social interactions 20x your target website sessions
Website Visits Number of sessions on your website
2,250 sessions per month for average EDO (all sizes)
Average time on site for your website
2 minutes for average EDO
Conversion Goals 2-15% of views of conversion page
Conversions to Conversations
Views of contact pages 10% of sessions
Views of property details pages 38% of sessions
Conversions to LinkedIn 10% of sessions
So what metrics should you be tracking?

12
What sources of analytics are there?

13
Metric Recommended Goal Source
Total online advertising impressions
20 x your target website sessions
Google Adwords
Total social interactions 20x your target website sessions
HubSpot, Hoot Suite
Number of sessions on your website
2,250 sessions per month for average EDO (all sizes)
Google Analytics
Average time on site for your website
2 minutes for average EDO Google Analytics
Conversion goals 2% of views of conversion page
Google Analytics, Crazy Egg
Views of contact pages 10% of sessions Google Analytics
Views of property details pages
38% of sessions Atlas InSite Analytics
Conversions to LinkedIn 10% of sessions LinkedIn Profile Views
Where do you go to find each metric?

14
Using Google Adwords to Drive Traffic
1. Shows you real time campaign performance
2. Helps you optimize for each keyword
3. Lets you manage your budget
4. Helps you master the source of 30 to 50% of your website’s traffic

15
How do you get Google Adwords?
1. Visit the URL below
2. Set up keywords and simple text ads yourself
3. Set bid limits to match your budget (daily or weekly)– You only pay for
clicks to your website, often between .10 and $5.00 per click
4. Track and optimize
5. Or, hire a professionalWebsite: www.google.com/adwords

16
Using social publishing tools to drive and track traffic
(HubSpot)
1. Helps you track interactions with email, social, and other digital communications
2. Helps you track interactions by persona
3. Helps you master all digital sources of traffic

17How do you get HubSpot?
1. For organizations spending 50K per year+ on marketing
2. Visit the URL below
3. Find a partner agency (such as Atlas)
4. Go through setup and onboarding training
5. Use to send email, post social messages, and aggregate all traffic
6. Pay between $200 and $2,000 per month
Website: www.hubspot.com

18
Using social publishing tools to drive and track traffic
(Hootsuite)
1. Helps you track interactions with multiple social accounts
2. Allows you to search other posts to re-publish
3. Analytics for total interactions, clicks by region, referrers, and more
4. Helps you master your social publishing
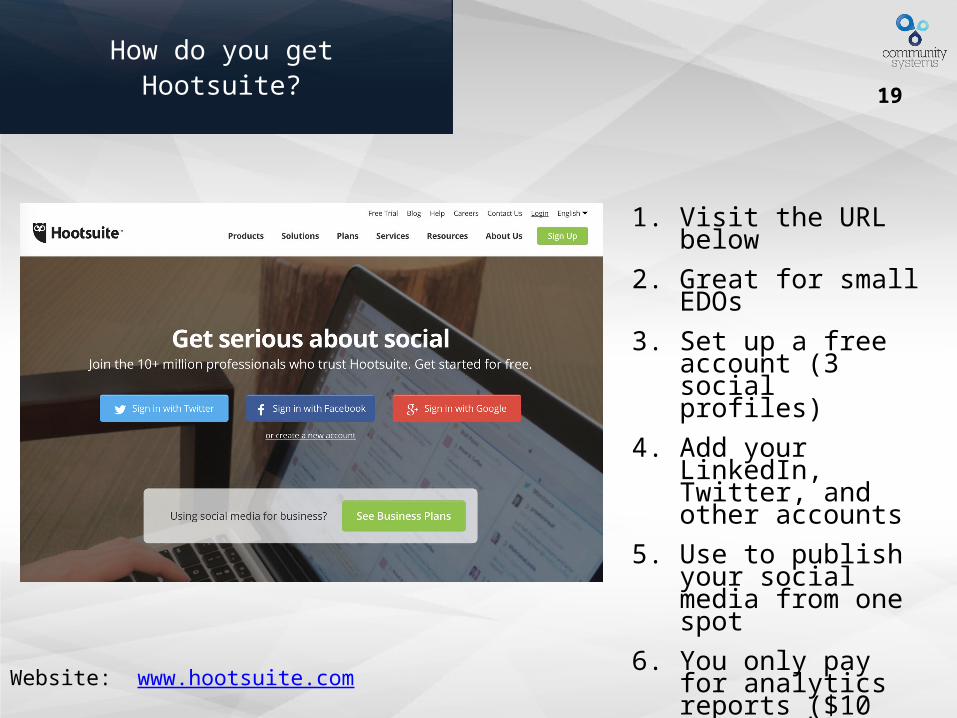
19How do you get Hootsuite?
1. Visit the URL below
2. Great for small EDOs
3. Set up a free account (3 social profiles)
4. Add your LinkedIn, Twitter, and other accounts
5. Use to publish your social media from one spot
6. You only pay for analytics reports ($10 per month)
Website: www.hootsuite.com

20
Using Google Analytics to track website traffic
1. Basic dashboard includes sessions, time on site (session duration)
2. Includes additional basic metrics such as page views, session duration (time on site), pages per session, new versus return users, and bounce rate
3. Handy tools allow you to adjust dates
4. You can also set up emailed reports

21
Using Google Analytics to track website traffic by geography
1. Within economic development, traffic from outside a community is often viewed as more valuable than traffic inside
2. Using Google Analytics, you can track traffic from anywhere in the world to your website
3. This visual tool is great for presenting to stakeholders and boards

22
Using Google Analytics to track goals/ conversions
1. Goals are what you defined them to be (form completions, files downloaded, email address clicks, views of particular pages, and more)
2. Requires custom setup within Google Analytics
3. Can be exported to a custom dashboard

23
How do you get Google Analytics?
1. Visit the URL below
2. Free, and very robust analytics
3. Data is collected by installing code on website pages
4. Comes installed on all Atlas and CS websites
5. Can deliver regular reports via email, or custom, on demand reports online
Website: www.google.com/analytics

24
Using GIS analytics to track traffic
1. Designed to track interactions that Google Analytics can’t.
2. Includes total property searches, most popular properties, total business searches, business searches by industry, reports generated, and reports by type.
3. Shows you the overall engagement with your GIS system. One key ratio: property searches to website sessions should be 38:100.
4. Sets the stage for more advanced conversion from GIS user to prospect.

25Detailed property analytics
1. Shows you the top 50 most popular properties in the last month
2. Gives you a sense of the inventory you have that is being viewed, and what isn’t

26
How do you get InSite GIS analytics?
1. Visit the URL below
2. Comes with every InSite GIS
3. No code to install
4. Users can log in via “Performance Tab” to get regular reports on demand
Website: http://communitysys.com/Products/Geographic-Information-Systems.aspx

27Conversion to LinkedIn
1. Perfect for your business development staff
2. Tracks views of profile without individuals entering any data

28Conversion to LinkedIn
1. Very easy interface to scan who has viewed your profile
2. Very clear action steps for follow up (connect, message)

29
How do you get LinkedIn analytics?
1. Set up or log in to your LinkedIn account
2. Click “Profile,” then “Who’s Viewed Your Profile”
3. There, you can also see who has viewed your posts/status updates
4. Some of this functionality is free, other features cost $75 per month with executive plan
30
Smarter Software for Communities
How do these analytics drive interactions that make a
difference?

31
How do these interactions drive conversations with
companies?
125 Website Visits for Each
Company Served

32
How can you visualize all of this data to make it simpler?

33
How can you visualize all of this data to make it simpler?
34
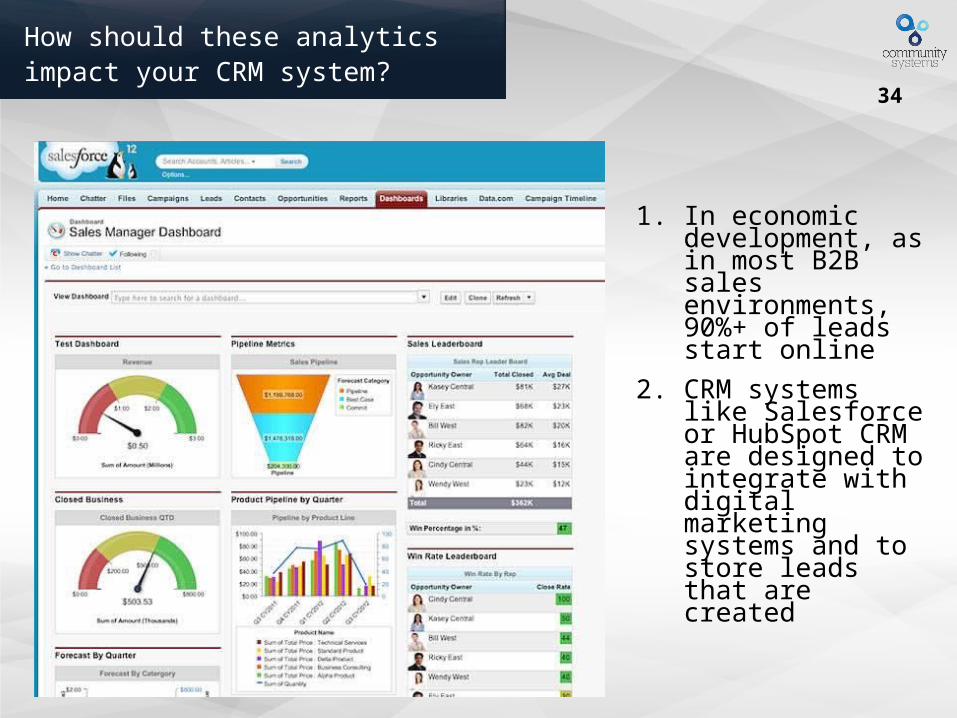
How should these analytics impact your CRM system?
1. In economic development, as in most B2B sales environments, 90%+ of leads start online
2. CRM systems like Salesforce or HubSpot CRM are designed to integrate with digital marketing systems and to store leads that are created
35
Smarter Software for Communities
Recommendations for a 1-3 person EDO

36
Recommended analytics for a 1-3 person EDO
1. Google Analytics for website traffic
2. InSite analytics for GIS usage
3. Hootsuite for social publishing
4. LinkedIn free account
5. Google doc/spreadsheet for metrics tracking and reporting
6. Simple CRM or spreadsheet to track prospects
Annual Cost: <$500 per year

37
Smarter Software for Communities
Recommendations for a 4+ person EDO

38
Recommended for a 4+ person EDO
1. Google AdWords account
2. Google Analytics for website traffic
3. InSite analytics for GIS usage
4. HubSpot for email, social publishing, website conversion
5. LinkedIn executive account
6. Dashboard from Leftronic for integrated, real time reporting
7. CRM such as Salesforce for prospect responses
Annual Cost: $20,000+ per year

39
Smarter Software for Communities
Next Session: Using Digital Tools to Generate Leads to Your EDO

40
Next DigitalEDU session
Using Digital Tools to Generate Leads to Your EDO
July 22, 2015
11:30am – 1:00pm MST
To register: http://communitysys.com/About-Us/Upcoming-Webinars.aspx

41
929 BroadwayDenver, CO 80203Contact: Ben Wright
t: 720.420.3800 x 210
www.Communitysys.com
Thank you and stay in touch!
Smarter Software for Communities