setting objectives for oyster habitat restoration using ecosystem services … · 2017-06-05 ·...
TRANSCRIPT

Setting Objectives for Oyster Habitat Restoration Using Ecosystem Services
A Manager’s GuideUpdated Version May 2017
Authors: Philine zu Ermgassen, Boze Hancock, Bryan DeAngelis, Jennifer Greene, Elizabeth Schuster, Mark Spalding, Robert Brumbaugh.

Photo: Intertidal oyster reef, Florida, A. Birch.
Setting Objectives for Oyster Habitat Restoration using Ecosystem Services: A Manager’s Guide | 3
Grant acknowledgment
Preparation of this guide and the underpinning research on the ecosystem services provided by oyster reef has been generously supported by the following federal grants and private funders: National Fish and Wildlife Foundation (Grant #1047), The National Partnership between TNC and NOAA Community-based Restoration Program (Grants # NA07NMF4630136 & NA10NMF4630081), the TNC-Shell Partnership, the Carnival Foundation, the Turner Foundation, and the Lyda Hill Foundation. The statements, findings, conclusions, and recommendations are those of the author(s) and do not necessarily reflect the views of the funders, NFWF, the National Oceanic and Atmospheric Administration or the U.S. Department of Commerce.
Acknowledgments
The authors would like to thank the Oyster Goals Project Science Advisory Team convened in 2010 to outline the ecosystem services that most needed to be quantified and the steps necessary to get to the point of being able to set restoration objectives based on the level of ecosystem service desired. Many of this team are authors or co-authors on the foundational work referenced extensively in the text. Their initial insights as well as subsequent dedication and collaboration have been essential and appreciated.
Loren Coen, Florida Atlantic University and Smithsonian Institution.
Brett Dumbauld, Hatfield Marine Science Center, Newport, OR.
Keryn Gedan, University of Maryland, College Pk., MD.
Steven Geiger, FL Fish and Wildlife Conservation Commission, FL.
Laura Geselbracht, The Nature Conservancy, FL.
Jonathan Grabowski, Northeastern University, Nahant, MA.
Ray Grizzle, University of New Hampshire, Durham, NH.
Lisa Kellogg, VIMS, Gloucester Point, VA.
Mark Lukenbach, VIMS, Gloucester Point, VA.
Kay McGraw, NOAA Restoration Center, Silver Spring, MD
Summer Morlock, NOAA Restoration Center, Silver Spring, MD.
Michael Piehler, University of North Carolina, Morehead City, NC.
Sean Powers, University of South Alabama, Dauphin Island, AL.
Jennifer Reusink, University of Washington, Seattle, WA.
The authors would also like to thank the many additional people who gave their time and expertise to improving or contributing to this guide, including Lauren Alleman (TNC), Brian Boutin (TNC), Zach Ferdana (TNC), Amy Freitag (VIMS-NOAA), Gregg Poulakis (FWC), Giselle Samonte (NOAA), and Christine Shepard (TNC).
This work should be cited as
zu Ermgassen, P., Hancock, B., DeAngelis, B., Greene, J., Schuster, E., Spalding, M., Brumbaugh, R. 2016. Setting objectives for oyster habitat restoration using ecosystem services: A manager’s guide. The Nature Conservancy, Arlington VA. 76pp.
Cover Photo: Juvenile black sea bass (located at the center and top of the image) on a RI oyster reef. M. Griffin. Back Cover Photo: Olympia oyster reef, Canada. M. Beck.
This is a living document and will be updated and edited as new information and data becomes available. Please always refer to http://oceanwealth.org/tools/oyster-calculator/ to ensure the most up to date version. This version was updated May 2017.

4 | Setting Objectives for Oyster Habitat Restoration using Ecosystem Services: A Manager’s Guide
ContentsChapter 1: Introduction .............................................................................................................................................................................7
Chapter 2: Making the Case for Oyster Restoration ........................................................................................................................ 10
What is an oyster reef? ..................................................................................................................................................................... 10
Restored oyster reefs ......................................................................................................................................................................... 12
Historic decline ................................................................................................................................................................................... 15
Ecosystem services ........................................................................................................................................................................... 18
Water clarity ....................................................................................................................................................................................... 18
Nitrogen removal ................................................................................................................................................................................ 18
Non-oyster fishery enhancement................................................................................................................................................... 19
Coastal protection ..............................................................................................................................................................................20
Other ecosystem services ................................................................................................................................................................21
Chapter 3: Setting Ecosystem Service Objectives .............................................................................................................................22
Revising the role of historic abundance in setting objectives .................................................................................................22
Restoring for improved ecosystem services ................................................................................................................................23
Chapter 4: Stakeholder Engagement .....................................................................................................................................................24
Determining what is of importance to stakeholders .................................................................................................................24
Stakeholder engagement: Identifying ecosystem service benefits........................................................................................24
Rapid Stakeholder Assessment ......................................................................................................................................................25
Implementing the results of a rapid stakeholder assessment ................................................................................................27
Chapter 5: Water Clarity ...........................................................................................................................................................................28
The eastern oyster .............................................................................................................................................................................29
Estimating population level filtration ............................................................................................................................................29
Setting objectives based on filtration ............................................................................................................................................30
Full estuary filtration as an objective .............................................................................................................................................31
The Olympia oyster............................................................................................................................................................................34
Estimating population level filtration ............................................................................................................................................34
Setting objectives based on filtration ............................................................................................................................................35
Chapter 6: Nitrogen Removal ..................................................................................................................................................................36
Quantifying nitrogen assimilation in tissues ...............................................................................................................................36
Quantifying nitrogen burial ..............................................................................................................................................................36
Quantifying nitrogen removal by denitrification ........................................................................................................................37
The relative roles of oyster habitat restoration and aquaculture ...........................................................................................38
Using nitrogen removal to set restoration objectives ...............................................................................................................38
Setting Objectives for Oyster Habitat Restoration using Ecosystem Services: A Manager’s Guide | 5
Chapter 7: Non-Oyster Fisheries ............................................................................................................................................................40
Quantifying fish enhancement by oyster reefs ...........................................................................................................................41
Estimating fish and mobile crustacean biomass production .................................................................................................45
Utilization enhanced fish species ...................................................................................................................................................48
Using fish enhancement estimates in setting oyster restoration objectives ......................................................................49
Chapter 8: Coastal Protection..................................................................................................................................................................52
Coastal Resilience ..............................................................................................................................................................................53
Coastal Defense ..................................................................................................................................................................................53
References .....................................................................................................................................................................................................55
Appendix 1A: Estuary-Scale Data Summaries; Eastern oyster ......................................................................................................61
Appendix 1B: Estuary-Scale Data Summaries; Olympia oyster .....................................................................................................66
Appendix 2: Shell Height Biomass Conversion ...................................................................................................................................67
References: Appendix 2 ....................................................................................................................................................................68
Appendix 3: Detailed Fisheries Methods .............................................................................................................................................69
References: Appendix 3 ....................................................................................................................................................................69
Appendix 4: Table of Life History Parameters of Recruitment Enhanced Species ...................................................................70
References: Appendix 4 ....................................................................................................................................................................72
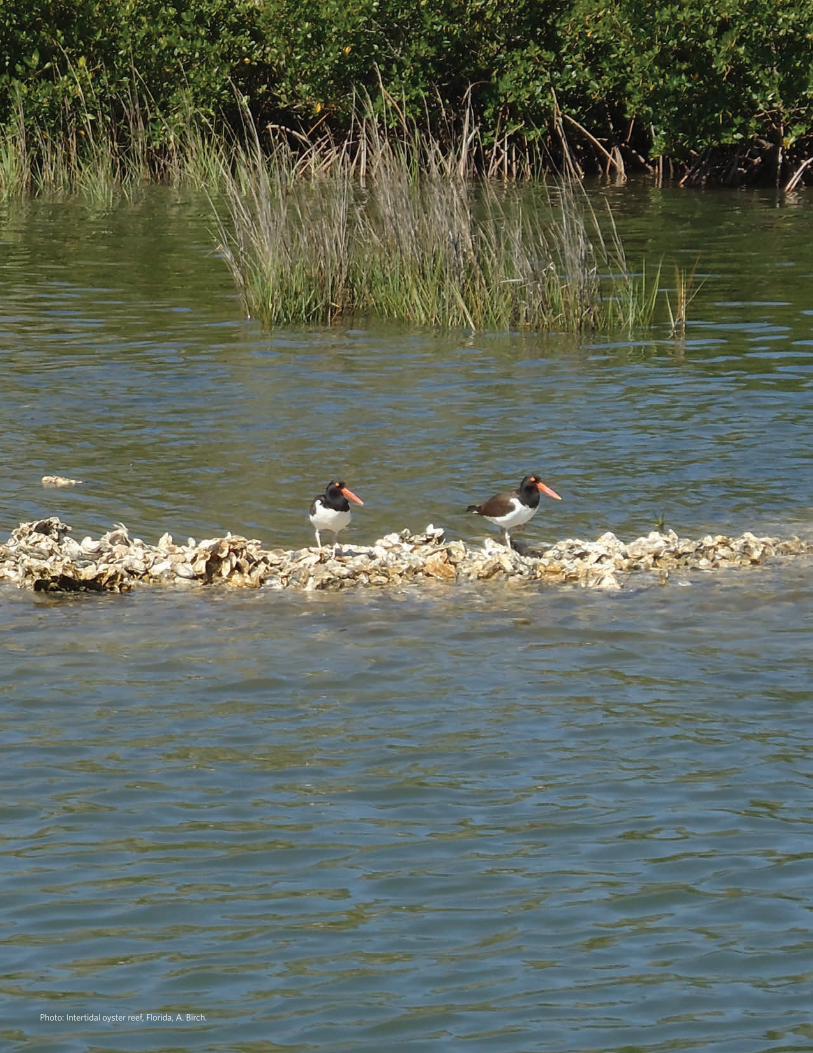
6 | Setting Objectives for Oyster Habitat Restoration using Ecosystem Services: A Manager’s GuidePhoto: Intertidal oyster reef, Florida, A. Birch.
Setting Objectives for Oyster Habitat Restoration using Ecosystem Services: A Manager’s Guide | 7
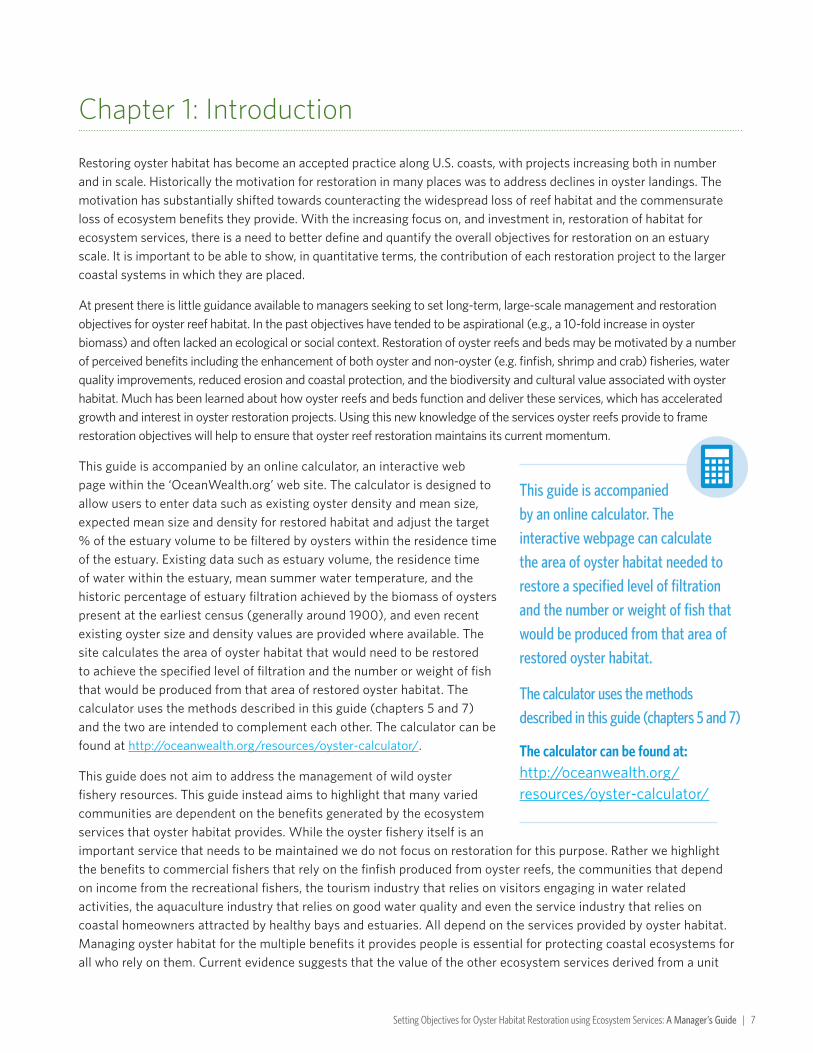
Chapter 1: Introduction
Restoring oyster habitat has become an accepted practice along U.S. coasts, with projects increasing both in number and in scale. Historically the motivation for restoration in many places was to address declines in oyster landings. The motivation has substantially shifted towards counteracting the widespread loss of reef habitat and the commensurate loss of ecosystem benefits they provide. With the increasing focus on, and investment in, restoration of habitat for ecosystem services, there is a need to better define and quantify the overall objectives for restoration on an estuary scale. It is important to be able to show, in quantitative terms, the contribution of each restoration project to the larger coastal systems in which they are placed.
At present there is little guidance available to managers seeking to set long-term, large-scale management and restoration objectives for oyster reef habitat. In the past objectives have tended to be aspirational (e.g., a 10-fold increase in oyster biomass) and often lacked an ecological or social context. Restoration of oyster reefs and beds may be motivated by a number of perceived benefits including the enhancement of both oyster and non-oyster (e.g. finfish, shrimp and crab) fisheries, water quality improvements, reduced erosion and coastal protection, and the biodiversity and cultural value associated with oyster habitat. Much has been learned about how oyster reefs and beds function and deliver these services, which has accelerated growth and interest in oyster restoration projects. Using this new knowledge of the services oyster reefs provide to frame restoration objectives will help to ensure that oyster reef restoration maintains its current momentum.
This guide is accompanied by an online calculator, an interactive web page within the ‘OceanWealth.org’ web site. The calculator is designed to allow users to enter data such as existing oyster density and mean size, expected mean size and density for restored habitat and adjust the target % of the estuary volume to be filtered by oysters within the residence time of the estuary. Existing data such as estuary volume, the residence time of water within the estuary, mean summer water temperature, and the historic percentage of estuary filtration achieved by the biomass of oysters present at the earliest census (generally around 1900), and even recent existing oyster size and density values are provided where available. The site calculates the area of oyster habitat that would need to be restored to achieve the specified level of filtration and the number or weight of fish that would be produced from that area of restored oyster habitat. The calculator uses the methods described in this guide (chapters 5 and 7) and the two are intended to complement each other. The calculator can be found at http://oceanwealth.org/resources/oyster-calculator/.
This guide does not aim to address the management of wild oyster fishery resources. This guide instead aims to highlight that many varied communities are dependent on the benefits generated by the ecosystem services that oyster habitat provides. While the oyster fishery itself is an important service that needs to be maintained we do not focus on restoration for this purpose. Rather we highlight the benefits to commercial fishers that rely on the finfish produced from oyster reefs, the communities that depend on income from the recreational fishers, the tourism industry that relies on visitors engaging in water related activities, the aquaculture industry that relies on good water quality and even the service industry that relies on coastal homeowners attracted by healthy bays and estuaries. All depend on the services provided by oyster habitat. Managing oyster habitat for the multiple benefits it provides people is essential for protecting coastal ecosystems for all who rely on them. Current evidence suggests that the value of the other ecosystem services derived from a unit
This guide is accompanied by an online calculator. The interactive webpage can calculate the area of oyster habitat needed to restore a specified level of filtration and the number or weight of fish that would be produced from that area of restored oyster habitat.
The calculator uses the methods described in this guide (chapters 5 and 7)
The calculator can be found at: http://oceanwealth.org/resources/oyster-calculator/

8 | Setting Objectives for Oyster Habitat Restoration using Ecosystem Services: A Manager’s Guide
area of oyster reef is far higher than the value of the oysters that could be extracted (Grabowski et al. 2012). Therefore sustainable management of the fished oyster resources should be pursued in order to ensure that the fishery persists into the future, but oyster habitat should also be managed to increase the values of the non-extractive ecosystem services it provides (Brumbaugh et al., 2010).
This guide is intended to assist natural resource managers and restoration practitioners in making the case for oyster restoration and in setting quantitative objectives for restoring and managing oyster reefs and beds at an estuary or bay-wide scale. Determining the area of oyster restoration required to achieve long-term large-scale objectives has numerous applications, including being able to incorporate restoration into spatial plans that resolve user conflicts, and better aligning objectives with restoration fundraising goals and management budgets over the long-term. Ultimately the objective for restored oyster reef should be combined with a consideration of the ecosystem services provided by other habitat types to develop an ecosystem-based plan for conservation and restoration on a system scale.
We draw on the latest science and information on historical extent of this globally imperiled habitat to illustrate how to set quantitative objectives around the return of two key ecosystem services provided by oyster habitat; water filtration and the enhancement of non-oyster fisheries. The information provided here enables restoration planning and management toward these benefits at an estuary scale. Two additional ecosystem services are considered, denitrification and shoreline protection. The relationship between oyster biomass and denitrification is not yell well enough understood to set objectives, however, work toward this goal is continuing and a description of this important service is included. Shoreline protection is a highly valuable service that is generally considered at scales smaller than a whole bay or estuary, so this topic is introduced and the reader referred to existing materials.
Where possible, we focus on and draw examples from specific locations. Data for setting estuary-scale objectives are not equally available for all locations and, therefore, interpolation from adjacent regions may also be required. This approach necessarily represents an estuary wide mean and does not represent the benefits delivered at all locations within an estuary. This document uses science-based evidence to assist practitioners in defining their objectives and the approximate amount of restoration required to achieve them. The true amount of ecosystem services delivered will be influenced by a multitude of factors on a smaller scale, including but not limited to; reef location, landscape, project performance, and many other abiotic factors.
SOME IMPORTANT CAVEATS
This guide is not a replacement for post-project monitoring. Such monitoring is the only way to assess project performance and quantify the actual ecosystem services delivered as a result of a project. This document does provide a way to set science-based objective for the amount of restoration required to achieve the desired level of benefits and ecosystem services that motivate the restoration. Monitoring of the intended objective and adaptive management must also play a role in both project planning and assessing progress.
This guide does not determine specific sites within an estuary where restoration is needed or should be undertaken. This is a critical next step after estuary level objectives for oyster restoration have been described (See Figure 1.).
For further information on identifying specific sites suitable for oyster restoration projects, see Brumbaugh et al. (2006), and for further information on restoration design and monitoring please see Baggett et al. (2014).

Setting Objectives for Oyster Habitat Restoration using Ecosystem Services: A Manager’s Guide | 9
Figure 1: Schematic summary of the restoration process.
Figure 1 illustrates the sequential steps of design, site selection, implementation and assessing impacts from oyster reef restoration projects, highlighting that while it is important, setting objectives is only one of a number of phases of a complete restoration project. The complexity and time requirements of each step are masked in this simple representation. For example, the site selection and restoration implementation steps contain activities ranging from site suitability assessment and permitting, to volunteer and contractor management, hatchery production when appropriate, and in-water construction work. Setting objectives first, using this guide, can facilitate subsequent steps in the process. A justifiable description of bay or estuary-scale objectives will illustrate the scale of restoration needed and help determine the potential funding needs for a project or set of projects required to achieve those objectives. Understanding the overall objectives for oyster habitat restoration within a given estuary may also help staff develop a framework for permitting the multiple projects required to reach the objectives described, and will give community participants and volunteers an understanding of how their time and effort contributes to achieving outcomes beyond the scale of a single project. Similarly funders may be more inclined to support multiple projects over time if they are placed in the larger ecosystem-based context.
SettingObjectives
RestorationImplementation
Monitoring &Assessment
SiteSelection

10 | Setting Objectives for Oyster Habitat Restoration using Ecosystem Services: A Manager’s Guide
Chapter 2: Making the Case for Oyster Restoration
Support for oyster reef restoration primarily arises from unequivocal evidence of the widespread and large-scale loss of this critical coastal habitat (zu Ermgassen et al., 2012), and the ecosystem services it provides (Coen et al., 2007, Grabowski et al., 2012). This guide seeks to summarize the quantification of ecosystem services provided by oyster restoration in a readily accessible format. In this section we review the background to “making a case” for oyster restoration. We summarize the evidence of declines in oyster habitat in the United States, as well as the ecosystem services these habitats provide.
Figure 2: Oyster biomass remaining in estuaries for which comparable historic and modern data were available, illustrating the extent of loss of oyster reef habitats throughout the U.S. adapted from zu Ermgassen et al. 2012.
What is an oyster reef?Oysters are marine and estuarine bivalve mollusks in the Family Ostreidae. The most common species of oyster in the U.S. are the eastern oyster (Crassostrea virginica) on the Atlantic and Gulf coasts, and the Olympia oyster (Ostrea lurida) on the Pacific coast. Both of these species are commercially valuable. Oysters can be long lived; eastern oysters as old as 18 years have been recorded (Bleakney and David, 1983). A life span of just 3-5 years is, however, more typical in today’s environment, given harvest pressures and introduced predators and diseases.
Percentage of historic remaining
Setting Objectives for Oyster Habitat Restoration using Ecosystem Services: A Manager’s Guide | 11
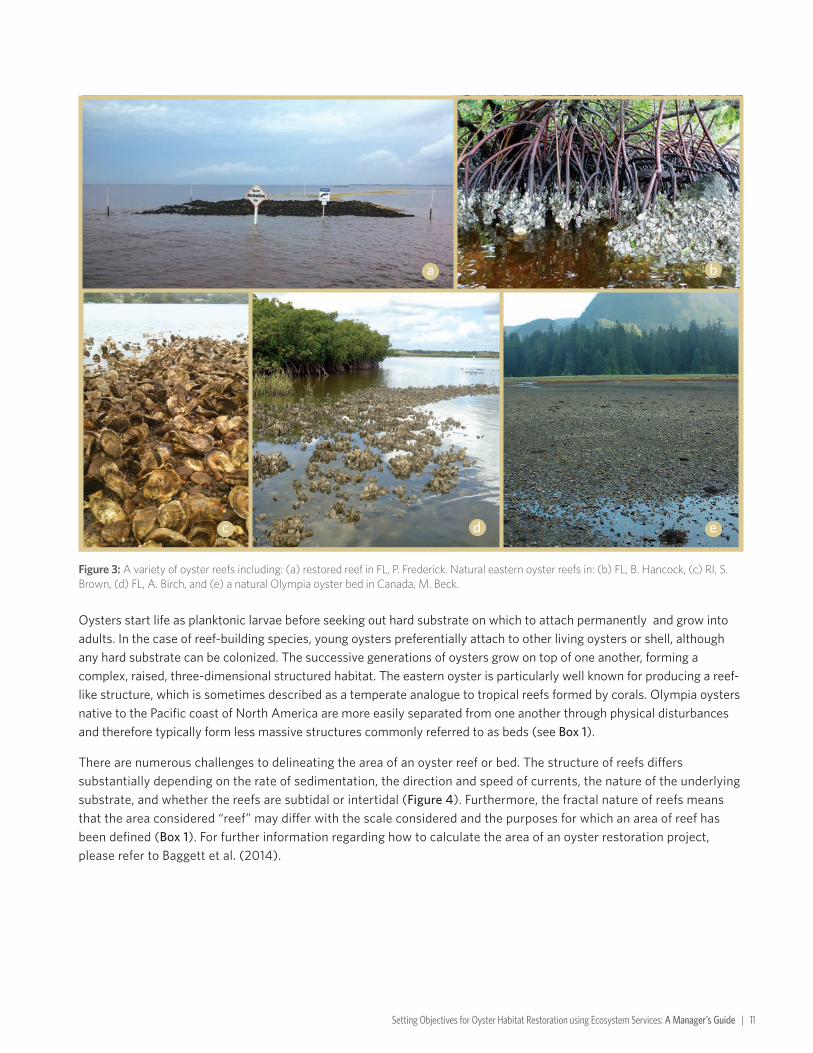
Figure 3: A variety of oyster reefs including: (a) restored reef in FL, P. Frederick. Natural eastern oyster reefs in: (b) FL, B. Hancock, (c) RI, S. Brown, (d) FL, A. Birch, and (e) a natural Olympia oyster bed in Canada, M. Beck.
Oysters start life as planktonic larvae before seeking out hard substrate on which to attach permanently and grow into adults. In the case of reef-building species, young oysters preferentially attach to other living oysters or shell, although any hard substrate can be colonized. The successive generations of oysters grow on top of one another, forming a complex, raised, three-dimensional structured habitat. The eastern oyster is particularly well known for producing a reef-like structure, which is sometimes described as a temperate analogue to tropical reefs formed by corals. Olympia oysters native to the Pacific coast of North America are more easily separated from one another through physical disturbances and therefore typically form less massive structures commonly referred to as beds (see Box 1).
There are numerous challenges to delineating the area of an oyster reef or bed. The structure of reefs differs substantially depending on the rate of sedimentation, the direction and speed of currents, the nature of the underlying substrate, and whether the reefs are subtidal or intertidal (Figure 4). Furthermore, the fractal nature of reefs means that the area considered “reef” may differ with the scale considered and the purposes for which an area of reef has been defined (Box 1). For further information regarding how to calculate the area of an oyster restoration project, please refer to Baggett et al. (2014).
a b
c d e

12 | Setting Objectives for Oyster Habitat Restoration using Ecosystem Services: A Manager’s Guide
Figure 4: Images of a variety of intertidal and subtidal oyster reefs. (a) FL, A. Birch (b) RI, M. Griffin (c) VA, B. Lusk (d) RI, B. DeAngelis.
Restored oyster reefsWhile many oyster restoration projects utilise oyster shell as a substrate in reef building, novel reef substrates are increasingly being called upon. Novel substrates include reef balls, rebar framed structures, oyster castles and limestone marl, just to name a few (Figure 5). A lack of availability of shell is often a deciding factor in restoration design, but increasingly interest in ecosystem services such as coastal protection may also come into play. These are all legitimate approaches to oyster reef restoration, however, care must be taken when applying to novel structures the models and service estimates outlined in this guide. While estimates of the filtration service will remain unimpacted by substrate type, estimates of denitrification and fish production may differ from those presented here. In the case of denitrification it is thought that oyster shell surfaces contribute to elevated levels of denitrification. Fish production estimates may also initially be lower on alternative substrates, as the structural complexity which benefits juvenile fish and invertebrates may be lacking in the early stages of restoration, before a living veneer of oysters is accumulated.
ba
c d

Setting Objectives for Oyster Habitat Restoration using Ecosystem Services: A Manager’s Guide | 13
Figure 5: Artificial substrates used to construct oyster reefs, (a) cement castles VA, B. Hancock, (b) rebar frames TX, C. Smith, (c) limestone marl TX, J. Foster, (d) reef balls FL, B. Hancock.
c d
ba

14 | Setting Objectives for Oyster Habitat Restoration using Ecosystem Services: A Manager’s Guide
Box 1: What is meant by an oyster reef or bed?
“Very few people know what is and what constitutes a “natural bed”. Indeed it is only a matter of opinion at the best” (Winslow, 1889).
A comprehensive definition of an oyster reef or bed has challenged biologists for over a century. Yet it is essential to have a definition of the habitat, as this determines the objectives and the monitoring required for each restoration project. Simplistically, oyster habitat refers to substrates with a veneer of live oysters, with the edge of the habitat defined by the density of living oysters, at an appropriate spatial scale.
We provide the following definitions at three different spatial scales.
Oyster reefs and beds
Oyster reefs and beds are biogenic structures formed by oysters that occur at high densities and provide the dominant structural component and significant vertical relief through their accumulated physical structure on otherwise unstructured bottom. Beck et al. (2009) identify reefs having significant vertical relief (>0.5m), while beds have lower relief (sensu Coen and Grizzle, 2007). Overall such structures are accreting through the continuing deposition of shell matter at rates sufficient to keep up with sedimentary dynamics (Mann et al., 2009) although there is likely to be small-scale (meters) patchiness in oyster cover. In some places it is likely that vertical accretion may be restricted by tidal exposure, leaving a non-accreting reef flat.
Oyster reef systems
Oyster reef systems represent a wider ecological network of which reefs and beds are the core structures – in many estuaries beds and reefs are found with an apparently natural level of fine-scale patchiness: areas of dense growth interspersed with areas of non-oyster substrate at scales of one to tens of metres. These larger reef systems may include areas of bare substrate, submerged or intertidal vegetation such as seagrasses, mangroves and salt marsh, but with a likely high degree of connectivity with the dominant oyster reefs or beds. By contrast, small or isolated oyster beds or reefs may not form part of a reef system. There are parallels with coral reef ecology here: many coral reef ecologists include reef flats, lagoons, coral cays and even small areas of contiguous seagrass and mangrove within their definitions of coral reef ecosystems, while isolated reef patches or bommies may not form part of any larger reef system (Spalding et al., 2001).
Oyster grounds
Oyster grounds encompass the wider community complex of which oyster reefs and beds are clearly important parts, but which also may include large areas of sediments, submerged aquatic vegetation and shell rubble. Such areas would broadly equate with “fishable areas” and are used here to capture the more generic oyster grounds of many historic studies.
It is critical that the definition used in any restoration project is in line with the expectations of the reporting for any funding body. The definitions put forward here are in line with those proposed in Baggett et al. (2014), who set out preferred metrics for monitoring restoration efforts. Baggett et al. (2014) should be referred to for further information, specifically with regards to minimum densities. https://www.conservationgateway.org/ConservationPractices/Marine/Pages/oystermonitoringhandbook.aspx.

Setting Objectives for Oyster Habitat Restoration using Ecosystem Services: A Manager’s Guide | 15
Historic declineOyster reefs and beds have been an important feature of estuaries in North America for at least the past 10,000 years, since the late Pleistocene. Early European explorers described oyster reefs as navigational hazards, in particular on the Atlantic and Gulf coasts where the reef building species Crassostrea virginica is found (see Box 2).
Pre-colonial inhabitants made extensive use of oysters as both a food and building material and oysters were a dietary staple in the early years of European settlement along the coasts of the United States. At first they were abundant and easily collected from the shallows and intertidal areas, but harvesting pressure quickly led to declines. Hand harvesting was supplemented by the use of boats and long-handled tongs, and as densities declined and accessible areas became depleted, this was followed by an increase in mechanical dredging. Dredging allowed the exploitation of deeper beds and more remote locations. Without adequate regulation to protect the beds and reefs, their decline soon followed (see Box 2, Figure 6). Both living and dead oysters contribute to the growth and persistence of oyster reef or bed habitats, therefore the large-scale removal of oysters and shell matter led to a loss of habitat, as well as a decline in living individuals. This pattern of over exploitation spread rapidly down the coast of the U.S. away from major urban centers (Kirby, 2004).
Figure 6: The scale of oyster fishing in the early 1900’s. Photos: NOAA National Marine Sanctuaries, Courtesy of National Archives.

16 | Setting Objectives for Oyster Habitat Restoration using Ecosystem Services: A Manager’s Guide
Box 2: The magnificence of oyster reefs before they were impacted
It is challenging to envisage the importance and magnitude of oyster reefs and beds historically, primarily because much of the decline has taken place outside of living memory. Fortunately there are a number of descriptions of oyster habitat from the early explorers of the U.S. coasts. A handful of examples are given below to provide context to the documented declines.
Massachusetts
“[The Oyster] often measures 12 or 15 inches in length, but seldom more than 3 inches in breadth.” (Gould, 1841).
“In 1637 Thomas Morton, writing of the Plymouth Colony, says: “ There are great stores of oysters in the entrances of all rivers; they are not round as those of England, but excellent, fat and all good. I have seen an oyster bank a mile at length.” (Brooks et al., 1884)
Virginia
“The abundance of oysters is incredible. There are whole banks of them so that the ships must avoid them. A sloop, which was to land us at Kingscreek, struck an oyster bed, where we had to wait about two hours for the tide. They surpass those in England by far in size, indeed they are four times as large. I often cut them in two, before I could put them into my mouth.”(Michel 1702, translated in Hinke, 1916)
Florida
“Through many a shallow and barrier, the latter made up of oyster banks, the Caloosahatchee River is ascended” (The New York Times, Anon, 1884)
“There is a luxuriant growth of oysters in parts of Biscayne Bay…growing in dense reefs or beds in the open bay, and on the roots and submerged limbs of mangroves and other trees along the shore.” (Smith, 1896)
Louisiana
“The shoals and oyster banks extending out to sea between four and five leagues [~30km], and leaving only a very narrow and intricate channel” (Dumain, 1832)
Washington
“Natural oyster-beds stretched over a distance of thirty miles in length and from four to seven in width.” (Bancroft, 1890, speaking of Willapa Bay in ca.1850)
“Oystering as an industry dates back to the middle of the last century… In those times a much larger area than now was covered with natural beds of oysters.” (Bush, 1900)

Setting Objectives for Oyster Habitat Restoration using Ecosystem Services: A Manager’s Guide | 17
While there is little doubt that overexploitation has been the primary driver of decline in oyster abundance throughout the U.S., coastal development, water quality degradation, alteration of freshwater flows and oyster disease have also contributed to the loss of habitat. The decrease in living biomass of oysters in U.S. estuaries is estimated to be 88% over the past 120 years alone (zu Ermgassen et al., 2012), and losses likely greatly exceed this estimate, as many of the mapped areas on which this estimate was based were already heavily exploited before the areas were mapped and baselines could be established (see Box 3). It is therefore not possible to accurately quantify the original, natural, oyster abundance in most bays and estuaries. In particular, we know that exploitation was intense on the north-eastern Atlantic from Connecticut to the Chesapeake, and on the West coast spreading out from San Francisco (Box 3; Kirby, 2004).
Box 3: Oyster reefs were impacted before comprehensive surveys were undertaken
“As man has uprooted the greatest forests, so can he also annihilate the richest oyster beds.” (Moebius, 1883)
Already at the turn of the century there was extensive evidence of the degraded status of oyster reefs throughout much of the U.S.. This was particularly true of the northeastern Atlantic and the Pacific coast. A number of historic citations highlight the status of oyster reefs from a number of locations throughout the U.S., in some instances as “baseline” surveys were undertaken.
Massachusetts: “The early settlers of New England continually refer to the abundance of oysters at points where not a single oyster can now be found….The oyster beds in these two rivers [Mystic and Charles Rivers] are spoken of by many of the early writers, but they are now gone so completely that there is not even a tradition to mark the place where in 1634, according to Wood, “ the oyster bankes do barre out the bigger ships.”(Brooks, 1884)
New York: “A good instance of this deterioration is found in the famous Saddle Rock beds (area 639 acres) near Great Neck, L. I.. Years ago this bed produced large quantities of marketable oysters of excellent quality. The record of my recent investigation of the bed shows: “Dredged seventy-five yards, found a roller skate, bottles, ashes, pasteboard, refuse, eight large oysters and a peck of small seed.” (Blackford, 1887)
New Jersey: “The natural beds along the coast are numerous and valuable, and they formerly abounded in large, fine oysters, but for many years they have furnished scarcely any oysters large enough for food” (Brooks, 1884)
Maryland: “The area of oyster grounds which were formerly productive, but which are now practically barren and without the ability to be restocked through natural means, aggregates about 100,000 acres.” (Grave, 1912)
South Carolina: “Many regions appear to have become depleted from overfishing.” (Battle, 1891)
Georgia: “In regard to the condition of the natural oyster beds of the State of Georgia, it was observed that there was a general depletion caused by the excessive fishing, and that the nearer the market the more were the beds depleted. In fact, the area which I have indicated on the charts as natural oyster beds really include all that area where oysters have grown, and practically nothing but shells now remain.” (Drake, 1891)
Louisiana: “Barataria Bay, Jefferson Parish, at one time contained large natural oyster reefs, but these are now extinct, as a result of increased salinity after improvement of the levee system.” (Schlesselman, 1955)
Texas: “Galveston bay has a greater area of natural oyster beds than any other bay in Texas, but the reefs are not so plentifully supplied with oyster as in some others in the State. This is to some extent due to overfishing.” (Stevenson, 1893)
Washington: “The 1870’s ushered in the peak of Oysterville’s prosperity….Then started the decline. A mysterious oyster malady, slight at first, began to gain headway, starting in 1881.” (Tompkins, 1932)

18 | Setting Objectives for Oyster Habitat Restoration using Ecosystem Services: A Manager’s Guide
Ecosystem services The magnitude of decline of oysters and the habitat they create in many bays is such that restoration to historical abundance may not be possible. Moreover it is important to recognize that conditions in many bays and estuaries are different now from when oysters were abundant 100 to 200 years ago, so in many settings it may not be ecologically or physically possible to restore to historical baselines. An alternative objective for restoration is to focus on restoring ecosystem services, and the associated benefits that these services provide to people.
Ecosystem services arise both as a result of the physical structure of oyster reefs and beds, and from the biological processes of living oysters. They include providing fisheries habitat, filtering the water column, enhancing denitrification on reef materials and in surrounding sediments, coastal protection, and enhancing benthic biodiversity (Grabowski and Peterson, 2007, Coen et al., 2007, Piehler and Smyth, 2011, zu Ermgassen et al., 2013a, zu Ermgassen et al., 2013b). The importance of the ecosystem services provided by natural habitats such as oyster reef has been recognized by the Office of the President in the recent memorandum directing federal agencies to factor the value ecosystem services into federal decision making (Executive Office Memorandum M-16-01, 2015).
Ecosystem services also provide benefits to people that can be quantified, such as tonnes of additional fish landed, increased tourism spending or amenity value resulting from cleaner water, progress towards mandated total maximum nitrogen loads through the tonnes of nitrogen removed, or the value of the houses, infrastructure and productive natural habitat protected. These benefits have been valued between $5500 and $99,000 per ha per year (Grabowski et al., 2012).
Water clarity Oysters are filter-feeding bivalves. Small particles of plankton and non-living matter that are suspended in the water (greater than 5 µm in diameter) are filtered by oysters with high efficiency. Selected particles are ingested, while the remaining particles are bound together in mucus pellets termed pseudofeces and ejected. These pellets sink and particles are thus removed from the water column and deposited on the seafloor. This drawdown of suspended particles through the filter feeding activity of oysters (and other fauna associated with an oyster reef) can lead to enhanced water clarity, which results in greater penetration of sunlight through the water to the sea bed, with the potential of facilitating improved growth of submerged aquatic vegetation (Wall et al., 2008) and oxygen supply. Improved water clarity and ecological function may lead to increased recreational activities which in turn lead to improved property values and other flow on economic benefits.
Nitrogen removalThe production of waste matter by oysters results in biodeposits that include both feces and the pseudofecal pellets. This organic material enriches the bottom sediments nearby, increasing the amount of organic nitrogen and altering the microbial community (Richardson et al., 2008). One important outcome is that rates of bacterially driven nitrogen removal - denitrification - can be greatly enhanced in the sediments (Newell, 2004, Newell et al., 2005, Kellogg et al., 2011).
Denitrification is a process by which organic nitrogen is transformed into inert nitrogen gas by bacteria, effectively removing “reactive” or biologically available nitrogen from the system. This inert nitrogen diffuses harmlessly back into the atmosphere from coastal waters, re-joining the inert nitrogen that comprises 78% of the air we breathe. Given that reactive nitrogen from anthropogenic sources – fertilizer runoff and wastewater from urban and suburban areas, atmospheric deposition from burning fossil fuel, etc. - is a major driver of eutrophication and low oxygen levels in many U.S. estuaries, this service could become one of considerable monetary value (Grabowski et al. 2012). The amount of denitrification that occurs depends on a number of factors, including the overall biomass of oysters on a reef, and the structure of the reef itself. The factors affecting the rate of denitrification are not yet understood well enough to confidently predict the amount of nitrogen that would be removed by a unit area of oyster habitat in a given

Setting Objectives for Oyster Habitat Restoration using Ecosystem Services: A Manager’s Guide | 19
bay or estuary. Consequently it is not possible to set objectives for the desired level of denitrification from restored oyster habitat at this time, though this is an active field of research with one aim being to achieve this outcome (Kellogg et al. 2014).
The biodeposition of feces and pseudofeces by oysters also enhances the draw-down of organic matter to the sediments. These deposits can in turn become buried, also increasing storage of nitrogen from the water column. Enhanced rates of burial of organic matter is not the only way in which oysters lock up and reduce the availability of biologically active nitrogen. Oysters also assimilate nitrogen into their shells and tissues as they grow. Both burial and assimilation of nitrogen may be enhanced by enhancing oyster densities. The degree to which sediments remain buried, however, varies locally with currents and is therefore challenging to quantify across space and time.
Non-oyster fishery enhancementOyster reefs and beds typically have vertical relief and a higher structural complexity than the surrounding seafloor (see definitions in Box 1), and as such provide valuable habitat for juvenile fish and crustaceans (Figure 7). Numerous studies have shown that restored oyster reef supports higher densities of juvenile fish and crustaceans than unrestored sites (Tolley and Volety, 2005, Stunz et al., 2010). Juvenile fish benefit from the higher habitat complexity, which reduces predation and increases prey density (Boesch and Turner, 1984). There have been significant losses of complex habitat in estuaries worldwide (Waycott et al., 2009, Airoldi and Beck, 2007), therefore restoration may have a substantial impact, increasing not only the abundance, but also the diversity of associated fish and benthic fauna (e.g. Tolley and Volety, 2005, Shervette and Gelwick, 2008). The increase in fish abundance and diversity can have a direct impact on commercial non-oyster fisheries landings and revenues as well as enhancing the value of recreational fishing activity.
Figure 7: Juvenile fish utilizing oyster reef, B. DeAngelis.

20 | Setting Objectives for Oyster Habitat Restoration using Ecosystem Services: A Manager’s Guide
Coastal protectionThree-dimensional structures arrayed along shorelines in shallow areas can provide coastal protection – attenuating waves, reducing coastal erosion, and encouraging accretion of sediments along adjacent vegetated habitats (Figure 8)(Borsje et al., 2011). Oyster reefs have been shown to have this effect in a number of locations (Piazza et al., 2005, Scyphers et al., 2011). While the provision of this service may be variable from location to location and with changes in reef structure (Stricklin et al., 2010, Scyphers et al., 2011, Meyer et al., 1997), oyster reefs play a critical shoreline protection role in some systems. The coastal protection capacity of oyster reefs has been described as an alternative to fully engineered solutions such as bulkheads (see CoastalResilience.org) or as an additional risk reduction factor in conjunction with engineered solutions. Natural solutions may have lower installation or maintenance costs versus that of engineered alternatives. Additionally, oyster reefs may provide a suite of other ecosystem services in addition to shoreline protection. Restored oyster reefs have been valued as high as $278,000 to $2.3 million (USD 2012) per mile from fish production and shoreline protection alone (Kroeger and Guannel, 2014).
Figure 8: Oyster reef constructed to reverse erosion and promote sediment deposition and marsh growth, B. Hancock.

Setting Objectives for Oyster Habitat Restoration using Ecosystem Services: A Manager’s Guide | 21
Other ecosystem servicesIncreased biodiversity is a common conservation objective. Oyster reefs support a higher biodiversity of invertebrates and fish than surrounding unstructured habitats (e.g. Rodney and Paynter, 2006). This is primarily because small animals benefit from the three-dimensional structure provided by the oyster shells, either by avoiding predators, or because they form a surface to attach to (Tolley and Volety, 2005, Gedan et al., 2014). The biodepostion by oysters enriches the surrounding sediments with organic matter and also provides an abundant food source to a host of important prey species, further enhancing the biodiversity supported by this habitat. Increased fish production is a valuable service that can be viewed as a sub-set of the increased biodiversity and increased biomass associated with oyster reefs.
Oysters have been a significant feature of coastal communities for millennia. As such, the culture associated with harvesting and consumption of oysters is deeply rooted and highly valued. While it is challenging to quantify services such as cultural value, it is important that these values are recognized.
Finally, harvesting of the oysters themselves has been a valuable social and economic component of many coastal communities (Figure 9). The global decline in oyster stocks highlights the difficulty in managing the resource sustainability and there has been a consequent decrease in the number of fishers and the contribution of oyster harvest to local economies. In the future managing oyster resources will involve ensuring the sustainability of the fished component of the resource, as well as managing for re-building the other ecosystem services on behalf of the sections of the community that rely on them.
Figure 9: Traditional oyster harvest using tongs. Photo: NOAA National Marine Sanctuaries. Courtesy of National Archives.

22 | Setting Objectives for Oyster Habitat Restoration using Ecosystem Services: A Manager’s Guide
Chapter 3: Setting Ecosystem Service Objectives
Revising the role of historic abundance in setting objectivesGiven that the roots of habitat restoration lie in regaining habitats that have become lost or degraded, restoring the full or a proportion of the historic extent is frequently a cited aim of restoration efforts. We caution against the sole use of historic extent in setting restoration objectives. Conditions within the bay or estuary may no longer be conducive to supporting the full historic extent of oyster reef habitat. The interaction between coastal user groups and oyster reef is also likely to have changed over time. Historic extent can, nevertheless, play an important role in a) informing stakeholders about the potential of the system and, b) setting restoration into an ecological and historical context. When considering historic data as one element in restoration decision-making one should be aware that the known baseline may be shifted (see Boxes 3 and 4). A lack of quantitative historic data should not preclude restoration.
Box 4: Shifted baselines
Human exploitation of coastal seas has a long history, as evidenced by middens and other archaeological sites (Rick and Erlandson, 2009). From studies of such sites it is clear that exploitation may have impacted shellfish habitats long before modern extraction techniques. As the seas were generally historically viewed as being too vast to impact, and the resources were therefore also considered to be limitless, no surveys were made of marine resources until the 1800’s, when it became clear that exploitation was indeed impacting supply. As a result there are virtually no quantitative baseline data for pristine marine and coastal systems (Roberts, 2007). Under these circumstances it is important to be aware of the risk of assessing all subsequent change relative to a shifted baseline. The shifting baseline syndrome refers to situations when assessments of change are made relative to a baseline that may itself represent substantial change from pristine. Shifting baselines are frequently encountered in fisheries due to the late start in collecting relevant biological data. Even quantitative baselines should therefore be utilized with caution and an understanding of the limitations the baseline presents.
In the case of oysters, early surveys represent perhaps the best historic record of any marine habitat (zu Ermgassen et al., 2012). The available records, however, are not complete, nor do they represent habitat at a universal stage of exploitation. As the overexploitation of oysters appeared to spread down the coasts away from major urban centers (Kirby, 2004), estuaries in the northeastern U.S. and near San Francisco on the West coast in particular clearly represent an already shifted baseline (zu Ermgassen et al., 2012). This is because the oyster populations were heavily exploited at the time the surveys were undertaken. Care should therefore be taken in interpreting the historic data available in these estuaries.
While objectives based purely on historic extent should be avoided, objectives may be set on the basis of ecosystem service provision, but reporting could include the proportion of historic extent restored. This can be a useful messaging tool, and can set the aims of restoration into context.

Setting Objectives for Oyster Habitat Restoration using Ecosystem Services: A Manager’s Guide | 23
Restoring for improved ecosystem servicesRecovery of ecosystem services is now a primary motivation for many oyster reef restoration projects. While the historic decline can inform the need and the potential for restoration (Lipcius et al. 2015 ), the goal of the restoration project should ideally reflect its aims as communicated to the stakeholder groups involved. By setting goals based on the ecosystem services stakeholders are seeking to regain, an open and honest dialogue can be maintained throughout.
The following chapters outline the methods for setting estuary-scale restoration objectives on the basis of the ecosystem services; water filtration, non-oyster fisheries. The logic for using nitrogen removal is presented and although shoreline protection tends to be focused on an adjacent stretch of shoreline rather than at the estuary scale, an introduction to this important service is also included.
The models set out in the following chapters represent a realistic, but not guaranteed level of ecosystem service provision. A number of factors may either positively or negatively affect the true values at any given site.
Photo: Intertidal oyster reef, Florida, A. Birch.

24 | Setting Objectives for Oyster Habitat Restoration using Ecosystem Services: A Manager’s Guide
Chapter 4: Stakeholder Engagement
Determining what is of importance to stakeholdersThe motivation to restore oyster reefs may arise from any of the many potential benefits oyster reefs provide (see Chapter 2). In order to select an appropriate restoration objective, it is necessary first to identify the relevant stakeholders in the restoration site, and to determine which of the numerous services are of greatest importance to them.
The success of restoration projects is heavily dependent on gaining and maintaining the support of stakeholders. It is therefore important to provide the opportunity for stakeholders to communicate effectively what they hope to gain from restoration before the start of the restoration activity and ideally from its very conception. The provision of ecosystem services may vary spatially and with the design of the restoration project, therefore early engagement can allow for stakeholder engagement to feed into restoration design and implementation. In order to maintain the support of stakeholders, it is important that the status of the restoration project, both generally and with respect to the ecosystem service(s) of interest, is reported back to them throughout the restoration and monitoring process. Some further guidance on stakeholder engagement is outlined in Brumbaugh et al. (2006) and Leonard and Macfarlane (2011).
The following chapter provides information on low-cost methods for identifying stakeholders and understanding which ecosystem services matter most to them.
Stakeholder engagement: Identifying ecosystem service benefitsStakeholder engagement goes beyond simply asking stakeholders about their preferences and concerns. Stakeholder engagement also encompasses understanding the socio-cultural context and building relationships with communities. Engaging stakeholders early in the process has several important advantages, including reducing conflict and increasing support for restoration projects. The NOAA Coastal Services Center report, Introduction to Stakeholder Participation (2007), succinctly highlights a full suite of reasons why engaging communities before beginning a restoration project makes sense:
• Produce better outcomes or decisions
• Garner public support for agencies and their decisions
• Bring to light important local knowledge about natural resources
• Increase public understanding of natural resource issues or management decisions
• Reduce or resolve conflicts between stakeholders
• Increase compliance with natural resource laws and regulations
• Help agencies understand flaws in existing management strategies
• Create new relationships among stakeholders
Source: NOAA Coastal Services Center 2007
If resources are available, it is often worthwhile to conduct a more in-depth analysis of the degree of stakeholder support in the region surrounding the upcoming restoration project. This is particularly true for large-scale restoration projects, restoration projects with potential negative impacts on certain stakeholder groups, and/or restoration projects that have the potential to be politically controversial. The NOAA Coastal Services Center report (2007) provides valuable information on identifying and analyzing stakeholders and Chapter 3 of The Nature Conservancy’s

Setting Objectives for Oyster Habitat Restoration using Ecosystem Services: A Manager’s Guide | 25
guidebook on Strengthening the Social Impacts of Sustainable Landscapes Programs (Wongbusarakum et al., 2014) is also a good reference for engaging stakeholders. Although aimed at indigenous communities in developing countries, most of the process is still relevant to the U.S., particularly when working with communities that are relatively dependent upon natural resources.
Rapid Stakeholder AssessmentIf resources are scarce and time constraints exist, it is worth conducting a rapid stakeholder assessment. Although the intent of a rapid stakeholder assessment is to be efficient and low-cost, we recommend that you allow for at least two to three months to conduct the analysis. The goal of the assessment is twofold, 1) understanding how stakeholder groups interact with natural systems in the region, particularly those aspects of the natural system that will be improved by the restoration project, so that we can engage these stakeholders to gain support for a given issue, and 2) to better match conservation objectives with community needs. Guidelines for conducting a rapid stakeholder assessment have been adapted from Schuster and Doerr (2015).
To conduct a rapid stakeholder assessment for a given ecological restoration project, follow these simple steps:
1. Convene an interdisciplinary work group which represents a variety of areas of expertise, such as ecology, fisheries management, hydrology, economics, political science and engineering.
2. Define the geographic boundaries and scale of interest. This will vary depending upon biophysical aspects of the restoration project, hydrology, jurisdiction, and location of stakeholders who are benefiting or impacted by the project. Examples include a municipality or multiple municipalities, county, watershed, or estuary.
3. List the ecosystem service benefits that will result from the upcoming restoration/protection project(s). Consult with the interdisciplinary work group to determine which benefits are most likely.
4. List all relevant stakeholders to the project, including beneficiaries and those who may be impacted negatively, and those who have the power to influence the success or failure of the project.
5. Determine the relative importance of each ecosystem service benefit, based upon expected number of beneficiaries and magnitude of benefit.
6. Understand and be able to effectively communicate potential trade-offs in ecosystem service delivery.
A rapid assessment will not answer all relevant questions, but can help to highlight information and knowledge or data gaps, as well as to establish next steps. Note that while steps one through six are listed sequentially, the process is iterative and may involve circling back to previous steps as additional information is gained. Also note that while many of the steps of the rapid assessment are focused on the project scale, the assessment can also be applied to the estuary scale (defining the geography of interest takes place in step two).
When listing expected ecosystem service benefits for a project, it is recommended to list all potential benefits from the full project, not just those directly resulting from the oyster reef restoration. For instance, the full project budget for an oyster restoration project may also include renovations to a marina, or construction of an education center or boat ramp. It is advantageous to list the full suite of benefits that may result from the upcoming restoration project for two reasons, first because it will lead to more effective stakeholder engagement, and second, because the multiple benefits from a project can often enable you to access additional funding.
The most efficient way to collect information about stakeholder preferences and perspectives on ecosystem service benefits can be through a combination of a desktop analysis and expert and key informant interviews and/or focus groups. This can be done through professionally facilitated meetings or through smaller informal meetings and discussion groups. Doing so not only helps to identify the desired outcomes, it also helps identify factors that

26 | Setting Objectives for Oyster Habitat Restoration using Ecosystem Services: A Manager’s Guide
stakeholders are likely to support, likely to oppose, or have a particular interest in influencing in the restoration project. Stakeholders may for instance include any number of individuals (homeowners, voters, tourists, etc.); federal, state or local government officials; non-profit organizations; or business owners. We expect each of these stakeholder groups will have different needs, values and risks which they are facing and thus, they are likely to have different priorities in terms of key ecosystem service benefits of interest.
Background research to answer the questions in the rapid stakeholder assessment can include but is not limited to:
• Reviewing organizational websites from local groups,
• Searching for relevant reports and grey literature,
• Reading relevant newspaper articles,
• Reviewing data from the region (for instance, USDA Agricultural census data or agricultural statistics which are provided by state and by county, US Census data, GIS data or NOAA storm surge data),
• Reviewing published academic articles when available and relevant to the local context and conditions. These are especially useful when they contain survey data from your geography of interest, and
• Accessing GIS data layers.
Next, proceed with key informant interviews. Key informants are individuals in a community who are knowledgeable about the community or a specific stakeholder group. Key informants may include governmental officials, business owners, extension agents, non-profit leaders, health care employees, residents, or religious groups, among others. Key informants can either be identified through the background research or through word of mouth. It is recommended to set a predetermined list of eligibility criteria, such as a minimum number of years living in the region, criteria on certain areas of expertise, or demonstration of other relevant characteristics. Unlike surveys, these interviews can be fairly unstructured, without a formal list of questions. Nonetheless, it helps to identify a small list of informal questions through background research before beginning. One important question to ask is always, “Who else would you recommend that I interview on this subject?” Social scientists refer to this as snowball sampling, where each interview leads to more contacts and more interviews.
If time permits, focus groups can be an additional source of information on a community or issue. A focus group consists of approximately 6-12 individuals. The focus group may include individuals from the same stakeholder group or may include a diverse mix of stakeholders, depending upon the specific research questions. Focus groups are an efficient way of gaining additional information because it allows a researcher to obtain answers from multiple individuals in a single setting. Focus groups can also be useful because the cross-dialogue can inspire additional conversation. However, focus groups are not recommended in situations where the subject matter is controversial or sensitive and could result in privacy concerns.
If you intend to conduct multiple interviews, lead focus groups, or implement surveys during the stakeholder engagement phase, first determine if your institution or funder has a standard operating procedure and approval process regarding research involving human subjects. Typically, the researcher must submit a proposal to their institution’s human subject review committee. The committee is designed to ensure proper respect and ethics related to those who are being asked to participate.
Setting Objectives for Oyster Habitat Restoration using Ecosystem Services: A Manager’s Guide | 27
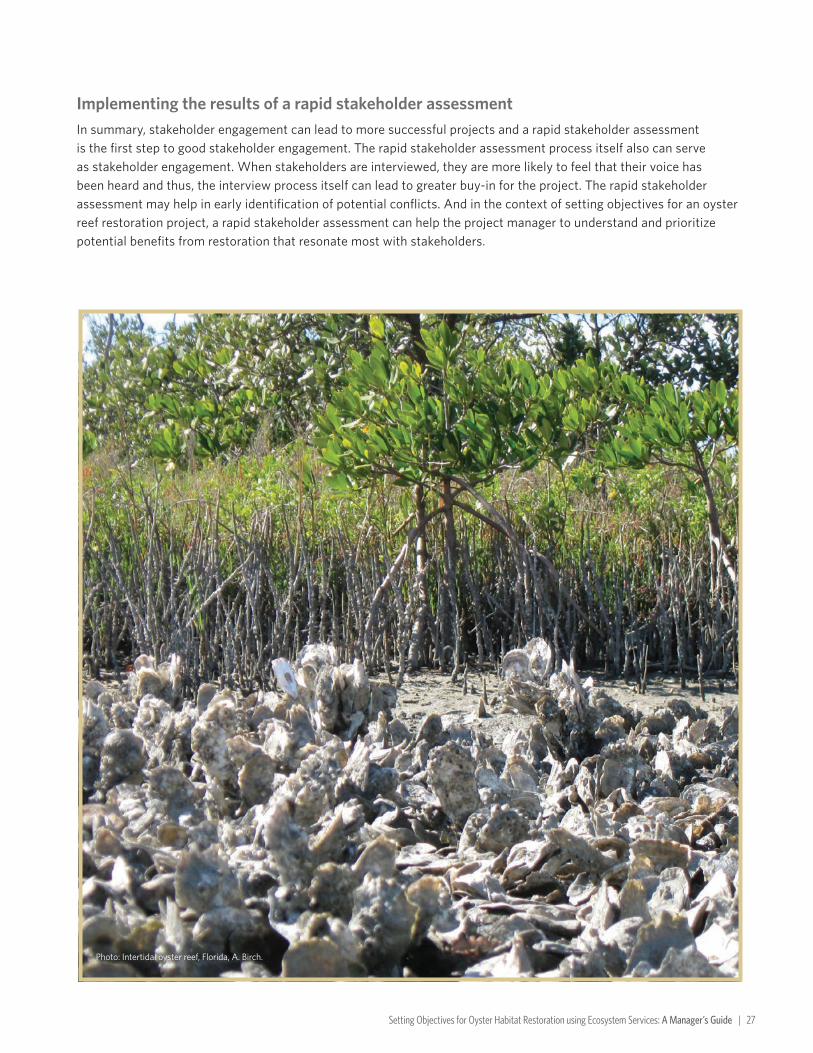
Implementing the results of a rapid stakeholder assessmentIn summary, stakeholder engagement can lead to more successful projects and a rapid stakeholder assessment is the first step to good stakeholder engagement. The rapid stakeholder assessment process itself also can serve as stakeholder engagement. When stakeholders are interviewed, they are more likely to feel that their voice has been heard and thus, the interview process itself can lead to greater buy-in for the project. The rapid stakeholder assessment may help in early identification of potential conflicts. And in the context of setting objectives for an oyster reef restoration project, a rapid stakeholder assessment can help the project manager to understand and prioritize potential benefits from restoration that resonate most with stakeholders.
Photo: Intertidal oyster reef, Florida, A. Birch.

Setting Objectives for Oyster Habitat Restoration using Ecosystem Services: A Manager’s Guide | 28
Chapter 5: Water Clarity
Oysters are filter feeding bivalves. Like most bivalves, they draw in a current of water by beating a series of small hairs, or cilia, along their gills, which they then use to sort particles encountered in the water column. Particles are efficiently sorted by the cilia and either passed to the mouth or bound in mucus and expelled as pseudofeces. By removing small particles from the water column and ejecting them as larger biodeposits (feces or pseudofeces) oysters can improve water clarity (Wall et al., 2011). The volume of water cleared by an oyster is determined by the species (Moehlenberg and Riisgaard, 1979), the size of the oyster (Gerdes, 1983), the temperature (Haure et al., 1998), the sediment load (Barille et al., 1997), and salinity (Hutchinson and Hawkins, 1992). The potential for oyster filtration to have a marked effect on water clarity is therefore dependent both on the abundance of oysters and on local conditions. This relationship is independent of whether an oyster is in an aquaculture setting or a natural reef.
Figure 10: Oysters in a semi enclosed system, M. Dumesnil.
Water filtration can be calculated online!http://oceanwealth.org/resources/oyster-calculator/
Setting Objectives for Oyster Habitat Restoration using Ecosystem Services: A Manager’s Guide | 29
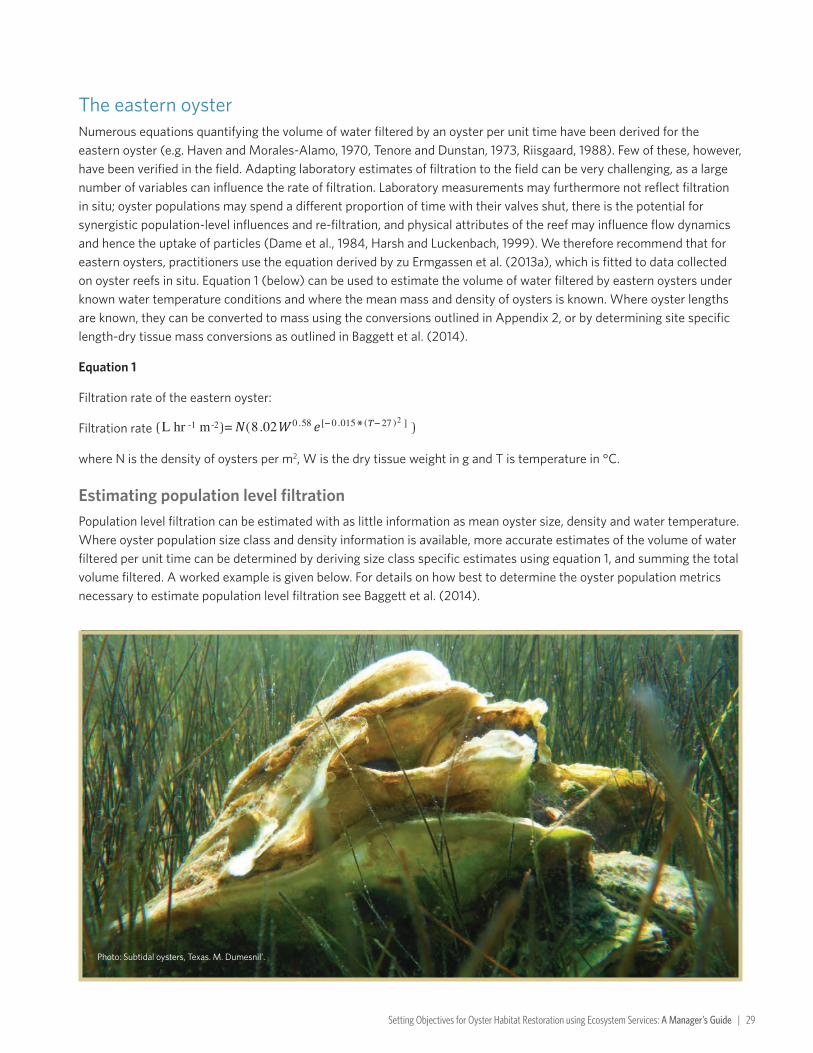
The eastern oysterNumerous equations quantifying the volume of water filtered by an oyster per unit time have been derived for the eastern oyster (e.g. Haven and Morales-Alamo, 1970, Tenore and Dunstan, 1973, Riisgaard, 1988). Few of these, however, have been verified in the field. Adapting laboratory estimates of filtration to the field can be very challenging, as a large number of variables can influence the rate of filtration. Laboratory measurements may furthermore not reflect filtration in situ; oyster populations may spend a different proportion of time with their valves shut, there is the potential for synergistic population-level influences and re-filtration, and physical attributes of the reef may influence flow dynamics and hence the uptake of particles (Dame et al., 1984, Harsh and Luckenbach, 1999). We therefore recommend that for eastern oysters, practitioners use the equation derived by zu Ermgassen et al. (2013a), which is fitted to data collected on oyster reefs in situ. Equation 1 (below) can be used to estimate the volume of water filtered by eastern oysters under known water temperature conditions and where the mean mass and density of oysters is known. Where oyster lengths are known, they can be converted to mass using the conversions outlined in Appendix 2, or by determining site specific length-dry tissue mass conversions as outlined in Baggett et al. (2014).
Equation 1
Filtration rate of the eastern oyster:
Filtration rate
where N is the density of oysters per m2, W is the dry tissue weight in g and T is temperature in °C.
Estimating population level filtrationPopulation level filtration can be estimated with as little information as mean oyster size, density and water temperature. Where oyster population size class and density information is available, more accurate estimates of the volume of water filtered per unit time can be determined by deriving size class specific estimates using equation 1, and summing the total volume filtered. A worked example is given below. For details on how best to determine the oyster population metrics necessary to estimate population level filtration see Baggett et al. (2014).
Photo: Subtidal oysters, Texas. M. Dumesnil’.
30 | Setting Objectives for Oyster Habitat Restoration using Ecosystem Services: A Manager’s Guide
Case Study: Estimating population level filtration
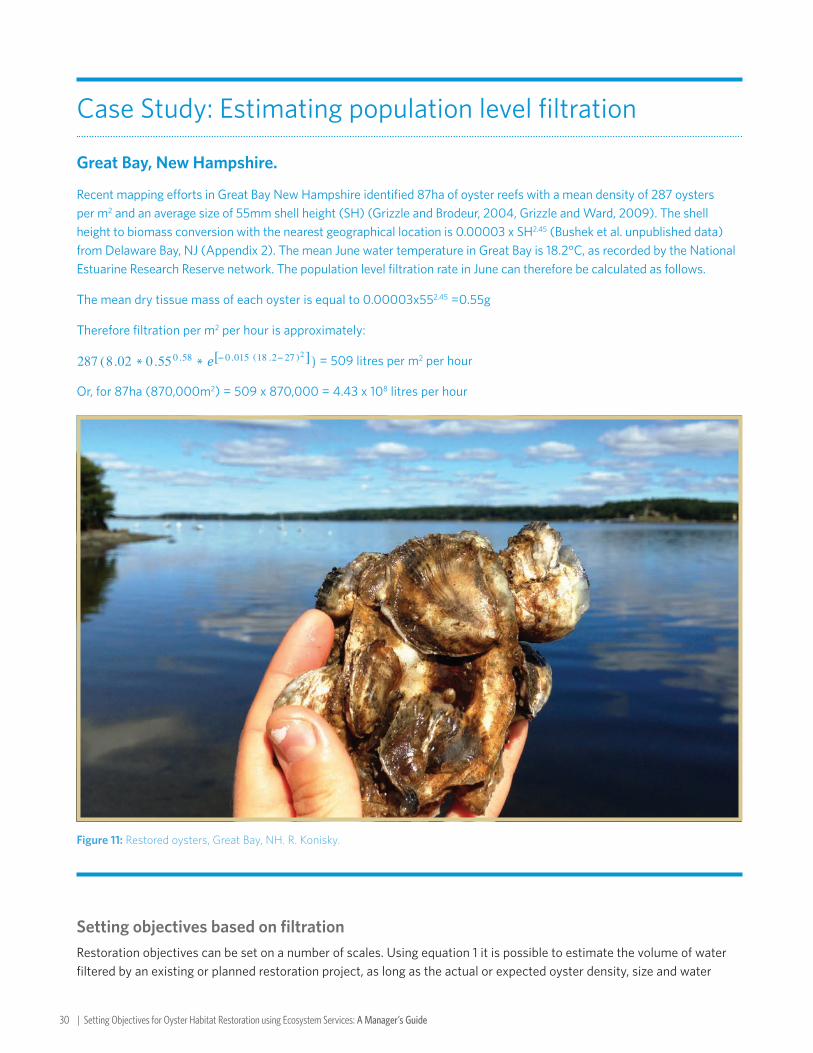
Great Bay, New Hampshire.
Recent mapping efforts in Great Bay New Hampshire identified 87ha of oyster reefs with a mean density of 287 oysters per m2 and an average size of 55mm shell height (SH) (Grizzle and Brodeur, 2004, Grizzle and Ward, 2009). The shell height to biomass conversion with the nearest geographical location is 0.00003 x SH2.45 (Bushek et al. unpublished data) from Delaware Bay, NJ (Appendix 2). The mean June water temperature in Great Bay is 18.2°C, as recorded by the National Estuarine Research Reserve network. The population level filtration rate in June can therefore be calculated as follows.
The mean dry tissue mass of each oyster is equal to 0.00003x552.45 =0.55g
Therefore filtration per m2 per hour is approximately:
= 509 litres per m2 per hour
Or, for 87ha (870,000m2) = 509 x 870,000 = 4.43 x 10⁸ litres per hour
Figure 11: Restored oysters, Great Bay, NH. R. Konisky.
Setting objectives based on filtrationRestoration objectives can be set on a number of scales. Using equation 1 it is possible to estimate the volume of water filtered by an existing or planned restoration project, as long as the actual or expected oyster density, size and water

Setting Objectives for Oyster Habitat Restoration using Ecosystem Services: A Manager’s Guide | 31
temperature is known in addition to the area of oyster reef restored. A small-scale objective can be established with the aim of restoring an oyster population capable of filtering a given volume of water at a given time of year. The influence of filtration is often localized, and this may therefore be an appropriate small scale goal.
Water temperature has a strong influence on filtration rate. The appropriate seasonal temperature should therefore be used in this calculation. Mean monthly water temperatures representative of large bay units can be found in Appendix 1. Water temperature can, however, vary substantially within an estuary and at varying depths. Where possible temperature at the restoration site should be used to derive estimates of volume filtered.
Larger-scale objectives can be set on the basis of achieving full estuary filtration (see below for details). This could form the long-term objective for many smaller restoration projects, or may be appropriate for smaller restoration efforts in more contained settings such as a creek. Estimating the degree of restoration necessary to achieve full estuary filtration relies on knowledge of the residence time of the water in the estuary. Where the relevant data are known, it is possible to derive your own estimate of residence time at the scale most appropriate to you, using the methodology outlined in http://ccrm.vims.edu/research/water_sediments/tidal_flushing/TidFlush_final.pdf. Residence times of whole estuaries can be found in Appendix 1 or Bricker et al. 2007.
Full estuary filtration as an objectiveFull estuary filtration is defined as “filtering a volume equivalent to or larger than the entire estuary volume within the residence time of the water”. Eastern oyster populations were historically capable of achieving full estuary filtration throughout much of their range (zu Ermgassen et al., 2013a). Full estuary filtration does not actually equate to complete filtration of all estuarine waters as this rough calculation assumes that the estuary is perfectly mixed, which is never the case. Furthermore, it does not account for phytoplankton production. Full estuary filtration nevertheless provides a useful indicator of the rate of filtration relative to tidal exchange, which in turn is an indicator of the potential for filtration to have a large-scale impact on the ecology of the estuary (Smaal and Prins, 1993, Dame, 2011). It should be noted that increasing oyster populations to the point at which they achieve full estuary filtration is unlikely to resolve the water quality concerns of many U.S. estuaries on its own (Cerco and Noel, 2007), but could meaningfully contribute to a system wide approach.
Figure 12: Theoretical relationship between the residence time, clearance time and full estuary filtration.
32 | Setting Objectives for Oyster Habitat Restoration using Ecosystem Services: A Manager’s Guide
Restoring the oyster population to once again achieve full estuary filtration may represent a suitable long-term large-scale objective in many estuaries. To determine the area and density of oysters required to achieve full estuary filtration, the rate of filtration required on the estuary scale must be calculated. This is estimated by assuming a well-mixed estuary, then by dividing the estuary volume by the residence time. Residence time is usually reported in days. This calculation therefore yields the total volume that needs to be filtered within a 24 hour period in order to achieve full estuary filtration. This volume can be achieved by a) increasing the area of oyster reef, b) increasing the density of oysters in existing areas or c) increasing the mean size of oysters. Options a and b will yield far greater returns as regards total filtration than option c.
The volume of water that passes through (is filtered by) oysters does not equal the volume of water cleared of particles. Oysters do not filter efficiently across all size classes of particle, and their efficiency can vary under suboptimal conditions, such as high sediment loads. As the filtration rate in equation 1 was derived from the volume of water cleared in situ it can, nevertheless be used as an estimate of the potential volume of water cleared. It should be considered that particles may become resuspended by water movement and wave action so it cannot be assumed that full estuary filtration will result in clear water across the whole of the bay or estuary. This approach nevertheless provides a conceptual framework for estimating when a system-wide effect may be expected, and hence how much restoration may be necessary to see large-scale impacts on water clarity.
To set an objective, one can use either the known or expected density of oysters on the restored site to calculate the volume filtered per unit area, then divide the total volume of the estuary by the calculated volume filtered per unit area to get an estimate of the required area of restoration. Or one can assume a fixed area of oyster reef and determine what the target density should be in order to achieve full estuary filtration. A worked example is given below.
Case Study: Setting objectives based on filtration
Matagorda Bay, Texas
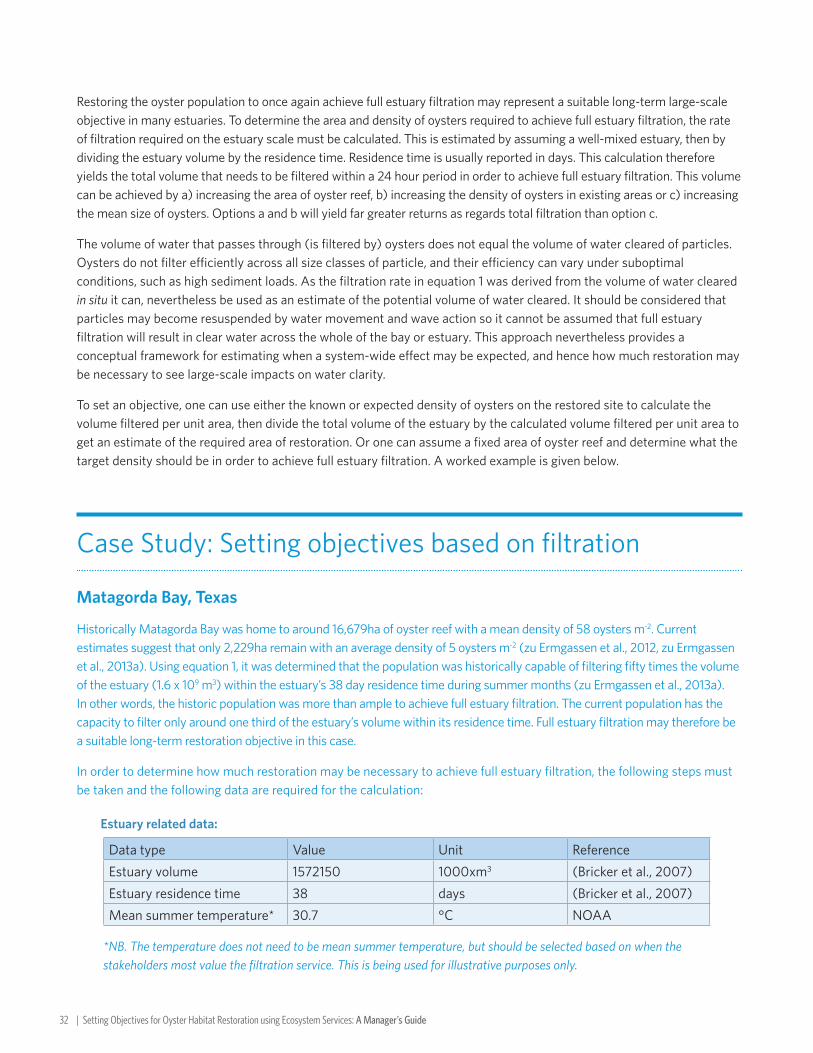
Historically Matagorda Bay was home to around 16,679ha of oyster reef with a mean density of 58 oysters m-2. Current estimates suggest that only 2,229ha remain with an average density of 5 oysters m-2 (zu Ermgassen et al., 2012, zu Ermgassen et al., 2013a). Using equation 1, it was determined that the population was historically capable of filtering fifty times the volume of the estuary (1.6 x 10⁹ m3) within the estuary’s 38 day residence time during summer months (zu Ermgassen et al., 2013a). In other words, the historic population was more than ample to achieve full estuary filtration. The current population has the capacity to filter only around one third of the estuary’s volume within its residence time. Full estuary filtration may therefore be a suitable long-term restoration objective in this case.
In order to determine how much restoration may be necessary to achieve full estuary filtration, the following steps must be taken and the following data are required for the calculation:
Estuary related data:
Data type Value Unit ReferenceEstuary volume 1572150 1000xm3 (Bricker et al., 2007)Estuary residence time 38 days (Bricker et al., 2007)Mean summer temperature* 30.7 °C NOAA
*NB. The temperature does not need to be mean summer temperature, but should be selected based on when the stakeholders most value the filtration service. This is being used for illustrative purposes only.
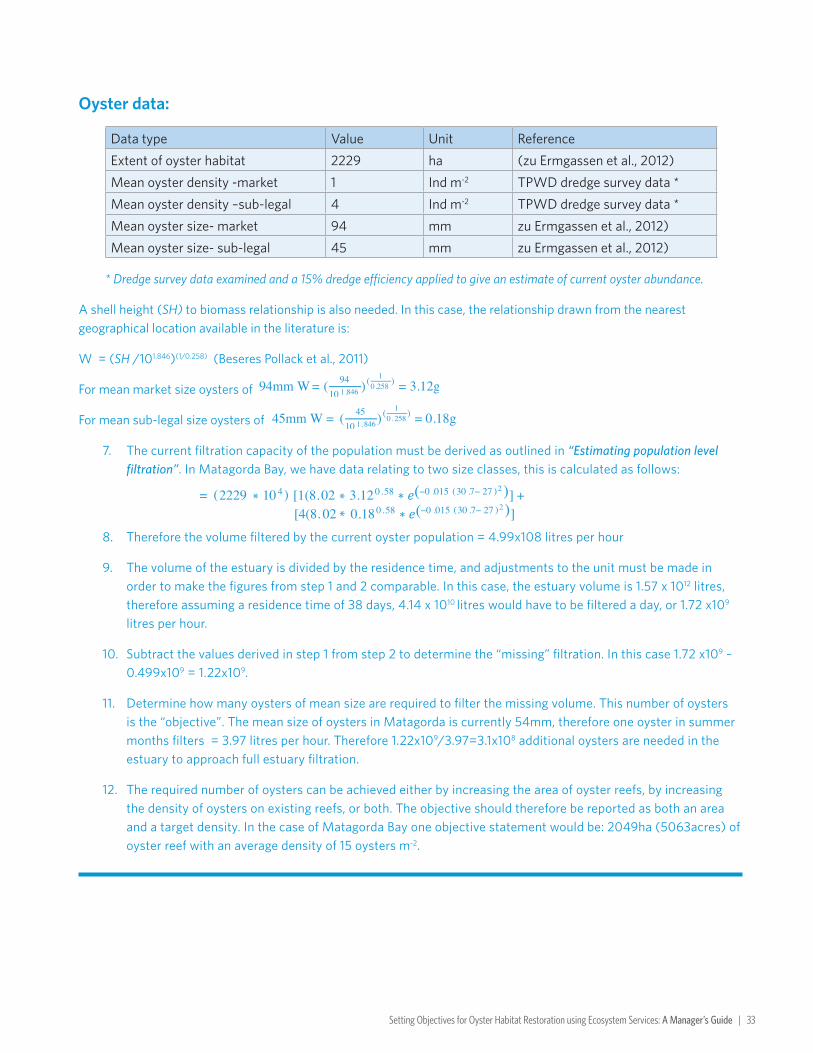
Setting Objectives for Oyster Habitat Restoration using Ecosystem Services: A Manager’s Guide | 33
Oyster data:
Data type Value Unit ReferenceExtent of oyster habitat 2229 ha (zu Ermgassen et al., 2012)Mean oyster density -market 1 Ind m-2 TPWD dredge survey data *Mean oyster density –sub-legal 4 Ind m-2 TPWD dredge survey data *Mean oyster size- market 94 mm zu Ermgassen et al., 2012)Mean oyster size- sub-legal 45 mm zu Ermgassen et al., 2012)
* Dredge survey data examined and a 15% dredge efficiency applied to give an estimate of current oyster abundance.
A shell height (SH) to biomass relationship is also needed. In this case, the relationship drawn from the nearest geographical location available in the literature is:
W = (SH /101.846)(1/0.258) (Beseres Pollack et al., 2011)
For mean market size oysters of
For mean sub-legal size oysters of
7. The current filtration capacity of the population must be derived as outlined in “Estimating population level filtration”. In Matagorda Bay, we have data relating to two size classes, this is calculated as follows:
8. Therefore the volume filtered by the current oyster population = 4.99x10⁸ litres per hour
9. The volume of the estuary is divided by the residence time, and adjustments to the unit must be made in order to make the figures from step 1 and 2 comparable. In this case, the estuary volume is 1.57 x 10¹² litres, therefore assuming a residence time of 38 days, 4.14 x 10¹⁰ litres would have to be filtered a day, or 1.72 x10⁹ litres per hour.
10. Subtract the values derived in step 1 from step 2 to determine the “missing” filtration. In this case 1.72 x10⁹ – 0.499x109 = 1.22x10⁹.
11. Determine how many oysters of mean size are required to filter the missing volume. This number of oysters is the “objective”. The mean size of oysters in Matagorda is currently 54mm, therefore one oyster in summer months filters = 3.97 litres per hour. Therefore 1.22x10⁹/3.97=3.1x108 additional oysters are needed in the estuary to approach full estuary filtration.
12. The required number of oysters can be achieved either by increasing the area of oyster reefs, by increasing the density of oysters on existing reefs, or both. The objective should therefore be reported as both an area and a target density. In the case of Matagorda Bay one objective statement would be: 2049ha (5063acres) of oyster reef with an average density of 15 oysters m-2.
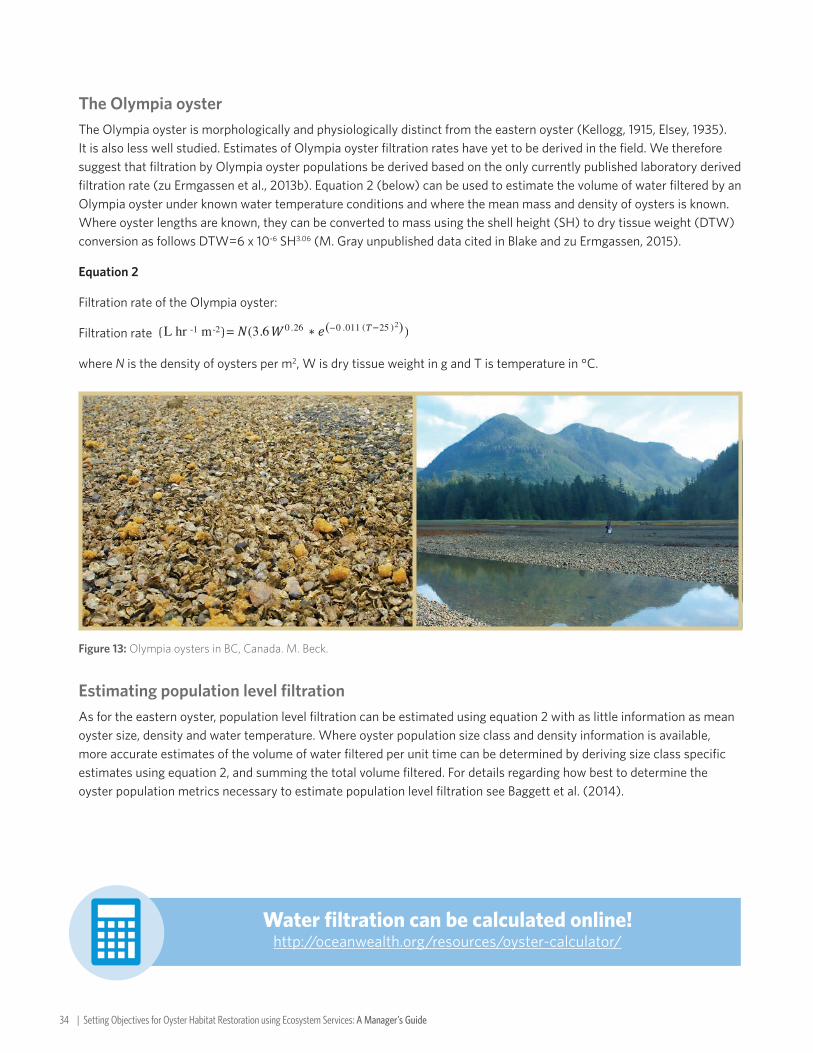
34 | Setting Objectives for Oyster Habitat Restoration using Ecosystem Services: A Manager’s Guide
The Olympia oysterThe Olympia oyster is morphologically and physiologically distinct from the eastern oyster (Kellogg, 1915, Elsey, 1935). It is also less well studied. Estimates of Olympia oyster filtration rates have yet to be derived in the field. We therefore suggest that filtration by Olympia oyster populations be derived based on the only currently published laboratory derived filtration rate (zu Ermgassen et al., 2013b). Equation 2 (below) can be used to estimate the volume of water filtered by an Olympia oyster under known water temperature conditions and where the mean mass and density of oysters is known. Where oyster lengths are known, they can be converted to mass using the shell height (SH) to dry tissue weight (DTW) conversion as follows DTW=6 x 10⁻⁶ SH3.06 (M. Gray unpublished data cited in Blake and zu Ermgassen, 2015).
Equation 2
Filtration rate of the Olympia oyster:
Filtration rate
where N is the density of oysters per m2, W is dry tissue weight in g and T is temperature in °C.
Figure 13: Olympia oysters in BC, Canada. M. Beck.
Estimating population level filtrationAs for the eastern oyster, population level filtration can be estimated using equation 2 with as little information as mean oyster size, density and water temperature. Where oyster population size class and density information is available, more accurate estimates of the volume of water filtered per unit time can be determined by deriving size class specific estimates using equation 2, and summing the total volume filtered. For details regarding how best to determine the oyster population metrics necessary to estimate population level filtration see Baggett et al. (2014).
Water filtration can be calculated online!http://oceanwealth.org/resources/oyster-calculator/
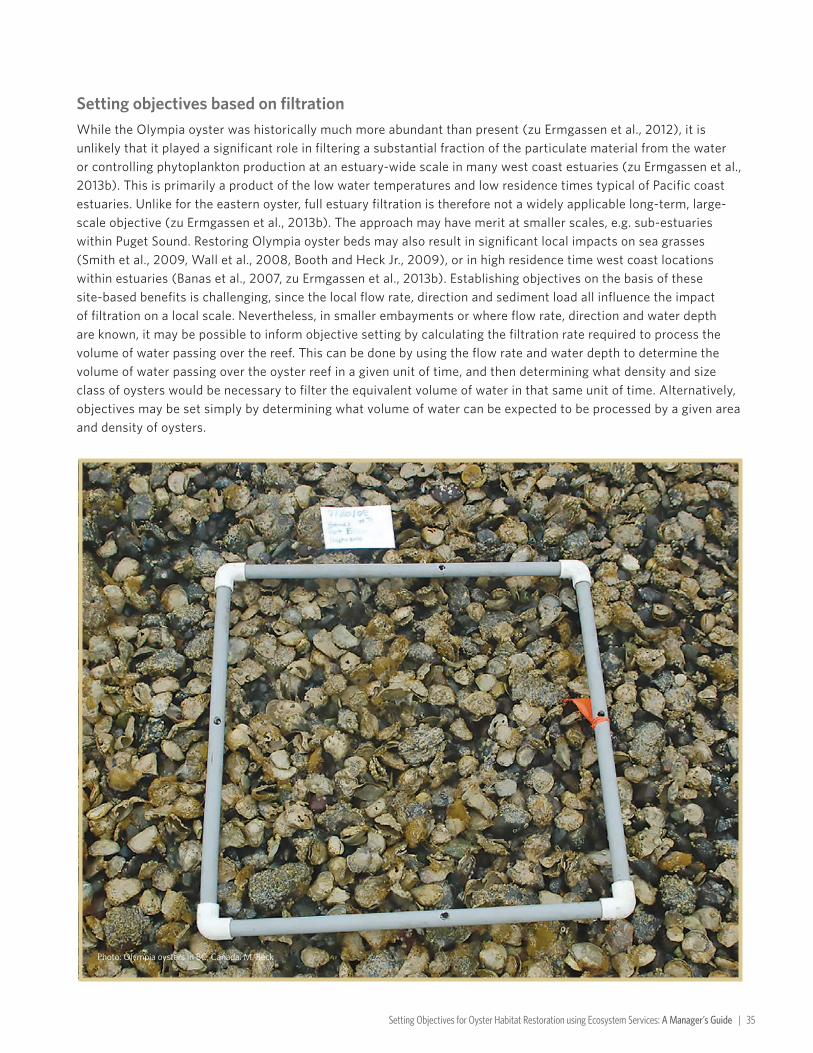
Setting Objectives for Oyster Habitat Restoration using Ecosystem Services: A Manager’s Guide | 35
Setting objectives based on filtrationWhile the Olympia oyster was historically much more abundant than present (zu Ermgassen et al., 2012), it is unlikely that it played a significant role in filtering a substantial fraction of the particulate material from the water or controlling phytoplankton production at an estuary-wide scale in many west coast estuaries (zu Ermgassen et al., 2013b). This is primarily a product of the low water temperatures and low residence times typical of Pacific coast estuaries. Unlike for the eastern oyster, full estuary filtration is therefore not a widely applicable long-term, large-scale objective (zu Ermgassen et al., 2013b). The approach may have merit at smaller scales, e.g. sub-estuaries within Puget Sound. Restoring Olympia oyster beds may also result in significant local impacts on sea grasses (Smith et al., 2009, Wall et al., 2008, Booth and Heck Jr., 2009), or in high residence time west coast locations within estuaries (Banas et al., 2007, zu Ermgassen et al., 2013b). Establishing objectives on the basis of these site-based benefits is challenging, since the local flow rate, direction and sediment load all influence the impact of filtration on a local scale. Nevertheless, in smaller embayments or where flow rate, direction and water depth are known, it may be possible to inform objective setting by calculating the filtration rate required to process the volume of water passing over the reef. This can be done by using the flow rate and water depth to determine the volume of water passing over the oyster reef in a given unit of time, and then determining what density and size class of oysters would be necessary to filter the equivalent volume of water in that same unit of time. Alternatively, objectives may be set simply by determining what volume of water can be expected to be processed by a given area and density of oysters.
Photo: Olympia oysters in BC, Canada. M. Beck

36 | Setting Objectives for Oyster Habitat Restoration using Ecosystem Services: A Manager’s Guide
Chapter 6: Nitrogen Removal
Restored oyster reefs have been shown to result in a positive net effect on the removal and retention of biologically active nitrogen relative to unrestored sites. As biologically active nitrogen is a major contributor to turbidity, removal of nitrogen from the system often yields water quality benefits. The nitrogen (N) is removed via three pathways (see Figure 14). The first of these is through assimilation of N in the shell and tissues of the oysters and associated biota, the second is through the enhanced burial of N into the sediments surrounding oyster reefs, and the third is through the enhancement of biochemical pathways, in particular microbe mediated denitrification. Each of these pathways may be locally important. Estimates of net nitrogen removal and retention should take each of these pathways into account, however, only denitrification definitively and permanently removes biologically active nitrogen from the system. Nevertheless, all three pathways should be considered when estimating net nitrogen removal resulting from oyster restoration.
Quantifying nitrogen assimilation in tissuesNitrogen from phytoplankton is assimilated into the shell and soft tissue of oysters as they grow. By promoting their growth through restoration, it is therefore possible to enhance the storage of N in the oysters themselves. Oyster reefs also support a host of other species, each of which similarly assimilate N into their tissues. In one study in the Choptank River, MD, restoration was found to enhance the standing stock of N by 95g N m-2 (Kellogg et al., 2013). The degree of enhancement varies, however, with oyster density and size and with the composition and abundance of the associated community.
The concentration of N in eastern oyster tissues remains relatively constant at around 9% of the dry tissue weight even where environmental N concentrations vary (Carmichael et al., 2012a). N concentrations in shell range between 0.2-0.26% of shell weight (Kellogg et al., 2014). Both tissue and shell N concentrations have been found to be higher in the Gulf of Mexico compared to the Atlantic coast, and concentrations may also vary with oyster size (Kellogg et al., 2014). We are unaware of any similar estimates for N content of Olympia oyster shell or tissues.
While harvesting the oysters permanently removes the assimilated N from the estuary, this is not recommended as it significantly reduces the longevity of the reef and the potential for restoration success, as well as reduces the delivery of other key ecosystem services (Grabowski et al., 2012). Furthermore, harvesting wild oysters from reefs is likely to reduce the N removal via the two other oyster-enhanced pathways. Where oyster aquaculture is a significant use of a bay or estuary, removal of N in soft tissue and shell via harvest may be considerable.
Quantifying nitrogen burialOysters are filter-feeding bivalves that generate biodeposits (feces and pseudofeces) that settle on the bottom, concentrating organic matter in the vicinity of the reef and resulting in sediments that are relatively rich in N. In the absence of resuspension of these sediments, some of these deposits and their associated N may become buried. The rates of burial and which factors affect it are currently unknown. Once buried, the permanence of burial is also unknown, as passing storm events can resuspend sediments at depth. Nevertheless, it is possible that burial by oyster reefs may be a locally important nitrogen sink.
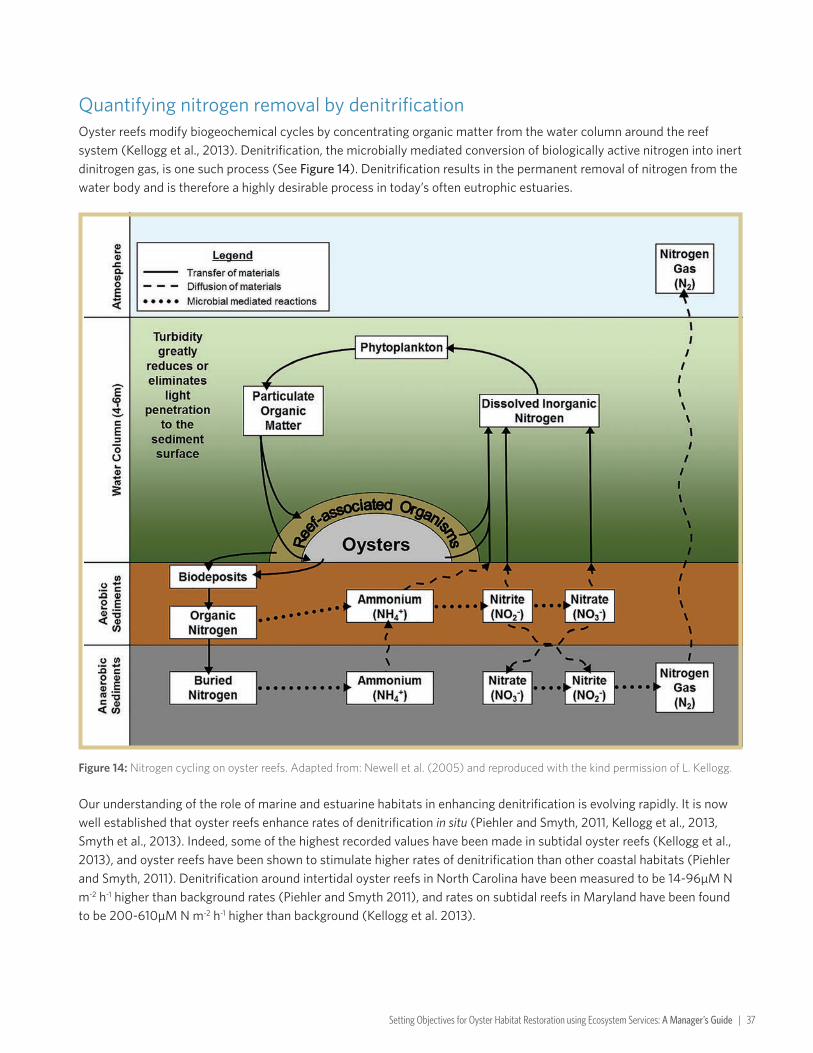
Setting Objectives for Oyster Habitat Restoration using Ecosystem Services: A Manager’s Guide | 37
Quantifying nitrogen removal by denitrificationOyster reefs modify biogeochemical cycles by concentrating organic matter from the water column around the reef system (Kellogg et al., 2013). Denitrification, the microbially mediated conversion of biologically active nitrogen into inert dinitrogen gas, is one such process (See Figure 14). Denitrification results in the permanent removal of nitrogen from the water body and is therefore a highly desirable process in today’s often eutrophic estuaries.
Figure 14: Nitrogen cycling on oyster reefs. Adapted from: Newell et al. (2005) and reproduced with the kind permission of L. Kellogg.
Our understanding of the role of marine and estuarine habitats in enhancing denitrification is evolving rapidly. It is now well established that oyster reefs enhance rates of denitrification in situ (Piehler and Smyth, 2011, Kellogg et al., 2013, Smyth et al., 2013). Indeed, some of the highest recorded values have been made in subtidal oyster reefs (Kellogg et al., 2013), and oyster reefs have been shown to stimulate higher rates of denitrification than other coastal habitats (Piehler and Smyth, 2011). Denitrification around intertidal oyster reefs in North Carolina have been measured to be 14-96µM N m-2 h-1 higher than background rates (Piehler and Smyth 2011), and rates on subtidal reefs in Maryland have been found to be 200-610µM N m-2 h-1 higher than background (Kellogg et al. 2013).
38 | Setting Objectives for Oyster Habitat Restoration using Ecosystem Services: A Manager’s Guide
The level of variation between measures of enhanced denitrification from restored oyster reef means that it is not yet possible to estimate the likely denitrification enhancement from any restoration site prior to restoration. The potential benefits arising from oyster restoration may, however, be significant and are therefore worthy of consideration. Indeed even conservative estimates of denitrification enhancement by oyster reefs may represent a large proportion of the total ecosystem services delivered by oyster reefs (Grabowski et al., 2012). Grabowski et al. (2012) estimated that one hectare of intertidal oyster reef in North Carolina removed $1,385-$6,716 worth of nitrogen per year. While this valuation is restricted to the location of the study, it provides us with some insight into the potential value of this oyster reef ecosystem service.
In order to build a general model capable of quantifying the denitrification enhancement resulting from a restoration project, it is necessary to collect more data on the role of seston concentration, light intensity, temperature, salinity, oyster size, density and habitat quality, as well as the role of the associated community among other factors. Further information about sampling protocols can be found in Baggett et al. (2014). In the future it should be possible to build a general model to estimate the denitrification enhancement by oyster reefs. A preliminary model already exists for Harris Creek, a well-studied river in Maryland (see Box 5). Ongoing research in Harris Creek seeks to both test the current model predictions and collect additional data to better parameterize the model.
The relative roles of oyster habitat restoration and aquacultureIt should be noted that the ecosystem service benefits of oyster restoration are not necessarily equal to the ecosystem service benefits of oysters under aquaculture conditions. In the case of denitrification, few studies have found net annual enhancement of denitrification in sediments under oysters grown in aquaculture floats (Higgins et al., 2013, Kellogg et al., 2014, Smyth et al. 2015). To date, no data have been published for denitrification rates associated with other forms of aquaculture. The nitrogen removal attributable to oyster aquaculture is generally ascribed to the extraction of the nitrogen contained in the soft tissue and shell at harvest.
Using nitrogen removal to set restoration objectivesThe state of knowledge is not yet advanced enough to use nitrogen removal as a quantitative objective for oyster restoration. Nevertheless, on a broad scale it is useful to consider the positive contribution that oyster restoration is likely to make to net nitrogen removal from restored estuaries.
If restoration takes place near a site for which habitat and biomass specific denitrification values are already available, the contribution of restoration can be estimated by multiplying the amount by which the rate is enhanced (the oyster habitat less the control rate of denitrification) and multiplying it by the area of restoration. While the current data do not allow for an estimate of this service at any given site, the available values in the literature provide some indication of the range of enhancement which might be expected (see text above and Kellogg et al., 2014 for further detail on existing values).
Where measurements of denitrification are available, the contribution of oyster restoration can be put into context not only in terms of the mass of nitrogen removed from the system, but it may also be useful to consider the number of people “offset” by restoration (by which we mean the amount of denitrification necessary to mitigate the excretion of N from one person), the value of the denitrification service in monetary terms (see Box 5), or the % of anthropogenically derived N removed (Carmichael et al., 2012b). These alternative units can also be useful in setting objectives.

Setting Objectives for Oyster Habitat Restoration using Ecosystem Services: A Manager’s Guide | 39
Box 5: Using denitrification estimates to set restoration objectives
While it is not currently possible to extrapolate objectives to areas where denitrification data are absent, a model has been developed by Drs. Mark Brush and Lisa Kellogg for Harris Creek, Maryland. Chesapeake Bay is an area for which considerable data have been collected and are applied to Harris Creek. Data specific to Harris Creek continue to be collected and will be added to the model as available. This web based model can be found at:
http://netsim.vims.edu/netsims/brush/harris_creek_model/index.html
The model allows the user to specify the area of restoration planned within each of 5 areas within the creek along with the oyster density and mean weight. The outputs of the proposed restoration can then be viewed. These include, N denitrified, N in tissue, N in shell and N buried, among other values.
NB: It should be noted that Harris Creek is intended as a case example. The Harris Creek model is still being refined and should not be applied to other areas.
Photo: Intertidal oyster reef, Florida, A. Birch.
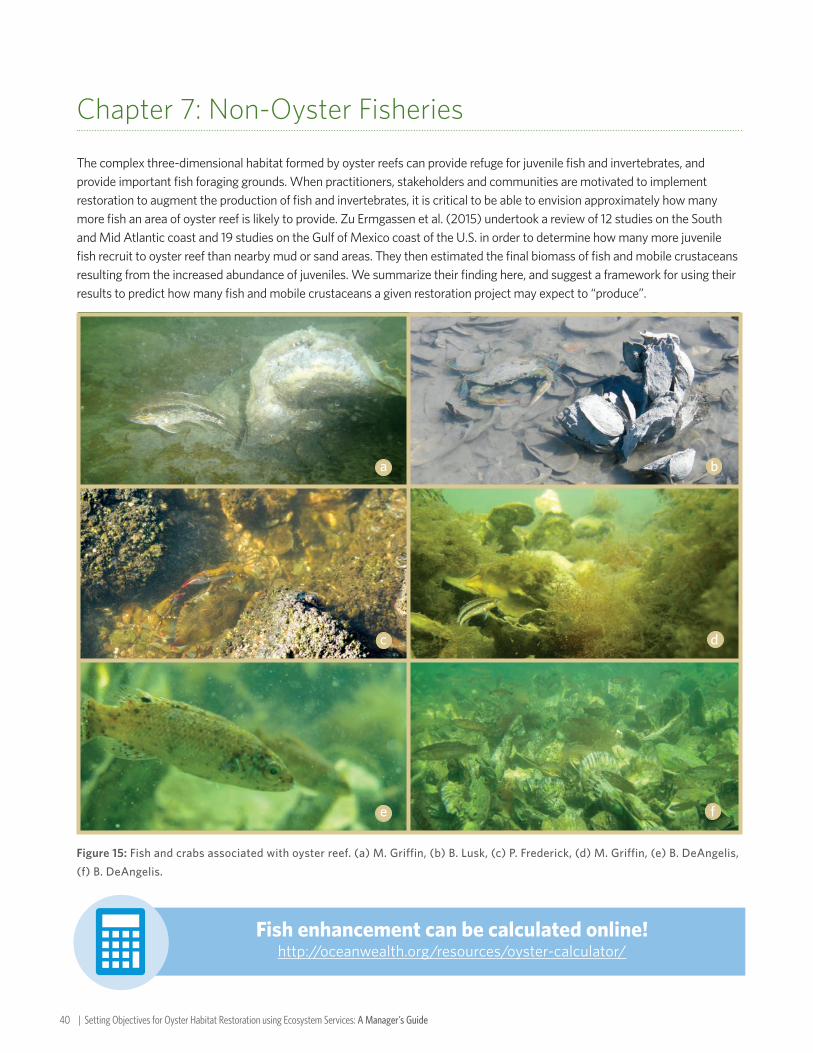
40 | Setting Objectives for Oyster Habitat Restoration using Ecosystem Services: A Manager’s Guide
Fish enhancement can be calculated online!http://oceanwealth.org/resources/oyster-calculator/
Chapter 7: Non-Oyster Fisheries
The complex three-dimensional habitat formed by oyster reefs can provide refuge for juvenile fish and invertebrates, and provide important fish foraging grounds. When practitioners, stakeholders and communities are motivated to implement restoration to augment the production of fish and invertebrates, it is critical to be able to envision approximately how many more fish an area of oyster reef is likely to provide. Zu Ermgassen et al. (2015) undertook a review of 12 studies on the South and Mid Atlantic coast and 19 studies on the Gulf of Mexico coast of the U.S. in order to determine how many more juvenile fish recruit to oyster reef than nearby mud or sand areas. They then estimated the final biomass of fish and mobile crustaceans resulting from the increased abundance of juveniles. We summarize their finding here, and suggest a framework for using their results to predict how many fish and mobile crustaceans a given restoration project may expect to “produce”.
Figure 15: Fish and crabs associated with oyster reef. (a) M. Griffin, (b) B. Lusk, (c) P. Frederick, (d) M. Griffin, (e) B. DeAngelis, (f) B. DeAngelis.
a b
c d
e f
Setting Objectives for Oyster Habitat Restoration using Ecosystem Services: A Manager’s Guide | 41
It should be noted that the values presented here represent the mean enhancement, for each geographic region, across all of the studies included in the initial literature review conducted by zu Ermgassen et al. (2015). Individual sites are expected to differ not only because not all species are present at all sites, but also because there is great natural variability in recruitment both across space and time. As such, these values represent a predicted enhancement and can be used when planning restoration and envisioning restoration targets and objectives. The biomass that restoration projects actually contribute can only be determined through appropriate sampling of fish populations on and off the reef in the years following restoration. Further information about appropriate sampling techniques for juvenile fish can be found in Baggett et al. (2014).
Quantifying fish enhancement by oyster reefsFifteen fish species and four crustacean species were found at greater densities on oyster reef habitat as opposed to unstructured habitat in the Gulf of Mexico, whereas eleven fish species and one crustacean species were enhanced on the Atlantic coast. The mean increase in juvenile individuals quantified per unit area is given in Table 1. This represents how many more individuals were found on oyster reef, over and above what was found on theunrestored/unstructured sites. It is believed that these numbers should scale linearly with area when habitat isvery limiting, hence the number of additional individuals recruiting to an area of restoration can be determined bymultiplying the density per m2 or acre, by the area restored. For further information regarding how to measure therestored area, please see chapter 3 in Baggett et al. 2014. This approach may become invalid when habitat ceasesto limit fish populations (i.e. when there is extensive habitat available). This approach should therefore be appliedwith caution to restoration efforts that seek to reach, or nearly reach, historical extent of oyster reef.
In order to calculate how many more fish and mobile crustaceans might be expected as a result of restoration efforts, this list can be cross-checked with the species known to exist in the area where restoration is being undertaken. Species that are not present should be excluded. For guidance as to which species can be expected in your region of interest, refer to NOAA’s Estuarine Living Marine Resources Program publications (Box 6).
Box 6. Web resources
NOAA’s Estuarine Living Marine Resources Program Publications:
North East Coasthttp://www.biodiversitylibrary.org/item/24461#page/3/mode/1up
Mid Atlantichttp://www.biodiversitylibrary.org/item/23780#page/16/mode/1up
South East Coast http://ccma.nos.noaa.gov/publications/biogeography/ELMR_SE_report.pdf
Gulf of Mexicohttps://ia600309.us.archive.org/12/items/distributionabun02nels/distributionabun02nels.pdf
Estuarine Living Marine Resource Databasehttp://www8.nos.noaa.gov/biogeo_public/elmr.aspx
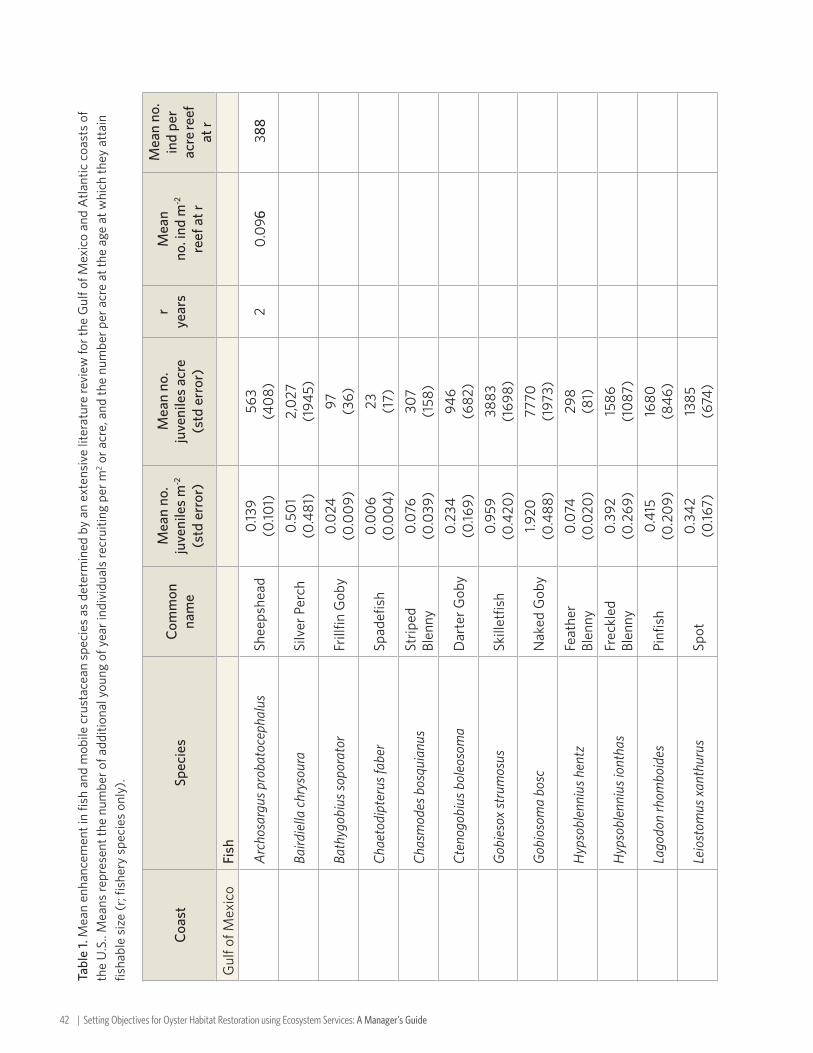
42 | Setting Objectives for Oyster Habitat Restoration using Ecosystem Services: A Manager’s Guide
Tabl
e 1.
Mea
n en
hanc
emen
t in
fish
and
mob
ile c
rust
acea
n sp
ecie
s as
det
erm
ined
by
an e
xten
sive
lite
ratu
re re
view
for t
he G
ulf o
f Mex
ico
and
Atla
ntic
coa
sts
of
the
U.S
.. M
eans
repr
esen
t the
num
ber o
f add
ition
al y
oung
of y
ear i
ndiv
idua
ls re
crui
ting
per m
2 or a
cre,
and
the
num
ber p
er a
cre
at th
e ag
e at
whi
ch th
ey a
ttai
n fis
habl
e si
ze (r
; fish
ery
spec
ies
only
).
Coas
tSp
ecie
sCo
mm
on
nam
e
Mea
n no
. ju
veni
les
m-2
(std
err
or)
Mea
n no
. ju
veni
les
acre
(std
err
or)
rye
ars
Mea
n no
. ind
m-2
reef
at r
Mea
n no
. in
d pe
r ac
re re
ef
at r
Gul
f of M
exic
oFi
sh
Arc
hosa
rgus
pro
bato
ceph
alus
Shee
pshe
ad0.
139
(0.10
1)56
3(4
08)
20.
096
388
Baird
iella
chry
sour
aSi
lver
Per
ch0.
501
(0.4
81)
2,02
7(1
945)
Bath
ygob
ius s
opor
ator
Frill
fin G
oby
0.02
4(0
.009
)97 (3
6)
Chae
todi
pter
us fa
ber
Spad
efish
0.00
6(0
.004
)23 (17)
Chas
mod
es b
osqu
ianu
sSt
riped
Bl
enny
0.07
6(0
.039
)30
7(1
58)
Cten
ogob
ius b
oleo
som
aD
arte
r Gob
y0.
234
(0.16
9)94
6(6
82)
Gob
ieso
x st
rum
osus
Skill
etfis
h0.
959
(0.4
20)
3883
(169
8)
Gob
ioso
ma
bosc
Nak
ed G
oby
1.920
(0.4
88)
7770
(197
3)
Hyp
sobl
enni
us h
entz
Feat
her
Blen
ny0.
074
(0.0
20)
298
(81)
Hyp
sobl
enni
us io
ntha
sFr
eckl
ed
Blen
ny0.
392
(0.2
69)
1586
(108
7)
Lago
don
rhom
boid
esPi
nfish
0.41
5(0
.209
)16
80(8
46)
Leio
stom
us x
anth
urus
Spot
0.34
2(0
.167)
1385
(674
)
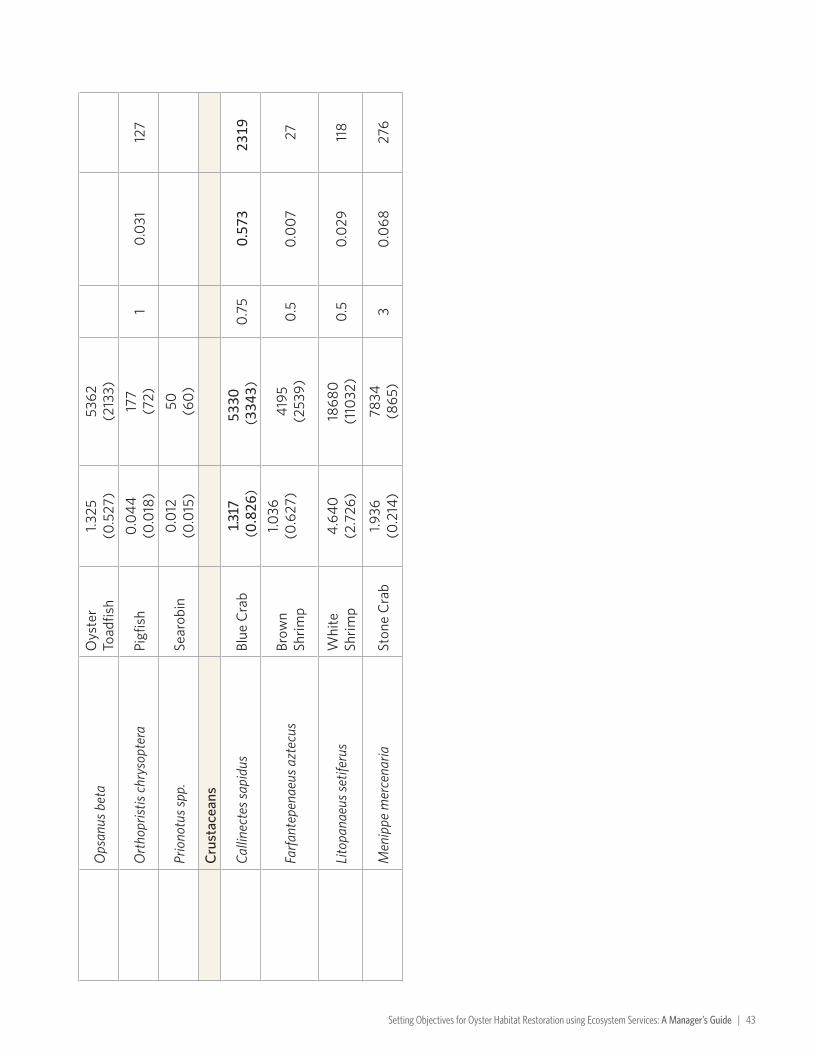
Setting Objectives for Oyster Habitat Restoration using Ecosystem Services: A Manager’s Guide | 43
Ops
anus
bet
aO
yste
r To
adfis
h 1.3
25(0
.527
)53
62(2
133)
Ort
hopr
istis
chry
sopt
era
Pigfi
sh0.
044
(0.0
18)
177
(72)
10.
031
127
Prio
notu
s spp
.Se
arob
in0.
012
(0.0
15)
50 (60)
Crus
tace
ans
Calli
nect
es sa
pidu
sBl
ue C
rab
1.317
(0.826
)53
30(334
3)0.
750.57
323
19
Farf a
ntep
enae
us a
ztec
usBr
own
Shrim
p
1.036
(0.6
27)
4195
(253
9)0.
50.
007
27
Lito
pana
eus s
etife
rus
Whi
te
Shrim
p4.
640
(2.7
26)
1868
0(1
1032
)0.
50.
029
118
Men
ippe
mer
cena
riaSt
one
Crab
1.936
(0.2
14)
7834
(865
)3
0.06
827
6
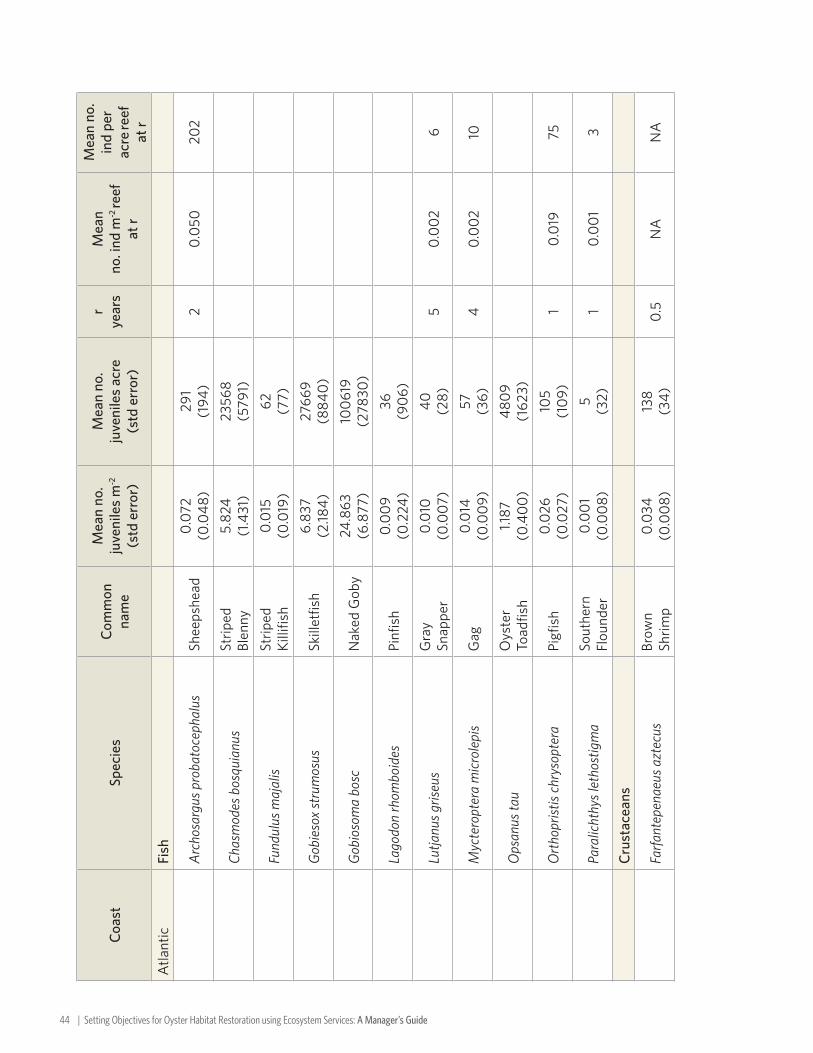
44 | Setting Objectives for Oyster Habitat Restoration using Ecosystem Services: A Manager’s Guide
Coas
tSp
ecie
sCo
mm
on
nam
e
Mea
n no
. ju
veni
les
m-2
(std
err
or)
Mea
n no
. ju
veni
les
acre
(std
err
or)
rye
ars
Mea
n
no. i
nd m
-2 re
ef
at r
Mea
n no
. in
d pe
r ac
re re
ef
at r
Atla
ntic
Fish
Arc
hosa
rgus
pro
bato
ceph
alus
Shee
pshe
ad0.
072
(0.0
48)
291
(194
)2
0.05
020
2
Chas
mod
es b
osqu
ianu
sSt
riped
Bl
enny
5.82
4(1
.431
)23
568
(579
1)
Fund
ulus
maj
alis
Strip
ed
Killi
fish
0.01
5(0
.019
)62 (7
7)
Gob
ieso
x st
rum
osus
Skill
etfis
h6.
837
(2.18
4)27
669
(884
0)
Gob
ioso
ma
bosc
Nak
ed G
oby
24.8
63(6
.877
)10
0619
(278
30)
Lago
don
rhom
boid
esPi
nfish
0.00
9(0
.224
)36
(906
)
Lutja
nus g
riseu
sG
ray
Snap
per
0.01
0(0
.007
)40 (2
8)5
0.00
26
Myc
tero
pter
a m
icro
lepi
sG
ag0.
014
(0.0
09)
57 (36)
40.
002
10
Ops
anus
tau
Oys
ter
Toad
fish
1.187
(0.4
00)
4809
(162
3)
Ort
hopr
istis
chry
sopt
era
Pigfi
sh0.
026
(0.0
27)
105
(109
)1
0.01
975
Para
licht
hys l
etho
stig
ma
Sout
hern
Fl
ound
er0.
001
(0.0
08)
5(3
2)1
0.00
13
Crus
tace
ans
Farfa
ntep
enae
us a
ztec
usBr
own
Shrim
p0.
034
(0.0
08)
138
(34)
0.5
NA
NA
Setting Objectives for Oyster Habitat Restoration using Ecosystem Services: A Manager’s Guide | 45
Estimating fish and mobile crustacean biomass production Once the number of additional juveniles recruiting to an area is known, it is possible to estimate the resulting increase in biomass using established life history and mortality estimates. Details of the growth and mortality models applied can be found in Appendix 3.
Zu Ermgassen et al. 2015 applied known growth and mortality relationships to the mean juvenile density values listed in Table 1, in order to estimate the life-long enhancement to fish and mobile invertebrates as a product of oyster reef restoration. The results are provided in Table 2. These values represent the annual enhancement once the restored reef exceeds tmax in age (with the assumption that the reef enhanced recruitment every year following construction), including the continued growth and survival of individuals throughout their life, even if they move off the reef. See Appendix 3 for detailed methodology.
There is strong evidence that restored oyster reefs support fish and mobile crustaceans very soon after restoration has taken place (La Peyre et al., 2014). Fish and mobile crustacean biomass can therefore be assumed to be enhanced from the first season of recruitment following restoration. While the full biomass enhancement benefits for each species will not be fulfilled until tmax, a significant proportion of the biomass can be attributed from just 2 years in the Gulf of Mexico (54%) and three years on the Atlantic coast (58%) (zu Ermgassen et al. 2015). These values will vary depending on which species are present at the location of the restoration project.
It should be noted that the values given in Table 2 represent the mean enhancement across all of the studies included in the initial literature review on which Table 1 is based. Individual sites are expected to differ not only because not all species are present at all sites, but also because there is great natural variability in recruitment both across space and time. As such, these values represent a predicted enhancement. The variability in each value is expressed as standard deviations calculated for each species, and should be considered when setting restoration objectives.
Fish enhancement can be calculated online!http://oceanwealth.org/resources/oyster-calculator/

46 | Setting Objectives for Oyster Habitat Restoration using Ecosystem Services: A Manager’s Guide
Table 2. Estimated fish and mobile crustacean biomass enhancement per year by oyster reef restored on the Gulf of Mexico and Atlantic coasts. These numbers are derived from applying known mortality and growth estimates to the observed enhancement in juvenile fish and mobile crustacean density on oyster reefs over unstructured controls.
Coast Species Common name
Mean production
g m-2 y-1
(stdev)
Mean production kg acre-1 y-1
(stdev)Gulf of Mexico Fish
Archosargus probatocephalus Sheepshead 137.2(99.0)
555(401)
Bairdiella chrysoura Silver Perch 41.0(39.5)
166(160)
Bathygobius soporator Frillfin Goby 2.0(0.7)
8(3)
Chaetodipterus faber Spadefish 3.0(2.2)
12(9)
Chasmodes bosquianus Striped Blenny 0.2(0.1)
1(0.4)
Ctenogobius boleosoma Darter Goby 0.5(0.3)
2(1)
Gobiesox strumosus Skilletfish 3.1(1.4)
13(6)
Gobiosoma bosc Naked Goby 2.2(0.6)
9(2)
Hypsoblennius hentz Feather Blenny 0.2(0.1)
1(0.4)
Hypsoblennius ionthas Freckled Blenny 1.3(0.9)
5(4)
Lagodon rhomboides Pinfish 33.2(16.7)
134(68)
Leiostomus xanthurus Spot 17.9(8.7)
72(35)
Opsanus beta Oyster Toadfish 41.9(16.6)
62(25)
Orthopristis chrysoptera Pigfish 5.8(2.4)
23(10)
Prionotus spp. Searobin 2.2(2.7)
9(11)
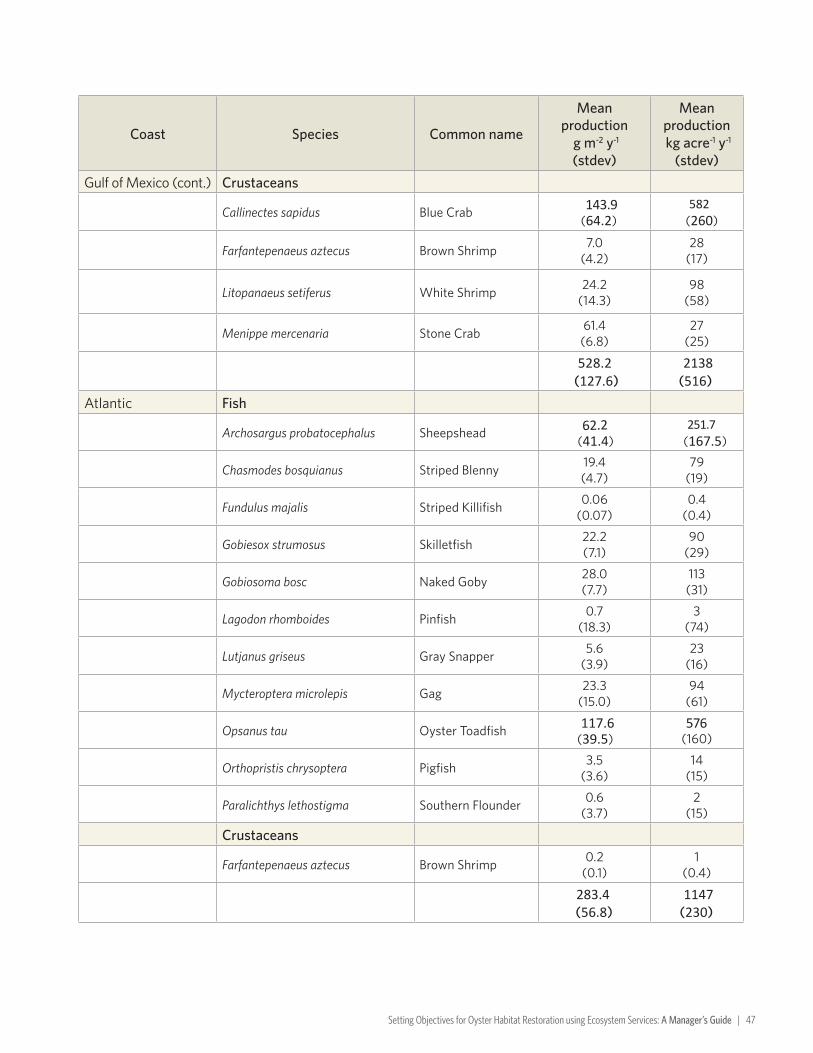
Setting Objectives for Oyster Habitat Restoration using Ecosystem Services: A Manager’s Guide | 47
Coast Species Common name
Mean production
g m-2 y-1
(stdev)
Mean production kg acre-1 y-1
(stdev)Gulf of Mexico (cont.) Crustaceans
Callinectes sapidus Blue Crab 143.9(64.2)
582(260)
Farfantepenaeus aztecus Brown Shrimp 7.0(4.2)
28(17)
Litopanaeus setiferus White Shrimp 24.2(14.3)
98(58)
Menippe mercenaria Stone Crab 61.4(6.8)
27(25)
528.2(127.6)
2138(516)
Atlantic Fish
Archosargus probatocephalus Sheepshead 62.2(41.4)
251.7(167.5)
Chasmodes bosquianus Striped Blenny 19.4(4.7)
79(19)
Fundulus majalis Striped Killifish 0.06(0.07)
0.4(0.4)
Gobiesox strumosus Skilletfish 22.2(7.1)
90(29)
Gobiosoma bosc Naked Goby 28.0(7.7)
113(31)
Lagodon rhomboides Pinfish 0.7(18.3)
3(74)
Lutjanus griseus Gray Snapper 5.6(3.9)
23(16)
Mycteroptera microlepis Gag 23.3(15.0)
94(61)
Opsanus tau Oyster Toadfish 117.6(39.5)
576(160)
Orthopristis chrysoptera Pigfish 3.5(3.6)
14(15)
Paralichthys lethostigma Southern Flounder 0.6(3.7)
2(15)
Crustaceans
Farfantepenaeus aztecus Brown Shrimp 0.2(0.1)
1(0.4)
283.4(56.8)
1147(230)

48 | Setting Objectives for Oyster Habitat Restoration using Ecosystem Services: A Manager’s Guide
Utilization enhanced fish speciesA number of species do not recruit to oyster reefs, but do preferentially utilize the habitat at later life history stages. While there is not yet sufficient knowledge to quantify the biomass enhancement to these species resulting from the use of oyster reef habitats, there is sufficient evidence to suggest that species that preferentially use oyster reef habitat are likely to gain from this habitat usage. These benefits primarily arise as a result of greater prey abundance and enhanced predator avoidance, provided by the structured shell habitat.
Zu Ermgassen et al. 2015 also determined the degree to which larger individuals preferentially utilized oyster reef habitat over unstructured habitat / unrestored reefs. Five species on the Gulf of Mexico coast and two species on the Atlantic coast were found to preferentially use oyster reef as adults (Table 3). The percentage of individuals sampled over reef habitat as opposed to off can be used as an indicator of how important oyster reefs might be to the identified fish species as adults. It is clear that a number of recreationally and commercially important species have a strong preference for oyster habitat as adults, and are likely to benefit from the presence of healthy reef systems.
Figure 16: Recreational fishers. (a) J. Kneebone, (b) M. Dumesnil.
a b

Setting Objectives for Oyster Habitat Restoration using Ecosystem Services: A Manager’s Guide | 49
Table 3. Species commonly found in higher abundance on oyster reef than unstructured controls.
Species Common name Proportion of individuals caught on oyster
Gulf Coast Menticirrhus americanus Southern Kingfish 52%
Paralichthys lethostigma Southern Flounder 82%
Pogonias cromis Black Drum 75%Rhinoptera bonasus Cownose Ray 82%Sciaenops ocellatus Red Drum 69%
Atlantic Coast Centropristis striata Black Sea Bass 63%
Morone saxatilis Striped Bass 93%
Using fish enhancement estimates in setting oyster restoration objectivesOyster restoration has the potential to significantly enhance fish production by providing habitat to juvenile fish and mobile crustaceans. This is important both from a biodiversity perspective and from a fisheries perspective.
Restoration may be undertaken with the whole fish community in mind (biodiversity benefits), or may be aimed at a few fish or crustacean species of greatest interest to the stakeholders (Box 7). Using the tables presented in this section or the online calculator, it is possible to predict how much fish, on a community or single species level, one can hope to attain from a given area of restoration. Objectives can therefore be set on the basis of expected fish biomass enhancement.
Box 7: Setting objective based on stone crab production
For example, if Stone Crab is the species of interest in Gulf of Mexico site, the stated aim of the objective could be to have 1000 additional crabs recruiting to the area per annum. At 1.936 additional Stone Crabs recruiting per m2 of oyster reef (Table 1), it can be expected that this degree of enhancement may be achieved from restoring 0.13 acres (516m-2) of oyster reef. The same approach could be taken, but basing the restoration target on the number of crabs entering the fishery. In this case, we would expect an additional 0.068 Stone Crabs to enter the fishery every year for every m2 of oyster reef restored, therefore to enhance the fishery by 1000 individuals a year, the restoration target should be 3.6 acres (1.5ha). Alternatively the objective could be biomass based, and the area could be determined using the biomass estimates in Table 2.
If the stakeholders wish to undertake restoration for the sake of the whole fish community (biodiversity benefits) as opposed to a single species, a target can be set based on the biomass of the whole community. In order to estimate the biomass that can be attributed to the planned oyster restoration, it is necessary to determine which of the species listed in Table 2 are present at the site. Once this is known, the predicted biomass for species deemed to be present can be totaled in order to provide a per unit area prediction of fish and mobile crustacean biomass.
It should be noted that it is likely there are species that are enhanced, but have not been included in the tables of enhancement due to insufficient information in the literature. These can be added as the available information is expanded through publication of future studies.

50 | Setting Objectives for Oyster Habitat Restoration using Ecosystem Services: A Manager’s Guide
Case Study: Setting objectives based on fish enhancement
Charlotte Harbor FL.
If a restoration project is planned for Charlotte Harbor FL, and fish community enhancement is a primary objective, the first step is to ascertain which of the listed fish species are common in that estuary. This list can be determined using knowledge of the site, or by referring to published resources. We populated Table 2 with the relative abundance of each of the potentially enhanced species in the estuary by asking experts within the Florida Fish and Wildlife Department for their expert opinion, using Patillo et al. 1997 (See Box 6), and site specific literature (Poulakis et al., 2004).
The expected biomass enhancement of the fish and mobile crustacean community can then be estimated by totaling the predicted biomass enhancement for the appropriate species in Table 2. For species listed as rare, it is appropriate to assume that they are not important contributors, and therefore to be conservative and not represent them in the enhancement estimates. For those listed as common or abundant, the mean enhancement should be used, whereas for those species listed as highly abundant, it is appropriate to assume the upper values of biomass enhancement are applicable. The upper and lower bounds are given by adding or subtracting the standard deviation (given in brackets in Table 2) from the mean. The case for Charlotte Harbor is presented in Table 4 below as an example. Of the utilization enhanced species, Southern Flounder, Black Drum and Red Drum are all present in Charlotte Harbor, and are likely to be enhanced by restored oyster habitat (Table 3).
Fish enhancement can be calculated online!http://oceanwealth.org/resources/oyster-calculator/

Setting Objectives for Oyster Habitat Restoration using Ecosystem Services: A Manager’s Guide | 51
Table 4: The predicted enhancement in production per unit area of oyster restoration undertaken in Charlotte Harbor, FL. Abundance as listed by Patillo et al. 1997 and using expert local knowledge.
Species Common name Abundance
Production enhancement
per m2 restoration
(g)
Production enhancement
per acre restoration (kg)
Fish
Archosargus probatocephalus Sheepshead Abundant 137.2 555
Bairdiella chrysoura Silver Perch Abundant 41.0 166
Bathygobius soporator Frillfin Goby Common 2.0 8
Chaetodipterus faber Spadefish Common 3.0 12
Chasmodes bosquianus Striped Blenny Not present 0 0
Ctenogobius boleosoma Darter Goby Rare 0 0
Gobiesox strumosus Skilletfish Common 3.1 13
Gobiosoma bosc Naked Goby Abundant 2.2 9
Hypsoblennius hentz Feather Blenny Rare 0 0
Hypsoblennius ionthas Freckled Blenny Not present 0 0
Lagodon rhomboides Pinfish Highly Abundant 49.9 202
Leiostomus xanthurus Spot Common 17.9 72
Opsanus beta Gulf Toadfish Common 41.9 62
Orthopristis chrysoptera Pigfish Highly Abundant 8.2 33
Prionotus spp. Searobin Common 2.2 9
Crustaceans
Callinectes sapidus Blue Crab Abundant 144 582
Farfantepenaeus aztecus Brown Shrimp Rare 0 0
Litopanaeus setiferus White Shrimp Rare 0 0
Menippe mercenaria Stone Crab Common 61.4 27
TOTAL 514.0 1750

52 | Setting Objectives for Oyster Habitat Restoration using Ecosystem Services: A Manager’s Guide
Chapter 8: Coastal Protection
The reduction of wind and wave energy, or attenuation, provided by the structure of many habitats including oyster and coral reefs, salt marsh, seagrasses, mangroves and dunes is now being regarded as a critical ecosystem service alongside fish production, water quality, tourism and biodiversity (Beck and Shepard, 2012). In recent years, the effects of climate change have amplified the importance of natural, restored, and hybrid approaches to protecting shoreline (Sutton-Grier et al., 2015). Restored oyster reefs have been demonstrated to be useful ecological strategies in protecting shorelines (Piazza et al., 2005, Scyphers et al., 2011), and strategies emphasizing natural solutions are garnering increasing support at state, federal and global levels.
Figure 17: Some examples of oyster reefs constructed to assist in shoreline protection. (a, b, c) Erika Nortemann, (d) B. Hancock.
Establishing restoration objectives on the basis of attenuating waves and/or stabilizing shorelines throughout an estuary is challenging, since the local wind, wave and geomorphological conditions all influence the impact of restored oyster reef on a particular segment of shoreline. Setting restoration objectives for shoreline protection requires identifying segments of coastline that are both eroding and ecologically suitable to sustain an oyster reef (La Peyre et al., 2015). Once these segments of estuary shoreline have been identified, it is possible to calculate the percent of the estuary’s shoreline that is eroding and what portion of these areas could potentially benefit from the shoreline protection benefits of oyster reefs. Restoration objectives can be developed based on the amount and/or length of oyster reef needed to protect all or part of the eroding shoreline segments.
a b
c d

Setting Objectives for Oyster Habitat Restoration using Ecosystem Services: A Manager’s Guide | 53
To demonstrate the coastal protection benefits derived from nearshore habitats and inform the development of oyster restoration projects for shoreline stabilization, The Nature Conservancy, Natural Capital Project, US Geological Survey, the University of California at Santa Cruz, and the University of Southern Mississippi have teamed up to build an online application (“app”) called Coastal Defense. The Coastal Defense app is a module of the Coastal Resilience decision support tool.
Coastal ResilienceCoastal Resilience (http://coastalresilience.org/) is a web-based decision support tool that provides local, state and national planners a step-wise process to guide decisions to reduce the ecological and socio-economic risks of coastal hazards. The Coastal Resilience tool is expanding across the U.S. and internationally and currently includes 12 U.S. coastal states, (Alabama, California, Connecticut, Florida, Louisiana, Mississippi, New Jersey, New York, North Carolina, Texas, Virginia, Washington), four countries in Latin America (Mexico, Belize, Guatemala, Honduras) and in three island nations in the Caribbean (Grenada, St. Vincent and the Grenadines, U.S. Virgin Islands). It assists in the assessment and identification of risk reduction solutions focusing on habitat based solutions, including oyster habitat, and operates at multiple scales to allow for more detailed planning. It includes an approach to help communities take the next step beyond assessing their risk: finding innovative ways to protect their communities by exploring the use of natural solutions.
Coastal DefenseCoastal Defense is an app within Coastal Resilience that identifies the coastal protection value of existing reef and wetland habitats and allows users to design restoration solutions. The Coastal Defense app uses standard engineering techniques to calculate the reduction of wave height and wave energy in the presences of these habitats. A coastal protection model from the Natural Capital Project’s Marine Integrated Valuation of Environmental Services and Tradeoffs (InVEST) program runs the app. The app helps support decisions to: (1) identify areas that may be at risk of coastal erosion and inundation from wave action and storm surge; (2) interactively examine the role of coastal habitats in attenuating wave height and energy; and (3) determine appropriate adaptation strategies that incorporate green (habitats) and grey (seawalls and other man-made structures) infrastructure trade-offs. Nature-based approaches like these are changing the perception that only hard infrastructure solutions provide effective coastal defense.
To date the app has been used in Puget Sound, Washington (tidal marshes), Mobile Bay, Alabama (oyster reefs), and the Florida Keys (coral reefs and mangroves). The app lets users specify offshore forcing conditions (wave and surge characteristics), a sea-level rise value, the location of restored or degraded coastal habitats, and the location of built infrastructure for exploring hybrid green (habitat) and gray (seawalls, dikes, etc.) solutions. The Coastal Resilience tool platform and Coastal Defense app help make complex social-ecological models more accessible to non-technical audiences, giving stakeholders the power to make more informed adaptation and restoration decisions.

Photo: Subtidal oyster reef, Texas. M. Dumesnil.

Setting Objectives for Oyster Habitat Restoration using Ecosystem Services: A Manager’s Guide | 55
References
Airoldi, L., Beck, M.W. (2007) Loss, status and trends for coastal marine habitats of Europe. Oceanography and Marine Biology Annual Review 45, 345-405.
Anon (1884) The cowboys of Florida. In: The New York Times. New York.
Baggett, L.P., Powers, S.P., Brumbaugh, R.D., et al. (2014) Oyster habitat restoration monitoring and assessment handbook. 96.
Banas, N.S., Hickey, B.M., Newton, J.A., Ruesink, J.L. (2007) Tidal exchange, bivalve grazing, and patterns of primary production in Willapa Bay, Washington, USA. Marine Ecology-Progress Series 34, 123-139.
Bancroft, H.H. (1890) History of Washington, Idaho and Montana 1845-1889, (The Works of Hubert Howe Bancroft, Vol., The History Company, Publishers, San Francisco CA.
Barille, L., Prou, J., Heral, M., Razet, D. (1997) Effects of high natural seston concentrations on the feeding, selection, and absorption of the oyster Crassostrea gigas (Thunberg). Journal of Experimental Marine Biology and Ecology 212, 149-172.
Battle, J.D. (1891) An investigation of the coast waters of South Carolina with reference to oyster-culture. Bulletin of the United States Fish Commission 10, 303-330.
Beck, M., Shepard, C.C. (2012) Coastal habitats and risk reduction. In: World Risk Report. pp. 32-41.
Beck, M.W., Brumbaugh, R.D., Airoldi, L., et al. (2009) Shellfish Reefs at Risk: A Global Analysis of Problems and Solutions., 52.
Beseres Pollack, J., Kim, H.C., Morgan, E.K., Montagna, P.A. (2011) Role of flood disturbance in natural oyster (Crassostrea virginica) population maintenance in an esturay in South Texas, USA. Estuaries and Coasts 34, 187-197.
Blackford, E.G. (1887) Second report of the oyster investigation and of survey of oyster territory, for the years 1885 and 1886. 48.
Blake, B., zu Ermgassen, P.S.E. (2015) The history and decline of Ostrea lurida in Willapa Bay, Washington. Journal of Shellfish Research 34, 273-280.
Bleakney, J.S., David, D. (1983) Discovery of an undisturbed bed of 3800 year old oysters (Crassostrea virginica) in Minas basin, Nova Scotia. Proceedings of the Nova Scotian Institute of Science 33, 1-6.
Boesch, D.F., Turner, R.E. (1984) Dependence of fishery species on salt marshes: The role of food and refuge. Estuaries 7, 460-468.
Booth, D.M., Heck Jr., K.L. (2009) Effects of the American oyster Crassostrea virginica on growth rates of the seagrass Halodule wrightii. Marine Ecology Progress Series 389, 117-126.
Borsje, B.W., van Wesenbeeck, B.K., Dekker, F., et al. (2011) How ecological engineering can serve in coastal protection. Ecological Engineering 37, 113-122.
56 | Setting Objectives for Oyster Habitat Restoration using Ecosystem Services: A Manager’s Guide
Bricker, S., Longstaff, B., Dennison, W., et al. (2007) Effects of nutrient enrichment in the nation’s estuaries: A decade of change, (NOAA Coastal Ocean Program Decision Analysis Series, Vol. 26), National Centers for Coastal Ocean Science, Silver Spring, MD.
Brooks, W.K. (1884) The development and protection of the oyster in Maryland By W. K. Brooks ... Being the report written by him as chairman of the Oyster Commission of the state of Maryland and presented to the General Assembly, February, 1884, Vol., Publication Agency of the Johns Hopkins University, Baltimore.
Brooks, W.K., Waddell, J.I., Legg, W.H. (1884) Report of the oyster commission of the state of Maryland January 1884. 183.
Brumbaugh, R.D., Beck, M.W., Coen, L.D., Craig, L., Hicks, P. (2006) A practitioners guide to the design and monitoring of shellfish restoration projects. 32.
Brumbaugh, R.D., Beck, M.W., Hancock, B., Wrona Meadows, A., Spalding, M., zu Ermgassen, P.S.E. (2010) Changing a management paradigm and rescuing a globally imperiled habitat. National Wetlands Newsletter November-December, 16-20.
Bush, L.L. (1900) The oyster industry. In: Pacific County Edition of the South Bend Journal. South Bend, WA.
Carmichael, R.H., Shriver, A.C., Valiela, I. (2012a) Bivalve response to estuarine eutrophication: The Balance between enhanced food supply and habitat alterations. Journal of Shellfish Research 31, 1-11.
Carmichael, R.H., Walton, W., Clark, H. (2012b) Bivalve-enhanced nitrogen removal from coastal estuaries. Canadian Journal of Fisheries and Aquatic Sciences 69, 1131-1149.
Cerco, C.F., Noel, M.R. (2007) Can oyster restoration reverse cultural eutrophication in Chesapeake Bay? Estuaries and Coasts 30, 331-343.
Coen, L.D., Brumbaugh, R.D., Bushek, D., et al. (2007) Ecosystem services related to oyster restoration. Marine Ecology Progress Series 341, 303–307.
Coen, L.D., Grizzle, R.E. (2007) The importance of habitat created by molluscan shellfish to managed species along the Atlantic Coast of the United States. Habitat Management Series No. 8, 115.
Dame, R.F. (2011) Ecology of Marine Bivalves: an ecosystem approach, Vol., CRC Press, Boca Raton, FL.
Dame, R.F., Zingmark, R.G., Haskin, E. (1984) Oyster reefs as processors of estuarine materials. Journal of Experimental Marine Biology and Ecology 83, 239-247.
Drake, J.C. (1891) On the sounds and estuaries of Georgia, with reference to oyster culture. United States Coast and Geodetic Survey Bulletin 19, 179-209.
Dumain, L. (1832) Survey of the Coast of Louisiana [1806-1807, communicated to the Senate 1811]. Class IV, Commerce and Navigation. In: Document No. 158 in the American State Papers. Vol. 7. (Eds. W. Lowrie, M. St. Clair Clarke), Gales and Seaton, Washington, pp. 839-842.
Elsey, C.R. (1935) On the structure and function of the mantle and gill of Ostrea gigas (Thunberg) and Ostrea lurida (Carpenter). Transactions of the Royal Society of Canada 29, 131-158.
Gedan, K.B., Kellogg, L., Breitburg, D.L. (2014) Accounting for multiple foundation species in oyster reef restoration benefits. Restoration Ecology 22, 517-524.

Setting Objectives for Oyster Habitat Restoration using Ecosystem Services: A Manager’s Guide | 57
Gerdes, D. (1983) The Pacific oyster Crassostrea gigas: Part I Feeding behaviour of larvae and adults. Aquaculture 31, 195-219.
Gould, A.A. (1841) Report on the invertebrata of Massachusetts comprising the mollusca, crustacea, annelinda and radiata, Vol., Folsom, Wells, and Thurston, Cambridge MA.
Grabowski, J.H., Brumbaugh, R.D., Conrad, R.F., et al. (2012) Economic valuation of ecosystem services provided by oyster reefs. BioScience 62, 900-909.
Grabowski, J.H., Peterson, C.H. (2007) Restoring oyster reefs to recover ecosystem services. In: Ecosystem engineers. (Eds. K. Cuddington, J.E. Byers, W.G. Wilson, A. Hastings), Elsevier Academic Press, Burlington MA, pp. 281-298.
Grave, C. (1912) Notes on the history of the oyster in Maryland and the physical valuation of her oyster properties, Baltimore MD.
Grizzle, R.E., Brodeur, M. (2004) Oyster (Crassostrea virginica) reef mapping in the Great Bay Estuary, New Hampshire - 2003. (The New Hampshire Estuaries Project, Durham NH), p 19.
Grizzle, R.E., Ward, K. (2009) Video-Based Mapping of Oyster Bottom in the Upper Piscataqua River, Sturgeon Creek, and Spruce Creek. (University of New Hampshire, Durham NH), p 10.
Harsh, D.A., Luckenbach, M.W. (1999) Materials processing by oysters in patches: Interactive roles of current speed and seston composition. In: Oyster reef habiatat restoration: A synopsis and synthesis of approaches. (Eds. M.W. Luckenbach, R. Mann, J.A. Wesson), Virginia Institute of Marine Science, School of Marine Science, College of William and Mary, VIMS Press, pp. 251-265.
Haure, J., Penisson, C., Bougrier, S., Baud, J.P. (1998) Influence of temperature on clearance and oxygen consumption rates of the flat oyster Ostrea edulis: determination of allometric coefficients. Aquaculture 169, 211-224.
Haven, D.S., Morales-Alamo, R. (1970) Filtration of particles from suspension by the American oyster Crassostrea virginica. Biological Bulletin 139, 248-264.
Higgins, C.B., Tobias, C., Piehler, M.F., et al. (2013) Impact of aquacultured oyster biodeposition on sediment N2 production in Chesapeake Bay. Marine Ecology Progress Series
Hinke, W.J. (1916) Report of the Journey of Francis Louis Michel from Berne, Switzerland, to Virginia, October 2, 1701-December 1, 1702. Part II. The Virginia Magazine of History and Biography 24, 113-141.
Hutchinson, S., Hawkins, L.E. (1992) Quantification of the physiological responses of the European flat oyster Ostrea edulis L. to temperature and salinity. Journal of Molluscan Studies 58, 215-226.
Kellogg, J.L. (1915) Ciliary mechanisms of lamellibranchs with descriptions of anatomy. Journal of Morphology 26, 625-701.
Kellogg, L., Cornwell, J.C., Paynter, K.T., Owens, M.S. (2011) Nitrogen removal and sequestration capacity of a restored oyster reef. 65.
Kellogg, M.L., Cornwell, J.C., Owens, M.S., Paynter, K.T. (2013) Nitrogen removal and nutrient sequestration of a restored oyster reef. Marine Ecology Progress Series 480, 1-19.
Kellogg, M.L., Smyth, A.R., Luckenbach, M.W., et al. (2014) Use of oysters to mitigate eutrophication in coastal waters. Estuarine, Coastal and Shelf Science.
58 | Setting Objectives for Oyster Habitat Restoration using Ecosystem Services: A Manager’s Guide
Kirby, M. (2004) Fishing down the coast: Historical expansion and collapse of oyster fisheries along continental margins. Proceedings of the National Academy of Sciences 101, 13096-13099.
Kroeger, T., Guannel, G. (2014) Fishery enhancement and coastal protection services provided by two restored Gulf of Mexico oyster reefs. In: Valuaing Ecosystem Services. Methodological issues and case studies. (Ed. K.N. Ninian), Edward Elgar Publishing, pp. 334-358.
La Peyre, M., Furlong, J., Brown, L.A., Piazza, B.P., Brown, K. (2014) Oyster reef restoration in the northern Gulf of Mexico: Extent, methods and outcomes. Ocean & Coastal Management 89, 20-28.
La Peyre, M.K., Serra, K., Joyner, T.A., Humphries, A.T. (2015) Assessing shoreline exposure and oyster habitat suitability maximizes potential success for sustainable shoreline protection using restored oyster reefs. PeerJ 3, e1317.
Leonard, D., Macfarlane, S. (2011) Best management practices for shellfish restoration. Final report to the Interstate Shellfish Sanitation Conference., 93.
Lipcius, R.N., Burke, R.P., McCulloch, D.N., Schreiber, S.J., Schulte, D.M., Seitz, R.D. and Shen, J. (2015) Overcoming restoration paradigms: value of the historical record and metapopulation dynamics in native oyster restoration. Front. Mar. Sci. 2, 1-15. doi: 10.3389/fmars.2015.00065
Mann, R., Harding, J.M., Southworth, M.J. (2009) Reconstructing pre-colonial oyster demographics in the Chesapeake Bay, USA. Estuarine, Coastal and Shelf Science 85, 217-222.
Meyer, D.L., Townsend, E.C., Thayer, G.W. (1997) Stabilization and erosion control value of oyster cultch for intertidal marsh. Restoration Ecology 5, 93-99.
Moebius, K. (1883) The oyster and oyster-culture. Report of Commissioner of Fish and Fisheries, 683-747.
Moehlenberg, F., Riisgaard, H.U. (1979) Filtration rate, using a new indirect technique, in thirteen species of suspension-feeding bivalves. Marine Biology 54, 143-147.
National Oceanic and Atmospheric Administration (2007) Introduction to stakeholder participation.
Newell, R.I.E. (2004) Ecosystem influences of natural and cultivated populations of suspension-feeding bivalve molluscs: A review. Journal of Shellfish Research 23, 51-61.
Newell, R.I.E., Fisher, T.R., Holyoke, R.R., Cornwell, J.C. (2005) Influence of Eastern oysters on nitrogen and phosphorus regeneration in Chesapeake Bay, USA. In: The Comparative Roles of Suspension-Feeders in Ecosystems. pp. 93-120.
Piazza, B.P., Banks, P.D., La Peyre, M.K. (2005) The potential for created oyster shell reefs as a sustainable shoreline protection strategy in Louisiana. Restoration Ecology 13, 499-506.
Piehler, M.F., Smyth, A.R. (2011) Habitat-specific distinctions in estuarine denitrification affect both ecosystem function and services. Ecosphere 2, art12.
Poulakis, G.R., Matheson Jr., R.E., Mitchell, M.E., Blewett, D.A., Idelberger, C.F. (2004) Fishes of the Charlotte Harbor estuarine system, Florida. Gulf of Mexico Science 22, 117-150.
Richardson, N.F., Ruesink, J.L., Naeem, S., et al. (2008) Bacterial abundance and aerobic microbial activity across natural and oyster aquaculture habitats during summer conditions in a northeastern Pacific estuary. Hydrobiologia 596, 269-278.

Setting Objectives for Oyster Habitat Restoration using Ecosystem Services: A Manager’s Guide | 59
Rick, T.C., Erlandson, J.M. (2009) Coastal exploitation. Science 952, 325-326.
Riisgaard, H.U. (1988) Efficiency of particle retention and filtration rate in 6 species of Northeast American bivalves. Marine Ecology-Progress Series 45, 217-223.
Roberts, C.M. (2007) The Unnatural History of the Sea. The past and future of humanity and fishing, Vol., Gaia, London.
Rodney, W.S., Paynter, K.T. (2006) Comparisons of macrofaunal assemblages on restored and non-restored oyster reefs in mesohaline regions of Chesapeake Bay in Maryland. Journal of Experimental Marine Biology and Ecology 335, 39-51.
Schlesselman, G.W. (1955) The Gulf coast oyster industry of the United States. Geographical Review 45, 531-541.
Schuster, E., Doerr, P. (2015) A Guide for Incorporating Ecosystem Service Valuation into Coastal Restoration Projects. p.77.
Scyphers, S.B., Powers, S.P., Heck, K.L., Byron, D. (2011) Oyster reefs as natural breakwaters mitigate shoreline loss and facilitate fisheries. PLoS ONE 6, e22396.
Shervette, V.R., Gelwick, F. (2008) Seasonal and spatial variations in fish and macroinvertebrate communities of oyster and adjacent habitats in a Mississippi estuary. Estuaries and Coasts 31, 584-596.
Smaal, A.C., Prins, T.C. (1993) The uptake of organic matter and the release of inorganic nutrients by bivalve suspension feeder beds. In: Bivalve filter feeders in estuarine and coastal ecosystem processes. (Ed. R.F. Dame), Springer-Verlag, Heidelberg, pp. 273-298.
Smith, H.M. (1896) Notes on Biscayne Bay, Florida, with reference to its adaptability as the site of a Marine Hatching and Experiment Station. In: United States Commission of Fish and Fisheries Report of the Commissioner for the year ending June 30, 1895. Vol. 21. Government Printing Office, Washington D.C., pp. 169-191.
Smith, K.A., North, E.W., Shi, F.Y., et al. (2009) Modeling the effects of oyster reefs and breakwaters on seagrass growth. Estuaries and Coasts 32, 748-757.
Smyth, A.R., Geraldi, N.R., Piehler, M.F. (2013) Oyster-mediated benthic-pelagic coupling modifies nitrogen pools and processes. Marine Ecology Progress Series 493, 23-30.
Smyth, A.R., Murphy, A.E, Hudson, K., Song, B., and Anderson, I. C. (2015). Examining water quality benefits of oyster aquaculture. Abstracts of technical papers presented at the 107th Annual Meeting of the National Shellfisheries Association, Monterey, California March 22–26, 2015. In: Journal of Shellfish Research, Vol. 34, No. 2, 585–694.
Spalding, M., Ravilious, C., Green, E.P. (2001) World Atlas of Coral Reefs, University of California Press, Bekeley, CA.
Stevenson, C.H. (1893) Report on the Coast Fisheries of Texas. In: United States Commission of Fish and Fisheries. Report of the Commissioner for 1889 to 1891. Vol. 17. Government Printing Office, Washington D.C., pp. 373-420.
Stricklin, A.G., Peterson, M.S., Lopez, J.D., May, C.A., Mohrman, C.F., Woodrey, M.S. (2010) Do small, patchy, constructed intertidal oyster reefs reduce salt marsh erosion as well as natural reefs? Gulf and Caribbean Research 22, 21-27.
Stunz, G.W., Minello, T.J., Rozas, L.P. (2010) Relative value of oyster reef as habitat for estuarine nekton in Galveston Bay, Texas. Marine Ecology Progress Series 406, 147-159.

60 | Setting Objectives for Oyster Habitat Restoration using Ecosystem Services: A Manager’s Guide
Sutton-Grier, A.E., Wowk, K., Bamford, H. (2015) Future of our coasts: The potential for natural and hybrid infrastructure to enhance the resilience of our coastal communities, economies and ecosystems. Environmental Science & Policy 51, 137-148.
Tenore, K.R., Dunstan, W.M. (1973) Comparison of rates of feeding and biodeposition of the American oyster, Crassostrea virginica Gmelin, fed different species of phytoplankton. Journal of Experimental Marine Biology and Ecology 12, 19-26.
Tolley, S.G., Volety, A.K. (2005) The role of oysters in habitat use of oyster reefs by resident fishes and decapod crustaceans. Journal of Shellfish Research 24, 1007-1012.
Tompkins, W.A. (1932) Oysterville, 1840-97. Oregon Historical Quarterly 33, 160-163.
Wall, C., Peterson, B., Gobler, C. (2011) The Growth of Estuarine Resources (Zostera marina, Mercenaria mercenaria, Crassostrea virginica, Argopecten irradians, Cyprinodon variegatus) in Response to Nutrient Loading and Enhanced Suspension Feeding by Adult Shellfish. Estuaries and Coasts 34, 1262-1277.
Wall, C.C., Peterson, B.J., Gobler, C.J. (2008) Facilitation of seagrass Zostera marina productivity by suspension-feeding bivalves. Marine Ecology Progress Series 357, 165-174.
Waycott, M., Duarte, C.M., Carruthers, T.J.B., et al. (2009) Accelerating loss of seagrasses across the globe threatens coastal ecosystems. Proceedings of the National Academy of Sciences 106, 12377-12381.
Winslow, F. (1889) Report on the sounds and estuaries of North Carolina with reference to oyster culture. United States Coast and Geodetic Survey Bulletin 10, 53-132.
Wongbusarakum, S., Myers Madeira, E., Hartanto, H. (2014) Strengthening the Social Impacts of Sustainable Landscapes Programs: A practitioner’s guidebook to strengthen and monitor human well-being outcomes. 107.
zu Ermgassen, P.E., Spalding, M., Grizzle, R., Brumbaugh, R. (2013a) Quantifying the loss of a marine ecosystem service: Filtration by the eastern oyster in US estuaries. Estuaries and Coasts 36, 36-43.
zu Ermgassen, P.S.E., Grabowski, J.H., Gair, J.R., Powers, S.P. (2015) Quantifying fish and mobile invertebrate production from a threatened nursery habitat. Journal of Applied Ecology, n/a-n/a. doi: 10.1111/1365-2664.12576
zu Ermgassen, P.S.E., Gray, M.W., Langdon, C.J., Spalding, M.D., Brumbaugh, R.D. (2013b) Quantifying the historic contribution of Olympia oysters to filtration in Pacific Coast (USA) estuaries and the implications for restoration objectives. Aquatic Ecology 47, 149-161.
zu Ermgassen, P.S.E., Spalding, M.D., Blake, B., et al. (2012) Historical ecology with real numbers: Past and present extent and biomass of an imperilled estuarine ecosystem. Proceedings of the Royal Society B 279, 3393-3400.

Setting Objectives for Oyster Habitat Restoration using Ecosystem Services: A Manager’s Guide | 61
Appendix 1A: Estuary-Scale Data Summaries
This section contains a compilation of estuary level data, including information on the historic presence and extent of oyster reef systems in each estuary, where these data are available. Relevant physical attributes of each estuary are also provided.
Many of these data have previously been published in zu Ermgassen et al. (2012). The full manuscript and details of data acquisition can be found at http://rspb.royalsocietypublishing.org/content/279/1742/3393 . When using historic data such as those provided, it is important to be aware that baseline data may not represent pristine conditions (see Box 3 and 4). The values given to describe oyster extent in the bay summaries presented in the Appendix refer to reef systems (see Box 1).

62 | Setting Objectives for Oyster Habitat Restoration using Ecosystem Services: A Manager’s Guide
App
endi
x 1A
, Eas
tern
oys
ter (
Cras
sost
rea
virg
inic
a)
State
Bay Name
Bay Volume (1000m3)
Bay Residence Time (days)
Historic Reef Area (ha)
Historic Total Density (ind/m2)
Historic Mean Length (mm)
Historic Mean Ind Biomass (g)
Historic Cull Density (ind/m2)
Historic Cull Mean Length (mm)
Historic Cull Ind Biomass (g)
Historic Market Density (ind/m2)
Historic Market Mean Length (mm)
Historic Market Ind Biomass (g)
Current Reef Area (ha)
Current Total Density (ind/m2)
Current Mean Length (mm)
Current Mean Ind Biomass (g)
Current Cull Density (ind/m2)
Current Cull Mean Length (mm)
Current Cull Ind Biomass (g)
Current Market Density (ind/m2)
Current Market Mean Length (mm)
Current Market Ind Biomass (g)
AL
Mob
ile B
ay20
6089
09
1151
29.2
--
15.4
650.
713
.887
2.3
1045
11.2
510.
38.
146
0.2
3.0
902.
6
FLA
pala
chee
Bay
3404
160
3-
--
--
--
--
-15
3515
7.6
510.
313
4.8
46-
22.8
90-
FLA
pala
chic
ola
Bay
1073
330
426
9514
.5-
-10
.051
0.3
4.6
943.
134
9115
7.6
510.
313
4.8
460.
222
.890
2.6
FLPe
nsac
ola
Bay
1440
540
27-
--
--
--
--
-31
4468
.357
0.5
51.9
430.
216
.490
2.6
FLCa
loos
ahat
chee
Ri
ver
1259
6011
--
--
--
--
--
110
8.8
420.
310
6.9
420.
31.9
830.
9
FLCh
arlo
tte
Har
bor
8182
603
--
--
--
--
--
9710
8.8
420.
310
6.9
420.
31.9
830.
9
FLIn
dian
Riv
er66
6820
3-
--
--
--
--
-90
74.0
490.
467
.342
0.3
6.6
830.
9
FLRo
oker
y Ba
y17
500
0-
--
--
--
--
-10
108.
842
-10
6.9
420.
31.9
831.2
FLTa
mpa
Bay
2706
000
9-
--
--
--
--
-18
101.8
350.
299
.042
0.3
2.8
831.2

Setting Objectives for Oyster Habitat Restoration using Ecosystem Services: A Manager’s Guide | 63
FLBi
scay
ne B
ay86
3460
4-
--
--
--
--
-0
--
--
--
--
-
GA
Alta
mah
a Ri
ver
7644
00
8111
4.0
680.
3-
--
--
--
--
--
--
--
-
GA
Oss
abaw
Sou
nd29
4800
171
114.
068
0.3
--
--
--
--
--
--
--
--
GA
St. A
ndre
w/S
t. Si
mon
s So
unds
6811
202
185
114.
068
0.3
--
--
--
--
--
--
--
--
GA
St. C
athe
rines
/Sa
pelo
Sou
nds
6824
401
271
114.
068
0.3
--
--
--
--
--
--
--
--
GA
/SC
Sava
nnah
Riv
er37
2680
162
114.
068
0.3
--
--
--
--
--
--
--
--
MD
S. M
aryl
and
Coas
tal B
ays
(Chi
ncot
eagu
e/Si
nepu
xent
)
6499
008
672
17.5
--
12.4
620.
35.
282
0.5
0-
--
--
--
--
MD
/VA
Tang
ier/
Poco
mok
e So
unds
3477
530
1235
536
--
-0.
462
0.0
1.296
0.9
7126
11.9
440.
210
.47
440.
21.5
770.
8
MS
W. M
issi
ssip
pi
Soun
d (L
A &
pa
rtial
MS-
east
of
Bilo
xi)
3841
830
2333
9131
.4-
-26
.465
0.7
5.1
872.
364
901.7
--
1.348
0.2
0.3
933.
0
NC
New
Riv
er14
6960
212
611
4.0
680.
3-
--
--
--
--
--
--
--
-
NC
Bogu
e So
und
3616
802
666
17.5
--
12.4
620.
75.
282
1.5-
--
--
--
--
-
NC
Neu
se R
iver
1304
160
733
17.5
--
12.4
620.
75.
282
1.5-
--
--
--
--
-
NC
Pam
lico
Soun
d13
7124
0034
3320
17.5
--
12.4
620.
75.
282
1.5-
--
--
--
--
-

64 | Setting Objectives for Oyster Habitat Restoration using Ecosystem Services: A Manager’s Guide
State
Bay Name
Bay Volume (1000m3)
Bay Residence Time (days)
Historic Reef Area (ha)
Historic Total Density (ind/m2)
Historic Mean Length (mm)
Historic Mean Ind Biomass (g)
Historic Cull Density (ind/m2)
Historic Cull Mean Length (mm)
Historic Cull Ind Biomass (g)
Historic Market Density (ind/m2)
Historic Market Mean Length (mm)
Historic Market Ind Biomass (g)
Current Reef Area (ha)
Current Total Density (ind/m2)
Current Mean Length (mm)
Current Mean Ind Biomass (g)
Current Cull Density (ind/m2)
Current Cull Mean Length (mm)
Current Cull Ind Biomass (g)
Current Market Density (ind/m2)
Current Market Mean Length (mm)
Current Market Ind Biomass (g)
NH
Gre
at B
ay17
7660
1-
--
--
--
--
-87
286.
955
0.5
--
--
--
NJ
Barn
egat
Bay
1183
004
5261
17.5
--
12.4
620.
75.
282
1.50
--
--
--
--
-
NJ
New
Jers
ey In
land
Ba
ys30
8580
116
1917
.5-
-12
.462
0.7
5.2
821.5
4615
.5-
-13
.152
0.5
2.4
871.7
NJ/
DE
Del
awar
e Ba
y12
6684
008
2514
917
.5-
-12
.462
0.7
5.2
821.5
1147
115
.5-
-13
.152
0.5
2.4
871.7
NY/
CTLo
ng Is
land
Sou
nd63
4527
3056
1326
717
.5-
-12
.462
0.7
5.2
821.5
--
--
--
--
--
NY/
CTH
udso
n Ri
ver/
Rarit
an B
ay48
9787
09
1660
17.5
--
12.4
620.
75.
282
1.540
215
.5-
-13
.152
0.5
2.4
871.7
RIN
arra
gans
ett B
ay34
5696
024
--
--
--
--
--
0-
--
--
--
--
SCBr
oad
Rive
r12
2229
03
--
--
--
--
--
622
1229
.4-
-98
9.8
360.
123
9.7
750.
4
SCSt
. Hel
ena
Soun
d72
0650
2-
--
--
--
--
-40
112
29.4
--
989.
836
0.1
239.
775
0.4
App
endi
x 1A
, Eas
tern
oys
ter (
Cras
sost
rea
virg
inic
a) (c
ont.)

Setting Objectives for Oyster Habitat Restoration using Ecosystem Services: A Manager’s Guide | 65
SCSt
ono/
Nor
th
Edis
to R
iver
s43
1940
6-
--
--
--
--
-19
912
29.4
--
989.
836
0.1
239.
775
0.4
SCCh
arle
ston
H
arbo
r42
4150
5-
--
--
--
--
-57
1229
.4-
-98
9.8
360.
123
9.7
750.
4
TXA
rans
as B
ay51
3520
1838
8557
.5-
-25
.471
1.130
.291
2.7
482
12.4
--
8.3
510.
34.
193
3.0
TXCo
rpus
Chr
isti
Bay
1535
990
4633
6757
.5-
-25
.471
1.130
.291
2.7
290
1.4-
-1.2
460.
20.
298
3.6
TXG
alve
ston
Bay
2242
240
1512
950
57.5
--
25.4
711.1
30.2
912.
710
795
4.1
--
1.248
0.2
1.299
3.8
TXM
atag
orda
Bay
1572
150
3816
679
57.5
--
25.4
711.1
30.2
912.
722
295.
2-
-4.
245
0.2
1.094
3.1
TXSa
n A
nton
io B
ay34
6330
825
9057
.5-
-25
.471
1.130
.291
2.7
2158
4.2
--
3.4
470.
20.
898
3.6
TXLa
guna
Mad
re
(Upp
er a
nd Lo
wer
&
Baffi
n Ba
y)11
9502
055
777
57.5
--
25.4
710.
730
.291
3.1
680.
7-
-0.
645
0.2
0.1
852.
2
TX/L
ASa
bine
Lak
e (T
X on
ly)
6598
5010
259
57.5
--
25.4
710.
730
.291
3.1
480
40.6
--
26.2
520.
314
.499
3.8
VAYo
rk R
iver
- Ba
ylor
cor
rect
ed
(47%
)78
6920
1169
819
.2-
-14
.062
0.6
5.3
821.2
161
14.8
44-
12.0
544
0.3
2.8
771.1
VAJa
mes
Riv
er20
6080
08
4467
19.2
--
14.0
620.
55.
382
0.9
2410
--
--
--
--
-

66 | Setting Objectives for Oyster Habitat Restoration using Ecosystem Services: A Manager’s Guide
Appendix 1B: Olympia OysterSt
ate
Bay
Nam
e
Bay
Volu
me
(10
00
m3 )
Bay
Resi
denc
e Ti
me
(day
s)
His
toric
Ree
f Are
a (h
a)
His
toric
Tot
al D
ensi
ty (
ind/
m2 )
His
toric
Mea
n Le
ngth
(mm
)
His
toric
Mea
n In
d Bi
omas
s (g
)
Curr
ent R
eef A
rea
(ha)
Cur
rent
Tot
al D
ensi
ty (
ind/
m2 )
Curr
ent M
ean
Leng
th (m
m)
Curr
ent M
ean
Ind
Biom
ass
(g)
CA Elkhorn Slough 8520 3 2 116.3 35 0.2 0 NA NA NA
CA Humboldt Bay 221440 3 137 116.3 35 0.2 0 NA NA NA
CA San Francisco Bay 7762080 18 3251 116.3 35 0.2 0 NA NA NA
OR Netarts Bay 14100 0 UK NA NA NA 4 32.7 34 0.28
OR Yaquina Bay 29820 1 27 116.3 35 0.2 UK NA NA NA
WA Willapa Bay 1072100 1 6225 116.3 35 0.2 UK NA NA NA

Setting Objectives for Oyster Habitat Restoration using Ecosystem Services: A Manager’s Guide | 67
Appendix 2: Shell Height Biomass Conversion
Relationship between maximum shell length (shell height) and soft tissue dry weight.
Estuary State Shell Height (SH) (mm) to dry tissue mass (g) conversion Reference
Delaware Bay Delaware 0.00003 x SH^2.4503 Bushek unpublished data
Chester River Maryland 0.00003 x SH^2.3512 Liddel 2007 in Lane et al. 2011
Coastal Bays, Virginia eastern shore Virginia 0.0003 x SH^1.9352 Ross & Luckenbach 2009
James River Virginia 0.0000712 x SH^2.15 Mann et al. 2009Great Wicomico Virginia 0.0000096318 x SH^2.743 Southworth et al. 2010Piankatank River Virginia 0.000049216 x SH^2.295 Harding et al. 2010NA South Carolina 0.00003 x SH^2.1727 Grizzle et al. 2008Mosquito Lagoon, FL Florida 0.0003 x SH^1.8228 Parker et al. 2013Loxahatchee River Florida 0.0001*SH^2.0827 Parker et al. 2013Tampa Bay Florida 0.00006*SH^2.2476 Parker et al. 2013Aransas Bay Texas (SH/10^1.846)^(1/0.258) Beseres Pollack et al 2011Yaqunia Bay Oregon 0.000006 x SH^3.06 Gray unpublished data
Also see Powell et al. 2015 for more examples and discussion of allometric relationships between oyster shell height and dry tissue mass.
68 | Setting Objectives for Oyster Habitat Restoration using Ecosystem Services: A Manager’s Guide
ReferencesGrizzle, R.E., Greene, J.K., Coen, L.D. (2008) Seston removal by natural and constructed intertidal eastern oyster
(Crassostrea virginica) reefs: A comparison with previous laboratory studies, and the value of in situ methods. Estuaries and Coasts 31, 1208-1220.
Harding, J.M., Mann, R., Southworth, M.J., Wesson, J.A. (2010) Management of the Piankatank River, Virginia, in support of oyster (Crassostrea virginica, Gmelin 1791) fishery repletion. Journal of Shellfish Research 29, 867-888.
Lane, H., Michaelis, A., Paynter, K.T. (2011) Oyster restoration monitoring 2010. Report to the Oyster Restoration Partnership. 87pp.
Mann, R., Southworth, M.J., Harding, J.M., Wesson, J.A. (2009) Population studies of the native oyster, Crassostrea virginica, (Gmelin, 1791) in the James River, Virginia, USA. Journal of Shellfish Research 28, 193-220.
Parker, M.L., Arnold, W.S., Geiger, S.P., Gorman, P., Leone, E.H. (2013) Impacts of freshwater management activities on eastern oyster (Crassostrea virginica) density and recruitment: Recovery and long-term stability in seven Florida estuaries. Journal of Shellfish Research 32, 695-708.
Powell, E.N., Mann, R., Ashton-Alcox, K.A., Kim, Y., Bushek, D. (2015) The allometry of oysters: spatial and temporal variation in the length–biomass relationships for Crassostrea virginica. Journal of the Marine Biological Association of the United Kingdom FirstView, 1-18.
Ross, P.G., Luckenbach, M.W. (2009) Population assessment of eastern oysters (Crassostrea virginica) in the seaside coastal bays. 111pp.
Southworth, M., Harding, J.M., Wesson, J.A., Mann, R. (2010) Oyster (Crassostrea virginica, Gmelin 1791) population dynamics on public reefs in the Great Wicomico River, Virginia, USA. Journal of Shellfish Research 29, 271-290.
Setting Objectives for Oyster Habitat Restoration using Ecosystem Services: A Manager’s Guide | 69
Appendix 3: Detailed Fisheries Methods
The number of individuals surviving over time decreases by M, the natural mortality rate. The number of individuals surviving to each age class can therefore be estimated by applying:
where Ni is the density enhancement for age class i and M is the natural mortality of the fish species.
M is size dependent rather than constant over time. M can therefore be estimated for a given size using the Lorenzen function M(t) = M (Lm/L(t)), (Lorenzen 2000), where L(t) is the length at time t and Lm
is the length of recruitment to the fishery, or length at maturity if age or length of recruitment to the fishery is unavailable.
For each age class the expected growth can be determined by von Bertalanffy growth curves:
where L∞ is the asymptotic maximum length (in cm), K is the Brody growth coefficient and t0 is the age at
zero length.
The average weight for each age class (Wi) can then be calculated from the length using the length-weight relationship:
where a and b are species-specific constants. The increase in weight of an average fish between age classes (Pi) was calculated:
The total annual enhancement of a species (gm-2) can be calculated by summing the incremental increase in weight each year for an average fish (Pi), multiplied by the number (density) of fish (Ni) for each age class.
For further detail of the methods used in estimating the enhanced production due to oyster reefs, please see zu Ermgassen et al. (2015)
ReferencesLorenzen, K. (2000) Allometry of natural mortality as a basis for assessing optimal release size in fish-stocking programmes. Canadian Journal of Fisheries and Aquatic Sciences, 57, 2374-2381.
zu Ermgassen, P. S. E., Grabowski, J. H., Gair, J. R., Powers, S. P. (2015), Quantifying fish and mobile invertebrate production from a threatened nursery habitat. Journal of Applied Ecology. doi: 10.1111/1365-2664.12576, http://onlinelibrary.wiley.com/doi/10.1111/1365-2664.12576/abstract

70 | Setting Objectives for Oyster Habitat Restoration using Ecosystem Services: A Manager’s Guide
Appendix 4: Table of Life History Parameters of Recruitment Enhanced Species
Spec
ies
Com
mon
na
me
ML∞
Kt 0
ab
t max
Refe
renc
es
Fish
Arc
hosa
rgus
pr
obat
ocep
halu
s (A
tlant
ic)
Shee
pshe
ad0.
2038
.10.
39-1
.130.02
373.04
0.20
Mur
phy
and
Mac
Don
ald
2000
Arc
hosa
rgus
pr
obat
ocep
halu
s (G
ulf
of M
exic
o )
Shee
pshe
ad0.
2045
.10.
24-1
.170.03
432.91
0.20
Mur
phy
and
Mac
Don
ald
2000
Baird
iella
chry
sour
aSi
lver
Per
ch1.3
927
.00.
69-0
.24
0.01
143.
001.3
9A
yala
-Per
ez e
t al.
2006
, Wel
sh a
nd
Bred
er 19
23
Bath
ygob
ius s
opor
ator
Frill
fin G
oby
1.08
26.5
2.56
0.04
0.00
912.
841.0
8H
erna
man
and
Mun
day
2005
(V
alen
cien
nea
mur
alis
[M] a
s a
prox
y)Ch
aeto
dipt
erus
fabe
rSp
adefi
sh0.
5549
.00.
34-0
.180.
0373
2.96
0.55
Hay
se 19
90, V
iann
a et
al.
2004
Chas
mod
es b
osqu
ianu
sSt
riped
Ble
nny
2.14
8.6
1.46
0.02
0.01
283.
042.
14Ro
bins
and
Ray
1986
, Her
nam
an a
nd
Mun
day
2005
(Val
enci
enne
a m
ural
is [M
] as
pro
xy)
Cten
ogob
ius b
oleo
som
aD
arte
r Gob
y2.
148.
01.4
60.
020.
0094
3.06
2.14
Robi
ns a
nd R
ay 19
86, H
erna
man
and
M
unda
y 20
05 (A
mbl
ygob
ius b
ynoe
nsis
[F]a
s pr
oxy)
Fund
ulus
maj
alis
Strip
ed K
illifi
sh2.
1415
.90.
28-0
.24
0.01
323.
032.
14Cl
emm
er a
nd S
chw
artz
1965
, Kne
ib a
nd
Stiv
en 19
78 (F
. het
eroc
litus
as
prox
y)
Gob
ieso
x st
rum
osus
Skill
etfis
h2.
148.
61.4
60.
020.
0128
3.04
2.14
Smith
1997
, Boh
nsac
k an
d H
arpe
r 19
88, H
erna
man
and
Mun
day
2005
(A
mbl
ygob
ius b
ynoe
nsis
[F] a
s pr
oxy)
Gob
ioso
ma
bosc
Nak
ed G
oby
1.08
6.5
1.10
-0.0
30.
0105
2.99
1.08
Robi
ns a
nd R
ay 19
86, B
osch
ung,
H.T.
, Jr.,
an
d R.
L. M
ayde
n. 2
004,
Her
nam
an a
nd
Mun
day
2005
(Ist
igob
ius g
oldm
anni
[M]
as p
roxy
)
Hyp
sobl
enni
us h
entz
Feat
her B
lenn
y1.0
810
.70.
62-0
.39
0.01
102.
961.0
8Ro
bins
and
Ray
1986
, Aze
vedo
and
H
omem
200
9 (P
arab
lenn
ius r
uber
as
prox
y)
Hyp
sobl
enni
us io
ntha
sFr
eckl
ed B
lenn
y1.0
810
.70.
62-0
.39
0.01
102.
961.0
8Ro
bins
and
Ray
1986
, Aze
vedo
and
H
omem
200
9 (P
arab
lenn
ius r
uber
as
prox
y)

Setting Objectives for Oyster Habitat Restoration using Ecosystem Services: A Manager’s Guide | 71
Lago
don
rhom
boid
esPi
nfish
0.78
22.0
0.33
-1.10
0.03
163.
030.
78N
elso
n 20
02
Leio
stom
us x
anth
urus
Spot
1.08
23.9
0.89
-0.0
40.
0092
3.07
1.08
Sund
araj
1960
, Daw
son
1965
, Hug
g 19
96, F
lorid
a Fi
sh a
nd W
ildlif
e Co
nser
vatio
n Co
mm
issi
on
Lutja
nus g
riseu
sG
ray
Snap
per
0.21
89.0
0.10
-0.3
20.
0232
2.88
0.21
Man
ooch
and
Mat
heso
n 19
83, B
ohns
ack
and
Har
per 1
988,
Man
ooch
1987
Myc
tero
perc
a m
icro
lepi
sG
ag G
roup
er0.
1811
8.0
0.17
-0.7
40.
0093
3.05
90.
18H
ood
and
Schl
iede
r 199
2, M
cGov
ern
et
al. 2
005
Ops
anus
bet
a (F
emal
e)O
yste
r Toa
dfish
0.
6020
.10.
790.
470.
0063
3.28
0.60
Mal
ca e
t al.
2009
Ops
anus
bet
a (M
ale)
Oys
ter T
oadfi
sh
0.60
39.4
0.30
0.36
0.00
633.
280.
60M
alca
et a
l. 20
09
Ops
anus
tau
(Fem
ale)
Oys
ter T
oadfi
sh
0.49
27.2
0.39
-0.4
10.
0100
3.22
0.49
Swar
tz a
nd v
an E
ngle
1968
, Rad
tke
et a
l. 19
85
Ops
anus
tau
(Mal
e)O
yste
r Toa
dfish
0.
4040
.70.
15-0
.33
0.01
003.
220.
40Sw
artz
and
van
Eng
le 19
68, R
adtk
e et
al.
1985
Ort
hopr
istis
chry
sopt
era
Pigfi
sh0.
6047
.50.
16-1
.140.
0128
3.06
0.60
Pete
rson
et a
l. 20
03, D
arcy
1983
Para
licht
hys l
etho
stig
ma
(Fem
ale)
Sout
hern
Fl
ound
er
0.55
66.0
0.21
-1.3
20.
0043
3.30
0.55
Stun
z et
al.
2000
, Fis
cher
and
Tho
mps
on
2004
Para
licht
hys l
etho
stig
ma
(Mal
e)So
uthe
rn
Flou
nder
1.0
833
.31.0
3-0
.25
0.00
433.
301.0
8St
unz
et a
l. 20
00, F
isch
er a
nd T
hom
pson
20
04Pr
iono
tus s
p.Se
arob
in0.
7336
.60.
390.
000.
0097
3.48
0.73
Rich
ards
et a
l. 19
79, R
obin
s &
Ray
1986
Crus
tace
ans
Calli
nect
es sa
pidu
s (F
emal
e)Bl
ue C
rab
1.00
17.6
1.45
0.13
1.147
41.8
61.0
0M
urph
y et
al.
2007
, Sm
ith 19
97
Calli
nect
es sa
pidu
s (M
ale)
Blue
Cra
b 1.0
017
.61.4
50.
130.
7634
2.10
1.00
Mur
phy
et a
l. 20
07, S
mith
1997
Farfa
ntep
enae
us a
ztec
usBr
own
Shrim
p18
.00
19.1
1.14
-0.2
90.
0071
3.07
18.0
0A
rreg
uin
Sanc
hez
1999
, Min
ello
et a
l. 20
08.
Lito
pana
eus s
etife
rus
Whi
te S
hrim
p18
.00
19.1
1.14
-0.2
90.
0065
3.00
18.0
0A
rreg
uin
Sanc
hez
1999
(F. a
ztec
us a
s pr
oxy)
, Min
ello
et a
l. 20
08M
enip
pe m
erce
naria
(F
emal
e)St
one
Crab
0.70
12.6
0.45
60.
255
0.28
853.
048
0.70
Rest
repo
1989
, Sul
livan
1979
, Ger
hart
an
d Be
rt 2
008
Men
ippe
mer
cena
ria
(Mal
e)St
one
Crab
0.70
12.6
0.45
60.
255
0.19
413.
290
0.70
Rest
repo
1989
, Sul
livan
1979
, Ger
hart
an
d Be
rt 2
008
72 | Setting Objectives for Oyster Habitat Restoration using Ecosystem Services: A Manager’s Guide
ReferencesArreguin-Sanchez, F. (1999) Age and growth estimation for the white shrimp Penaeus setiferus, from the offshore
fishery of the Northwestern Gulf of Mexico. Proceedings of the 45th Gulf and Caribbean Fisheries Institute, 146-159.
Ayala-Perez, L. A., Ramos-Miranda, J., Tapia-Garcia, M., Salgado-Ugarte, I. H. & Miranda, G. (2006) Distribution, abundance and population parameters of the silver perch Bairdella chrysoura (Lacepede, 1802) (Pisces: Sciaenidae) in Terminos Lagoon, Campeche, Mexcio. Thalassas, 22, 9-18.
Azevedo, J. M. & Homem, N. (2009) Age and growth, reproduction and diet of the red blenny Parablennius ruber (Blenniidae). Cybium, 202, 129-133.
Bohnsack, J. A. & Harper, D. E. (1988) Length-weight relationships of selected marine reef fishes from the southeastern United States and the Caribbean. eds, pp. 31. NOAA Tech. Mem. NMFS-SEFC-215.
Boschung, H. T., Jr. and R.L. Mayden. (2004) Fishes of Alabama. Smithsonian Books, Washington, D.C.
Clemmer, G. H. & Schwartz, F. J. (1964) Age, growth, and weight relationships of the striped killifish, Fundulus majalis, near Solomons, Maryland. Transactions of the American Fisheries Society, 93, 197-198.
Darcy, G. H. (1983) Synopsis of biological data on the pigfish, Orthopristis chrysoptera (Pisces: Haemulidae). FAO Fisheries Synopsis No. 134, pp. 23. FAO.
Dawson, C. E. (1965) Length-weight relationships of some Gulf of Mexico fishes. Transactions of the American Fisheries Society, 94, 279-280.
Fischer, A. J. & Thompson, B. A. (2004) The age and growth of southern flounder, Paralichthys lethostigma, from Louisiana estuarine and offshore waters. Bulletin of Marine Science, 75, 63-77.
Florida Fish and Wildlife Conservation Commission (2010) Species account for spot (Leiostomus xantharus) in Florida. pp. 6. Florida Fish and Wildlife Conservation Commission.
Gerhart, S. D. & Bert, T. M. (2008) Life-history aspects of stone crabs (genus Menippe): size at maturity, growth and age. Journal of Crustacean Biology, 28, 252-261.
Hayse, J. W. (1989) Feeding habits, age, growth, and reproduction of Atlantic spadefish Chaetodipterus faber (Pisces: Ephippidae) in South Carolina. Fishery Bulletin, 88, 67-83.
Hernaman, V. & Munday, P. L. (2005) Life-history characteristics of coral reef gobies. I. Growth and life-span. Marine Ecology Progress Series, 290, 207-221.
Hood, P. B. & Schlieder, R. A. (1992) Age, growth, and reproduction of gag, Mycteroperca Microlepis (Pisces: Serranidae), in the eastern Gulf of Mexico. Bulletin of Marine Science, 51, 337-352.
Hugg, D. O. (1996) MAPFISH georeferenced mapping database. Freshwater and estuarine fishes of North America. Life Science Software. Edgewater, Maryland, USA.
Kneib, R. T. & Stiven, A. E. (1978) Growth, reproduction, and feeding of Fundulus heteroclitus (L.) on a North Carolina salt marsh. Journal of Experimental Marine Biology and Ecology, 31, 121-140.

Setting Objectives for Oyster Habitat Restoration using Ecosystem Services: A Manager’s Guide | 73
Malca, E., Barimo, J. F., Serafy, J. E. & Walsh, P. J. (2009) Age and growth of the gulf toadfish Opsanus beta based on otolith increment analysis. Journal of Fish Biology, 75, 1750-1761.
Manooch III, C. S. (1987) Age and growth of snappers and groupers. Tropical snappers and groupers: biology and fisheries management (eds J. J. Polovina & S. Ralston), pp. 329-373. Westview Press, Inc., Boulder and London.
Manooch Ill, C. S. & Matheson III, R. H. ( 1981) Age, growth and mortality of gray snapper collected from Florida waters. Proceedings of the Annual Conference of Southeast Association of Fish and Wildlife Agencies pp. 331-344.
McGovern, J. C., Sedberry, G. R., Meister, H. S., Westendorff, T. M., Wyanski, D. M. & Harris, P. J. (2005) A tag and recapture study of gag, Mycteroperca microlepis, off the Southeastern U.S.. Bulletin of Marine Science, 76, 47-59.
Minello, T. J., Matthews, G. A., Caldwell, P. A. & Rozas, L. P. (2008) Population and production estimates for decapod crustaceans in wetlands of Galveston Bay, Texas. Transactions of the American Fisheries Society, 137, 129-146.
Murphy, M. D. & MacDonald, T. C. (2000) Reproductive biology of sheepshead in the Northern Gulf of Mexico. pp. 50. Florida Fish and Wildlife Conservation Commission, St. Petersburg, FL.
Murphy, M. D., McMillen-Jackson, A. L. & Mahmoudi, B. (2007) A stock assessment for blue crab, Callinectes sapidus, in Florida waters. pp. 90. Florida Fish and Wildlife Conservation Commission and FIsh and Wildlfe Research Institute, St. Petersburg FL.
Nelson, G. A. (2002) Age, growth, mortality, and distribution of pinfish (Lagodon rhomboides) in Tampa Bay and adjacent Gulf of Mexico waters. Fishery Bulletin, 100, 582-592.
Radtke, R. L., Fine, M. L. & Bell, J. (1985) Somatic and otolith growth in the oyster toadfish (Opsanus tau L.). Journal of Experimental Marine Biology and Ecology, 90, 259-275.
Restrepo, V. R. (1989) Growth estimates for male stone crabs along the southwest coast of Florida: A synthesis of available data and methods. Transactions of the American Fisheries Society, 118, 20-29.
Richards, S. W., Mann, J. M. & Walker, J. A. (1979) Comparison of spawning seasons, age, growth rates, and food of two sympatric species of searobins, Prionotus carolinus and Prionotus evolans, from Long Island Sound. Estuaries, 2, 255-268.
Robins, C. R. & Ray, G. C. (1986) A field guide to Atlantic coast fishes of North America. Houghton Mifflin Company, Boston, U.S.A.
Smith, C. L. (1997) Tropical marine fishes of the Caribbean, the Gulf of Mexico, Florida, the Bahamas, and Bermuda. Alfred A. Knopf, New York.
Stunz, G. W., Linton, T. L. & Colura, R. L. (2000) Age and growth of southern flounder in Texas waters, with emphasis on Matagorda Bay. Transactions of the American Fisheries Society, 129, 119-125.

74 | Setting Objectives for Oyster Habitat Restoration using Ecosystem Services: A Manager’s Guide
Notes
___________________________________________________________________________________________________________________________
___________________________________________________________________________________________________________________________
___________________________________________________________________________________________________________________________
___________________________________________________________________________________________________________________________
___________________________________________________________________________________________________________________________
___________________________________________________________________________________________________________________________
___________________________________________________________________________________________________________________________
___________________________________________________________________________________________________________________________
___________________________________________________________________________________________________________________________
___________________________________________________________________________________________________________________________
___________________________________________________________________________________________________________________________
___________________________________________________________________________________________________________________________
___________________________________________________________________________________________________________________________
___________________________________________________________________________________________________________________________
___________________________________________________________________________________________________________________________
___________________________________________________________________________________________________________________________
___________________________________________________________________________________________________________________________
___________________________________________________________________________________________________________________________
___________________________________________________________________________________________________________________________
___________________________________________________________________________________________________________________________
___________________________________________________________________________________________________________________________
___________________________________________________________________________________________________________________________
___________________________________________________________________________________________________________________________
___________________________________________________________________________________________________________________________
___________________________________________________________________________________________________________________________
___________________________________________________________________________________________________________________________


The Nature ConservancyURI Graduate School of Oceanography South Ferry Road Narragansett, RI 02882