shapedown project: a bilingual approach for the hispanic ......shapedown project: a bilingual...
TRANSCRIPT

Shapedown Project: A Bilingual Approach for the Hispanic
Community Final Report1
Rubén Martinez, Ph.D.2
Jean Kayitsinga, Ph.D.2
Daniel Velez-Ortiz, Ph.D.3
Pilar Horner, Ph.D.3
Sonia Acosta, Ph.D.4
RESEARCH REPORT NO. 54
January 2016
The Midwest’s premier Hispanic center undertaking research on issues of relevance to the Hispanic community in the
social sciences and economic and community development. JSRI is a unit of University Outreach and Engagement at
Michigan State University.
____________________________________
1 This project was funded by the Michigan State University Extension (MSUE), Health and Nutrition Institute
Initiative. 2 Julian Samora Research Institute, Michigan State University.
3 Julian Samora Research Institute and School of Social Work, Michigan State University.
4 Centro Multicultural La Familia (CMLF).

JSRI is committed to the generation, transmission, and application of knowledge to serve the needs of Latino communities in the Midwest and across the nation. To this end, it has organized a number of publication initiatives to facilitate the timely dissemination of current research and information relevant to Latinos. Latinos in Michigan
A focused approach to disseminating information on Latinos in the state of Michigan. These specialized reports include documents, charts, and graphs that utilize primary data from JSRI’s researchers and initiatives. Research Reports
JSRI’s flagship publication for scholars who want to produce a quality publication with more detail than is usually allowed in mainstream journals. Research Reports are selected for their significant contribution to the knowledge base of Latinos. Working Papers
For scholars who want to share their preliminary findings and obtain feedback from others in Chicano and Latino Studies. Statistical Briefs/CIFRAS
For distribution of “facts and figures” on Latino issues and conditions. Also designed to address policy questions and to highlight important topics. Occasional Papers
For the dissemination of speeches, papers, and practices of value to the Latino community which are not necessarily based on a research project. Examples include historical accounts of people or events, “oral histories,” motivational talks, poetry, speeches, and legal technical reports. Demographic Reports
JSRI demographic reports use primary data from research projects and secondary data from government sources. Examples include census data; projected population summarizations; statistical profiles of Latino household size, educational attainment, and earned income; and localized and regional population projections. NEXO Newsletter
JSRI’s official newsletter is produced in both printed and pdf formats. Comments can be sent to [email protected].
Julian Samora Research Institute ● Dr. Rubén O. Martinez, Director
Michigan State University
219 S. Harrison Rd., Room 93 ● East Lansing, MI 48824-4586
Phone: (517) 432-1317 ● Fax: (517) 432-2221
E-mail: [email protected] ● Web: jsri.msu.edu

Shapedown Project: A Bilingual Approach for the Hispanic Community
Rubén Martinez, Ph.D., Jean Kayitsinga, Ph.D., Daniel Velez-Ortiz, Ph.D., Pilar Horner,
Ph.D., Sonia Acosta, Ph.D.
RESEARCH REPORT NO. 54
January 2016
ABSTRACT
Obesity is a public health concern in the United States. Minority children, especially Mexican
American boys and African American girls, are more likely than non-Hispanic White children to
be obese. Obese children are at higher risk for chronic health conditions such as heart disease
and Type II Diabetes and are at a greater risk for social and psychological problems. The
objective of this study was to evaluate a Spanish version of the Shapedown program and assess
its effectiveness in helping Latino families in Pontiac, Michigan learn to make healthy lifestyle
choices regarding nutrition and exercise as they build effective family support relationships.
The results show no significant differences in child’s eating habits and importance of eating
healthy foods between the Shapedown and control groups. However, we found a significant
change in that scale over time. We did not expect, given a short period of time, to find a
significant difference in child’s BMI between the Shapedown and control groups or over time.
Qualitative results showed valuable lessons learned from the Shapedown program, including
learning how to eat healthy foods, how to exercise together as a family, and the importance of
the family unit as key for long-term sustainability of adopting healthy lifestyles. Overall, the
project was a positive experience for both participants and university researchers in terms of
collaborative efforts, lessons learned, and barriers in conducting evaluation and collaborative
research between university and community organizations.
ABOUT THE AUTHORS
Rubén Martinez is professor of sociology and director of the Julian Samora Research Institute at
Michigan State University.
Jean Kayitsinga is an assistant professor at the Julian Samora Research Institute, University Outreach and
Engagement.
Daniel Vélez Ortiz is assistant professor of social work with a joint appointment at the Julian Samora
Research Institute at Michigan State University.
Pilar S. Horner is assistant professor of social work with a joint appointment at the Julian Samora
Research Institute at Michigan State University.
Sonia Acosta is President and Chief Executive Officer of Centro Multicultural La Familia, an
organization located in Pontiac and whose mission is to provide culturally competent support services to
families in a holistic approach in order to improve their quality of life.
SUGGESTED CITATION
Martinez, Rubén (Ph.D.), Kayitsinga, Jean (Ph.D.), Velez-Ortiz, Daniel (Ph.D.), Horner, Pilar (Ph.D.),
Acosta, Sonia (Ph.D.) Shapedown Project: A Bilingual Approach for the Hispanic Community. JSRI
Research Report No. 54. East Lansing, Michigan: The Julian Samora Research Institute, Michigan State
University.
© 2016 Michigan State University. All rights reserved.

THIS PAGE INTENTIONALLY LEFT BLANK
RESEARCH REPORT NO. 54
Table of Contents
Introduction ………………………………………………………………………………………………………….1
Theoretical Background ………………………………………………………………………………..……….2
Data and Methods ……………………………………………………………………………………………..….5
Quasi-Experimental Design ………………………………………………………………………………5
Development of Questionnaires ………………………………………………………………………..6
Session 1 ………………………………………………………………………………………………….………6
Session 2 ………………………………………………………………………………………………............8
Data Analysis …..……………………………………………………………………..…………………………....9
Results …………………………………………………………………………………………………………....….11
Quantitative Results ….………………………………………………………………………….............11
Qualitative Results.………………..……………………………………………………………………….28
Summary and Conclusions ….……………………………………………………………………………… 30
Future Studies …………….………………………………………………………………………………… 32
References .....………………………….…………………………………………………………………………. 33
Appendix A .………………………………………………………………………….……………………………37
Appendix B …………………………………………………………………………………………………………37

List of Tables
Table 1. Total number of children under study by session, treatment group, and time of observation …………………………………………………………………………………………………………9 Table 2. Descriptive Statistics (mean and standard deviation) and Analysis of Variance Table for Child’s BMI by Time of Observation and Treatment Group ……………………...12 Table 3. Descriptive Statistics (mean and standard deviation) and Analysis of Variance Table for Child’s Psychological Well-being by Time of Observation and Treatment Group ………………………………………………………………………………………………………………..16 Table 4. Descriptive Statistics (mean and standard deviation) and Analysis of Variance Table for Eating Habits and Importance of Eating Healthy Foods by Time of Observation and Treatment Group ………………………………………………………………………22

List of Figures
Figure 1. Weight Status of Children at Pre-Test ……………………………………………….…….11 Figure 2. Children’s Body Mass Index (BMI) by Treatment Group and Time of Observation .………………………………………………………………………………………………….……13 Figure 3. Perceived Child’s Weight Status ……………………………………………………….…….13 Figure 4. Conditions of Child’s General Physical Health as Reported by Parents ……...14 Figure 5. Number of Times in the Last 12 Months a Child Has Seen a Health Professional ……………………………………………………………………………………………………..…14 Figure 6. Number of Times in the Last 12 Months a Child Has Seen a Psychiatrist, Doctor, or Counselor for an Emotional, Mental, or Behavioral Problem …………….…….15 Figure 7. Child’s Psychological Well-Being in Quintile Range ……………………………….…15 Figure 8. Children’s Psychological Well-being by Treatment Group and Time of Observation ………………………………………………………………………………………………………..17 Figure 9. Child’s Physical Activity (PA) During Structured Sports and Free Time ……..18 Figure 10. Number of Days of PA/Exercises for 20 Minutes or more per Week ………...18 Figure 11. Child’s Physical Inactivity -- How Often they Use Game Systems or Computer Games ………………………………………………………………………………………………………………..19 Figure 12. Parent Physical Activity/Exercise ………………………………………………………….19 Figure 13. Parent Vigorous Physical Activity ………………………………………………………….20 Figure 14. Parents’ Belief about the Amount of Food Child Should Eat …………………….20 Figure 15. Parent’s Nutrition Control in Quintile Rank ……………………………………………21 Figure 16. Eating Habits and Importance of Eating Healthy Foods in Quintile Rank …21 Figure 17. Eating Habits and Importance of Eating Healthy Foods by Treatment Group and Time of Observation ……………………………………………………………………………………...23 Figure 18. Non-Family Attachment and Communication in Quintile Rank ……………….23 Figure 19. Family Attachment and Communication in Quintile Rank ……………………….24

Figure 20. Family Members Working Together in Quintile Range ……………………………24
Figure 21. Prevalence of Obesity among Parents …………………………………………………....25
Figure 22. Perceived Parents’ Weight Status ………………………………………………………….25
Figure 23. Prevalence of Parents Self-Rated Health ……………………………………………..26
Figure 24. Parents Self-Esteem in Quintile Range.…………………………………………………..26
Figure 25. Conducive Physical Activity Neighborhoods in Quintile Range …………………27
Figure 26. Neighborhood Healthy Foods Availability in Quintile Range ……………………28
Figure 27. Perceived Neighborhood Safety in Quintile Range …………………………………..28

1
Introduction
Obesity is a threatening health condition in the United States. According to the Centers
for Disease Control and Prevention (CDC), about one-third of U.S. adults are obese (i.e., with a
Body Mass Index (BMI) of 30.0 or above). In 2007-2008, about 17% of U.S. children and
adolescents ages 2-19 years were obese (Ogden and Carroll, 2010). Latino children and
adolescents, especially Latino boys are more likely to be obese. According to Ogden and Carroll
(2010), the prevalence of obesity in 2007–2008 was significantly higher among Mexican-
American adolescent boys (26.8%) than among non-Hispanic white adolescent boys (16.7%).
Among girls in 2007–2008, non-Hispanic Black adolescents (29.2%) were significantly more
likely to be obese compared with non-Hispanic White adolescents (14.5%) (Ogden and Carroll,
2010).
In Michigan, almost 32% of adults in 2010 were obese and 35% were overweight (i.e.,
with a BMI between 25.0 –29.9) (CDC, 2011). According to a report of the Michigan’s
Nutrition, Physical Activity and Obesity Program (Boinapally, Fussman, and Imes, 2011), the
prevalence of obesity among Michigan adult population has consistently increased since 2000. In
Michigan, Latinos (42.6%) and non-Hispanic Blacks (41.6%) had a significantly higher
prevalence of obesity than non-Hispanic Whites (28.7%). Among youth in Michigan (9th
– 12th
grades), the prevalence of obesity was 11.9% in 2009, compared to 10.7% in 2001. In 2009,
non-Hispanic Black youth (18.2%) had a higher prevalence of obesity compared to Latinos
(10.9%) and non-Hispanic White youth (10.3%) (Boinapally, Fussman, and Imes, 2011).
According to the Centers for Disease Control and Prevention, obese children and
adolescents are at higher risk for high blood pressure and cholesterol, which are risk factors for
cardiovascular disease; increased risk of Type 2 Diabetes; breathing problems such as asthma
and sleep apnea; joint problems and muscular discomfort; fatty liver disease, gallstones, and
gastro-esophageal reflux. They are more likely to become obese adults, resulting in serious and
chronic health conditions, such as heart disease, Diabetes, and cancer, and have a greater risk of
social and psychological problems (Centers for Disease Control and Prevention, 2011).
Obesity results from an imbalance between the calories taken from food and beverage
and the calories expended to support normal growth and development, metabolism, and physical
activity. This energy imbalance is influenced by several and interrelated factors, including
biological, demographic, psychological, socio-cultural, organizational, environmental, and
regulatory factors (U.S. DHHS, 2011).
This study, “Shapedown Project,” is an intensive 10-week program that helps families
learn to make healthy lifestyle choices regarding nutrition and exercise as they build effective
family support relationships. The program was initially designed by the University of California,
San Francisco School of Medicine on the basis that it is critically important to involve parents or
guardians in the process of helping children improve their physical health and have open
communication about their feelings concerning their weight. According to the Shapedown
validation results, parental involvement with their children in weight management lead to
significant improvement in weight, diet, exercise habits, self-esteem and capacity to deal with
body image issues and stress.
Developed in English and validated with English-speaking families, the current study
sought to examine the effectiveness of using a Spanish-version of Shapedown with Latino
families in Pontiac, Michigan. Recognizing the need for Latino families to have access to
programs that address cognitive and behavioral needs regarding obesity prevention, JSRI

2
conducted a two-year evaluation of the Spanish version of the Shapedown program, in
collaboration with El Centro Multicultural de la Familia (CMLF), a community-based nonprofit
service organization in Pontiac, Michigan. Shapedown materials were translated into Spanish to
address the needs of Latino families. The main goal of the program was to help Latino families
in Pontiac learn to make healthy lifestyle choices. Specific program goals were:
1. To help participants gain knowledge about the benefits of an active lifestyle and learn
physical activities that can improve and maintain their health;
2. To help participants gain knowledge about the benefits of a healthy diet and how to
choose foods that increase their health;
3. To help children, teen and family participants support each other in making and
maintaining healthy choices about diet and lifestyle activities; and
4. To help participants learn family communication techniques that support healthy
lifestyles and relieve family stress and tension.
This report frames the theoretical background for explaining why programs such as
“Shapedown” can help reduce the obesity problem and improve other health outcomes among
disadvantaged youth. In addition, we provide an overview of the research site and population
under study, the methods used to evaluate the impact of Shapedown program, and findings.
Theoretical Background
This study uses the social-ecological framework (Bronfenbrenner, 1979, 1986;
Bronfenbrenner & Morris, 1998; Harrison, 2011; Fiese and Jones, 2012; Koplan et al., 2005;
Koplan, 2007; Swinburn et al., 2011; Caprio et al., 2008; Davison and Birch, 2001). The social-
ecological framework underscores the importance of multiple ecological levels that influence
health behaviors, including individual, home, and family characteristics, neighborhood and
community environments, and larger economic systems and government policies. This theory
suggests that development or change in individual characteristics cannot be explained without
consideration of the context or ecological niche, in which the person is embedded. For the child,
an ecological niche includes the immediate contexts, the family and school, which are in turn
embedded in larger social contexts, including the community and the larger society in general.
In this project, we emphasized the family and socio-cultural environments and their influence on
healthy lifestyles.
Family environment
At the family level, determinants of obesity for children and adolescents include feeding
practices, parental decisions about the types of foods available in the home and their children’s
access to these foods; parents’ nutritional knowledge, parents’ dietary intake, parent food
preferences, children’s consumption of high fat foods and soft drinks, peer and sibling
interactions around food, amount of time spent watching TV, child’ sports participation or active
recreation, and influences of parents as role models related to eating, physical activity, and body
size (Davison and Birch, 2001; Lindsay et al. 2006; Kumanyika, 2008). Parents are not only
responsible for food availability and accessibility, but they also influence children’s eating habits
and food preferences at home. In addition, the attitudes and behavior of parents, siblings,

3
relatives, and peers may contribute to children’s eating habits and preferences, which may affect
their body weight.
Parents also strongly influence their children’s level of physical activity (Welk, Wood &
Morss, 2003). One strong and consistent correlate of physical activity in children is the time
spent outdoors, a factor largely determined by parents (Sallis, Prochaska & Taylor, 2000). An
active family also creates norms and expectations about the importance of regular physical
activity. Sedentary behavior, especially watching television and playing electronic games (e.g.,
Game Boys, Play Station, and Wii games, computer games etc.) may contribute to youth obesity
as children spend more hours a day watching television or playing games. The time spent in
front television or playing electronic games reduce the amount of time spent outdoors on
physical activity. Watching television may also expose children to advertisements for high
calorie foods and may therefore lead to increased intake of high calorie foods (Kumanyika,
2008). Parents are key sources of influence for children’s television viewing and sedentary
behavior due to their ability to control such practices (Davison and Birch, 2001).
Social-cultural environments
Parent-child feeding practices shape children’s dietary practices and are in turn
influenced by larger community, demographic, and societal characteristics such as work
demands, ethnicity, socioeconomic status (SES), and the availability of convenience foods
(Davison and Birch, 2001). For example, living in a disadvantaged neighborhood has been
found to be associated with higher prevalence of obesity among children and adults (Nelson et
al., 2006; Morland, Diez Roux and Wing, 2006; Robert and Reither, 2004). Residents in
disadvantaged neighborhoods often have less access to supermarkets and other outlets that
provide access to an affordable mix of healthful food and instead have a higher exposure to fast
food restaurants than residents in higher SES neighborhoods (Sallis and Glanz, 2006).
Societal changes requiring working longer hours for both mothers and fathers have
resulted in the reduction in time parents are available for food preparation, which have impacted
dietary patterns. In most advanced societies, there has been a major shift in diets from traditional
diets high in complex carbohydrates and fiber to high-fat energy-dense diets. There have been
fewer home cooked meals, more calories consumed in restaurants, increased snacking between
meals, and increased availability of fast foods in restaurants (Bruss et al., 2005). Frequent
exposure to convenience foods is likely to be associated with childhood obesity (Davison and
Birch, 2001). There have been also changes in patterns of physical activity linked to risk of
obesity in both adults and children, including increased used of motorized transport, fewer
opportunities for recreational physical activity, and the increased sedentary recreation (Lobstein,
Baur, and Uauy, 2004).
Children’s physical activity is influenced by the encouragement and support that they
receive from their parents and their parents’ own activity patterns, which are in turn influenced
by the time parents have available for such involvement in activities, the accessibility of
recreational facilities, the availability of safe activity areas, ethnicity, SES, and the structure of
school physical education programs (Davison and Birch, 2001). Disadvantaged neighborhoods
tend to have fewer physical activity amenities than affluent neighborhoods, including parks,
leading to more inactivity among neighborhood residents (Lovasi et al., 2009; Yen and Kaplan,
1999) who may also have to deal with the threat of violent crime and insufficient police
protection (Sampson, Raudenbush, and Earls, 1997). Parenting styles related to children’s
4
sedentary behavior may be influenced by neighborhood environments. In particular, high rates
of crime in low-SES and ethnic neighborhoods may constrain parents to keep their children
inside their homes as a protective means of avoiding danger (Davison and Birch, 2001).
Race/Ethnicity, SES, and Gender Contexts
Obesity rates vary greatly by gender, race-ethnicity, and education (Mokdad et al. 2003;
Ogden et al. 2006). Children’s dietary patterns, levels of physical activity, and sedentary
behavior vary by race/ethnicity. While all children in the U.S. are at risk of becoming obese,
African American and Latino children are at higher risk than non-Latino White children (Ogden
et al., 2006, 2010; Lutfiyya et al., 2008). Non-Hispanic White children are also more likely to
involve in physical activity than Asian, Hispanic, and African American children (Sallis and
Saelens, 2000; Gordon-Larsen, McMurray, and Popkin, 2000). Non-Hispanic African
Americans and Latino children report higher rates of sedentary behavior than non-Hispanic
White children (Gordon-Larsen, McMurray, and Popkin, 2000).
The high prevalence of obesity among racial minorities is, among other factors, attributed
to cultural beliefs and practices (Kumanyika 2008), genetics, and physiological factors (Farooqi,
2007), discrimination in access to and use of health, educational, and recreational facilities
(Karlsen and Nazroo, 2002), high levels of stress (Taylor and Turner, 2002), and preventive
health practices related to diet, smoking, exercise, and use of screening tests (Cockerham, 2005).
Parents, children, and families in ethnic minority populations are likely to have higher than
average levels of exposure to environmental and psychological stress (Kumanyika, 2008).
Numerous studies have shown that racial/ethnic differences in health persist over time
and are attributable to social structural and contextual factors, racism, and migration patterns
(Williams and Sternthal, 2010). In particular, socioeconomic status (SES) remains one of the
strongest known determinants of variations in health status and accounts for a substantial
component of the racial-ethnic differences in health (Williams and Collins, 1995). SES is
inversely associated with obesity and is considered a risk factor for obesity (Haas et al., 2003;
Janssen et al., 2006). Boys tend to weigh more than girls among Asians and Hispanics (Ogden et
al., 2006; Popkin and Udry, 1998). Gender also interacts with race/ethnicity and SES in its
effects on health (Schultz and Mullings, 2006). Men and women tend to have different food
consumption expectations and patterns, with men being more likely to eat coarser, higher calorie
foods while women generally eat lighter fare (Bourdieu, 1984).
Acculturation
Exposure to the American environment and acculturation are thought to be associated
with less-healthy diets, sedentary activity, and obesity (Carter, 2002; Fried and Nestle, 2002;
Gordon-Larsen et al., 2003; Popkin and Udry, 1998; Antecol and Bedard, 2006). Previous
studies have shown that acculturation has a positive relationship to the likelihood of being
overweight and obese (Gordon-Larsen et al., 2003; Goel et al., 2004; Akresh, 2007).
Acculturated Latinos are more likely to engage in substance abuse and undesirable dietary
behaviors, and to experience worse birth outcomes, compared to their less acculturated
counterparts (Lara et al., 2005). Less acculturated Latinos consume healthier diets (Lara et al.,
2005; Dixon et al., 2000) and Latinos, on average, consume one or more servings of fruits and
vegetables per day more than do non-Hispanic Whites. However, highly acculturated Latinos eat

5
half the fruits and vegetables than do the less acculturated (Neuhouser et al., 2004). Mazur,
Marquis and Jensen (2003) found that lower levels of acculturation only partially ameliorated the
negative association between poverty and undesirable dietary patterns in Latino youth. Van
Hook and Baker (2010) found that boys whose parents were raised outside the United States
weighed more and gained weight faster than any other group. Within this group, sons of low
English-proficient parents gained weight more slowly than sons of English-proficient parents.
Culture
Overall culture influences food consumption by defining which foods are considered
healthy and which are unhealthy; preferences for and opportunities to engage in physical
activity; and the perception of risk associated with obesity (Caprio et al., 2008). Culture can also
influence the utilization of health services, affecting the likelihood of childhood obesity can be
prevented or effectively treated in specific ethnic groups (Caprio et al., 2008)). While ethnic
differences in access to services can be attributed to differences in SES (e.g., lack of health
insurance among many Latinos or transportation to health care providers), several studies have
pointed to differences in use of services even when access is available. Among Latino families,
differences in patterns of service use have been found to be related to different beliefs about the
cause, course, and cure of an illness, the stigma attached to particular illness, and interactions
between patients and providers (Leslie et al., 2007; Caprio et al., 2008).
The Shapedown project uses a health education model, which stems from a recognition
that knowledge bases are contingent and contextual (Whitehead, 2003). It holds that there are
broader socio-political determinants of an individual’s health, while at the same time recognizing
individual agency and autonomy. Moreover, it recognizes the importance of collective efficacy
(Bandura, 1998), whether at the level of social policy or the family. Shapedown emphasizes the
development of collective efficacy at the family level by clarifying values, promoting
understanding of health concepts, and the relationship between diet and long-term health,
developing skills for rational choices, healthy cooking, physical activity and family
communications. We use an ecological framework which recognizes that both dietary patterns
and physical activity/inactivity are shaped by both personal and environmental factors. This
framework recognizes that motivation is a function of both extrinsic and intrinsic factors, with
Shapedown serving to motivate members of the family to promote healthy lifestyles, and
individuals enhancing their motivation to engage in behavioral changes.
Data and Methods
Quasi-Experimental Design
The Shapedown program uses a quasi-experimental design aimed at following two
sessions of children and adolescents aged 6-17 years and their primary caregivers or guardians.
Each program session is comprised of two groups: The Shapedown group, which received the
10-week intervention, and a control group, which received only materials about nutrition
education. Pre-test and post-test data were collected for both Shapedown and control groups and
a follow up data collection for both groups was done after 10 months following the completion
of the Shapedown intervention.

6
Time 0
--------- 6 months ----------
Time 1
Time 2
(10-12
months)
PRE-TEST
INTERVENTION
(10 week sessions)
POST-TEST
FOLLOW-UP
(time 1)
(time 2)
SHAPEDOWN
TREATMENT
Parents &
Children
1ST SESSION 2ND SESSION Parents &
Children
Parents &
Children
CONTROL
GROUP
Parents &
Children
Parents &
Children
Parents &
Children
Development of Questionnaires
A series of instruments were designed to evaluate the effectiveness of the intervention
and to collect socio-demographic characteristics and anthropometric measures of participants.
The instruments included a parent questionnaire, a child-questionnaire, and anthropometric
measures for all participants. Initial instruments also included a 3-day diet record for parents and
a child 24-hour diet recall instruments, but these were removed for non-completion and low
response rate. The development of instruments was a continuous process in which many
questions were removed while others were changed. The original questionnaires included
anthropometric measures (e.g., weight, height, blood pressure, triceps skinfold, waist-to-hip
ratio, step test, and sit-and-reach test), behavioral (e.g., nutrition, physical activity, dietary
patterns), psychological (e.g., depression about weight, body images, and self-esteem),
nutritional knowledge, family interactions and communication, neighborhood characteristics, and
participants’ program evaluation (e.g., parent program, children/teen sessions, and instructors).
After the development of the instruments, some team members raised concerns about
their length, the content (e.g., nutrition versus self-esteem modules), mode of observations, the
formulation of questions, and the literacy level of the participants. A series of modifications
were made in light of the expressed concerns to simplify the first session instruments. The new
instrument had significantly fewer questions, a different format for answer-choice, and a reduced
number of response choices.
Session I
Recruitment Process
Staff from CMLF recruited Latino families from low-income areas, as required by the
sponsor, Michigan Nutrition Network. Participants were assigned to either a 10-week
Shapedown intervention or to a control group. The aim was to have a sample of 15 participating
families in each group, but we were only able to get 12 families in the Shapedown group and 7
families in the control group, although 15 in each group had agreed to participate. By the end of
the 10-week intervention, some families had changed residence and others were unresponsive.
We are still trying to reach them.

7
Data Collection
Data collection was both quantitative and qualitative. Quantitative data were collected
from participants, and qualitative data were collected from the instructional team through a series
of debriefings that occurred throughout the sessions.
Pre-test First-Session
The pre-test questionnaires for the first session were administered on February 25, 2010
for the Shapedown group and on March 4, 2010 for the control group. Due to poor weather, few
families showed up. After a brief introduction to the program and parties involved, parents and
children were asked to read and sign the informed consents. Anthropometric measures were then
taken from participants who attended and pre-tests forms were administered for both parents and
children. Children were taken for exercise demonstrations while parents completed forms.
Incentives in the form of tote bags filled with nutrition and MSU knick-knacks were given to the
participants. CMLF staff and MSU team members were in attendance, as well as volunteer
nurses. A total of 12 families (19 parents and children) from the Shapedown group and 7
families (17 parents and children) from the control group were pre-tested. The pre-test
instruments used included a parent-questionnaire, a child-questionnaire for children aged 9-17
years, and anthropometric measures for both parents and children 6-17 years.
Intervention
The Shapedown intervention consisted of 10-week sessions focusing on healthy
lifestyles, nutrition and exercise. Routine monitoring of the 10-week sessions (see Appendix A)
ensured that the focus remained on these specific areas. The intervention groups participated in
weekly modules in which nutrition education activities were supported with cooking and
exercise demonstrations. The weekly sessions lasted about two hours and were implemented by
a bilingual nutritionist, who taught them about the importance of a healthy diet and proper
nutrition; a bilingual communication counselor, who taught them about communication among
family members about healthy eating and nutrition; and a bilingual exercise physiologist, who
engaged and taught both children and adults enjoyable and healthy physical activities. The
control group did not receive the Shapedown intervention, but did receive printed materials
related to healthy nutrition. The control group also participated in a nutrition education lecture
and a Zumba (aerobics dance) class.
Post-test First-Session
After a 10-week intervention, post-test measures were taken from parents and children
for the Shapedown group on May 27, 2010 and for the control group on June 1st, 2010. The last
meeting of the Shapedown participants included anthropometric measures and filling out post-
test evaluation instruments. It also included a graduation ceremony and a Zumba demonstration.
Again, volunteer nurses, CMLF staff and MSU team members attended. Similar activities were
conducted for the control group except for the graduation ceremony. Incentives were again
provided to them. In terms of turnout by participants, the post-test evaluation was not well
attended. Nine families (22 parents and children) in the Shapedown group showed up and five

8
families (12 parents and children) from the control group. A number of attempts to follow up on
families who have not completed post-test evaluation forms have been made and the CMLF
Outreach staff person continued to make phone calls and personal visits to participants’ homes.
Session II
Pre-Planning Activities
Lessons learned from the first Shapedown session led the MSU evaluation team to
revamp the pre- and post-tests and make them much shorter and easier to read. It was also
determined that, for efficiency reasons, anthropometric measures should be taken from one
family at a time in a separate room. Recruitment problems arose due to families’ summer
schedules and the date for launching Session II was set for August 11, 2010. Starting on this late
date reduced the time for Shapedown sessions which had to end by September 30th
, 2010. The
Shapedown sessions and evaluations were held at a different location from the first session. This
facility was an improvement over the first because the Shapedown program was able to use
separate rooms for different activities. The first one, although spacious, was limited in the rooms
available for use for different functions.
The curriculum content of the second session was made to accommodate the time
constraints referenced above. It was also adjusted to make it more culturally appropriate as
deemed necessary by the instructors. A brief description of the curriculum for the second session
is included in Appendix B.
Pre-test Second Session
The pre-test occurred on August 11, 2010 for the Shapedown group and on August 12,
2010 for the control group. Eight families (24 parents and children) in the Shapedown group and
nine families (36 parents and children) from the control group were pre-tested. The pre-test
forms used included a parent questionnaire, a child questionnaire for children 9 years or older,
and anthropometric measures for both parents and all children.
Intervention
Another modification that took place in the second group session was the number of
meetings per week. Because the first session began behind schedule due to recruitment
challenges and weather, the second session start date had to be rescheduled. And due to
difficulties in recruiting over the summer, with families unwilling to commit to the program for
ten weeks due to family demands, the program was compressed and began at the end of the
summer. In the first 10 week group, the participants met one evening a week. By the start of the
second session there were only 8 weeks left to deliver a 10 week intervention. To adjust for this
shortened time period, session meetings were sometimes conducted twice a week, particularly
those having to do with orientation to the program and data collection.
Post-test Second Session
The post-test evaluations occurred on September 29, 2010 for the control group and on

9
September 30th
, 2010 for the Shapedown group, eight weeks after the program began. Seven
families (21 parents and children) in the Shapedown group and eight families (23 parents and
children) from the control group were post-tested. Attempts to follow up with families that did
not show up for the post-test evaluations are underway. At the end of the post-test evaluations,
food was shared, and varieties of “goodies” were given to the participants, as well as framed
certificates of completion. CMLF presented framed pictures of activities to the MSU team.
Participants in the control group also received “goodies” at the end of their post-test evaluation.
Follow-up Session
Follow-up evaluations for families in the Shapedown and control groups occurred in the
second-half of May 2011 (May 18-19, 2011 for the first session group and May 25-26, for the
second session group). As data in Table 1, illustrates, there were fewer families in the control
groups that were assessed at follow-up compared to those in the Shapedown groups. The
attrition rate in the Shapedown group was 27% from pre-test to post-test assessments and 4%
post-test to follow-up assessments. In the control group, the attrition rate was 48% from pre-test
to post-test assessments and 58% post-test to follow-up assessments.
Table 1. Total number of children under study by session, treatment group, and time of
observation
GROUP \ TREATMENT
Time of observation
Pre-
Test
Post-Test Follow-up
Group 1 Treatment Shapedown 17 13 12
Control group 9 7 2
Total 26 20 14
Group 2 Treatment Shapedown 16 11 11
Control group 24 10 5
Total 40 21 18
Total Treatment Shapedown 33 24 23
Control group 33 17 7
Total 66 41 30
Data Analysis
Descriptive Statistics
Descriptive analysis will first be performed on variables collected at baseline (mean,
standard deviation, median, minimum, and maximum, frequency distributions for categorical
variables, and plots that illustrate change in outcomes over time). Comparison of the
categorical variables between groups of cases will be compared by means of χ2 test and
Fisher’s exact test in cases of expected frequencies less than 5.

10
Comparison of treatment and control groups will be assessed using two-sample
Student’s t tests for continuous variables and χ2 test for categorical variables at baseline, after
the intervention (post-test), and at follow-up. Paired t-tests of the treatment and control
groups’ mean scores will be performed at baseline, after the intervention, and at follow-up to
test the differences in mean scores between the two-time periods.
Multivariate analysis
We used repeated measures analysis of variance (ANOVA) to compare the mean
scores of selected outcomes in the Shapedown treatment and the control groups at baseline,
after the intervention, and at follow-up time. The main dependent variables include child’s
BMI, dietary patterns, physical activity, eating habits (e.g., breakfast skipping, second/third
servings, and secretive eating and snacking), self-esteem, depression, weight management
knowledge, and dropout rate. Further analyses will be performed using the analysis of
covariance (ANCOVA) model in order to determine the differences in mean scores of selected
outcomes between the Shapedown and control groups, but also across time, while controlling
for other child, family, and neighborhood characteristics.
Qualitative Interviews
In-depth qualitative interviews and participant observation occurred from January to
August 2010 in order to find out how the program adapted to meet the needs of the Latino
community. Each member (four) of the Shapedown staff members was interviewed using open-
ended questions. Questions included: 1) Tell me about a typical session and what you were in
charge of doing; 2) How would you say you had to adapt the program for the Latinos?; 3) Tell
me a about a time when the Shapedown program could not address the needs of the participants;
4) Tell me about a time when you had a successful session; and, 5) what made it successful?
Interviews were transcribed, entered into a maxQDA (a qualitative software program), and coded
for themes. In addition, participant observations were conducted for each of the staff meetings
(three) and at the initial and final meetings of the Shapedown program. Notes were taken during
the meeting and reviewed for themes.
In-depth qualitative interviews were conducted two more times with two staff members,
once at the end of the Shapedown intervention (individual interviews), and then one more time
three months after the intervention ended (one joint interview). Questions asked included: 1. In
your view, what were the benefits of the Shapedown project for your community members? 2.
What are some of the challenges or difficulties you encountered during the Shapedown project?
3. What were the main reasons that you couldn’t find some of the families for follow-up
evaluation? 4. If you could repeat the Shapedown project all over again, what are some of the
things you would change? 5. Overall, what was the main impact of the Shapedown program on
your community?

11
Results
Quantitative Results
Child’s Health
Overweight and Obesity
Children who are overweight are more likely to have poor self-esteem and to be
overweight or obese as adult, which poses greater risks for their future health conditions.
According to the Centers for Disease Control and Prevention, obese children are at higher risk
for high blood pressure and cholesterol, which are risk factors for cardiovascular disease;
increased risk of Type 2 Diabetes; breathing problems such as asthma and sleep apnea; joint
problems and muscular discomfort; fatty liver disease, gallstones, and gastro-esophageal reflux
(Centers for Disease Control and Prevention, 2011).
Following the definitions of overweight and obesity established by the Centers for
Disease Control and Prevention, we characterize children with a Body Mass Index (BMI)
between the 85th
and 94th
percentile for their age and sex as overweight, and those with a BMI
greater or equal to the 95th
percentile for age and sex, as obese. Weight and height measures
were collected from all children ages 6-18 years during the pre-test, post-test, and follow-up
sessions. Body Mass Index (hereafter BMI) of each individual was computed by dividing weight
(kilograms) by height (meters). Age- and gender-specific growth charts from the Centers for
Disease Control and Prevention were used to classify children (under 20 years of age) into 4
categories of weight status (Kuczmarski et. al., 2000): a) “Obese,” defined as a BMI at or above
the 95th percentile for children of the same age and sex; b) “Overweight,” defined as a BMI at or
above the 85th
percentile and below the 95th
percentile for children of the same age and sex; c)
“Normal weight,” defined as a BMI at or above the 5th
percentile but less than the 85th
percentile;
and d) “Underweight,” defined as a BMI less than the 5th
percentile. Figure 1 displays the
weight status of children at pre-test. About 3 percent of children were obese, 14 percent
overweight, 79 percent normal weight, and 5 percent underweight, respectively (Figure 1).
Figure 1. Weight Status of Children at Pre-Test
4.6%
78.5%
13.8%
3.1%
0
10
20
30
40
50
60
70
80
90
Underweight Normal weight Overweight Obese
Pe
rce
nt
12
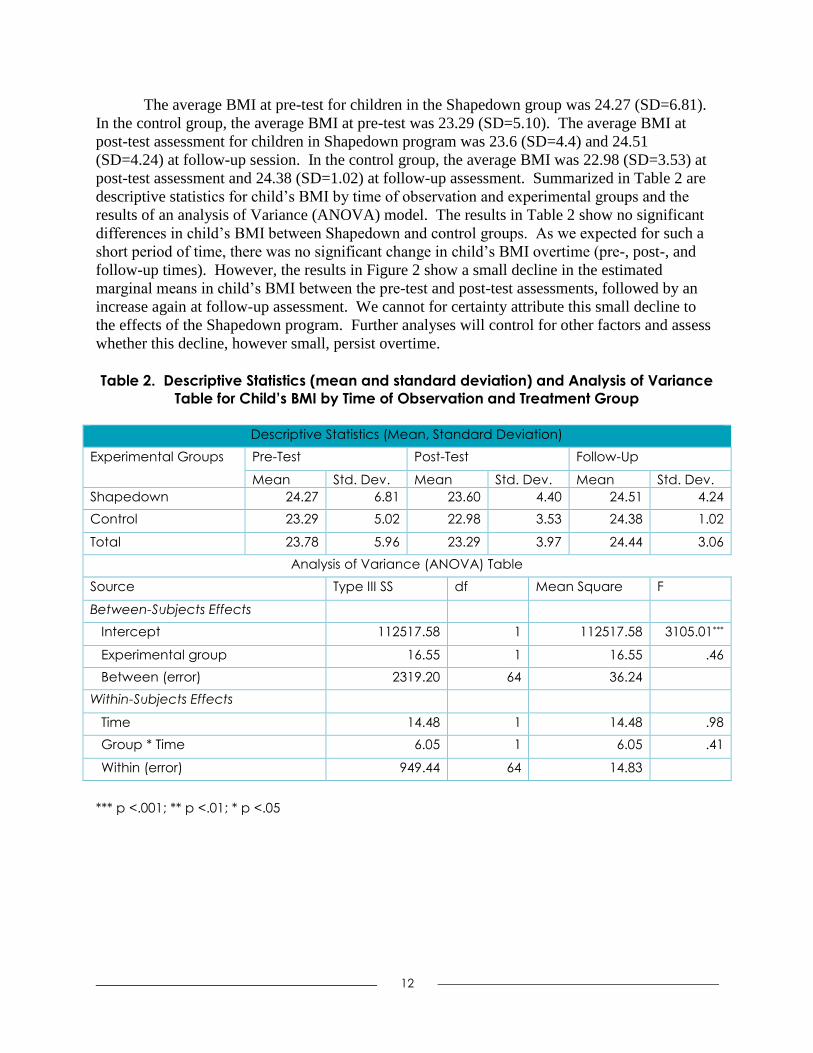
The average BMI at pre-test for children in the Shapedown group was 24.27 (SD=6.81).
In the control group, the average BMI at pre-test was 23.29 (SD=5.10). The average BMI at
post-test assessment for children in Shapedown program was 23.6 (SD=4.4) and 24.51
(SD=4.24) at follow-up session. In the control group, the average BMI was 22.98 (SD=3.53) at
post-test assessment and 24.38 (SD=1.02) at follow-up assessment. Summarized in Table 2 are
descriptive statistics for child’s BMI by time of observation and experimental groups and the
results of an analysis of Variance (ANOVA) model. The results in Table 2 show no significant
differences in child’s BMI between Shapedown and control groups. As we expected for such a
short period of time, there was no significant change in child’s BMI overtime (pre-, post-, and
follow-up times). However, the results in Figure 2 show a small decline in the estimated
marginal means in child’s BMI between the pre-test and post-test assessments, followed by an
increase again at follow-up assessment. We cannot for certainty attribute this small decline to
the effects of the Shapedown program. Further analyses will control for other factors and assess
whether this decline, however small, persist overtime.
Table 2. Descriptive Statistics (mean and standard deviation) and Analysis of Variance
Table for Child’s BMI by Time of Observation and Treatment Group
Descriptive Statistics (Mean, Standard Deviation)
Experimental Groups Pre-Test Post-Test Follow-Up
Mean Std. Dev. Mean Std. Dev. Mean Std. Dev.
Shapedown 24.27 6.81 23.60 4.40 24.51 4.24
Control 23.29 5.02 22.98 3.53 24.38 1.02
Total 23.78 5.96 23.29 3.97 24.44 3.06
Analysis of Variance (ANOVA) Table
Source Type III SS df Mean Square F
Between-Subjects Effects
Intercept 112517.58 1 112517.58 3105.01***
Experimental group 16.55 1 16.55 .46
Between (error) 2319.20 64 36.24
Within-Subjects Effects
Time 14.48 1 14.48 .98
Group * Time 6.05 1 6.05 .41
Within (error) 949.44 64 14.83
*** p <.001; ** p <.01; * p <.05

13
Figure 2. Children’s Body Mass Index (BMI) by Treatment Group and Time of
Observation
Description of Child’s Weight Figure 3 displays the distribution of children’s perception about their weight status.
About one-third of children equally perceive themselves as overweight, normal weight, or
underweight. This perception of their weight differs significantly from their real weight
described above.
Figure 3. Perceived Child’s Weight Status
General Physical Health
Research shows that self-rated health on a five-point scale from “poor” to “excellent,” is
a reliable predictor of objective measures of health status and mortality (Idler and Benyamini
1997) with reports of poor and fair health strongly predictive of all-cause mortality (Idler et al.
2004). Figure 4 displays parents’ reports of their children’s health. The results in Figure 4 show
22.000
22.500
23.000
23.500
24.000
24.500
25.000
Pre-Test Post-test Follow-up
East
imat
ed
Mar
gin
al M
ean
s (C
hild
's B
MI)
Shapedown Control
33.0%
34.0%
33.0%
Underweight Normal weight Overweight
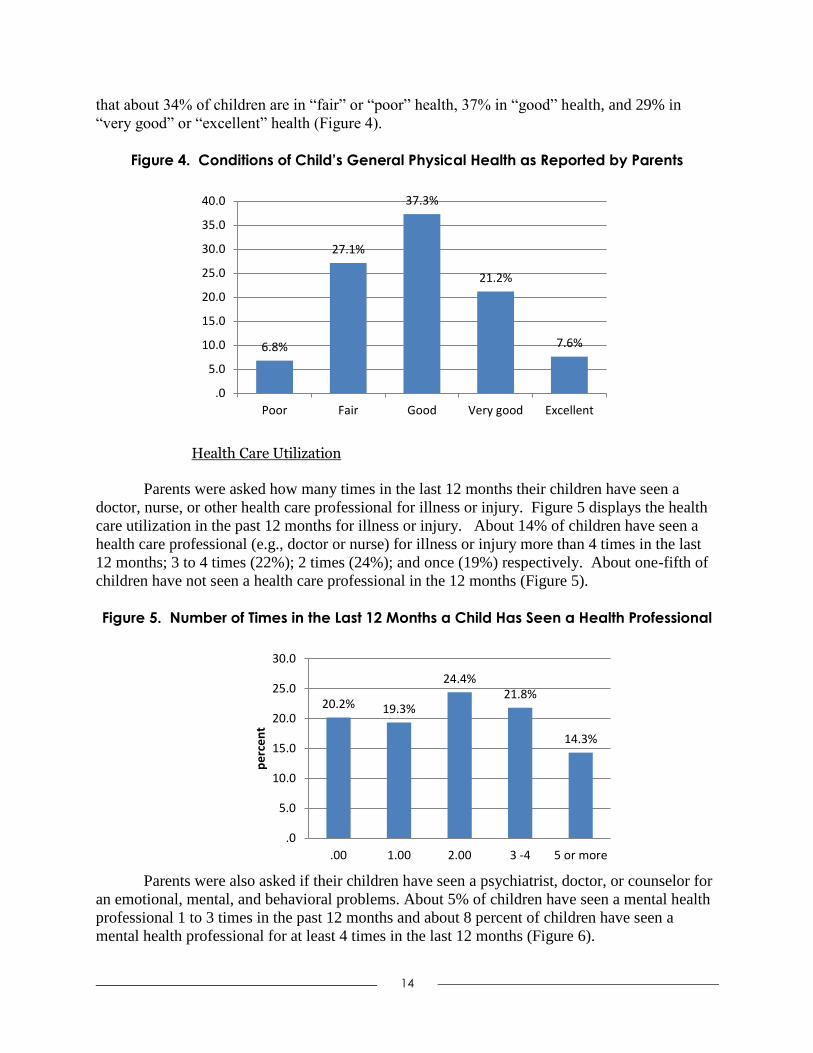
14
that about 34% of children are in “fair” or “poor” health, 37% in “good” health, and 29% in
“very good” or “excellent” health (Figure 4).
Figure 4. Conditions of Child’s General Physical Health as Reported by Parents
Health Care Utilization
Parents were asked how many times in the last 12 months their children have seen a
doctor, nurse, or other health care professional for illness or injury. Figure 5 displays the health
care utilization in the past 12 months for illness or injury. About 14% of children have seen a
health care professional (e.g., doctor or nurse) for illness or injury more than 4 times in the last
12 months; 3 to 4 times (22%); 2 times (24%); and once (19%) respectively. About one-fifth of
children have not seen a health care professional in the 12 months (Figure 5).
Figure 5. Number of Times in the Last 12 Months a Child Has Seen a Health Professional
Parents were also asked if their children have seen a psychiatrist, doctor, or counselor for
an emotional, mental, and behavioral problems. About 5% of children have seen a mental health
professional 1 to 3 times in the past 12 months and about 8 percent of children have seen a
mental health professional for at least 4 times in the last 12 months (Figure 6).
6.8%
27.1%
37.3%
21.2%
7.6%
Poor Fair Good Very good Excellent
.0
5.0
10.0
15.0
20.0
25.0
30.0
35.0
40.0
20.2% 19.3%
24.4% 21.8%
14.3%
.0
5.0
10.0
15.0
20.0
25.0
30.0
.00 1.00 2.00 3 -4 5 or more
pe
rce
nt

15
Figure 6. Number of Times in the Last 12 Months a Child Has Seen a Psychiatrist,
Doctor, or Counselor for an Emotional, Mental, or Behavioral Problem
Psychological Well-Being
Children were asked a series of questions that measure their psychological well-being.
We created a child’s psychological well-being index by summing responses to the following 8
items: I often have trouble getting my breath; I get mad easily; I feel that others do not like the
ways I do things; my feelings get hurt easily; other people are happier than me; I am nervous; a
lot of people are against me; I often worry about something bad happening to me (α = .81).
Before creating the index, responses were reverse coded (1=often true, 2=sometimes true, 3=not
true) so that higher values indicate high levels of better psychological well-being. Figure 7
displays child’s psychological well-being in quintile range. Almost 13% of children were in the
bottom quintile, compared to 29% in the top quintile. About 58% of children were in the middle
three-fifths of the psychological well-being scale.
Figure 7. Child’s Psychological Well-Being in Quintile Range
Table 3 displays demographic statistics and ANOVA table for the child’s psychological
well-being scale by time of observation and experimental groups. The average child’s
86.8%
4.7% 5.7% 2.8%
.00 1-3 4-11 12 or more
.0
10.0
20.0
30.0
40.0
50.0
60.0
70.0
80.0
90.0
100.0
13.4%
24.1% 21.4%
12.5%
28.6%
.0
5.0
10.0
15.0
20.0
25.0
30.0
35.0
Lowest fifth 2.00 3.00 4.00 Highest fifth
Pe
rce
nt

16
psychological well-being score at pre-test assessment for children in the Shapedown program
was 11.6 (SD=3.6), compare to 12.3 (SD=3.6) for children in the control group. Following the
Shapedown treatment at post-test assessment, the average child’s psychological well-being score
was 11.8 (SD=3.8) in the Shapedown group, compare to 12.4 (SD=2.7) in the control group. At
follow-up assessment, the average child’s psychological well-being score was reduced to 10.3
(SD=2.1) in the Shapedown program, compared to 10.7 (SD=1.4) in the control group. The
results in Table 3 show no significant differences in child’s psychological well-being score
between Shapedown and control groups. However, there was significant change in child’s
psychological well-being score overtime (pre-, post-, and follow-up times) (F=10.8; df=1; p <
.01). Figure 8 shows a small increase in the estimated marginal means in child’s psychological
well-being score between the pre-test and post-test assessments, followed by a decrease at
follow-up assessment.
Table 3. Descriptive Statistics (mean and standard deviation) and Analysis of Variance
Table for Child’s Psychological Well-being by Time of Observation and Treatment Group
Descriptive Statistics (Mean, Standard Deviation)
Experimental Groups Pre-Test Post-Test Follow-Up
Mean Std. Dev. Mean Std. Dev. Mean Std. Dev.
Shapedown 11.57 3.56 11.78 3.79 10.34 2.08
Control 12.29 3.58 12.40 2.71 10.71 1.36
Total 11.93 3.56 12.09 3.28 10.52 1.75
Analysis of Variance (ANOVA) Table
Source Type III SS df Mean Square F
Between-Subjects Effects
Intercept 26256.18 1 26256.18 2264.60***
Experimental group 16.16 1 16.16 1.39
Between (error) 742.03 64 11.59
Within-Subjects Effects
Time --- Linear 65.41 1 65.41 10.81**
--- Quadratic 33.03 1 33.03 3.66
Group * Time -- Linear 1.03 1 1.03 .17
--- Quadratic .06 1 .06 .01
Within (error) -- Linear 387.28 64 6.05
--- Quadratic 577.44 64 9.02
*** p <.001; ** p <.01; * p <.05

17
Figure 8. Children’s Psychological Well-being by Treatment Group and Time of
Observation
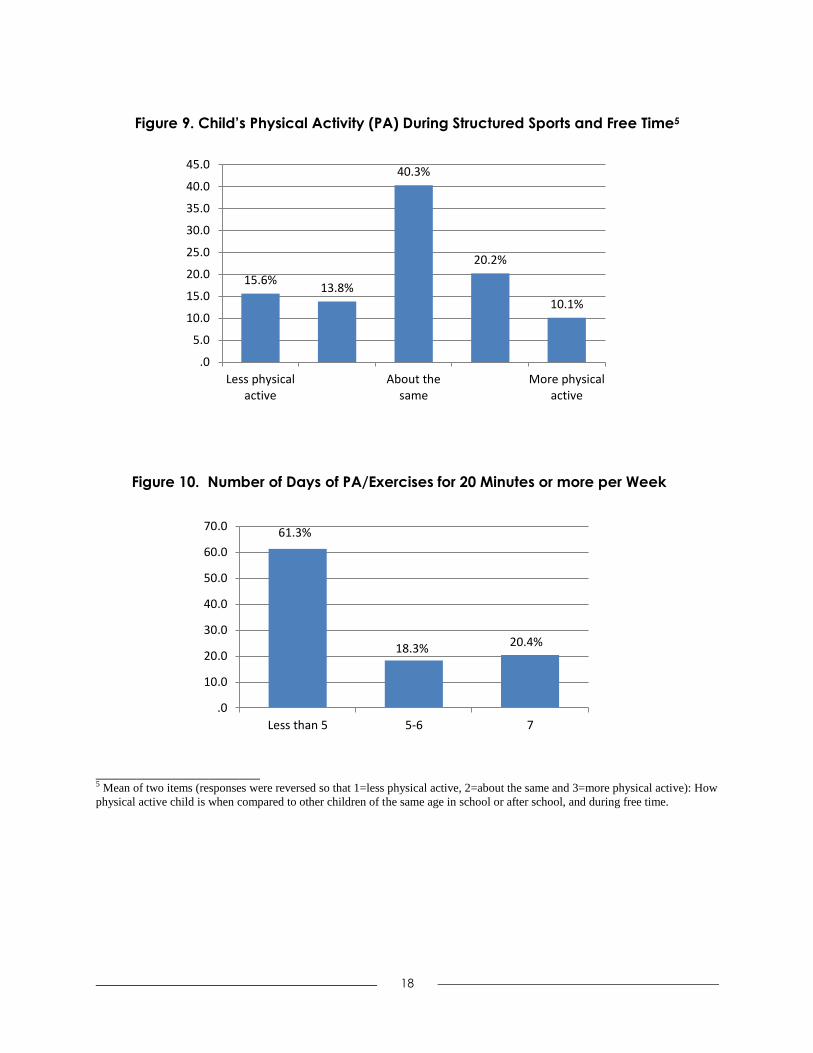
Physical Activity/Inactivity
One the ways to reduce childhood obesity is to increase physical activity and reduce
physical inactivity, especially screen time. Figure 8 displays how children compare themselves
with other children of similar age in terms of involvement in physical activity. About 10% of
children indicated that they were more physically active than children of similar age; about 16%
less active; and 40% about the same level of physical activity than their peers of the same age.
Figure 9 displays the number of days a child is involved in physical activity/exercise in a typical
week. About 39% of children indicated that they were involved in vigorous physical
activity/exercise of 20 continuous minutes or more per week (Figure 9).
Children were also asked about how often they use game systems (e.g., Game Boy, Game
Cube, Play Stations etc.) or computer games. Responses ranged from 1=never to 4=always.
Figure 10 displays the frequency of physical inactivity as reflected in the frequency of use of
game systems and computer games. The results in Figure 10 show that about 19% of children
were highly involved in game systems or computer games (i.e., above the mean plus one
standard deviation); about 29 percent of children were in medium category of use; and 52% of
children were less involved in game systems or computer games.
9.0
9.5
10.0
10.5
11.0
11.5
12.0
12.5
13.0
Pre-Test Post-test Follow-upEast
imat
ed
Mar
gin
al M
ean
s (C
hild
's
self
-est
ee
m)
Shapedown Control
18
Figure 9. Child’s Physical Activity (PA) During Structured Sports and Free Time5
Figure 10. Number of Days of PA/Exercises for 20 Minutes or more per Week
________________ 5 Mean of two items (responses were reversed so that 1=less physical active, 2=about the same and 3=more physical active): How
physical active child is when compared to other children of the same age in school or after school, and during free time.
15.6% 13.8%
40.3%
20.2%
10.1%
Less physicalactive
About thesame
More physicalactive
.0
5.0
10.0
15.0
20.0
25.0
30.0
35.0
40.0
45.0
61.3%
18.3% 20.4%
Less than 5 5-6 7
.0
10.0
20.0
30.0
40.0
50.0
60.0
70.0

19
Figure 11. Child’s Physical Inactivity -- How Often they Use Game Systems or Computer
Games6
We also asked parents how they compare themselves with other parents of their age in
terms of involvement in physical activity. The results in Figure 12 show that about one-fourths
of parents indicated that they were more physically active than other parents of similar age;
about 18 percent less active; and 57% about the same level of physical activity. Parents were in
addition asked if they exercise for minimum of 30 minutes for at least 5 times a week (i.e.,
vigorous physical activity). The results in Figure 13 show that about 40% of parents exercise for
a minimum of 30 minutes for at least 5 times a week (Figure 13).
Figure 12. Parent Physical Activity/Exercise
__________________ 6 Low= < Mean – 1SD; Medium=Mean – 1SD to Mean + 1SD; High=> Mean + 1SD.
Low 52.5%
Medium 28.8%
High 18.8%
Low Medium High
0.0
10.0
20.0
30.0
40.0
50.0
60.0
18.0%
57.4%
24.6%
.0
10.0
20.0
30.0
40.0
50.0
60.0
70.0
Less active About the same More active

20
Figure 13. Parent Vigorous Physical Activity
Diet and Nutrition
Nutrition Control/Regulation
Healthy nutrition is a critically important behavioral determinant of good health and
obesity among children and adolescents. Parents play a crucial role in shaping the type and
quantity of food children eat at home as well as their eating habits. In this section, we explore
the extent to which parents control or regulate, or influence the eating habits of children and
adolescents. Figure 14 displays the frequency distribution of parents who believe that a child
should eat all the food on his/her plate. About 5% of parents strongly agree with the statement
that a child should eat all food on his/her plate, 15% moderately agree, 15% strongly disagree,
33% moderately disagree, and 32% are neutral (Figure 14).
Figure 14. Parents’ Belief about the Amount of Food Child Should Eat
39.8%
60.2%
Yes No
14.5%
33.1% 31.5%
16.1%
4.8%
.0
5.0
10.0
15.0
20.0
25.0
30.0
35.0
Stronglydisagree
Moderatelydisagree
Neitheragree nordisagree
Moderatelyagree
Stronglyagree
Pe
rce
nt
21
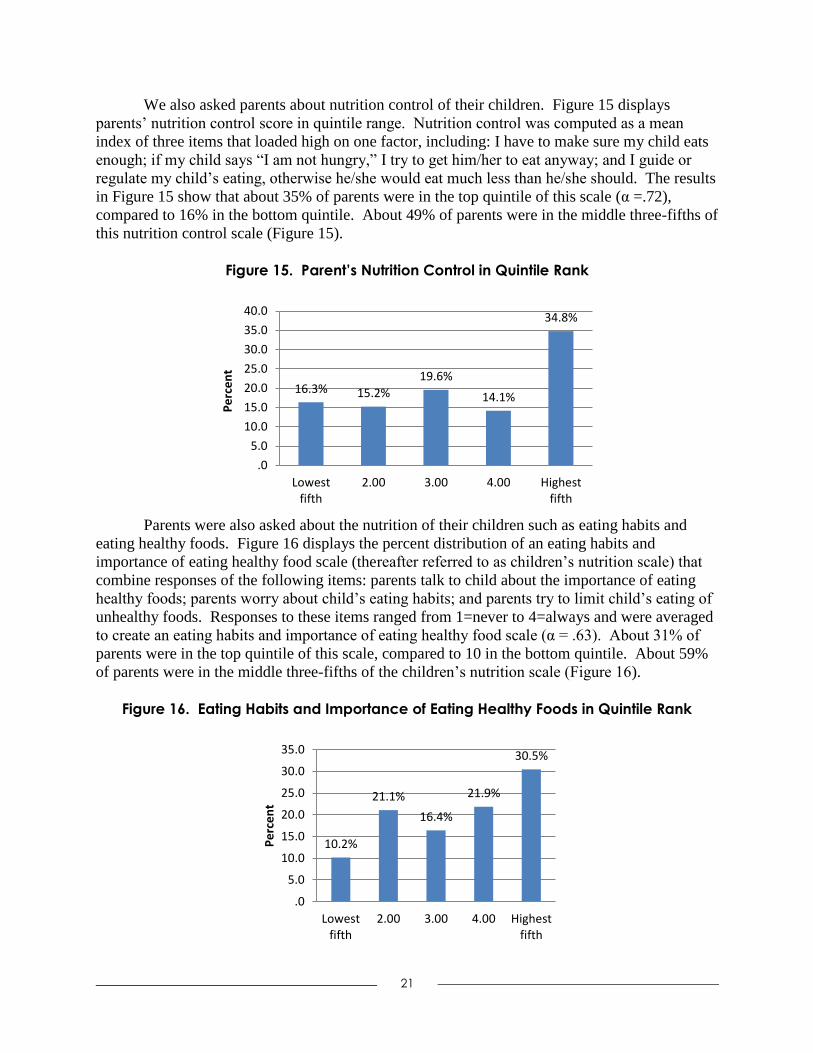
We also asked parents about nutrition control of their children. Figure 15 displays
parents’ nutrition control score in quintile range. Nutrition control was computed as a mean
index of three items that loaded high on one factor, including: I have to make sure my child eats
enough; if my child says “I am not hungry,” I try to get him/her to eat anyway; and I guide or
regulate my child’s eating, otherwise he/she would eat much less than he/she should. The results
in Figure 15 show that about 35% of parents were in the top quintile of this scale (α =.72),
compared to 16% in the bottom quintile. About 49% of parents were in the middle three-fifths of
this nutrition control scale (Figure 15).
Figure 15. Parent’s Nutrition Control in Quintile Rank
Parents were also asked about the nutrition of their children such as eating habits and
eating healthy foods. Figure 16 displays the percent distribution of an eating habits and
importance of eating healthy food scale (thereafter referred to as children’s nutrition scale) that
combine responses of the following items: parents talk to child about the importance of eating
healthy foods; parents worry about child’s eating habits; and parents try to limit child’s eating of
unhealthy foods. Responses to these items ranged from 1=never to 4=always and were averaged
to create an eating habits and importance of eating healthy food scale (α = .63). About 31% of
parents were in the top quintile of this scale, compared to 10 in the bottom quintile. About 59%
of parents were in the middle three-fifths of the children’s nutrition scale (Figure 16).
Figure 16. Eating Habits and Importance of Eating Healthy Foods in Quintile Rank
16.3% 15.2%
19.6%
14.1%
34.8%
.0
5.0
10.0
15.0
20.0
25.0
30.0
35.0
40.0
Lowestfifth
2.00 3.00 4.00 Highestfifth
Pe
rce
nt
10.2%
21.1%
16.4%
21.9%
30.5%
.0
5.0
10.0
15.0
20.0
25.0
30.0
35.0
Lowestfifth
2.00 3.00 4.00 Highestfifth
Pe
rce
nt

22
Table 4 displays demographic statistics and ANOVA table for child’s nutrition scale by
time of observation and experimental groups. The average child’s nutrition score at pre-test
assessment for children in the Shapedown program was 3.45 (SD=0.40) compared to 3.30
(SD=0.49) for children in the control group. Following the Shapedown treatment at post-test
assessment, the average child’s nutrition score was 3.32 (SD=0.50) in the Shapedown group,
compared to 3.30 (SD=0.43) in the control group. At follow-up assessment, the average child’s
nutrition score was increased to 3.56 (SD=0.39) in the Shapedown program, compared to 3.53
(SD=0.24) in the control group. The results in Table 3 show no significant differences in child’s
nutrition score between Shapedown and control groups. However, there was a significant
change in child’s nutrition score overtime (pre-, post-, and follow-up times) (F=5.99; df=1; p <
.05).
Figure 17 displays the estimated marginal means of the child’s nutrition scale by
treatment group and time of observation. The results in Figure 17 show a small decrease in the
estimated marginal means in child’s nutrition score between the pre-test and post-test
assessments in the Shapedown group, followed by an increase at follow-up assessment. In the
control group, there was no change in the marginal means of child’s nutrition score between the
pre- and post-test assessment, and an increase in the score between the post- and follow-up
assessments.
Table 4. Descriptive Statistics (mean and standard deviation) and Analysis of Variance
Table for Eating Habits and Importance of Eating Healthy Foods by Time of Observation
and Treatment Group
Descriptive Statistics (Mean, Standard Deviation)
Experimental Groups Pre-Test Post-Test Follow-Up
Mean Std. Dev. Mean Std. Dev. Mean Std. Dev.
Shapedown 3.45 .40 3.32 .50 3.56 .39
Control 3.30 .49 3.30 .43 3.53 .24
Total 3.37 .45 3.31 .46 3.54 .32
Analysis of Variance (ANOVA) Table
Source Type III SS df Mean Square F
Between-Subjects Effects
Intercept 2303.62 1 2303.62 13414.30***
Experimental group .25 1 .25 1.47
Between (error) 10.99 64 .17
Within-Subjects Effects
Time --- Linear .95 1 .95 5.99*
--- Quadratic .94 1 .94 4.88*
Group * Time -- Linear .12 1 .12 .74
--- Quadratic .06 1 .06 .33
Within (error) -- Linear 10.16 64 .16
--- Quadratic 12.39 64 .19
*** p <.001; ** p <.01; * p <.05

23
Figure 17. Eating Habits and Importance of Eating Healthy Foods by Treatment Group
and Time of Observation
Family Cohesion
Parent-Child Communication
Children were also asked how they communicate with other family members or friends.
Two measures were created: one indicating non-family communication/isolation (i.e., a child
kept his or her feelings to himself or herself or told a friend how he or she felt) and family
communication (i.e., a child talked to a family member about something that bothered him/her or
felt that his/her family really cared about his/her feelings). Figure 18 displays the frequency
distribution for the non-family/isolation communication. About 28% of children were in the top
quintile, compared to 17% in the bottom quintile. About 55% of parents were in the middle
three-fifths of the scale (Figure 18).
Figure 18. Non-Family Attachment and Communication in Quintile Rank
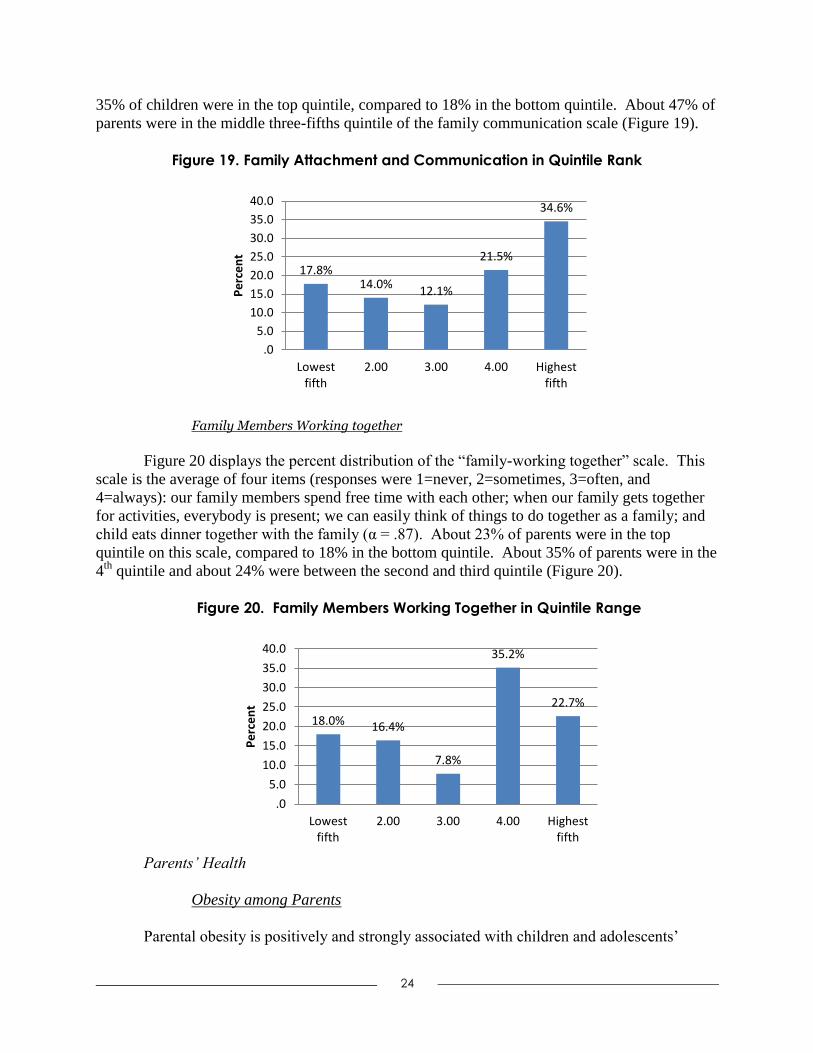
Figure 19 displays the percent distribution of the family communication measure. About
3.2
3.2
3.3
3.3
3.4
3.4
3.5
3.5
3.6
3.6
Pre-Test Post-test Follow-up
East
imat
ed
Mar
gin
al M
ean
s (E
atin
g H
abit
s\H
eal
thy
Foo
ds)
Shapedown Control
17.3%
10.9%
30.0%
13.6%
28.2%
.0
5.0
10.0
15.0
20.0
25.0
30.0
35.0
Lowestfifth
2.00 3.00 4.00 Highestfifth
Pe
rce
nt
24
35% of children were in the top quintile, compared to 18% in the bottom quintile. About 47% of
parents were in the middle three-fifths quintile of the family communication scale (Figure 19).
Figure 19. Family Attachment and Communication in Quintile Rank
Family Members Working together
Figure 20 displays the percent distribution of the “family-working together” scale. This
scale is the average of four items (responses were 1=never, 2=sometimes, 3=often, and
4=always): our family members spend free time with each other; when our family gets together
for activities, everybody is present; we can easily think of things to do together as a family; and
child eats dinner together with the family (α = .87). About 23% of parents were in the top
quintile on this scale, compared to 18% in the bottom quintile. About 35% of parents were in the
4th
quintile and about 24% were between the second and third quintile (Figure 20).
Figure 20. Family Members Working Together in Quintile Range
Parents’ Health
Obesity among Parents
Parental obesity is positively and strongly associated with children and adolescents’
17.8% 14.0%
12.1%
21.5%
34.6%
.0
5.0
10.0
15.0
20.0
25.0
30.0
35.0
40.0
Lowestfifth
2.00 3.00 4.00 Highestfifth
Pe
rce
nt
18.0% 16.4%
7.8%
35.2%
22.7%
.0
5.0
10.0
15.0
20.0
25.0
30.0
35.0
40.0
Lowestfifth
2.00 3.00 4.00 Highestfifth
Pe
rce
nt

25
obesity. In addition to children’s weights and heights, we measured parents’ weights and heights
and computed their BMI. Half of the parents in our study were considered obese (i.e., with a
BMI equal or above 30), and about 29% of parents were overweight (i.e., with a BMI between
25.0 and 29.9) (Figure 21).
Figure 21. Prevalence of Obesity among Parents7
____________ 7 Obesity for adults is defined as a BMI greater or equal to 30; overweight as BMI between 25.0 and 29.9; healthy weight as BMI
between 18.5 and 24.9; and underweight as BMI below 18.5.
Description of Parent’s Weight
Parents were also asked to describe their weight. Responses to this question ranged from
1=slightly thin to 4=very overweight. The results in Figure 22 show that about 26% of parents
indicated that they are very overweight and 47% indicated that they slightly overweight, while
22% indicated that they are about average weight, and 4% slightly thin weight. As this show, the
self-assessment of weight is different from the actual weight status described above in Figure 21.
Figure 22. Perceived Parents’ Weight Status
1.6%
19.7% 29.1%
49.6%
.0
10.0
20.0
30.0
40.0
50.0
60.0
Pe
rce
nt
4.1%
22.1%
47.5%
26.2%
.0
5.0
10.0
15.0
20.0
25.0
30.0
35.0
40.0
45.0
50.0
Slightly thin Aboutaverage
Slightlyoverweight
Veryoverweight
Pe
rce
nt

26
General Physical Health
We also asked parents to assess and self-report their own health. Figure 23 shows that
about 15% of parents indicated they are in very good or excellent health, compared to 43% who
indicated that they were in fair or poor health and about 42% who reported good health (Figure
23).
Figure 23. Prevalence of Parents Self-Rated Health
Parents’ Self-Esteem
Parents were also asked questions about their self-esteem using the Rosenberg’s Self-
Esteem Scale (10 items). The items were summed after reverse coding items 3, 5, 8, 9, and 10 (α
= .76). The results in Figure 24 show that about 26% were in the top quintile of the parents’ self-
esteem scale, compared to 14% in the bottom quintile. About 60% were in the middle three-
fifths quintile of the parents’ self-esteem scale (Figure 24).
Figure 24. Parents Self-Esteem in Quintile Range
4.0%
38.7% 41.9%
12.9%
2.4%
.0
5.0
10.0
15.0
20.0
25.0
30.0
35.0
40.0
45.0
Poor Fair Good Very good Excellent
Pe
rce
nt
14.1%
21.9% 21.1%
17.2%
25.8%
.0
5.0
10.0
15.0
20.0
25.0
30.0
Lowest fith 2.00 3.00 4.00 Highest fifth
Pe
rce
nt

27
Neighborhood Environment
Numerous studies have linked characteristics of neighborhood physical environments to
health, physical activity and BMI (Mujahid et al. 2008; Burdette and Hill 2008). We asked
parents questions related to their neighborhoods, specifically on physical conditions for physical
activity/exercise, food availability, and quality, and neighborhood safety environments (Figure
25-27).
Conducive Physical Activity Neighborhoods
Figure 25 displays the percent distribution of a neighborhood physical activity measure,
which captures whether parents’ neighborhoods are conducive to physical activity. We
computed the mean of two items (response items ranging from 1=strongly disagree to 5=strongly
agree): in my neighborhood it is easy to walk places; and I often see people walking, exercising
(e.g., jogging, bicycling, playing sports) in my neighborhood (α = .84). About 21% of
neighborhoods were ranked in top quintile as conducive to physical activity/exercise, compared
to 15% in the bottom quintile. About 64% of neighborhoods were in the middle-fifths of this
neighborhood scale (Figure 25).
Figure 25. Conducive Physical Activity Neighborhoods in Quintile Range
Neighborhood Healthy Foods Availability
The availability of healthy foods in a neighborhood such as access to supermarkets has
been linked to healthier food intakes (Morland et al., 2002). Figure 26 shows the distribution of
a measure that captures neighborhood healthy foods availability. This scale was obtained from
computing the mean of three items (responses range from 1=strongly disagree to 5=strongly
agree): a large selection of fresh fruits and vegetables is available in my neighborhood stores; the
fresh fruit and vegetables in my neighborhood stores are of high quality; and a large selection of
low-fat food are available in my neighborhood stores (α = .94). The results in Figure 26 show
that about 31% of neighborhoods were ranked in top quintile in terms of healthy food
availability, compared to 14% in the bottom quintile. About 55% of neighborhoods were in the
middle-fifths of this neighborhood healthy food availability scale (Figure 26).
15.3%
22.6%
41.1%
21.0%
.0
5.0
10.0
15.0
20.0
25.0
30.0
35.0
40.0
45.0
Lowest fifth 2.00 3.00 Highest fifth
Pe
rce
nt

28
Figure 26. Neighborhood Healthy Foods Availability in Quintile Range
Neighborhood Safety
Parents' perceptions of neighborhood safety are significantly associated with children's
BMI and parents are more likely to restrict their children's outdoor activities and increase the
likelihood of sedentary indoor activity if they perceive their neighborhood to be unsafe (Cecil-
Karb and Grogan-Kaylor, 2009). Figure 27 displays the percent distribution of an index of
neighborhood safety. The neighborhood safety scale was computed as the average of three items
(responses ranged from 1=very safe to 5=very unsafe): it is safe to walk alone in your
neighborhood in the day; it is safe to walk alone at night in your neighborhood; it is safe for
children to play outside during the day in your neighborhood (α = .86). In this instance, higher
values on the scale indicate neighborhoods that are considered very unsafe. The results in Figure
27 show that 14% of neighborhoods were in the top quintile, i.e., very unsafe, compared to 21%
that are in the lower quintile or very safe. About 32% of neighborhoods were in the 4th
quintile
while about 33% were between the second and third quintile (Figure 27).
Figure 27. Perceived Neighborhood Safety in Quintile Range
14.5%
10.3%
29.9%
14.5%
30.8%
.0
5.0
10.0
15.0
20.0
25.0
30.0
35.0
Lowest fifth 2.00 3.00 4.00 Highest fifth
Pe
rce
nt
21.4% 22.2%
11.1%
31.6%
13.7%
.0
5.0
10.0
15.0
20.0
25.0
30.0
35.0
Lowestfifth
2.00 3.00 4.00 Highestfifth
Pe
rce
nt

29
Qualitative Results
Findings from qualitative interviews are summarized in the following three major
categories (1) flexibility, (2) establishing trust, and (3) cultural competence (beyond just
speaking Spanish).
Flexibility
A major theme that quickly became apparent in the intervention was the need to have
detailed lesson plans prepared in advance and tailored to the Latino population. Since the lesson
plans from Shapedown were not created with the Latino population in mind, a review of the
translated materials revealed that they had been translated directly, meaning that further
adaptations had to be made by the staff so that they could be more culturally relevant and useable
with the program participants in Pontiac. Further, staff members had to be prepared to be
flexible as the sessions unfolded because of challenges facing low-income Latino families. As
one staff put it, “we had to do lesson plans every week, but these folks…they go beyond the
lesson plans” (Exercise Physiologist). One reason staff needed to be flexible were the barriers
that faced many of the participants, namely transportation, child care, and educational level-
discrepancies.
Transportation was often difficult for some families to secure, and as such many would
arrive late or not attend if the weather was bad. Child care issues became a continuing problem
as Shapedown is designed for children 6 years of age and older, and many families had children
younger than this age. In order to meet this need, CMLF had to hire from their own funds (not
using grant monies) a child care provider, who could watch, play with, and entertain the younger
children so that the parents and older siblings could participate in the program. Finally, the
educational level of most of the participants was not much beyond 6th
grade proficiency. The
Shapedown program requires weekly take home assignments to be filled out and returned. The
staff had to switch the focus to meet this need and instead transferred their activities to “orally
based communications.”
Establishing Trust
As with all community programs, gaining and maintaining community trust was vital to
the Shapedown intervention. First and foremost, the focus on the family helped the community
gain confidence in the program and the staff. CMLF chose a church based in the community and
not far from CMLF’s offices in order for the families to feel safe. As one staff member put it,
“[it’s the] trust factor, the importance of making sure that they understand but more importantly
that they know they feel safe. And that’s one of the reasons too that we go to the churches,
because families do feel very safe there” (CMLF Recruiter). The space was very important.
Families had to be connected to each other even if they were in different rooms, so having a
building that could accommodate instructional sessions (a large room) with physical activities
(the gym) proved invaluable.
In addition, as one CMLF staff put it, this community is not used to being part of a
research program and the rigors of working with University protocols. Pre- and post-test
instruments had to be adjusted, language simplified, and culture respected in order for the
sessions to continue to completion. In addition, at the start of the program there was a great deal
of discussion between the JSRI and the CMLF teams as to the purpose of the program, how it
could impact the community, its importance, and the acceptable exercises/interventions that

30
could be done within the constraints of the grant. These issues made it difficult at times to
implement the program with community participants, and other times it provided important
spaces for the CMLF team to engage in creative work with the families.
Finally, having fun and celebrating with each other was important for the community and
the Shapedown staff. One highly successful evening, a member of the Michigan State University
team taught Zumba to all the families, (mothers, fathers, children, grandparents) in the cafeteria.
The music blared, the families laughed, and great Latin dancing and exercising brought the group
together.
Cultural Competence: Beyond just Speaking Spanish
Although it is very important that the entire CMLF team was bilingual, as all the parents
preferred to speak in Spanish while their children tended to prefer English, language was not the
only important aspect of making this program culturally competent.
The adapted Shapedown program placed heavy importance on the family, spending time
together, eating together, and being a regular part of each other’s lives. However, the Latino
families in Pontiac were already very close with each other. This aspect resonated with them,
but it did not inform their behaviors or attitudes. One struggle that the CMLF staff had was
trying to come up with culturally relevant food recipes and choices for these families. The
examples given in the Shapedown materials simply were not applicable or culturally relevant for
Spanish-speaking Latino families.
In order to meet this need, the CMLF team was provided with Spanish-language nutrition
and recipe booklets, such as Nos Gusta Comer by Celina Wille, Ph.D., and other authors. CMLF
staff members (Nutritionist and Social Worker) also searched outside the Shapedown manual for
food suggestions and recipes that included culturally appropriate but still healthy suggestions.
Even though the Shapedown staff was bilingual, they had to remain open to the cultures of the
families in the program different from their own. As the Social Worker commented, “in Mexico
people eat very heavy at breakfast, they eat heavy, we don’t do that. First of all I’m from Puerto
Rico and we are more American influenced, y yo puedo desayunar los huevos, los pancakes [but]
Mexicans don’t do that, so the Shapedown program doesn’t take that into consideration…[I]t’s
not only that the level of education is not appropriate but it is also the Hispanic population that
you’re trying to target. It was very interesting because the majority of the participants are
Mexican. I don’t think it was intentional, it was just random, but we try to also adjust to their
culture.”
Another example of this came during the educational exercise sessions. The Shapedown
physical education leader noted that many of the kids were used to playing soccer, but lacked in
hand-eye-coordination. Many were not used to forming teams with the other children and at
times there was difficulty in bringing the children together for simple organized sports. Because
some of the children apparently feel isolated in their communities, or are not allowed to wander
their neighborhoods for safety reasons, they have grown up too sedentary, hidden away in their
homes with television, video games, and computer programs.
Summary and Conclusions
About 5% of children in the Shapedown study were obese (i.e., a BMI at or above the
95th
percentile for their age and sex) and 10% of children were overweight (i.e., with a BMI
between the 85th
and 94th
percentile for their age and sex). We did not find any significant

31
differences between the Shapedown and control groups and across time (pre-, post-, and follow-
up times). About one-third of children indicated that they are overweight, which is more than
twice their real weight. This suggests that the preference for a thin body for themselves may
have influenced these responses.
In terms of child health, we find that in slightly more than one-third of children, parents
reported that their children were in fair or poor health and about one-fifth of children have not
used a health care professional in the last 12 months, 19% once a year, and 60% twice or more in
the last 12 months. These differences in the use of a health care professional can be attributed to
differences in SES (e.g., lack of health insurance or transportation to their health care providers).
About 29% of children were in top quintile of the psychological well-being score. We did not
find any significant difference in this index between the Shapedown and control group, but we
did a significant change in this index across time, with an increase in child’s psychological well-
being score between the pre-test and post-test assessments, followed by a decrease at follow-up.
Children in the Shapedown program were also involved in physical activity of some sort.
About 10% of these children indicated that they are more active than other children of their age
and about 39% of children indicated that they were involved in vigorous physical (i.e.,
activity/exercise of 20 continuous minutes or more per week). We found also, like other children
these days, children in the Shapedown program were involved in sedentary behavior, especially
game systems or computer games. About 19% of children were highly involved in game
systems or computer games. Children’s parents were also involved in physical activity. We
found that about one-fourth of parents were more physically active than other parents of similar
age and about 40% of parents indicated that they exercise for a minimum of 30 minutes for at
least 5 times a week.
Parent’s influence and control child intake. We found that about 20% of parents believe
that a child should eat all the food on his/her plate. We also found that 35% of parents were in
the top quintile of the nutrition control index score, i.e., they make sure that their children eat all
food on a plate. We also found that about 31% of parents were in the top quintile of the eating
habits and importance of eating healthy food scale, i.e., they talk to their children about the
importance of eating healthy foods, worry about their eating habits, and try to limit their
children’s eating of unhealthy foods. We found no significant differences in child’s eating habits
and importance of eating healthy score between Shapedown and control groups, but a significant
change in this score overtime (pre-, post-, and follow-up times).
We also found that 35% of children were ranked in the top quintile on the family
attachment/communication scale and that 23% of children were also ranked in the top quintile of
the family cohesion scale (i.e., spend free time with each other, get together for activities, eat
meal together etc.). Almost half of parents were obese, but only 26% consider themselves
overweight. About 43% of parents reported fair or poor health and 26% were in the top quintile
of the self-esteem scale. In regards to the neighborhoods of residence, 21% of neighborhoods
were ranked in top quintile as conducive to physical activity/exercise, 31% to have healthy
foods, and 14% to be very unsafe.
In addition to the major findings from above, the qualitative interviews outlined some of
the most valuable lessons that were learned as a result from the Shapedown intervention. These
included: learning how to eat, engagement with exercise, and that the family unit is key for long-
term sustainability. Also, participating with a research team from Michigan State University that
was mostly Latino (four members of the research team identified as Latino and Spanish
speaking) was a positive aspect of the program for the participants, especially the children who

32
were impressed with the positive role models.
The major challenges included finding an appropriate location that included all the
necessary aspects of the Shapedown intervention (including a physical activity area, kitchen,
meeting room, and play facilities for the children). In addition, it was recommended that the
program not start during the fall and winter months, with Michigan’s winter and transportation
already being a problem with this population, the timing made it difficult to retain participants in
the program. Finally, the program could have used more funds for incentives for the participants
to continue their participation, especially incentives for the children (such as backpacks, school
supplies, and so on). Also, the surveys given at the beginning and end of the intervention need to
be at a simpler reading level (preferably a 6th
grade reading level) and only last about 20 minutes.
Overall, the research program and interaction with a University was an excellent
experience for the participants. And further projects are encouraged between the community
agency (Centro Multicultural de la Familia) and the Michigan State University research team.
Future Studies
Further statistical analyses will assess whether the experimental group, time of
assessment (pre-, post-, and follow-up assessment), child’s health and health care utilization,
physical activity characteristics, parental nutritional control, family attachment and
communication, family cohesion, parental obesity and health, and neighborhood characteristics
are significantly associated with a child’s BMI, eating habits/importance of eating healthy foods,
and physical activity. The results of this study will be used as pilot data for a larger grant on
healthy habits and obesity among children and adolescents.

33
References
Akresh, Ilana R. 2007. “Dietary Assimilation and Health among Hispanic Immigrants to the
United States.” Journal of Health and Social Behavior, 48 (4): 404-417.
Antecol, Heather and Kelly Bedard. 2006. “Unhealthy Assimilation: Why Do Immigrants
Converge to American Health Status Levels?” Demography 43 (2): 337-360.
Bandura, A. 1998. “Health Promotion from the Perspective of Social Cognitive Theory.”
Psychology and Health 13: 623-649.
Boinapally P, Fussman C, Imes G. February 2011. Overweight and Obesity Facts in Michigan
Adults. Michigan’s Nutrition, Physical Activity and Obesity Program Surveillance Brief.
Michigan Department of Community Health, Division of Genomics, Perinatal Health and
Chronic Disease Epidemiology. (http://www.michigan.gov/mdch/0,1607,7-132-
2940_2955_2959_3208-148846--,00.html).
Bourdieu, Pierre. 1984. Distinction: A Social Critique of the Judgment of Taste. Cambridge:
Cambridge University Press.
Bronfenbrenner, Urie. 1986. “Ecology of the Family as a Context for Human Development:
Research Perspectives.” Development Psychology, 22 (6): 723-742.
Bruss, Mozhdeh B., Joseph R. Morris, Linda L. Dannison, Mark P. Orbe, Jackie A. Quitugua,
and Rosa T. Palacios. 2005. “Food, Culture, and Family: Exploring the Coordinated
Management of Members Regarding Childhood Obesity.” Health Communication 18 (2):
155-175.
Caprio, Sonia, Stephen R. Daniels, Adam Drewnowski, Francine R. Kaufman, Lawrence A.
Palinkas, Arlan L. Rosenbloom, and Jefrey B. Schwimmer. 2008. “Influence of Race,
Ethnicity, and Culture on Childhood Obesity: Implications for Prevention and
Treatment.” Diabetes Care, 31 (11): 2211-2221.
Carter, Robert Colin. 2002. “The Impact of Public Schools on Childhood Obesity.” Journal of
the American Medical Association 288 (17): 2180-81.
Centers for Disease Control and Prevention. 2011. “Basics about Childhood Obesity.”
Retrieved September 30, 2011 (http://www.cdc.gov/obesity/childhood/basics.html).
Cockerham, William C. 2005. "Health Lifestyle Theory and the Convergence of Agency and
Structure." Journal of Health and Social Behavior 46: 51-67.
Davison, Kirsten K. and Leann L. Birch. 2001. “Childhood Overweight: A Contextual Model
and Recommendations for Future Research.” The International Association for the Study
of Obesity. Obesity Reviews 2, 159-172.
Dixon, Lori B., Jan Sundquist, and Marilyn Winkleby. 2000. “Differences in Energy, Nutrient,
and Food Intakes in a U.S. Sample of Mexican-American Women and Men: Findings
from the Third National Health and Nutrition Examination Survey, 1988-1994.
American Journal of Epidemiology, 152 (6): 548-557.
Farooqi Ismaa S., O’Rahilly Steve 2007. “Genetic Factors in Human Obesity.” Obesity Reviews
8 (Suppl. 1):37–40.
Fried, Ellen J. and Marion Nestle. 2002. “The Growing Political Movement against Soft Drinks
in Schools.” Journal of the American Medical Association 288 (17): 2181-82.
Goel, Mita S., Ellen P. McCarthy, Russell S. Phillips, and Christina C. Wee. 2004. “Obesity
among U.S. Immigrant Subgroups by Duration of Residence.” Journal of the American
Medical Association, 292 (23): 2860-67.
Gordon-Larsen, Penny, Kathleen M. Harris, Dianne S. Ward, and Barry M. Popkin. 2003.

34
“Acculturation and Overweight-Related Behaviors among Hispanic Immigrants to the
U.S.: The National Longitudinal Study of Adolescent Health.” Social Science and
Medicine, 57: 2023-2034.
Gordon-Larsen, Penny, Robert G. McMurray and Barry M. Popkin. 2000. “Determinants of
Adolescent Physical Activity and Inactivity Patterns.” Pediatrics, 105: E83.
Haas, Jennifer S., Lisa B. Lee, Celia P. Kaplan, Dean Sonneborn, Kathryn A. Phillips, and Su-
Ying Liang. 2003. The Association of Race, Socioeconomic Status, and Health
Insurance Status with the prevalence of Overweight among Children and Adolescents.”
American Journal of Public Health 93 (12): 2105-10.
Janssen, Ian, William F. Boyce, Kelly Simpson, and William Pickett. 2006. “Influence of
Individual- and Area-Level Measures of Socioeconomic Status on Obesity, Unhealthy
Eating, and Physical Inactivity in Canadian Adolescents.” American Journal of Clinical
Nutrition 83: 139-145.
Karlsen, Saffron and James Y. Nazroo. 2002. “Relation Between Racial Discrimination, Social
Class, and Health among Ethnic Minority Groups.” American Journal of Public Health,
92(4): 624-631.
Kumanyika, Shiriki K. 2008. “Environmental Influences on Childhood Obesity: Ethnic and
Cultural Influences in Context.” Physiology & Behavior, 94(1): 61-70.
Lara, Marielena, Chritina Gamboam, M. Iya Kahramanian, Leo S. Morales, and David E. Hayes
Bautista. 2005. “Acculturation and Latino Health in the United States: A Review of the
Literature and its Sociopolitical Contexts.” Annual Review of Public Health 26: 367-97.
Leslie, Laurel K., Dena Plemmons, Amy R. Monn, and Lawrence A. Palinkas. 2007.
“Investigating ADHD Treatment Trajectories: Listening to Families’ Stories about
Medication Use.” Journal of Developmental and Behavioral Pediatrics 28: 179-188.
Lindsay, A. C., Sussner K. M., J. Kim, and S. Gortmaker. 2006. “The Role of Parents in
Preventing Childhood Obesity.” The Future of Children 16 (1): 187-207.
Lobstein T., L. Baur, and R. Uauy. 2004. “Obesity in Children and Young People: A Crisis in
Public Health.” Obesity Reviews 5 (Suppl. 1): 4-104.
Lovasi, Gina S., Malo A. Hutson, Monica Guerra, and Kathryn M. Neckerman. 2009. “Built
Environments and Obesity in Disadvantaged Populations.” Epidemiologic Reviews 31:
7-20.
Lutfiyya, May Nawal, Rosemary Garcia, Christine M. Dankwa, Teriya Young and Martin S.
Lipsky. 2008. “Overweight and Obese Prevalence Rates in African American and
Hispanic Children: An Analysis of Data from the 2003-2004 National Survey of
Children’s Health.” Journal of the American Board of Family Medicine, 21(3): 191-199.
Mazur, Robert E., Grace S. Marquis, and Helen H. Jensen. 2003. “Diet and food insufficiency
among Hispanic youths: Acculturation and socioeconomic factors in the third National
Health and Nutrition Examination Survey.” American Journal of Clinical Nutrition,
78(6): 1120-1127.
Michigan’s Nutrition, Physical Activity and Obesity Program (MiNPAO). 2011. Overweight
and Obesity in Michigan: Surveillance Update 2011. Michigan Department of
Community Health.
Mokdad, Ali H., Earl S. Ford, Barbara A. Bowman, William H. Dietz, Frank Vinicor, Virginia S.
Bales, and James S. Marks. 2003. “Prevalence of Obesity, Diabetes, and Obesity-Related
Health Risk Factors, 2001.” Journal of the American Medical Association 289: 76-79.
Morland, Kimberly, Ana V. Diez Roux, and Steve Wing. 2006. “Supermarkets, Other Food

35
Stores, and Obesity.” American Journal of Preventive Medicine, 30(4): 333-339.
Nelson, Melissa C., Penny Gordon-Larsen, Yan Song, Barry M. Popkin. 2006. “Built and
Social Environments: Associations with Adolescent Overweight and Activity.”
American Journal of Preventive Medicine, 31(2): 109-117.
Neuhouser Mariam L., Beti Thompson, Gloria D. Coronado, and Cam C. Solomon. 2004.
“Higher Fat Intake and Lower Fruit and Vegetables Intake Are Associated with Greater
Acculturation among Mexicans living in Washington State.” Journal of the American
Dietetic Association, 104(1): 51-57.
Ogden, Cynthia L., Margaret D. Carroll, Lester R. Curtin, Margaret A. McDowell, Carolyn J.
Tabak and Katherine M. Flegal. 2006. “Prevalence of Overweight and Obesity in the
United States, 1999-2004.” Journal of the American Medical Association 295(13): 1549–
1555.
Ogden, Cynthia L., Margaret D. Carroll, Lester R. Curtin, Molly M. Lamb, and Katherine M.
Flegal. 2010. “Prevalence of High Body Mass Index in US Children and Adolescents,
2007-2008.” Journal of the American Medical Association 303(3): 242-249.
Popkin, Barry M., and J. Richard Udry. 1998. “Adolescent Obesity Increases Significantly in
Second and Third Generation United States Immigrants: The National Longitudinal
Study of Adolescent Health.” Journal of Nutrition 28: 701-706.
Robert, Stephanie A. and Eric N. Reither. 2004. “A Multilevel Analysis of Race, Community
Disadvantage, and BMI.” Social Science and Medicine 59(12): 2421-34.
Sallis, James F. and Karen Glanz. 2006. “The Role of Built Environments in Physical Activity,
Eating, and Obesity in Childhood.” The Future of Children, 16(1): 89-108.
Sallis, James F. and B. E. Saelens. 2000. “Assessment of Physical Activity by Self-Report:
Status, Limitations and Future Directions.” Research Quarterly for Exercise and Sports
71 (2): S1-14.
Sallis, James F., Judith J. Prochaska., and Wendell C. Taylor. 2000. “A Review of Correlates of
Physical Activity of Children and Adolescents.” Medicine & Science in Sports &
Exercise, 32: 963-975.
Sampson, Robert J., Stephen W. Raudenbush, and Felton Earls. 1997. “Neighborhoods and
Violent Crime: A Multilevel Study of Collective Efficacy.” Science, 277: 918-924.
Schultz, Amy J. and Leith Mullings. 2006. Gender, Race, Class, and Health. San Francisco,
CA: Jossey-Bass.
Taylor, John and R. Jay Turner. 2002. "Perceived Discrimination, Social Stress, and Depression
in the Transition to Adulthood: Racial Contrasts." Social Psychology Quarterly 65:213-
225.
U.S. Department of Health and Human Services. 2011. Strategic Plan for NIH Obesity
Research: A Report of the NIH Obesity Research Task Force. National Institute of
Health. NIH Publication No. 11-5493 (March).
Van Hook, Jennifer and Elizabeth Baker. 2010. “Big Boys and Little Girls: Gender,
Acculturation, and Weight among Young Children of Immigrants.” Journal of Health
and Social Behavior 51:200–14.
Welk, Gregory J., Kherrin Wood, and Gina Morss. 2003. “Parental Influences on Physical
Activity in Children: An Exploration of Parental Mechanisms.” Pediatric Exercise
Science, 15(1): 19-33.
Whitehead, Dean. 2003. “Health Promotion and Health Education Viewed as Symbiotic
Paradigms: Bridging the Theory and Practice gap Between them.” Journal of Clinical

36
Nursing 12: 796-805.
Williams, David R. and Chiquita Collins. 1995. “US Socioeconomic and Racial Differences in
Health: Patterns and Explanations.” Annual Review of Sociology 21:349–86.
Williams, David R. and Michelle Sternthal. 2010. “Understanding Racial-Ethnic Disparities in
Health: Sociological Contributions.” Journal of Health and Social Behavior, 51: S15-
S27.
Yen, Irene H. and George A. Kaplan. 1999. "Neighborhood Social Environment and Risk of
Death: Multilevel Evidence from the Alameda County Study." American Journal of
Epidemiology, 149(10): 898-907.

37
Appendix A. Shapedown Intensive-Intervention Treatments –Session I
Session 0: Welcome/Getting Started; Fitness Testing;
Session 1: Kids- Understanding causes of weight, body image; Parents- Causes and
consequences of child's weight; Family- Effective praise and family time; Exercise- Warm-up
exercises; and Food records-free, light, heavy, junk;
Session 2: Kids- setting goals; Parents- Setting goals, Feelings about child's weight; Exercise-
kids design exercise- warm up, huff and puff, cool down; and Food Demo: veggies. Eat more
veggies, 3 daily;
Session 3: Kids- Accepting body build, being comfortable and/or uncomfortable in body;
Parents- Using Positives to help our children succeed; Exercise- circuit course; and Food
Groups;
Session 4: Kids- Learning about hunger and fullness, Speaking up for self when it comes to
food; Parents- Setting Limits and expectations; Exercise-Activities with Resistance bands and
activity in limited spaces. (Resistance bands provided); and Not feeling deprived. Food demo
Fruit kabobs;
Session 5: Kids- Coping with feelings, expressing feelings to parents; Parents- Focusing on
positives, expressing feeling to children; Exercise- Family Relay Race; and Light dairy and
protein Food Demo: Smoothies;
Session 6: Kids- Dealing with put-downs and bullying; Parents- Relaxation and visualization,
Setting limits-review and practice; Exercise- Basketball game or games with bounce balls; and
Hunger scale, food records;
Session 7: Kids- Identifying food triggers, managing feelings; Parents- Identifying food triggers,
managing feelings, supporting kids in managing triggers and feelings; 3 meals a day, light grains,
foods demo: lavish sandwiches;
Session 8: Kids- Identifying pleasurable activities, triggers and behavioral cycles; Parents-
Creating a successful and active environment, behavioral cycles of eating; Exercise - circuit
course; and Food Records – Free, Light, Heavy and Junk. Food Demo: Yogurt Sundaes; and
Session 9: Review of Shapedown; Fitness Testing; Graduation; Family Evaluation of Program.
Appendix B. Shapedown Intensive-Intervention Treatments – Session II
Week 1: Participants attended a program orientation to understand the program objectives, and
participated in pre-test and data collection. Intervention and control groups participated on
different days. Pre-test consisted of the following biometric measures: resting blood pressures,
height, weight, sit and reach, sit-ups, and 2 minutes step test with heart rate. Food demo –Fruit
cup.
During weeks 2-7: The following nutrition education topics were covered:
Week 2:

38
Session 1: Causes of being heavy, feelings about weight, consumption of fruits and vegetables
and the importance of exercise. Food demo –Vegetable soup/ Sopa de verduras.
Week 3:
Session 2: Feelings about weight (continued), free, light, heavy, nutrient-poor foods and ½ plate
model, basics of exercise. A food demo was presented as part of the session –Tuna with whole
crackers.
Session 3: Self-esteem, keeping food records, and all about muscles.
Week 4:
Session 4: Limits and expectations, USDA Food Pyramid, hunger scale, breakfast ideas,
motivations to exercise. Smoothies were made as this week’s food demo – Small Pitta Wraps.
Week 5:
Session 5: Communication, portion sizing, eating on the run, lunch ideas, food as energy.
Sandwich roll-up were made as this week’s food demo – Roll-ups Sandwich.
Week 6:
Session 6: Family dynamics and food, menu planning and setting exercise goals. Food demo –
Brown rice with tuna and veggies
Week 7:
Session 7: Stress overeating, cravings, secretive eating. Quality time, special occasion eating,
recipe makeovers and rewarding yourself. Food Demo – fruit and cheese kabobs.
Week 8: The final session was held and included the following activities:
Session 8: Post –test, final fitness evaluation, graduation and food demo – yogurt sundae, cereal
and fruits