shared savings power tools to improve mssp …...1 shared savings power tools to improve mssp...
TRANSCRIPT

1
Shared Savings Power Tools to Improve MSSP Quality Scores
Session 119, March 7, 2018
Jim Whitfill, MD CMO Innovation Care Partners
Faron Thompson, COO Innovation Care Partners

2
James Whitfill, MD is President of Lumetis, LLC
Faron Thompson, MBA
Has no real or apparent conflicts of interest to report.
Conflict of Interest
3
Agenda
• Who is Innovation Care Partners
• ICP Growth and Success Metrics
• Keys to ICP Success
• MSSP Quality Reporting Evolution

4
Learning Objectives
• Explain some of the challenges that ACOs participating in the
Medicare Shared Savings Program (MSSP) face as related
to reporting, data gathering, and informatics.
• Describe how an open health information exchange (HIE)
platform and a customized ACO-focused application can
seamlessly integrate analytics into reporting and monitoring
workflows to streamline MSSP reporting requirements.
• List three benefits of collecting MSSP reporting data via an
ACO-focused application versus collecting the same data
and outcomes through Excel spreadsheets completed by
more than 60 medical practices with disparate EHR systems.
5
What type of organization do you represent?
1.ACO
2.Hospital or Health System
3.Consultant or Service Provider
4.Technology Vendor

6
For the ACO I represent or am most familiar, the ACO has existed for how many years:
1. We are still contemplating becoming an ACO in the future
2. 2018 is our first year
3. 1 year
4. 2-3 years
5. 4+ years

77
What is Innovation Care Partners (ICP)?
• Established July, 2012
• Scottsdale, AZ
• Joined MSSP 2014 Track 1
• Now Track 2 for 2018
• CI - Legal mechanism that allows practices to remain independent but work together to provide coordinated quality care
• MSSP – Participant in CMS Medicare Shared Savings Program
Clinical Integration (CI) and Accountable Care Organizations (ACO)
HonorHealth
Innovation
Care Partners
Scottsdale Health
Partners MSSP
John C. Lincoln
ACO MSSP
Commercial and
Medicare Advantage Plans
Wholly owned
Managed by ICP

8
Innovation Care Partners Strategic Framework
Physician
Engagement
Care
Coordination
Information
TechnologyCollaboration
Vision: Innovation Care Partners will be the leader in innovative healthcare
delivery with exceptionally high quality, balanced against cost, and will be
the preeminent partner of choice for aligned physicians and payers.
Mission: Innovation Care Partners provides coordinated, high-
value, evidence-based care to improve the health and well-being
of the patients and families we serve.
Values: • Patient-centered
• Physician driven
• Transparent and Fair
• Pluralistic
• Continuously
Improving
ICP Pillars for Success
Clinical & Risk
Analytics
99
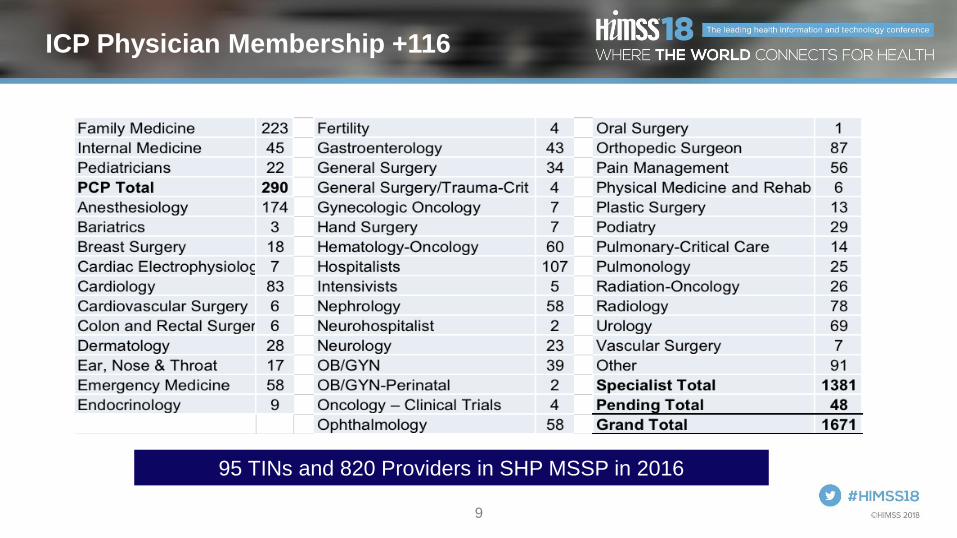
ICP Physician Membership +116
95 TINs and 820 Providers in SHP MSSP in 2016
10
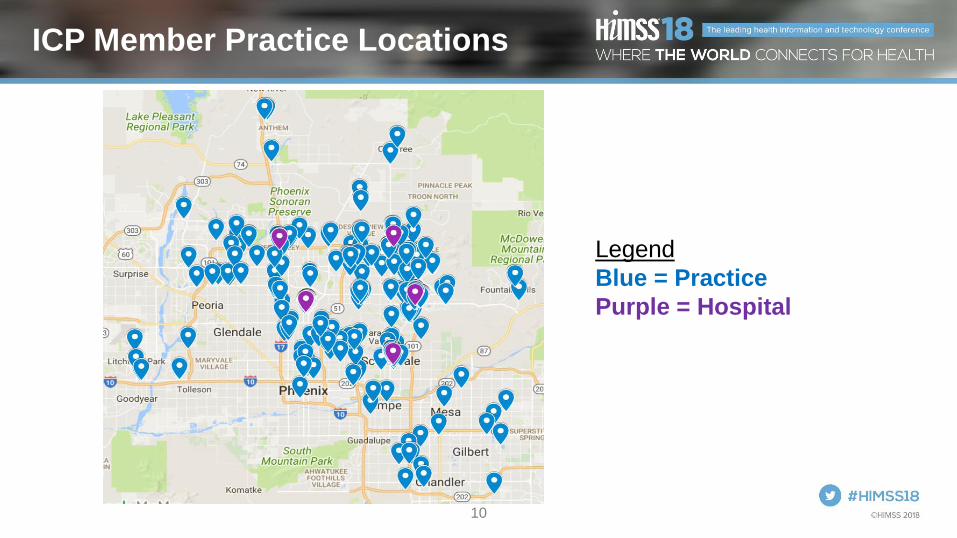
ICP Member Practice Locations
Legend
Blue = Practice
Purple = Hospital

11
ICP is a Pluralistic ACO
• ~ 400 health system employed physicians
• ~ 1200 independent private practice physicians
• ~ 58 health system employed practices
• ~ 403 independent private practices
• > 60 different EMRs
• Most EMRs not yet integrated into ICP’s private health information exchange
108 private practices and 58 employed practices are
in the SHP MSSP

12
The ACO that I represent or am most familiar with is:
1.Owned by a Hospital or Health System
2.Physician owned
3.Owned by a Management Company
4.Joint Venture
13
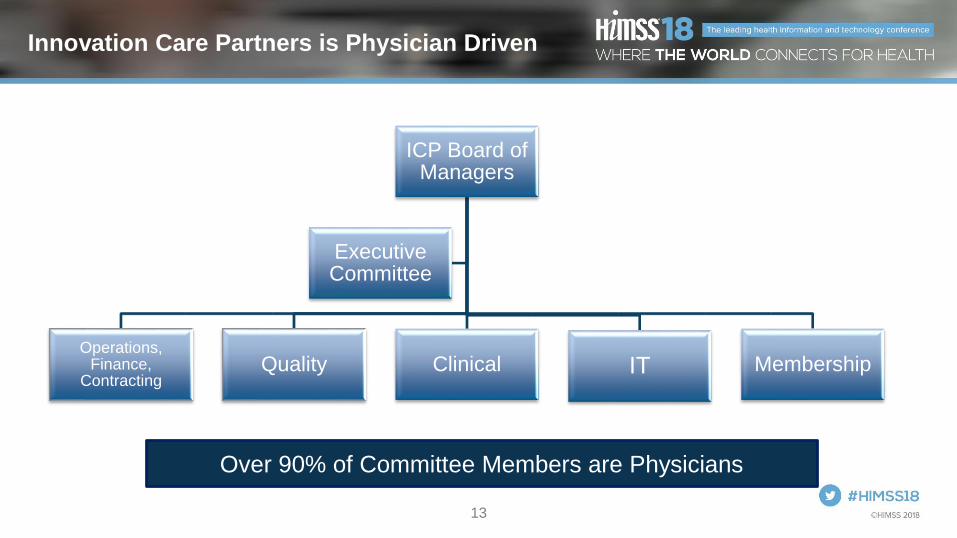
Innovation Care Partners is Physician Driven
Over 90% of Committee Members are Physicians
ICP Board of Managers
Operations, Finance,
ContractingQuality Clinical IT Membership
Executive Committee

14
Patient Volume Growth > 24%
87,000
covered
lives

15
2,900
enrolled
patients
since
program
inception
Care Coordination + 184%
16
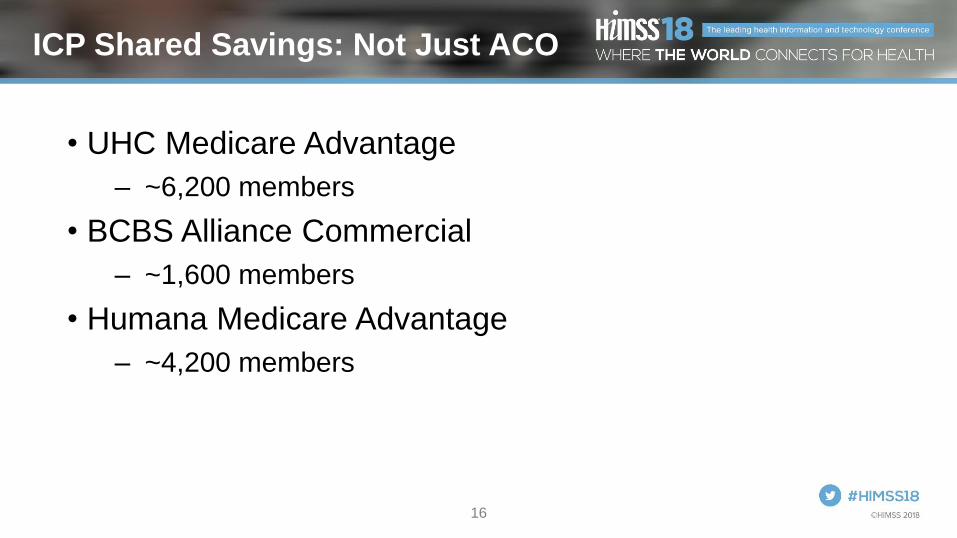
ICP Shared Savings: Not Just ACO
• UHC Medicare Advantage
– ~6,200 members
• BCBS Alliance Commercial
– ~1,600 members
• Humana Medicare Advantage
– ~4,200 members

17
The ACO I represent or am most familiar with:
1.Has earned shared savings
2.Has never earned shared savings
3.Has had mixed results

1818
2016 SHP MSSP Performance Results
YTD Q4
2016
Final
2016
YTD Q1
2017
YTD Q2
2017
Total Expenditures $180M $182M $211M $218M
Benchmark $200M $201M $243M $252M
Benchmark Minus Total
Expenditures$20M $19M $32M $33M
Savings $9.6M $8.9M $13.2M $13.9M

1919
Cost vs. Benchmark Trend

20
SHP MSSP Historical Performance
# Category 2014 2015 2016Total
Lifetime
1 Number of Beneficiaries 15,530 19,021 19,216
2 Quality Scores 100% 93.76% 96.96%
3 Benchmarks $8,520 $10,329 $10,769
4 Savings $3,741,063 $9,943,847 $18,696,249
5 Savings per Beneficiary $241 $523 $973
6 Earned Shared Savings $1,833,121 $4,568,301 $8,883,074 $15,284,496
7 Earned Shared Savings per Beneficiary $118 $240 $462
8 Increased Shared Savings - Year over Year $2,735,180 $4,314,773
21
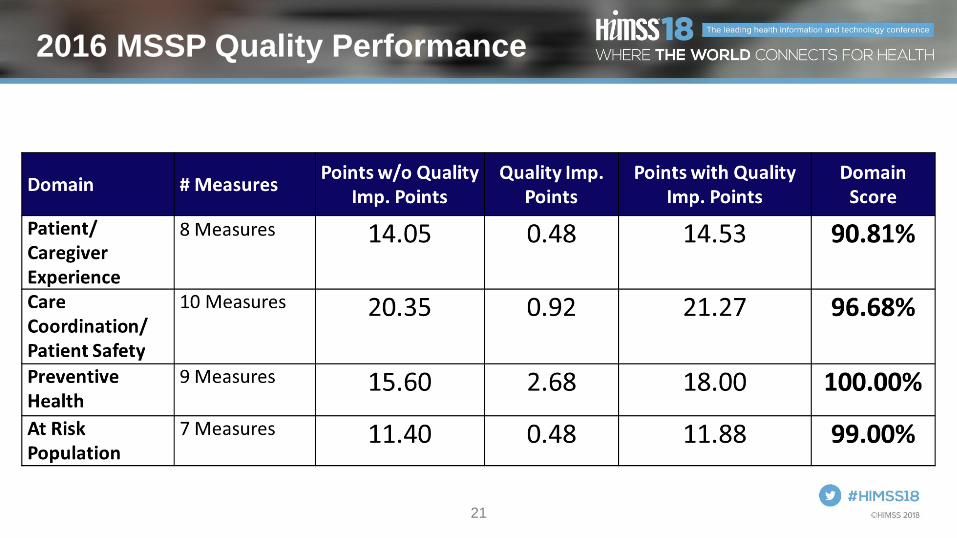
2016 MSSP Quality Performance

22
SHP MSSP Saved CMS Money and
Earned Shared Savings 3rd Year in a Row
Saved $18.7M Earned $8.9M
• The only Arizona-based MSSP that earned revenue for 2016
• The first Arizona MSSP to earn revenue in 2014
• Only Arizona-based MSSP to earn revenue each year since inception (2014)
• Performed in the top 5% of MSSPs nationally in terms of total dollars received
• Had the highest savings rate in the country at 9%
• Scored 97 out of 100 for quality

23
100%
93.76% 96.96%
0%
10%
20%
30%
40%
50%
60%
70%
80%
90%
100%
2014* 2015 2016
Quality Trends
*2014 Pay for Reporting Year

24
Innovation Care Partners - Keys to Success
1. Engage Physicians
2. Care Coordination and Transitional Care Management
3. Improve access to data for clinicians
4. Improve provider communications and coordination
5. Manage the health of our populationLeads to…
• Improved quality
• Reduced cost
• Improved patient satisfaction

25
Engage Physicians
• 3 All Member meetings per year
• Quarterly PCP meetings
• Monthly newsletter
• Physicians on board and 5 committees
• Independent sister physician organization
• Support physicians with useful and easy-to-use technologies
• Pay care management payments to PCPs quarterly tied to engagement in quality programs
• Pay gain share
• Measure engagement using “citizenship points” and hold as threshold for membership and gain share

2626
Care Coordination &
Transitional Care Management

27
Improve Access to Data for Clinicians
• Robust private health information exchange
• Easy to use
• Longitudinal patient record combining patient data from multiple disparate sources

28
Improve Provider Communications
& Coordination

29
Manage the Health of Our Population

30
SHP’s MSSP Quality Reporting Journey

31
Technology and Process Evolution

32
For the ACO I am most familiar with, annual quality reporting is:1. A piece of cake
2. Complex but we have it under control
3. Challenging and interested in better approaches
4. 2018 is the first year for quality reporting

33
For the ACO I am most familiar with, we have ___ EMRs:1. 1
2. 2-3
3. 3-10
4. 10+
34
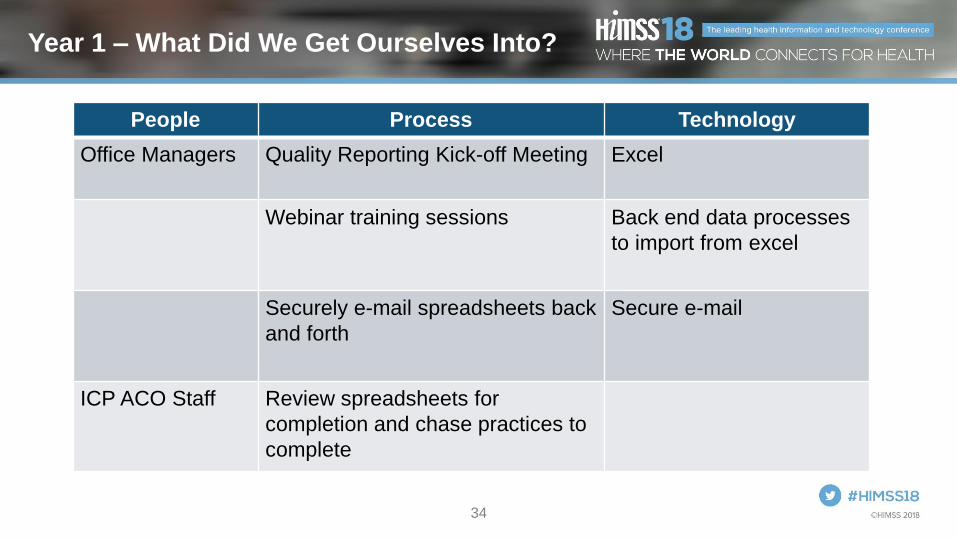
Year 1 – What Did We Get Ourselves Into?
People Process Technology
Office Managers Quality Reporting Kick-off Meeting Excel
Webinar training sessions Back end data processes
to import from excel
Securely e-mail spreadsheets back
and forth
Secure e-mail
ICP ACO Staff Review spreadsheets for
completion and chase practices to
complete

35
2014 Quality Reporting Tool

36
2014 Performance Year Results
Quality Score: 100% reported (pay for reporting year)
Shared Savings Earned: $1.8M
Shared Savings Left on Table: $0
However, 65% equivalent score
Shared Savings Left on Table at 65%: $640k
2014 Week 1 Week 2 Week 3 Week 4 Week 5
Percent Complete by Week
1% 11% 27% 67% 80%

37
Performance Year 1 – Lessons Learned
• Poor attendance at the kickoff and webinars
• Quality reporting tool was not user-friendly
• Not enough education on quality measures
• ICP staff spent most time chasing practices to complete assignments

38
Year 2 – Build a Mouse Trap
People Process Technology
Office staff that will
perform the quality
reporting
Quality Reporting Kick-off
Meeting
Web-based MSSP quality
reporting software
Incentives to participate
early
Live in-person mandatory
training sessions
Pre populate quality
metrics from Health
Information Exchange first
ICP ACO Staff Analyze the quality scores
and focus on seeking data
from additional encounters
Access Database for
analysis

39
Quality Exchange
• ACO quality
reporting tool
• Captures data
where ICP has it
already
• Easy entry for
office staff
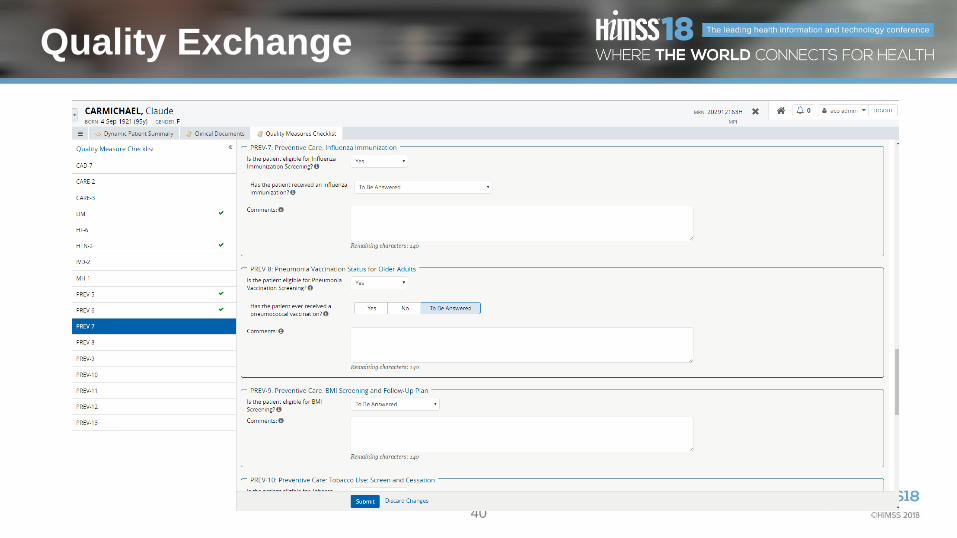
40
Quality Exchange is Easy to Use
Quality Exchange

41
How Does It Work?
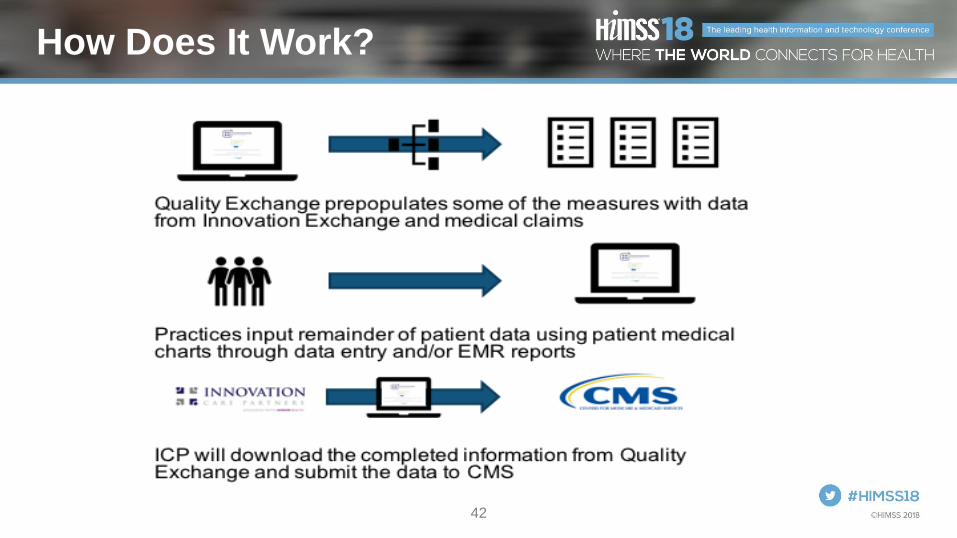
42
How Does It Work?

43
Quality Data Follow-Up Analysis

44
2015 Quality Score 91% Projected 2016 Quality Score 93%
Total Passed Rate 91% Total Passed Rate 93%
Total Failed Rate 9% Total Failed Rate 7%
Grand Total 58 Grand Total 92
8 Pay for Performance Measures in 2015Passed Eligible Patients
Sample Practice
Name SHP Goal
Fal ls Risk Assessment (N=8) 8 8 100.00% 52.67% 73.38%
Ischemic Vascular Disease (Aspirin) (N=7) 7 7 100.00% 90.97% 90.00%
Influenza Immunization (N=5) 5 5 100.00% 61.75% 90.00%
Pneumococcal Vaccination (N=8) 8 8 100.00% 51.14% 90.00%
Body Mass Index Screening & Fol low Up (N=8) 8 8 100.00% 84.13% 90.00%
Tobacco Use Assessment & Cessation Intervention (N=8) 8 8 100.00% 94.70% 90.00%
Hypertens ion Control (<140/90) (N=11) 8 11 72.73% 71.09% 79.65%
Depress ion Screening (N=3) 1 3 33.33% 54.88% 51.81%R ed = D id no t m eet go al; Green = Go al m et
5 Additional Pay for Performance Measures in 2016Passed Eligible Patients
Sample Practice
Name SHP Goal
Coronary Artery Disease - ACE Inhibi tor or ARB Therapy (N=7) 7 7 100.00% 81.38% 91.67%
Heart Fa i lure - Beta Blocker Therapy for LVSD (N=1) 1 1 100.00% 85.92% 90.00%
Mammography Screening (N=8) 8 8 100.00% 58.39% 90.00%
Colorecta l Cancer Screening (N=12) 11 12 91.67% 47.78% 90.00%
High Blood Pressure Screening & Fol low Up (N=6) 6 6 100.00% 77.32% 90.00%R ed = D id no t m eet go al; Green = Go al m et
3 Pay for Reporting MeasuresPassed Eligible Patients
Sample Practice
Name SHP Goal
Mental Health - Depress ion Remiss ion n/a n/a n/a n/a n/a
Diabetes - HbA1c poor control (N=7) 3 7 42.86% 21.60% n/a
Diabetes - Retina l Eye Exam (N=7) 5 7 71.43% 37.11% n/a
Diabetes - Compos ite (A1C+Retina l Exam) (N=7) 4 7 57.14% 32.93% n/a
Medication Documentation n/a n/a n/a n/a n/a
2015 ACO Annual Quality Reporting Performance
Sample Practice Name
93%
7%
TotalPassed Rate
Total FailedRate
Projected Score for 2016 Pay-for-Performance Measures
0.00%
20.00%
40.00%
60.00%
80.00%
100.00%
Falls RiskAssessment
(N=8)
IschemicVascular Disease(Aspirin) (N=7)
InfluenzaImmunization
(N=5)
PneumococcalVaccination
(N=8)
Body Mass IndexScreening &
Follow Up (N=8)
Tobacco UseAssessment &
CessationIntervention
(N=8)
HypertensionControl
(<140/90)(N=11)
DepressionScreening (N=3)
8 Pay for Performance Measures in 2015
Sample Practice Name SHP Goal
0.00%
20.00%
40.00%
60.00%
80.00%
100.00%
120.00%
Coronary Artery Disease -ACE Inhibitor or ARB
Therapy (N=7)
Heart Failure - BetaBlocker Therapy for LVSD
(N=1)
Mammography Screening(N=8)
Colorectal CancerScreening (N=12)
High Blood PressureScreening & Follow Up
(N=6)
5 Additional Pay for Performance Measures in 2016
Sample Practice Name SHP Goal
91%
9%
Total PassedRate
Total FailedRate
Overall 2015 Pay-for-Performance Measures Only

45
2015 Performance Year Results
Quality score: 94%
Shared Savings Earned: $4.6M
Shared Savings Left on Table: $304k
Shared Savings Left on Table at 65%: $1.4M
2015 Week 1 Week 2 Week 3 Week 4 Week 5
Percent Complete by Week
46% 60% 76% 84% 88%

46
Performance Year 2 - 2015
Lessons Learned
• Rave reviews from users for new software
• Incentives promoted friendly competition among practices
• ICP ACO staff focus on quality metric improvement was much better use of time
• Minor software tool bugs & issues
• Not enough education on quality measures
• Inconsistent patient attribution

47
Year 3 – Build a Better Mouse Trap
People Process Technology
Office staff that will
perform the quality
reporting
Quality Reporting Kick-off
Meeting
Enhanced web-based
MSSP quality reporting
software
Incentives to
participate early
Live in-person mandatory
training sessions with more
training on the quality metrics
themselves
Pre populate quality
metrics from Health
Information Exchange first
ICP ACO Staff Analyze the quality scores and
focus on seeking data from
additional encounters
Improved Access database
for analysis

48
2016 Performance Year Results
Quality score: 97%
Shared Savings Earned: $8.8M
Shared Savings Left on Table: $310k
Shared Savings Left on Table at 65%: $1.4M
2016Week
1Week 2 Week 3 Week 4 Week 5
Percent Complete by Week
41% 64% 81% 85% 95%

49
Performance Year 3 - 2016
Lessons Learned
• Improved software was easier to use
• Require data validation during the reporting period

50
MSSP Quality Reporting
Process Acceleration
2014 Week 1 Week 2 Week 3 Week 4 Week 5
Percent Complete by Week
1% 11% 27% 67% 80%
2015 Week 1 Week 2 Week 3 Week 4 Week 5
Percent Complete by Week
46% 60% 76% 84% 88%
2016 Week 1 Week 2 Week 3 Week 4 Week 5
Percent Complete by Week
41% 64% 81% 85% 95%

51
Alignment to HIMSS Value Framework
• Commercially available tools now exist to improve
the quality reporting experience for practices and
ACOs. Therefore, all ACOs don’t have to repeat the
learning curve.
• Physician/practice engagement is critical
• Quality measure capture using secure technologies
• It is very possible to achieve high MSSP quality
reporting scores without being vertically integrated
and on a single EMR

52
Questions
@jwhitfill
www.ICPHealth.com
Please complete online session evaluation