shareholders at the gate? institutional investors and...
TRANSCRIPT

Shareholders at the Gate? InstitutionalInvestors and Cross-Border Mergers andAcquisitions
Miguel A. FerreiraUniversidade Nova de Lisboa
Massimo MassaINSEAD
Pedro MatosUniversity of Southern California
We study the role of institutional investors in cross-border mergers and acquisitions(M&As). We find that foreign institutional ownership is positively associated with the inten-sity of cross-border M&A activity worldwide. Foreign institutional ownership increases theprobability that a merger deal is cross-border, successful, and the bidder takes full controlof the target firm. This relation is stronger in countries with weaker legal institutions andin less developed markets, suggesting some substitutability between local governance andforeign institutional investors. The results are consistent with the hypothesis that foreigninstitutional investors act as facilitators in the international market for corporate control;they build bridges between firms and reduce transaction costs and information asymmetrybetween bidder and target. We conclude that cross-border portfolio investments of institu-tional money managers and cross-border M&As are complements in promoting financialintegration worldwide. (JEL G15, G23, G34)
International capital flows have reached peak levels in recent years. As coun-tries have opened their capital markets to foreign investors, we have seen aboom in both foreign direct investment (FDI) and portfolio flows (Bekaert and
We thank Michael Weisbach (the editor), two anonymous referees, Martinj Cremers, Mariassunta Giannetti,Todd Gormley, John Griffin, Andrew Karolyi, Simi Kedia, Anzhela Knyazeva, Florencio Lopez-de-Silanes,Marina Martynova, Enrico Perrotti, Jose-Luis Peydro, Stefano Rossi, Stefan Ruenzi, Michael Schill, and LauraStarks; participants at the University of Texas–Austin Institutional Investors Conference, the 18th FinancialEconomics and Accounting Conference at New York University, the ninth Conference of the ECB-CFS Re-search Network, the 2007 European Finance Association meetings in Ljubljana, the Third McGill Conference onGlobal Asset Management Conference, the Korean Development Institute Conference on “Market for CorporateControl: Comparative Perspectives,” and the Third Financial Intermediation Research Society Conference; andseminar participants at Barclays Global Investors, Bruegel, European Central Bank, European Union Commis-sion, Stockholm School of Economics, University of Amsterdam, University of Cologne, and University ofSouthern California. This research is supported by a research grant from the Fundacao para a Ciencia e Tecnolo-gia (FCT/POCI 2010). Send correspondence to P. Matos, USC Marshall School of Business, 3670 TroussaleParkway, BRI 308, Los Angeles, CA 90089-1427; telephone: (213) 740-6533; fax: (213) 740-6650. E-mail:[email protected].
C©All rights reserved. For Permissions, please e-mail: [email protected]:10.1093/rfs/hhp070
The Author 2009. Published by Oxford University Press on behalf of The Society for Financial Studies.
Advance Access ublication September 12, 2009p

Harvey 2000; Stulz 2005). More than half of the total FDI has taken the formof cross-border mergers and acquisitions (M&As; Organization for EconomicCo-Operation and Development 2007). For the first time in recent history, in2007, the value of cross-border deals equaled the value of intraborder M&As(Economist 2007a). At the same time, a more active international role of insti-tutional money managers has taken cross-border portfolio investment to recordlevels, representing an unprecedented internationalization of the shareholderbase of corporations worldwide.1
We investigate how these two forms of international capital flows (cross-border portfolio investment and M&As) interact. Anecdotal evidence suggeststhat the presence of foreign institutional investors is especially pivotal whencontrol of assets is being transferred from local to foreign companies. In thelargest takeover battle to date—the hostile bid by Vodafone (a UK company)for Mannesmann (a German company) in 1999—the success of Vodafone’soffer has been attributed to the fact that Mannesmann had the most interna-tional ownership structure of any German firm; 68% of its shares were heldby foreigners, mainly large institutional investors based in the UK and the US(Kedia 2001). Foreign shareholders were reported to clearly favor the Vodafonedeal.2 Another high-profile cross-border M&A was the 2007 takeover of ABNAMRO, a Dutch bank. In this case, a UK-based hedge fund, The Children’sInvestment Fund (TCIF), pressed ABN AMRO managers to search for a foreignbidder, which ended up being Barclays, a UK bank (Economist 2007b). Even-tually, the takeover contest was won by a consortium led by the Royal Bank ofScotland, another UK bank. These two high-profile M&A deals are examplesof the role that international institutional investors play in these cross-bordertransactions.
We entertain two hypotheses. The first hypothesis (substitution hypothesis)posits that the presence of foreign investors as shareholders of corporationsmakes takeovers by foreign bidders less necessary. One reason is that in-stitutions may provide effective corporate monitoring. Institutional investorslike TIAA CREF and CalPERS in the United States (Carleton, Nelson, andWeisbach 1998; Gillan and Starks 2007), Hermes in the UK (Becht et al.2009) and, more recently, hedge funds (Brav et al. 2008; Greenwood and Schor2009; Klein and Zur 2009) have been pioneers in shareholder activism, usingthe proxy process and other approaches to pressure corporate managers fora change. Foreign institutions potentially play more of a role in promptingchanges in corporate governance practices than domestic institutions (Gillanand Starks 2003; Ferreira and Matos 2008). For example, Fidelity is reported
1 Institutional money managers have become major players in world markets, holding over US$20 trillion inequities, or close to 50% of the world market capitalization, according to International Monetary Fund (2005).
2 Prior to the Vodafone takeover, Mannesmann had itself acquired Orange (a UK mobile phone operator) in ashares swap. Thus, the ownership structure of Mannesmann had many more foreign institutions than was typicalfor a German firm. In fact, all shareholders with holdings above 0.1% were institutional money managers, andGerman funds had less control than UK and US funds (Hopner and Jackson 2004).
602
The Review of Financial Studies / v 23 n 2 2010

Institutional Investors and Cross-Border Mergers and Acquisitions
to be more aggressive on governance issues in Europe, but it is relatively ac-quiescent in the United States, where it manages several corporate pensionaccounts (Business Week 2006; Davis and Kim 2007). If foreign institutionsact to implement better governance, their presence will reduce the need forcorporate control transactions to resolve agency issues.
Another reason why the presence of foreign institutions may reduce the needfor cross-border M&As is that, as capital markets open up and investors areable to invest abroad, we expect the “diversifying” role of cross-border M&Asto become less important. Adler and Dumas (1975) and Errunza and Senbet(1984) advance theoretical arguments for corporations to diversify internation-ally based on the idea of capital market imperfections. If investment barriersprevent investors from purchasing foreign stocks directly, there is a role for cor-porations to diversify internationally through acquisitions.3 In addition, as port-folio investors become more agile, there is a reduction in misvaluations acrosscountries and therefore in the scope for cross-border arbitrage by multinationalfirms through M&As, as suggested by Baker, Foley, and Wurgler (2009).
The second hypothesis (facilitation hypothesis) posits that foreign portfolioinvestors build bridges between firms internationally and that their presence asshareholders of corporations actually facilitates cross-border M&As. This isdue to several concurring reasons. First, foreign institutions can help to reducethe bargaining and transaction costs associated with the higher asymmetry ofinformation between bidders and targets in international takeover bids. Foreigninstitutions that are already present in the target country can fill the informa-tional gap between a foreign bidder and the target company. In contrast, localshareholders are less likely to entertain cross-border deals due to familiar-ity bias (e.g., distance, cultural, and language) or preference for local shares(Coval and Moskowitz 2001; Grinblatt and Keloharju 2001). The second reasonis that a large foreign investor presence can be pivotal to alleviate the free-riderproblem that occurs when the ownership is divided over many shareholders(Grossman and Hart 1980; Shleifer and Vishny 1986). The third reason is thatdomestic institutional investors have less of an arm’s-length relation with lo-cal corporations. This implies that domestic institutional money managers aremore likely to have business ties to local corporations, to share the benefitsof control, and to be more sympathetic to incumbent management (Gillan andStarks 2003; Stulz 2005; Davis and Kim 2007). In contrast, foreign institutions,less encumbered by ties with management or by private benefits, can act as fa-cilitators to foreign takeover bids. These arguments suggest that the presenceof foreign institutions should make a transaction between firms located in twodifferent countries more likely.
3 The home-bias literature suggests that investors allocate too little of their portfolios to international stocks(French and Poterba 1991; Lewis 1999; Karolyi and Stulz 2003). Corporate internationalization could substitutefor investors’ international portfolio diversification. However, empirical evidence on the shareholder valuebenefits of international diversification at the corporate level is mixed (Agmon and Lessard 1977; Errunza andSenbet 1984; Fatemi 1984; Doukas and Travlos 1988; Morck and Yeung 1991; Denis, Denis, and Yost 2002).
603

To test these hypotheses, we use a comprehensive data set of internationalinstitutional equity holdings over the 2000–2005 period. This data set includesholdings at the investor-stock level of over 5300 institutions in 26 countries,with positions totaling US$18 trillion as of December 2005. The sample ofM&As includes 3631 completed transactions, of which close to 22% are cross-border deals.
We find that cross-border M&As are more likely to occur in countries whereforeign institutions hold a higher fraction of the local stock market. Previousstudies on cross-border M&As focus on country-level governance aspects.Rossi and Volpin (2004) find that targets in cross-border M&A deals are morefrequently from countries with weaker investor protection than their acquirers’country, suggesting a convergence in governance standards. Starks and Wei(2004) and Bris and Cabolis (2008) find a higher takeover premium wheninvestor protection in the acquirer’s country is stronger than in the target’scountry. Even when we take into account factors such as legal environment andeconomic development, which are major determinants of cross-border M&Apatterns, we still find that foreign institutional ownership significantly increasesthe probability that a local firm will be targeted by a foreign bidder. This effectis economically significant; a 10 percentage point increase in foreign ownershipwould double the fraction of cross-border M&As (relative to the total numberof M&As in a country).
We also use bilateral data on M&As and portfolio investment by formingpairs of bidder and target countries to test our hypotheses. We find that own-ership by institutions from the bidder country in the target country facilitatesbilateral M&A deals. This provides direct evidence of the facilitation roleplayed by institutions when the nationality of the shareholders in the target co-incides with the nationality of the bidders. The results are robust to the potentialendogeneity of institutional ownership using instrumental variables methods.We also use a quasi-natural experiment—the revision of the MSCI World indexcountry weights implemented in 2002—that gives an exogenous variation ininstitutional ownership not directly related with M&A activity.
Next, we investigate how country-level governance characteristics interactwith foreign institutions in determining cross-border M&A patterns. We findthat the effect of foreign institutional ownership in cross-border M&A activ-ity is more pronounced in countries with weaker legal institutions, with lowershareholder protection, and in less developed markets. These findings suggestsome substitutability between country-level governance and foreign institu-tional investors.
In the final section, we examine cross-border M&As at the deal level,focusing directly on the presence of foreign institutions in the target andacquirer firms. We find that a larger presence of foreign institutions in the targetfirm, as well as in the acquirer, is positively associated with the likelihood thata bid is cross-border. Domestic institutional ownership does not have a similareffect. We also find evidence that foreign institutions make it more likely
604
The Review of Financial Studies / v 23 n 2 2010

Institutional Investors and Cross-Border Mergers and Acquisitions
that a cross-border deal is successfully completed and that the bidder takesover all the shares of the target, thereby changing the nationality of the target.These results support the hypothesis that foreign institutional investors act asfacilitators in cross-border M&As, effectively building bridges between firmsinternationally.
To complete our analysis, we investigate cross-border M&A announcementreturns. We test whether foreign ownership induces value creation in interna-tional M&As by looking into the combined returns of target and acquirer firms,as well as the returns earned by different investor groups. International investorsthat hold stocks in both target and acquirer firms seem to be compensated withpositive abnormal returns in cross-border deals. Moreover, the combined returnis positively associated with foreign institutional ownership in the target andacquirer firms, and the split of the gain between acquirer and target is relatedto the differential stake of foreign institutions in the acquirer versus the target.Overall, we find that cross-border M&As with a higher presence of foreigninstitutions as shareholders generate more economic gains.
The importance of institutional investors around the world has not goneunnoticed in the academic literature. Gillan and Starks (2003) and Ferreira andMatos (2008) argue that foreign institutional investors play a special governancerole in corporations worldwide, as they drive up firm valuation and performanceand reduce capital expenditures. Their results show that foreign institutionsare able to exert pressure because they have fewer business relations withthe firm to jeopardize, unlike domestic institutions. Our findings offer moredirect evidence of the foreign institutional investors’ role in firm governanceby facilitating cross-border M&A transactions. This complements a number ofstudies examining the role of institutions in M&As in the US takeover market(Stulz, Walkling, and Song 1990; Ambrose and Megginson 1992; Gaspar,Massa, and Matos 2005; Chen, Harford, and Li 2007). To our knowledge, ourpaper is the first to study the importance of corporate ownership structures incross-border M&As, in particular the role of institutional investors.
The remainder of the paper is organized as follows. Section 1 presents theinstitutional holdings data set and the sample of M&A events. In Section2, we conduct country-level tests of the relation between cross-border M&Aactivity and institutional ownership. Section 3 discusses country-pair tests usingbilateral data on M&A transactions and institutional portfolio investment. InSection 4, deal-level tests are discussed. Section 5 concludes and discusses theimplications of our findings.
1. Data
Table 1 provides variable definitions and data sources. Our sample starts withall firms in the Datastream/WorldScope database in the 2000–2005 period.The first two columns of Table 2 present the number and market capitalization
605

Table 1Description of the variables
Variable Description
Panel A: Country-level M&A variablesVolume of M&A Number of listed firms targeted in M&A as a percentage of the total number of listed firms (SDC).Cross-border M&A ratio Number of cross-border M&As (with a foreign acquirer) as a percentage of the number of deals that target a country’s firms (SDC).Cross-border M&A pair Number of deals in which the target is from country i and the acquirer is from country j (i �= j) as a percentage of the total number of deals
with target firm from country i (SDC).
Panel B: Country-level institutional ownership variablesForeign institutional ownership Stock holdings in country i by institutions domiciled in a country different from country i where the firm is incorporated as a percentage of the
market capitalization of country i (FactSet).Domestic institutional ownership Stock holdings in country i by institutions domiciled in the same country i where the firm is incorporated as a percentage of the market
capitalization of country i (FactSet).Foreign institutional blockholders Stock holdings in country i above 5% of a firm’s market capitalization by institutions domiciled in a country different from country i where the
firm is incorporated as a percentage of the market capitalization of country i (FactSet).Foreign-to-domestic institutional
ownership ratioHoldings (end-of-year) by institutions domiciled in a different country from country i where the stock is issued relative to holdings by institutions
domiciled in country i (FactSet).Acquirer-to-other countries institutional
ownership ratioHoldings (end-of-year) by institutions domiciled in the same country where the acquirer firm is incorporated relative to holdings by institutions
domiciled in countries different from that of the acquirer firm (FactSet).Cross-country institutional ownership Stock holdings in country i (country of target firm) by institutions from country j (country of acquirer firm) as a percentage of market
capitalization of country i (FactSet).
Panel C: Country-level control variablesGDP per capita Gross domestic product per capita in US dollars (WDI).GDP growth Growth rate of gross domestic product in US dollars (WDI).Market return Stock market index return calculated in US dollars (Datastream).Trade/GDP Sum of exports and imports of goods and services as a percentage of gross domestic product (WDI).Common law Dummy variable that equals one when a country has common law legal origin, zero otherwise (La Porta et al. 1998).Antidirector rights Index of shareholder protection (La Porta et al. 1998).Legal Product of the antidirector rights index and the rule of law index (La Porta et al. 1998).Securities law Sum of the disclosure requirements, liability standards, and public enforcement measures (La Porta, Lopez-de-Silanes, and Shleifer (2006).Accounting standards Index of the quality of the accounting reporting (La Porta et al. 1998).Quality of institutions Sum of ICRG political risk subcomponents: corruption, law and order, and bureaucratic quality.Enforcement of insider trading laws Number of years since a country’s first insider trading enforcement case, zero if there has been no enforcement case (Bhattacharya and Daouk
2002).Insider ownership Number of shares held by insiders as a proportion of the number of shares outstanding (average across firms) (WorldScope).Takeover index Index of the friendliness of takeover laws to investors (Nenova 2006).
606
The R
eview of F
inancial Studies / v 23 n 2 2010

InstitutionalInvestorsand
Cross-B
orderM
ergersand
Acquisitions
Market capitalization/GDP Stock market capitalization as a percentage of gross domestic product (World Bank).Stock market turnover Stock market trading volume as a percentage of market capitalization (Datastream).Firm-specific return variation Median relative firm-specific stock return variation estimated using an international two-factor model for US dollar weekly excess.Same language Dummy variable that equals one when target and acquirer countries share the same official language, zero otherwise (World Factbook).Same region Dummy variable that equals one when target and acquirer countries are from the same region, zero otherwise (World Factbook).Bilateral trade Value of imports by target country i from acquirer country j as a percentage of total imports by target country i (Comstat).Industry structure Measure of industrial structure overlap between target and acquirer countries, defined as the sum of the squared differences in industry (stock
market) weights between country pairs (Datastream).
Panel D: Country-level instrumental variables for institutional ownershipMSCI stocks/Number of stocks Number of firms with shares included in the MSCI World index as a percentage of the total number of stocks (MSCI).US cross-listings/Number of stocks Number of firms with shares cross-listed on US exchanges via ordinary listings and level 2 and 3 ADRs as a percentage of the total number of
stocks (Depositary institutions and stock exchanges).Dividend yield Dividend yield (value-weighted average across stocks) (Datastream).Dividend tax rate Statutory dividend tax rate (OECD).Tax treaty dummy Dummy variable that equals one if there is a tax treaty between country i and country j (Tax Analysts).Stock market liberalization Number of years since a country’s official stock market liberalization (Bekaert and Harvey 2000).Short selling Dummy variable that equals one if short selling is practiced (Bris, Goetzmann, and Zhu 2007).MSCI rebalancing Change in MSCI weight due to the adoption of free float weights, rather than market capitalization weights, effective in 2002 and thereafter, and
zero before 2002 (Hau, Massa, Peress 2006).
Panel E: M&A deal-level variablesCross-border target dummy variable Dummy variable that equals one if a M&A deal is cross-border, and zero otherwise (SDC).Cross-border target–acquirer pairs Dummy variable that equals one if a there is a M&A cross-border deal between a target from country i and an acquirer from country j , and zero
for other countries different from j (SDC).Success dummy variable Dummy variable that equals one if a M&A bid is successful (status is completed), and zero otherwise (SDC).Full control dummy variable Dummy variable that equals one if a M&A bid is for 100% of shares (percentage sought), and zero otherwise (SDC).Cumulative abnormal return Cumulative abnormal return in US dollars in a event window around the deal announcement day measured relative to a two-factor international
market model estimated using a year of prior daily data (Datastream).Combined cumulative abnormal return Combined (market value weighted) target and acquirer cumulative abnormal return in US dollars.Cumulative abnormal return difference
(acquirer–target)Difference between acquirer cumulative abnormal dollar return and target cumulative abnormal dollar return; dollar returns are given by the
product of market capitalization by cumulative abnormal return.Cumulative abnormal return ratio
(acquirer/(target+acquirer))Ratio of acquirer cumulative abnormal dollar return to target plus acquirer cumulative abnormal dollar return (only defined when both target
and acquirer cumulative abnormal returns are positive).
(continued overleaf)607

Table 1(Continued)
Variable Description
Intraindustry M&A Dummy variable that equals one if acquirer and target firms are in the same one-digit SIC industry (Datastream).Cash-only dummy variable Dummy variable that equals one if the method of payment used in a M&A transaction is only cash (SDC).
Panel F: Firm-level institutional ownership variablesForeign institutional ownership Stock holdings by institutions domiciled in a country different from country i where the firm is incorporated as a percentage of the market
capitalization (FactSet).Domestic institutional ownership Stock holdings by institutions domiciled in the same country i where the firm is incorporated as a percentage of the market capitalization
(FactSet).Foreign institutional ownership
blockholdersStock holdings above 5% of a firm’s market capitalization by institutions domiciled in a country different from country i where the firm is
incorporated as a percentage of the market capitalization (FactSet).Foreign-to-domestic institutional
ownership ratioHoldings (end-of-year) by institutions domiciled in a country different from country i where the stock is issued relative to holdings by institutions
domiciled in country i (FactSet).Acquirer-to-other countries institutional
ownership ratioHoldings (end-of-year) by institutions domiciled in the same country where the acquirer firm is incorporated relative to holdings by institutions
domiciled in countries different from that of the acquirer firm (FactSet).Other countries-to-total institutional
ownership ratioHoldings (end-of-year) by institutions domiciled in other countries different from where acquirer or target firms are incorporated relative to
holdings by all institutions (FactSet).Cross-country institutional ownership
(i, j) targetHoldings (end-of-year) by institutions from country j (country of acquirer firm) in the target firm as a percentage of the target market capitalization
(FactSet).Cross-country institutional ownership
(i, j) acquirerHoldings (end-of-year) by institutions from country i (country of target firm) in the acquirer firm as a percentage of the acquirer market
capitalization (FactSet).Foreign institutional ownership
difference (acquirer–target)Difference between acquirer foreign institutional dollar ownership and target foreign institutional dollar ownership (FactSet).
Foreign institutional ownership ratio(acquirer/(target+acquirer))
Ratio of acquirer foreign institutional dollar ownership to acquirer plus target institutional dollar ownership (FactSet).
Panel G: Firm-level control variablesSize (log) Market capitalization in US dollars (WorldScope item 08001).Book-to-market (log) Book-to-market equity ratio defined as market value of equity (WorldScope 08001) divided by book value of equity (WorldScope item 03501).Investment opportunities Two-year geometric average of annual growth rate in net sales in US dollars (WorldScope 01001).Stock return Stock return (Datastream item RI).Return-on-equity Return-on-equity (WorldScope item 08301).Leverage Ratio of total debt (WorldScope item 03255) to total assets (WorldScope item 02999).Cash Ratio of cash and short term investments (WorldScope item 02001) to total assets (WorldScope item 02999).Share turnover Stock market trading volume defined as number of shares traded (Datastream item UVO) divided by number of shares outstanding (Datastream
item NOSH).
608
The R
eview of F
inancial Studies / v 23 n 2 2010

InstitutionalInvestorsand
Cross-B
orderM
ergersand
Acquisitions
Foreign sales Foreign net sales (WorldScope item 07101) as a proportion of total net sales (WorldScope 01001).Insider ownership Number of shares held by insiders as a proportion of the number of shares outstanding (WorldScope item 08021).Governance score Corporate governance score (ISS).
Panel H: Firm-level instrumental variables for institutional ownershipMSCI Dummy variable that equals one if a firm’s shares are included in the MSCI World index (MSCI).US cross-listing Dummy variable that equals one if a firm’s shares are cross-listed on US exchanges via ordinary listings and level 2 and 3 ADRs (Depositary
institutions and stock exchanges).Dividend yield Dividend yield (WorldScope item 09404).Dividend tax rate Statutory dividend tax rate of a firm’s country (OECD).Number of tax treaties Number of dividend tax treaties of a firm’s country with all other countries (Tax Analysts).Stock market liberalization Number of years since a firm’s country’s official stock market liberalization (Bekaert and Harvey 2000).Short selling Dummy variable that equals one if short selling is practiced in a firm’s country (Bris, Goetzmann, and Zhu 2007).
Country-level data items are measured at the annual frequency. Firm-level items are measured at the year-end (or quarter-end for ownership) prior to the deal announcement.
609
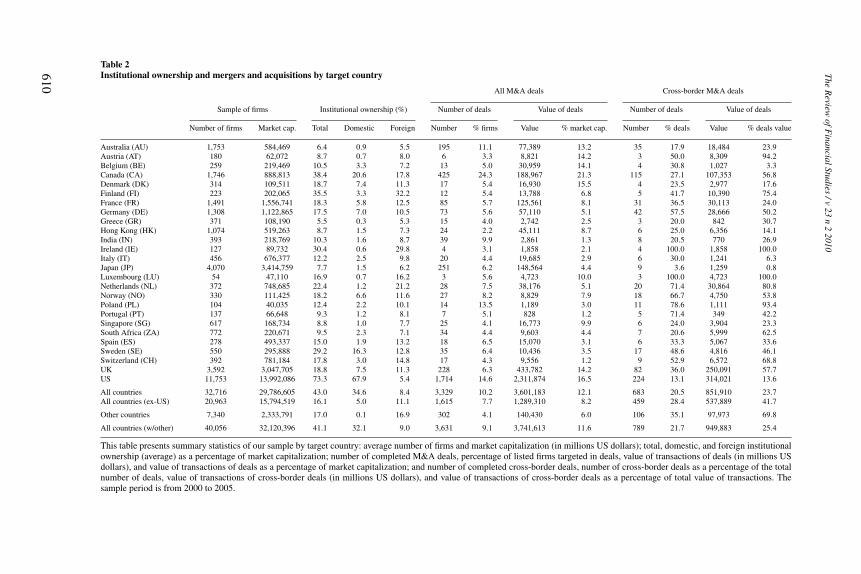
Table 2Institutional ownership and mergers and acquisitions by target country
All M&A deals Cross-border M&A deals
Sample of firms Institutional ownership (%) Number of deals Value of deals Number of deals Value of deals
Number of firms Market cap. Total Domestic Foreign Number % firms Value % market cap. Number % deals Value % deals value
Australia (AU) 1,753 584,469 6.4 0.9 5.5 195 11.1 77,389 13.2 35 17.9 18,484 23.9Austria (AT) 180 62,072 8.7 0.7 8.0 6 3.3 8,821 14.2 3 50.0 8,309 94.2Belgium (BE) 259 219,469 10.5 3.3 7.2 13 5.0 30,959 14.1 4 30.8 1,027 3.3Canada (CA) 1,746 888,813 38.4 20.6 17.8 425 24.3 188,967 21.3 115 27.1 107,353 56.8Denmark (DK) 314 109,511 18.7 7.4 11.3 17 5.4 16,930 15.5 4 23.5 2,977 17.6Finland (FI) 223 202,065 35.5 3.3 32.2 12 5.4 13,788 6.8 5 41.7 10,390 75.4France (FR) 1,491 1,556,741 18.3 5.8 12.5 85 5.7 125,561 8.1 31 36.5 30,113 24.0Germany (DE) 1,308 1,122,865 17.5 7.0 10.5 73 5.6 57,110 5.1 42 57.5 28,666 50.2Greece (GR) 371 108,190 5.5 0.3 5.3 15 4.0 2,742 2.5 3 20.0 842 30.7Hong Kong (HK) 1,074 519,263 8.7 1.5 7.3 24 2.2 45,111 8.7 6 25.0 6,356 14.1India (IN) 393 218,769 10.3 1.6 8.7 39 9.9 2,861 1.3 8 20.5 770 26.9Ireland (IE) 127 89,732 30.4 0.6 29.8 4 3.1 1,858 2.1 4 100.0 1,858 100.0Italy (IT) 456 676,377 12.2 2.5 9.8 20 4.4 19,685 2.9 6 30.0 1,241 6.3Japan (JP) 4,070 3,414,759 7.7 1.5 6.2 251 6.2 148,564 4.4 9 3.6 1,259 0.8Luxembourg (LU) 54 47,110 16.9 0.7 16.2 3 5.6 4,723 10.0 3 100.0 4,723 100.0Netherlands (NL) 372 748,685 22.4 1.2 21.2 28 7.5 38,176 5.1 20 71.4 30,864 80.8Norway (NO) 330 111,425 18.2 6.6 11.6 27 8.2 8,829 7.9 18 66.7 4,750 53.8Poland (PL) 104 40,035 12.4 2.2 10.1 14 13.5 1,189 3.0 11 78.6 1,111 93.4Portugal (PT) 137 66,648 9.3 1.2 8.1 7 5.1 828 1.2 5 71.4 349 42.2Singapore (SG) 617 168,734 8.8 1.0 7.7 25 4.1 16,773 9.9 6 24.0 3,904 23.3South Africa (ZA) 772 220,671 9.5 2.3 7.1 34 4.4 9,603 4.4 7 20.6 5,999 62.5Spain (ES) 278 493,337 15.0 1.9 13.2 18 6.5 15,070 3.1 6 33.3 5,067 33.6Sweden (SE) 550 295,888 29.2 16.3 12.8 35 6.4 10,436 3.5 17 48.6 4,816 46.1Switzerland (CH) 392 781,184 17.8 3.0 14.8 17 4.3 9,556 1.2 9 52.9 6,572 68.8UK 3,592 3,047,705 18.8 7.5 11.3 228 6.3 433,782 14.2 82 36.0 250,091 57.7US 11,753 13,992,086 73.3 67.9 5.4 1,714 14.6 2,311,874 16.5 224 13.1 314,021 13.6
All countries 32,716 29,786,605 43.0 34.6 8.4 3,329 10.2 3,601,183 12.1 683 20.5 851,910 23.7All countries (ex-US) 20,963 15,794,519 16.1 5.0 11.1 1,615 7.7 1,289,310 8.2 459 28.4 537,889 41.7
Other countries 7,340 2,333,791 17.0 0.1 16.9 302 4.1 140,430 6.0 106 35.1 97,973 69.8
All countries (w/other) 40,056 32,120,396 41.1 32.1 9.0 3,631 9.1 3,741,613 11.6 789 21.7 949,883 25.4
This table presents summary statistics of our sample by target country: average number of firms and market capitalization (in millions US dollars); total, domestic, and foreign institutionalownership (average) as a percentage of market capitalization; number of completed M&A deals, percentage of listed firms targeted in deals, value of transactions of deals (in millions USdollars), and value of transactions of deals as a percentage of market capitalization; and number of completed cross-border deals, number of cross-border deals as a percentage of the totalnumber of deals, value of transactions of cross-border deals (in millions US dollars), and value of transactions of cross-border deals as a percentage of total value of transactions. Thesample period is from 2000 to 2005.
610
The R
eview of F
inancial Studies / v 23 n 2 2010

Institutional Investors and Cross-Border Mergers and Acquisitions
of firms by country. There are 40,056 firms overall with an aggregate marketcapitalization of US$32 trillion (sample period averages).
1.1 Institutional investor holdings dataThe institutional investor holdings data are drawn from the FactSet LionSharesGlobal Ownership database, a leading information source for global institu-tional ownership. FactSet compiles institutional ownership from public filingsby investors (such as 13-F filings in the United States), company annual re-ports, stock exchanges, and regulatory agencies around the world. Institutionsare defined as professional money managers, including mutual fund companies,pension funds, bank trusts, and insurance companies.4
We use the historical filings of the FactSet LionShares Global Ownershipdatabase over 2000–2005. We consider all types of stock holdings (commonshares, preferred shares, ADR, GDR, and dual listings). We handle the issueof different reporting frequency by institutions from different countries bygetting the latest holdings update at each year-end. The data cover institutionsin 26 different countries (K ) and stock holdings in 48 destination country stockmarkets (J ).5 This data set offers a unique worldwide K × J panel data (whenaggregated at the country level) for the 2000–2005 period. FactSet providesholdings data by over 5000 institutions on over 35,000 stocks worldwide for atotal market value of US$18 trillion as of December 2005.
Table 2 reports the average fraction of each country’s stock market capital-ization that is held by institutions. Institutional investors are the most prominentin the United States, where over 70% of the US market capitalization is in thehands of institutional money managers.6 Global institutional portfolio managersalso hold high proportions of stock market capitalization in countries such asCanada (38%) and Sweden (29%). Overall, institutional ownership representsover 40% of the total world stock market capitalization in our sample period.7
In many countries, holdings of foreign institutional investors exceed holdingsof local money managers. The extreme case is Finland, where the market is
4 US-based institutions are by far the largest group of professional managers of equity assets. Leading institutionsare fund families (Barclays Global Investors, Capital Research and Management, and Vanguard in the UnitedStates), divisions of banks (Dresdner Bank Investment Management in Germany, Credit Agricole in France, andUBS in Switzerland), insurance companies (AXA in France), and pension funds (Canada Pension Plan or theNorway’s State Petroleum Fund). The top five institutions by country and a more detailed description of the datacan be found in Ferreira and Matos (2008).
5 For a group of 21 other countries (e.g., Argentina, Brazil, China, and Czech Republic), FactSet does not havedomestic institutional holdings coverage but rather only holdings by foreign institutions on local stocks. We donot include these countries in our main tests, although we include them in some robustness tests.
6 Gillan and Starks (2007) report that institutional ownership of US stocks has grown from 10% in the 1950sto over 70% in recent years. For a consistency check, we compare the domestic ownership by US institutionsas reported by Thomson Financial Services (TFS, formerly CDA/Spectrum) 13-F filings used in Gompers andMetrick (2001) with the FactSet holdings. The two databases yield consistent holdings.
7 It is important to note that not all shares are held by institutions, as a significant fraction is closely held by othertypes of blockholders (such as families and banks) in some countries. Correcting for the aggregate percentageof closely held shares, institutional ownership represents roughly 50% of the world market float in our sampleperiod.
611

dominated by a very large-cap, Nokia, that attracts many foreign institutions.Domestic institutions are prevalent in the United States, Canada, and Sweden.8
We use two measures of institutional ownership in our tests:
• Foreign institutional ownership: The percentage of shares held by all insti-tutions domiciled in a country different from the one in which the companyis incorporated.
• Domestic institutional ownership: The percentage of shares held by allinstitutions domiciled in the same country in which the company is incor-porated.
Panel A of Table 3 reports average institutional holdings in the 2000–2005period by stock market destination country (rows) and country of origin ofthe institution (columns). US institutions hold the largest pool of assets, but innon-US stock market destinations, domestic and non-US foreign institutionsalso matter.
Ferreira and Matos (2008) analyze the comprehensiveness and the limitationsof FactSet’s data coverage. While the coverage is somewhat lower than inthe IMF country-level statistics, it is well above the holdings of the mutualfunds segment as used in recent papers (e.g., Chan, Covrig, and Ng 2005;Khorana, Servaes, and Tufano 2005). There are exceptions, however, as inthe case of Asian and Latin American countries where coverage seems tobe better for mutual funds than for other institutions such as pension funds.In terms of cross-border equity holdings, the aggregate values from FactSetLionShares Global Ownership database (in Panel A of Table 3) are comparable(albeit slightly lower) with the equivalent values in the Coordinated PortfolioInvestment Survey (CPIS) conducted by the IMF.9
1.2 Mergers and acquisitions dataOur sample includes all M&As announced between 2000 and 2005, as recordedin the Securities Data Corporation (SDC) Platinum database. We select onlyacquisitions where both target and acquirer firms are publicly listed. FollowingRossi and Volpin (2004) and Bris and Cabolis (2008), we select M&A dealsthat meet the following criteria: (1) the transaction is for the majority of theshares of the target firm (the ownership percentage sought after the deal isabove 50%); and (2) the deal is completed by the end of our sample period.We exclude leveraged buyouts, spin-offs, recapitalizations, self-tender offers,
8 Patterns of domestic and foreign institutional ownership may be explained in part by regulatory constraints.Pension funds, for example, are often subject to “prudent man” rules, which include limits on exposure toequities and foreign investments. A report by the World Bank (2000) finds fewer restrictions on asset allocationin English-speaking countries such as the US and the UK. Restrictions to overseas investments vary considerablyacross countries, from an outright ban (France in the case of insured funds), to limits of 10% (Sweden andCanada) and 30% (Japan and Switzerland), and to no limit (Italy and Netherlands).
9 The slightly lower values can be explained by the fact that FactSet only covers the institutional segment, whileCPIS covers all types of investors.
612
The Review of Financial Studies / v 23 n 2 2010

InstitutionalInvestorsand
Cross-B
orderM
ergersand
Acquisitions
Table 3Cross-country institutional stock holdings and number of mergers and acquisitions
Origin countryDestinationcountry AU AT BE CA DK FI FR DE GR HK IN IE IT JP LU NL NO PL PT SG ZA ES SE CH UK US Total
Panel A: Institutional stock holdingsAU 5 1 1 1 1 1 2 1 5 17 37AT 1 1 2 5BE 7 2 3 1 1 3 4 23CA 183 2 1 1 1 1 7 141 34DK 8 1 1 1 3 5 20FI 1 1 7 4 8 1 1 1 1 3 1 6 35 71FR 5 4 1 1 91 42 3 6 1 4 3 3 3 7 35 72 283DE 3 2 1 1 11 79 2 4 1 3 2 2 2 6 23 50 194GR 1 2 2 6HK 1 1 8 1 1 3 6 18 42IN 1 3 1 2 13 22IE 1 1 2 1 5 16 27IT 1 1 1 6 13 4 17 1 1 1 1 1 2 13 19 82JP 1 7 1 4 12 2 2 5 52 1 3 4 3 1 3 6 33 114 256LU 1 1 4 8NL 3 3 1 1 9 25 1 4 1 9 2 2 2 5 27 70 165NO 1 7 1 3 7 20PL 1 1 1 5PT 1 1 1 2 6SG 1 1 2 2 6 14ZA 5 3 10 20ES 1 1 5 13 1 2 1 1 9 1 2 12 21 72SE 1 1 1 1 1 3 1 1 2 48 1 7 17 85CH 2 3 1 1 4 16 1 3 1 3 2 1 3 23 20 51 136UK 1 5 11 3 2 11 35 1 4 8 1 2 7 8 1 2 9 8 229 217 564US 2 1 8 84 7 1 241 52 18 16 32 4 35 16 1 4 19 21 178 9,502 10,246
Total 8 5 40 306 28 17 395 313 1 16 3 39 70 88 16 74 54 1 2 12 7 25 96 88 628 10,417 12,750
(continued overleaf)613

Table 3(Continued)
Acquirer countryTargetcountry AU AT BE CA DK FI FR DE GR HK IN IE IT JP LU NL NO PL PT SG ZA ES SE CH UK US Other Total
Panel B: Number of mergers and acquisitions (M&A)AU 160 7 1 1 1 5 2 5 9 4 195AT 3 1 2 6BE 9 1 1 1 1 13CA 3 310 1 1 4 2 1 1 2 1 2 16 75 6 425DK 1 13 2 1 17FI 7 1 2 1 1 12FR 2 1 1 54 5 3 2 1 2 2 1 3 2 6 85DE 3 1 1 1 2 31 3 1 2 1 1 3 6 16 1 73GR 1 12 1 1 15HK 18 1 1 1 3 24IN 1 31 1 1 1 2 2 39IE 2 2 4IT 2 14 3 1 20JP 2 1 1 242 3 2 251LU 1 2 3NL 1 4 2 1 1 8 3 1 2 1 4 28NO 1 2 1 1 9 5 1 2 5 27PL 1 1 2 1 3 3 3 14PT 1 2 4 7SG 1 1 1 1 1 19 1 25ZA 1 2 27 4 34ES 1 1 1 12 1 2 18SE 2 1 1 1 1 18 1 2 7 1 35CH 1 2 1 1 1 8 1 2 17UK 6 1 3 3 7 9 2 1 3 3 2 2 1 4 146 32 3 228US 9 3 52 2 6 13 18 3 3 6 4 14 2 1 1 3 6 6 44 1,490 28 1,714Other 8 1 2 6 3 1 11 4 3 1 4 1 1 2 3 1 2 4 2 6 4 2 11 23 196 302
Total 187 10 26 385 26 17 101 78 15 24 37 0 37 253 4 37 16 5 4 30 39 33 47 34 250 1,684 252 3,631
Panel A reports the distribution of the market value of stock holdings (average over the sample period in billions US dollars) by stock market destination country (rows) and institutionorigin country (columns). Panel B reports the distribution of the total number of M&A deals between the target firm country (rows) and acquirer firm country (columns) over the sampleperiod. The sample period is from 2000 to 2005. Refer to Table 2 for full country names.
614
The R
eview of F
inancial Studies / v 23 n 2 2010

Institutional Investors and Cross-Border Mergers and Acquisitions
exchange offers, repurchases, minority stake purchases, and privatizations fromthe sample.
Table 2 shows the level of M&A activity by country of nationality of thetarget firm. The total sample includes 3631 M&A deals. The aggregate volumeof M&A transactions adds up to US$3.7 trillion. M&A volume, defined as thepercentage of the publicly traded firms targeted, is highest in Canada (with24% of firms targeted) and lowest in Hong Kong (with 2% of firms targeted).
Our sample of M&A is fairly diversified geographically. Following Rossi andVolpin (2004), we define the cross-border ratio as the percentage of completeddeals in a country where the acquirer is foreign. Cross-border ratios by targetcountry are presented in Table 2. Firms in Japan and the United States areamong the least targeted by foreign acquirers, with cross-border ratios of 4%and 13%. The last row in Table 2 shows that 789 deals are cross-border (i.e.,22% of the total number of completed deals). In terms of the value of deals,cross-border M&As represent nearly 25% of the total value. Panel B of Table 3presents the number of completed deals for each pair of target country (rows)and acquirer country (columns).
2. Country-Level Analysis
We first present the main results on whether the presence of institutional share-holders in a country is related to local firms being targeted in cross-border deals.We next investigate how country-level governance interacts with foreign insti-tutions in explaining cross-border M&As. Finally, we correct for the potentialendogeneity of institutional ownership.
2.1 Main resultsFigure 1 presents preliminary evidence that cross-border M&As occur morefrequently in countries where foreigners hold a higher fraction of the stockmarket capitalization. This unconditional analysis, however, does not controlfor other factors that may affect cross-border M&A activity, such as local legalinstitutions. To discriminate between the alternative hypotheses, we directlytest the link between foreign institutional ownership and cross-border M&Avolume in multivariate regressions as follows:
(M&A Cross-border Ratio)i,t = α + β(Institutional Ownership)i,t
+ δXi,t + εi,t , (1)
where the dependent variable is the cross-border ratio, i.e., the percentage ofcompleted M&A deals of country i in year t that involve a foreign acquirer rela-tive to all deals targeting firms of country i in year t . Following Petersen (2009),we adopt a specification that allows for heteroscedasticity, cross-correlation,and autocorrelation in the error term. We adjust the t-statistics for heteroscedas-ticity using White standard errors and for within-country correlation using
615

Figure 1Foreign institutional ownership and the incidence of cross-border mergers and acquisitionsThis figure plots the number of cross-border M&A deals as a percentage of the total number of deals versusthe foreign institutional ownership from 26 countries in the 2000–2005 period. Refer to Table 2 for full countrynames.
clustered standard errors. Additionally, we include year fixed effects to ac-count for cross-sectional dependence. We later consider alternative adjustmentmethods that explicitly model dependence in the cross-sectional and serialcorrelation structure of the error terms.
We include several other explanatory variables (X ) in the regressions. First,we control for the level of economic development as proxied by gross domesticproduct (GDP) per capita and GDP average annual real growth rate. We alsocontrol for the local stock market return, as foreign acquisitions can be driven bylocal market valuation waves (Shleifer and Vishny 2003). Second, we controlfor the level of openness of the economy, using trade openness, defined as theratio of exports plus imports to GDP.
Third, we control for laws and institutions as they are major determinantsof the overall level of capital markets development (La Porta et al. 1998) andcross-border M&A patterns in particular. Rossi and Volpin (2004) find thatfirms in countries with weaker investor protection are more frequently targetedin cross-border M&As, suggesting a convergence in governance standards.As indicators of the level of minority shareholder protection, we use severalindexes developed by La Porta et al. (1998): a common law origin dummyvariable, a legal index that combines the antidirector rights index (shareholderprotection) and the quality of law enforcement (rule of law), and an indexof the quality of accounting standards. As an alternative, we use the qualityof institutions as measured by the International Country Risk Guide (ICRG).This variable has been shown to be an important determinant of internationalfinancial integration (Bekaert, Harvey, and Lundblad 2005). An additional
616
The Review of Financial Studies / v 23 n 2 2010

Institutional Investors and Cross-Border Mergers and Acquisitions
important aspect of a legal system is the existence and enforcement of insidertrading laws. Enforcement of insider trading laws can make an emerging marketmore attractive to international investors, as it reduces the risk that local insiderswill trade against them. We use the number of years since a country has firstenforced its insider trading laws taken from Bhattacharya and Daouk (2002).The authors provide evidence of a significant reduction in the cost of equitycapital following the first enforcement of insider trading laws in a country.
Fourth, we control for the importance of insider ownership in a country.Local controlling shareholders may have private benefits of control that wouldmake them less willing to give up their shares and deter takeovers (Stulz 2005).We also control for the friendliness of takeover laws to investors in the targetcountry using the takeover index constructed by Nenova (2006). Finally, wecontrol for specific aspects of financial development in the target country: theimportance of the stock market in the economy (market capitalization/GDP),the level of stock market trading activity and liquidity (stock market turnover),and the extent of informational efficiency of a country’s stock markets proxiedby the firm-specific return variation measure introduced by Morck, Yeung, andYu (2000).
The results are reported in Table 4. Column (1) shows that foreign insti-tutional ownership is positively related to the cross-border M&A ratio, whileColumn (2) shows that domestic institutional ownership is negatively relatedto the cross-border M&A ratio. The coefficient on foreign institutional owner-ship is both statistically significant and economically relevant. A 10 percentagepoint increase in foreign institutional ownership translates into an increase inthe cross-border ratio of 22 percentage points. This is a sizable effect, equiv-alent to doubling the average ratio of cross-border deals for the countries inour sample (20.5%; see Table 2). A strong presence by domestic institutions,however, is actually associated with a lower likelihood that local firms will betargeted by foreign bidders.
Column (3) of Table 4 includes both foreign and domestic institutionalownership as explanatory variables. The estimates here confirm the findings ofColumns (1) and (2); coefficients are barely affected. Results of a Wald test forthe equality of the foreign and domestic institutional ownership coefficients inColumn (3) strongly reject the null hypothesis of equal coefficients.
In Columns (4)–(12) of Table 4, we check the effect of foreign institutionalownership on cross-border M&A activity, controlling for economic develop-ment and growth, trade openness, legal origin and investor protection, qualityof legal institutions and law enforcement, insider ownership, takeover laws,and financial development. The foreign institutional ownership coefficient ispositive and significant in every case. Overall, our findings are consistent withthe facilitation hypothesis and suggest that foreign-based institutions seem tobuild bridges between firms of different countries.
Consistent with Rossi and Volpin (2004), we find significant evidencethat countries with civil legal origin and lower investor protection see more
617

Table 4Country-level analysis of the incidence of cross-border mergers and acquisitions: Country-level analysis
(1) (2) (3) (4) (5) (6) (7) (8) (9) (10) (11) (12)
Foreign institutional ownership 2.231 2.028 2.264 2.269 1.941 2.037 1.814 2.452 1.735 2.172 1.929(3.55) (3.26) (3.54) (3.85) (3.10) (4.10) (2.84) (3.46) (2.40) (3.48) (3.56)
Domestic institutional ownership −0.642 −0.522(−4.62) (−2.76)
GDP per capita (log) 0.003 −0.018 −0.016 0.076 0.043 0.010 0.010 −0.047 −0.021(0.06) (−0.37) (−0.39) (2.65) (0.76) (0.27) (0.14) (−1.29) (−0.52)
GDP growth −1.536 −2.979 1.725 0.579 −0.481 0.758 0.652 0.620 0.052(−0.81) (−1.45) (1.10) (0.49) (−0.26) (0.49) (0.57) (0.42) (0.04)
Market return 0.236 0.291 0.157 0.065 −0.038 0.090 0.194 −0.013 −0.055(0.88) (1.17) (0.73) (0.29) (−0.18) (0.39) (0.81) (−0.06) (−0.26)
Trade/GDP 0.071 0.037(1.18) (1.00)
Common law −0.286 −0.218 −0.120 −0.264 −0.204(−3.65) (−2.59) (−0.52) (−2.81) (−2.66)
Legal −0.007(−2.13)
Accounting standards −0.008(−1.59)
Quality of institutions 0.006(0.19)
Enforcement of insider trading laws −0.014 −0.007(−4.03) (−1.85)
Insider ownership 0.005(2.13)
Takeover index −0.430(−0.80)
Market capitalization/GDP 0.018(0.36)
Stock market turnover −0.195 −0.130(−3.51) (−2.23)
Firm-specific return variation −0.234(−0.42)
Wald test: Foreign IO = Domestic IO 26.100P-value 0.000
Observations 114 114 114 114 114 114 104 114 114 95 114 114R-squared 0.21 0.13 0.27 0.22 0.25 0.36 0.36 0.40 0.39 0.37 0.45 0.49
This table presents estimates of the panel regressions of the ratio of cross-border of M&A by country and year, defined as the number of completed cross-border M&A deals (with a foreignacquirer) in percentage of the number of deals that target a country’s firms. Refer to Table 1 for definitions of variables. The sample period is from 2000 to 2005. Robust t-statistics adjustedfor country clustering are in parentheses.
618
The R
eview of F
inancial Studies / v 23 n 2 2010

Institutional Investors and Cross-Border Mergers and Acquisitions
cross-border deals targeting local firms (Columns (6) and (7)). Furthermore,cross-border M&As occur more often in countries with weak enforcement ofinsider trading laws (see Columns (8) and (12)).
As a robustness check, we study how the size of foreign institutions’ stakesaffects their impact on the international market for corporate control. The resultsare reported in Panel A of Table 5. The specifications in Table 5 use the sameset of control variables as in Column (12) of Table 4.
First, we test for nonlinear effects in the relation between foreign ownershipand cross-border M&As. Foreign institutional ownership is broken into threevariables: low, medium, and high ownership. Low ownership takes the value ofthe foreign ownership if it is in the lowest ownership quartile (i.e., below 6%),and zero otherwise. Medium ownership takes the value of the foreign ownershipif it is in the second and third ownership quartiles, and zero otherwise. Highownership takes the value of the foreign ownership if it is in the highestownership quartile (i.e., above 14%), and zero otherwise. We find that mediumand high foreign institutional ownership are positively associated with cross-border M&As. This supports the idea that foreign institutions need to have asizable stake to facilitate cross-border deals even though moderate positionsseem to be enough to have an influence.
Second, we test for the role of foreign institutional blockholdings. We focuson foreign institutional investors holding more than 5% of the shares outstand-ing (La Porta et al. 1999; Li et al. 2006). The results are reported in the secondcolumn in Panel A of Table 5. There is a positive and significant relationbetween foreign institutions and cross-border M&As. The effect is strongerwhen we consider only these blockholders instead of all foreign institutionalinvestors. This finding is consistent with the importance of blockholders to helpalleviate the free-rider problem (Shleifer and Vishny 1986).
Third, we check the sensitivity of our findings to the definition of the sampleof countries under examination. We want to address the concern that the resultsare potentially driven by US firms and institutions, which are large playersworldwide. We therefore exclude M&As where the target firm is from either theUnited States or Canada. Additionally, we exclude M&As where the acquireris a US firm and exclude US institutions from the construction of the foreigninstitutional ownership variable. We also extend the sample to include 21 othercountries where data coverage is limited to foreign institutional holdings. PanelB of Table 5 presents the results. The results are consistent with the findingsreported so far.10
We then conduct some econometric robustness checks in Panel C of Table 5.We use seemingly unrelated regression (SUR) standard errors to adjust forheteroscedasticity, autocorrelation, and cross-sectional correlation (Bekaert,Harvey, and Lundblad 2005). We also estimate a Tobit model that takes into
10 In untabulated regressions, we obtain consistent results when we exclude US acquirers and US institutions oneat a time.
619

Table 5Country-level analysis of the incidence of cross-border mergers and acquisitions: Additional tests and robustness
Panel A: Institution type Panel B: Sample Panel C: Estimation methods
Non-linear Blocks Exclude Exclude US Exclude US inst. Extended sample SUR standard Tobit Value ofinst. inst. US and Canada and acquirers of countries errors model deals
Foreign institutional ownership 2.291 2.421 3.168 1.026 1.938 1.929 2.315(4.78) (4.73) (2.34) (3.17) (5.56) (5.09) (4.40)
Foreign institutional ownership low (Q1) −0.307(−0.12)
Foreign institutional ownership medium (Q2–Q3) 1.920(1.58)
Foreign institutional ownership high (Q4) 1.691(2.72)
Foreign institutional blockholders 3.001(3.82)
Control variables Yes Yes Yes Yes Yes Yes Yes Yes YesYear dummies Yes Yes Yes Yes Yes Yes Yes YesObservations 114 114 108 102 108 159 114 114 109R-squared 0.50 0.51 0.51 0.49 0.29 0.42 0.35
620
The R
eview of F
inancial Studies / v 23 n 2 2010

InstitutionalInvestorsand
Cross-B
orderM
ergersand
Acquisitions
Panel D: Interactions with country characteristics
Foreign institutionalownership
Country Foreign institutional Country ×characteristics ownership characteristic Country characteristic Observations R-squared
Common law 1.562 −0.379 0.856 114 0.37(2.05) (−2.35) (0.67)
Antidirector rights 2.301 −0.108 −1.653 114 0.32(3.87) (−0.71) (−1.98)
Legal 2.429 −0.008 −0.425 114 0.35(3.42) (−2.77) (−0.65)
Securities law 3.860 −0.109 −1.591 114 0.29(4.48) (−0.66) (−1.65)
Quality of institutions 3.182 0.025 −1.410 114 0.26(5.14) (0.74) (−1.97)
Enforcement of insider trading laws 2.087 −0.009 −1.147 114 0.42(3.63) (−2.44) (−2.08)
Insider ownership 2.698 0.002 2.385 114 0.38(5.32) (0.49) (2.59)
Takeover index 2.468 −0.501 −0.863 95 0.37(3.19) (−2.41) (−1.74)
Market capitalization/GDP 3.674 −0.003 −1.480 114 0.27(4.69) (−0.04) (−2.15)
Stock market turnover 3.394 −0.139 −1.253 114 0.35(4.60) (−2.10) (−2.04)
Firm-specific return variation 3.099 −0.940 −1.314 114 0.32(6.53) (−1.40) (−1.98)
This table presents estimates of the panel regressions of the ratio of cross-border M&As by country and year, defined as the number of completed cross-border M&A deals (with a foreignacquirer) in percentage of the number of deals that target a country’s firms. Panel A uses alternative foreign institutional ownership variables: nonlinear specification using low (takes thevalue of the foreign ownership if it is in the lowest ownership quartile, and zero otherwise), medium (takes the value of the foreign ownership if it is in the second and third ownershipquartiles, and zero otherwise), and high (takes the value of the foreign ownership if it is in the highest ownership quartile, and zero otherwise) foreign institutional ownership; and foreignblockholders ownership (holdings above 5% of a firm’s market capitalization). Panel B uses alternative samples: exclude M&A deals that involve target firms from the United States; excludeM&A deals that involve target firms from the United States and Canada; exclude M&A deals that involve acquirer firms from the United States and foreign ownership by US institutions;and extend the sample to include 21 other countries where data coverage is limited to foreign institutional holdings. Panel C uses alternative estimation methods: seemingly unrelatedregression (SUR) standard errors, Tobit model, and value of transactions of cross-border deals (relative to total value of transactions) as dependent variable. Panel D presents specificationswith interaction of foreign institutional ownership with country characteristics using dummy variables that equal one for values above the median. Regressions include the control variables(coefficients not shown) used in Column (12) of Table 4 and year dummies. Refer to Table 1 for definitions of variables. The sample period is from 2000 to 2005. Robust t-statistics adjustedfor country clustering are in parentheses (with exception of SUR standard errors and Tobit model).
621
account that the dependent variable is bounded between zero and one. Fi-nally, we reestimate our main specifications using the value of transactions ofcross-border M&As (as a percentage of the total value of transactions) as thedependent variable, rather than the number of cross-border deals. These resultsare consistent with the findings reported so far.
2.2 Effect of country-specific characteristicsIn this section, we investigate under which conditions foreign institutions aremore effective in facilitating cross-border M&As. Our hypotheses offer testablepredictions as to which country characteristics make institutions more pivotalin the working of the international market for corporate control.
We expect to find that foreign institutions play a stronger role in coun-tries with both weaker legal environments and less developed equity markets,where investors face higher transaction costs and information asymmetry. Toinvestigate this issue, we interact foreign institutional ownership with legalorigin, minority shareholder protection (antidirector rights), securities law (LaPorta, Lopez-de-Silanes, and Shleifer 2006), quality of institutions, and lawenforcement. The results are reported in Panel D of Table 5. Foreign investorsare more effective facilitators in countries with lower shareholder protections,lower quality of institutions and securities law, and less stringent law enforce-ment. However, legal origin per se does not seem to be a key factor. Over-all, the evidence suggests that country-level governance and foreign investorsare substitute mechanisms in facilitating changes of corporate control acrossborders.
We also consider interactions of foreign institutional ownership with insiderownership and takeover regulations. Foreign institutions facilitate internationaltakeovers more when there are large local controlling shareholders and incountries with less investor-friendly takeover regulations. All these findingsare consistent with the facilitation hypothesis.
Finally, we consider the interaction of foreign institutional ownership withmeasures of stock market development and informational efficiency. The coef-ficient on the interactions with stock market turnover and firm-specific returnvariation is negative and significant. This suggests that foreign institutions facil-itate more cross-border M&As in countries with less developed stock markets,where trading activity and informational efficiency are lower. These findingsare consistent with the hypothesis that foreign institutions are more effectivein facilitating cross-border M&As in environments with higher transaction andliquidity costs.
2.3 EndogeneityA major concern with our findings is that institutional ownership is endoge-nously determined. Indeed, a market that has a more active market for corporatecontrol may attract foreign institutional investors. To address the potential en-dogeneity bias, we use a two-stage least squares (2SLS) estimation, as well as
622
The Review of Financial Studies / v 23 n 2 2010

Institutional Investors and Cross-Border Mergers and Acquisitions
a quasi-natural experiment that gives an exogenous variation in foreign institu-tional ownership (not directly related to cross-border M&As) and a regressionin changes.
The instrumental variables method allows us to address omitted variables andreverse causality issues simultaneously. The caveat is that it requires strongerassumptions that are usually not possible to test. Under standard identificationassumptions, we apply 2SLS methods to isolate the effect of institutional own-ership on cross-border M&As activity. To this end, we need instruments forthe level of institutional ownership in a country: a variable that is correlatedwith institutional ownership (this assumption can be tested), but uncorrelatedwith M&A except indirectly through other independent variables. That is, theinstrument should be a variable that can be “excluded” from the original list ofcontrol variables without affecting the results. This last requirement cannot betested by statistical methods; it is, in the end, an act of faith.
We use several instrumental variables for institutional ownership. First, weuse the percentage of firms in the target country whose shares are included inthe Morgan Stanley Capital International (MSCI) World index. Ferreira andMatos (2008) show that a greater representation in the index drives investmentby foreigners. Second, we use the percentage of firms in the target countrythat have shares cross-listed in a US exchange (via ordinary listings or level2 and 3 ADRs). Cross-listing has been shown to increase holdings by foreigninvestors. Third, we use the average (value-weighted across stocks in the coun-try) dividend yield of the firms in the target country. Dividend yield has beenshown to be negatively related to the interest of foreigners in holding sharesbecause of the disadvantages associated with dividend tax withholding. Alongthe same line, we also use the statutory dividend tax rate of the target country.Fourth, we use the time (number of years) since the official liberalization ofa country’s stock market. Bekaert and Harvey (2000) show that stock marketliberalization is an important determinant of foreign portfolio flows. Finally,we use a dummy variable equal to one if short selling is allowed in the targetcountry and zero otherwise (Bris, Goetzmann, and Zhu 2007).
The results are reported in Panel A of Table 6. The first-stage regressionprovides evidence on the quality of the instruments. As expected, foreign in-stitutional investors are attracted to countries with more stocks representedin MSCI indices and cross-listed on US exchanges, countries with low div-idend yields, and countries with financially integrated stock markets. Thesefindings suggest that our instruments meet the first condition to be an appropri-ate instrument (i.e., they are related to the potentially endogenous explanatoryvariable). Still, they may also be correlated with the dependent variable in themain regression. To test for this possibility, Table 6 also reports the results ofa Hansen overidentification test. This test shows that these variables do notdirectly impact the volume of M&As through a channel different from theirimpact on institutional ownership. Overall, the findings of the second-stageregression confirm that there is a positive relation between the incidence of
623

Table 6Country-level analysis of the incidence of cross-border mergers and acquisitions: Endogeneity
Panel A: 2SLSPanel B: MSCI
First stage Second stage rebalacing Panel C: Changes
Foreign inst. Cross-border Cross-border Cross-borderDependent variable ownership ratio ratio changes ratio changes
Foreign institutional ownership 1.835(3.46)
MSCI rebalancing 0.540(2.36)
Change in foreign institutional ownership 4.585(2.10)
Change in domestic institutional ownership −2.445(−1.42)
GDP per capita (log) −0.007 −0.052 0.011 −0.013(−0.20) (−0.34) (0.34) (−0.53)
GDP growth −0.573 −1.035 1.892 0.281(−1.20) (−0.53) (1.06) (0.09)
Market return −0.027 −0.201 0.068 −0.162(−0.38) (−0.89) (0.67) (−1.11)
Trade/GDP 0.024 0.180 0.053 −0.005(1.17) (1.79) (1.57) (−0.11)
Common law 0.008 −0.123 −0.077 −0.046(0.53) (−1.80) (−1.06) (−0.65)
Enforcement of insider trading laws 0.002 −0.007 −0.002 0.000(2.13) (−2.02) (−0.80) (−0.07)
Stock market turnover −0.040 −0.048 0.050 −0.141(−2.08) (−0.66) (0.62) (−1.44)
MSCI stocks/Number of stocks 1.096(3.65)
US cross-listings/Number of stocks 0.810(6.29)
Dividend yield −2.651(−2.54)
Dividend tax rate 0.124(2.20)
Stock market liberalization 0.005(2.17)
Short selling −0.120(−2.40)
Hansen J -statistic 2.804P-value 0.730
Year dummies Yes Yes Yes YesObservations 93 93 67 67R-squared 0.74 0.12 0.17
Panel A presents 2SLS estimates of the regression of the ratio of cross-border M&As by country and year, definedas the number of completed cross-border M&A deals (with a foreign acquirer) in percentage of the number ofdeals that target a country’s firms. The instruments for institutional ownership are the percentage of firms withshares included in the MSCI World index, the percentage of firms with shares cross-listed on US exchanges,dividend yield (value-weighted average), the statutory dividend tax rate, the time since the official liberalizationof a country’s stock market, and a dummy variable equal to one if short selling is practiced. Panel B presentsestimates of the regression of the annual changes in the cross-border ratio on the MSCI rebalancing variable,defined as the change in a country’s MSCI weight due to the adoption of free-float weights effective in 2002and thereafter, and zero before 2002. Panel C presents estimates of the regression of the annual changes in thecross-border ratio on the annual changes in institutional ownership. Refer to Table 1 for definitions of variables.The sample period is from 2000 to 2005. Robust t-statistics adjusted for country clustering are in parentheses.
624
The Review of Financial Studies / v 23 n 2 2010

Institutional Investors and Cross-Border Mergers and Acquisitions
cross-border M&As and foreign institutional ownership, even after we controlfor the potential endogeneity of institutional ownership.
As a further check, we consider a quasi-natural experiment: the revision ofthe MSCI World index country weights implemented in 2001–2002; see Hau,Massa, and Peress (2006) for details. MSCI is a leading provider of the inter-national equity benchmarks that are widely used by institutional investors.11
In 2001, MSCI reviewed its weighting policy by moving from market capital-ization weights to free-float weights. This rebalancing affected a total of 2566stocks in 50 countries. Such a weight revision represents an index change ofunprecedented scope, and provides cross-sectional power to identify an ex-ogenous change in foreign institutional ownership not likely to directly affectcross-border M&A activity, except through the channel of foreign institutionalownership.
To run this experiment, we construct a variable (MSCI rebalancing) thattakes a value of zero before the implementation year (2002) and then takesthe value of the specific change in each country’s MSCI weight in the imple-mentation year and thereafter. This MSCI rebalancing variable proxies for theexogenous change in foreign institutional ownership due to a country-specificMSCI weight revision. We then regress changes in the cross-border ratio onthe MSCI rebalancing variable, as well as other control variables. The resultsare reported in Panel B of Table 6. The change in the cross-border M&A ratiois positively related to the change in the MSCI weight affecting each coun-try, as predicted if foreign institutions drive cross-border M&As. This naturalexperiment gives further support to our primary findings.
A further potential concern with our results is that the estimated positiverelation between the cross-border ratio and foreign institutional ownership maybe spurious due to a common positive trend in both series. This is potentiallyan issue, given that our sample period is characterized by a spurt in financialglobalization that could be driving both portfolio investment and cross-borderM&A transactions. To address this issue, we estimate a specification based on(annual) changes rather than levels as in Table 4. Panel C of Table 6 reports theresults of regressing annual changes in the cross-border ratio on annual changesin foreign institutional ownership. The results confirm our previous findings,reducing the concerns of spurious correlation. Indeed, there is a positive relationbetween the annual changes in the cross-border ratio and the annual changesin foreign institutional ownership. No similar effect is found for changes indomestic institutional ownership.
3. Country-Pairs Analysis
The richness of our data set allows us to directly test our hypotheses usingbilateral (cross-border) M&A activity and portfolio investment. For example,
11 According to several surveys (e.g., Thomson Extel Pan-European survey and Global Equities Study), 90% ofinternational institutional equity assets are benchmarked to MSCI indices.
625

in the case of the Mannesmann takeover, 18% of Mannesmann shares wereheld by institutions from the UK (Kedia 2001). Do UK firms (like Vodafone)find it easier to target German firms (like Mannesmann) if UK investors arealready shareholders in that foreign market?
To test this hypothesis, we exploit the power of our data and combine the(26 × 26) matrix of cross-border M&A with the corresponding (26 × 26) pairsof bilateral portfolio investment by institutions. We focus exclusively on cross-border M&As and do not include the main diagonal (intraborder M&A) in thetests. The country-pair regression equation is
(Cross-border M&A)i, j,t = α + β(Cross-country institutional ownership)i, j,t
+ δXi, j,t + εi, j,t , (2)
where the dependent variable is the number of deals in which the target isfrom country i and the acquirer is from country j as a percentage of the totalnumber of deals with a target in country i (sum of row) in year t , with i �= j .(Cross-country institutional ownership)i, j,t is the percentage of the marketcapitalization of the country of the target firm i (destination stock market)that is held by institutions based in the same country as the acquirer firm j(institution origin country) in year t . The facilitation hypothesis posits thatthe effect of institutional ownership (the β coefficient) will be positive. Weinclude other regressors (X ) such as the difference in economic developmentand stock market returns between country j and country i (Rossi and Volpin2004). We add two dummy variables to control for proximity and familiaritymotives in cross-border deals (common language and same geographic region).We control for the degree of economic integration by using the level of bilateraltrade and the difference in industry structures between countries. Finally, wetake into account differences in investor protection, legal environment, andfinancial development.
Table 7 presents the results. The country-pair institutional ownership coef-ficient is positive and significant. A one-percentage-point increase in institu-tional ownership between a country-pair is associated with an increase in thefrequency of cross-border deals between a country-pair of roughly 1.3 percent-age points (Column (1)). This evidence supports the hypothesis that there aremore cross-border corporate transactions if there is already portfolio investmentbetween a country-pair. This is direct evidence of a link between the nationalityof the bidder and the country of origin of the institution that is a shareholder inthe target firm.
Specifications in Columns (2)–(9) of Table 7 control for the other factors thatmay explain the volume of M&A activity between two countries. There is someevidence of greater M&A activity between countries in the same geographicregion, with similar industrial structures, and more economically integrated(as proxied by bilateral trade). There is also greater bilateral M&A activitywhen the target country has a weaker legal environment than the acquirer
626
The Review of Financial Studies / v 23 n 2 2010

InstitutionalInvestorsand
Cross-B
orderM
ergersand
Acquisitions
Table 7Country-pairs analysis of the incidence of cross-border mergers and acquisitions
(1) (2) (3) (4) (5) (6) (7) (8) (9) (10) (11) (12)
Cross-country institutional ownershipi, j 1.314 1.290 0.941 1.286 1.257 1.465 1.203 1.246 0.866 1.372 0.966 0.101(3.71) (3.63) (2.15) (3.62) (3.58) (5.73) (3.32) (3.55) (1.99) (4.15) (1.83) (0.19)
GDP per capita j − GDP per capitai (log) 0.001 0.001 0.001 0.001 0.001 0.001 0.001 0.001 0.001 0.001 0.001(1.37) (1.16) (1.42) (1.25) (0.95) (0.80) (1.66) (1.23) (0.75) (0.96) (1.17)
Market return j − Market returni 0.003 0.004 0.002 0.003 0.007 0.004 0.010 0.009 0.010 0.009 0.009(0.37) (0.63) (0.29) (0.36) (0.95) (0.50) (1.17) (1.07) (1.17) (1.10) (1.14)
Same language 0.004 0.001 0.004 0.005 0.003 0.005 0.005 0.002 0.007 0.001 0.003(0.93) (0.33) (0.91) (1.06) (0.76) (1.08) (0.98) (0.48) (2.13) (0.36) (0.66)
Same region 0.005 0.000 0.006 0.005 0.005 0.005 0.006 0.000 0.000 0.001 0.000(1.79) (0.14) (1.84) (1.63) (1.49) (1.70) (1.92) (0.11) (0.01) (0.37) (0.06)
Bilateral tradei, j 0.170 0.173 0.208 0.246 0.284(1.60) (1.64) (2.25) (2.91) (2.40)
Industry structurei, j −0.001 −0.001 −0.001 −0.001 −0.001(−3.11) (−2.63) (−1.81) (−2.54) (−2.16)
Legal j − Legali 0.000 0.000 0.000 0.000 0.000 0.000(1.78) (0.98) (1.74) (1.50) (1.67) (0.18)
Accounting standards j − Accounting standardsi 0.000(0.59)
Quality of institutions j − Quality of institutionsi 0.000(−0.09)
Enforcement ins. trad. laws j − Enforcement ins. trad. lawsi 0.000(−1.74)
Market capitalization/GDP j − Market capitalization/GDPi 0.000(−0.16)
Stock market turnover j − Stock market turnoveri −0.003 −0.002 −0.002 −0.002 −0.002(−2.58) (−1.98) (−1.70) (−1.95) (−1.84)
Cross-country inst. ownershipi, j × Same language −0.968(−2.29)
Cross-country inst. ownershipi, j × Same region −0.633(−1.70)
Cross-country inst. ownershipi, j × (Legal j − Legali ) 0.040(2.26)
Year dummies Yes Yes Yes Yes Yes Yes Yes Yes Yes Yes Yes YesObservations 2,236 2,150 2,150 2,150 2,150 1,826 2,150 2,150 2,150 2,150 2,150 2,150R-squared 0.10 0.10 0.11 0.10 0.10 0.12 0.10 0.10 0.11 0.12 0.11 0.12
This table presents estimates of panel regressions of cross-border M&A country-pairs in each year, defined as the number of cross-border deals between target firms from country i andacquirer firms from country j as a percentage of the number of deals with target firms from country i . Refer to Table 1 for definitions of variables. The sample period is from 2000 to 2005.Robust t-statistics adjusted for country-pair clustering (with exception of Tobit model) are in parentheses.
627

country. The difference in stock market turnover is negative and significant,which suggests that countries with less developed stock markets attract morecross-border deals.
In Columns (10)–(12) of Table 7, we examine whether cross-country institu-tional investment bridges cultural, geographical, and legal differences betweencountries. We find that ownership by institutions from the acquirer country ismore important in promoting cross-border M&A activity when there are geo-graphical or language barriers and significant differences in the quality of thelegal environment. We conclude that foreign institutions facilitate deals thatinvolve negotiation processes between parties with different regulatory andculture environments.
Table 8 presents several robustness checks of the country-pair tests, similarin spirit to those for the country-level tests. All the regressions include the sameset of control variables used in Column (9) of Table 7. In Panel A, we showthat results are robust to the use of an instrumental variables estimation (2SLS)to address endogeneity concerns. We consider the same set of instruments forthe target country used in Panel A of Table 6, augmented by a new instrumentthat is specific to the country-pair analysis: a dummy variable that takes thevalue of one if there is a tax treaty between countries i and j . A Hansenoveridentification test confirms that these variables do not directly impact thevolume of M&As through a channel different than their impact on institutionalownership.12
Panel A of Table 8 reports only the results of the second-stage regression.There is evidence of a positive relation between cross-country institutionalownership and the volume of M&A deals between a country pair when wecorrect for the endogeneity bias. We also find consistent evidence using therevision of the MSCI weights as a quasi-natural experiment (Panel B) and aregression on annual changes (Panel C). In Panels D and E of Table 8, wecheck the results for alternative samples of countries and estimation methods(Tobit model and value of deals). In all cases, we find consistent evidence of apositive and significant relation between cross-country institutional ownershipand cross-border M&As.
4. Deal-Level Analysis
In this section, we use individual M&A transactions (deal-level data) to in-vestigate whether the presence of foreign institutions as shareholders in thetarget and acquirer is an important factor in cross-border M&As. To do this,we merge the sample of M&A deals from SDC with the FactSet LionSharesGlobal Ownership database to obtain firm-level institutional ownership as ofthe quarter-end prior to the deal announcement. The resulting sample con-sists of 2588 M&As with target institutional ownership data (and 22% of
12 We obtain similar results using the difference in instrumental variables between countries i and j .
628
The Review of Financial Studies / v 23 n 2 2010

InstitutionalInvestorsand
Cross-B
orderM
ergersand
Acquisitions
Table 8Country-pairs analysis of the incidence of cross-border mergers and acquisitions: Robustness
Panel D: Sample Panel E: EstimationPanel A: 2SLS Panel B: MSCI Panel C:second stage rebalacing Changes Exclude US Exclude US Exclude US inst. Extended sample Tobit Value ofCross-border Cross-border Cross-border and Canada and acquirers of countries model deals
Dependent variable pair pair changes pair changes Cross-border pair Cross-border pair
Cross-country institutional ownershipi, j 0.866 0.852 0.973 2.074 0.934 2.151 0.973(2.09) (2.12) (2.08) (2.17) (2.33) (3.55) (2.25)
MSCI rebalancingi 0.016(2.04)
Change in institutional ownershipi, j 3.973(2.00)
Hansen J -statistic 7.757P-value 0.260
Control variables Yes Yes Yes Yes Yes Yes Yes Yes YesYear dummies Yes Yes Yes Yes Yes Yes Yes Yes YesObservations 2,150 1,725 1,725 2,000 1,850 1,920 3,440 2,150 2,125R-squared 0.12 0.52 0.11 0.10 0.06 0.12 0.07
This table presents estimates of panel regressions of cross-border M&A country-pairs in each year, defined as the number of cross-border deals between target firms from country i andacquirer firms from country j as a percentage of the number of deals with target firms from country i . Panel A presents 2SLS estimates with the percentage of country i firms with sharesincluded in the MSCI World index, the percentage of country i firms with shares cross-listed on US exchanges, the country i dividend yield (value-weighted average), the country i statutorydividend tax rate, a dummy variable equal to one if there is a tax treaty between countries i and j , and the time since the official liberalization stock market of country i used as instrumentsfor institutional ownership. Panel B presents estimates of the regression of the annual changes in the cross-border M&A country-pairs on the MSCI rebalancing variable, defined as thechange in country i MSCI weight due to the adoption of free float weights effective in 2002 and thereafter, and zero before 2002. Panel C presents estimates of the regression of the annualchanges in the cross-border M&A country-pairs on the annual changes in cross-country institutional ownership. Panel D uses alternative samples: exclude M&A deals that involve targetfirms from the United States; exclude M&A deals that involve target firms from the United States and Canada; exclude M&A deals that involve acquirer firms from the United States andforeign ownership by US institutions; and extend the sample to include 21 other countries where data coverage is limited to foreign institutional holdings. Panel E uses alternative estimationmethods: Tobit model and value of transactions of cross-border deals (relative to total value of transactions) as dependent variable. Regressions include the control variables (coefficientsnot shown) used in Column (9) of Table 7. Refer to Table 1 for definitions of variables. The sample period is from 2000 to 2005. Robust t-statistics adjusted for country-pair clustering(with exception of Tobit model) are in parentheses.
629

these M&As are cross-border deals), and 1432 M&As with both target andacquirer institutional ownership data. Firm-level accounting and financial vari-ables (as of the year-end prior to the deal announcement) are drawn from theDatastream/WorldScope database. Panels E–H of Table 1 offer details on thedefinitions of variables and data sources.
4.1 Probability of cross-border M&AsWe use a probit regression to examine whether the presence of foreign institu-tions makes it more likely that an M&A deal will be cross-border:
Prob(Deal is Cross-border)i,t = α + β(Institutional Ownership)i,t
+ δXi,t + εi,t , (3)
where the dependent variable is a dummy that takes a value of one if the M&Ais cross-border, and zero if it is domestic (intraborder).
We first estimate regression equation (3) using only target firm explanatoryvariables. Our main interest lies in the sign of the percentage of shares held byinstitutions in the target firm as of the quarter-end prior to the deal announce-ment. We consider both the percentage of shares held by money managers basedin countries different from that of the target (foreign institutional ownership)and the percentage of shares held by money managers domiciled in the samecountry as the target (domestic institutional ownership).13 We control for othercharacteristics of the target firm, such as firm size, growth and investment op-portunities, annual stock returns, profitability, leverage, cash holdings, foreignsales, insider ownership, and firm-level governance scores (from InstitutionalShareholder Services). Following Kang and Kim (2008), we also control forthe potential level of economic synergies by using a dummy variable equal toone if the target firm and acquirer firm are in the same one-digit SIC industry.
Table 9 presents the results of the probit regression. In Column (1), we start bycontrolling just for target firm size and intraindustry M&A dummy, which givesus the greatest number of observations. We find that the fraction held by foreigninvestors positively and significantly affects the probability that a cross-borderbid is made. The presence of domestic investors, however, seems to reduce thechances of a foreign bid (Column (2)). In Column (3), we include both foreignand domestic institutional ownership and run a Wald test of the null hypoth-esis that the coefficients are equal to each other, which is strongly rejected.The effect of foreign institutional ownership is economically sizable: a 10percentage point increase in foreign institutional ownership is associated withnearly a 10% higher chance that the bidder is a foreign firm (see Column (4)).
13 It is important to note that we obtain similar results when we use the target’s foreign institutional ownership definedat any of the four quarter-ends prior to the deal announcement. However, we find no evidence of a significantrelation when we use the target’s foreign institutional ownership one quarter after the deal announcement. Thisprovides some additional evidence of a causal relationship from ownership to M&A. These additional results areavailable upon request.
630
The Review of Financial Studies / v 23 n 2 2010

InstitutionalInvestorsand
Cross-B
orderM
ergersand
Acquisitions
Table 9Deal-level analysis of the probability of being targeted in a cross-border merger and acquisition
(1) (2) (3) (4) (5) (6) (7) (8) (9) (10)
Foreign institutional ownership target 1.153 1.223 2.533 2.457 4.016 1.526 1.471 4.478(3.67) (3.85) (5.05) (4.40) (4.77) (3.57) (3.55) (3.99)
Domestic institutional ownership target −0.294 −0.365 0.142 0.051(−2.11) (−2.88) (1.09) (0.38)
Foreign institutional ownership acquirer 1.706 1.751 1.768(4.84) (4.71) (1.58)
Domestic institutional ownership acquirer −0.674 −0.677(−4.24) (−4.55)
Size target 0.094 0.108 0.098 0.082 0.026 0.078 −0.047 −0.019 −0.046 −0.105(4.58) (4.75) (5.20) (2.79) (0.87) (2.16) (−2.26) (−0.96) (−2.07) (−2.82)
Book-to-market target −0.058 −0.073 −0.067 −0.094(−1.46) (−1.86) (−1.37) (−1.19)
Investment opportunities target 0.045 0.038 −0.444 0.441(0.40) (0.23) (−3.44) (4.42)
Stock return target 0.034 0.170 0.267 0.203(0.42) (2.38) (2.00) (1.14)
Return-on-equity target −0.123 −0.117 −0.262 −0.081(−1.15) (−1.24) (−3.30) (−0.41)
Leverage target −0.017 0.083 −0.761 0.095(−0.08) (0.35) (−2.93) (0.25)
Cash target 0.406 0.473 −0.893 0.507(0.65) (0.82) (−4.65) (0.84)
Share turnover target −0.105 −0.100 −0.056 −0.198(−4.57) (−3.00) (−1.65) (−4.47)
Foreign sales target 0.866(3.07)
Insider ownership target −0.192(−0.88)
Governance score target 0.002(0.43)
(continued overleaf )631

Table 9(Continued)
(1) (2) (3) (4) (5) (6) (7) (8) (9) (10)
Intraindustry M&A −0.048 −0.045 −0.052 −0.015 0.072 −0.076 0.056 0.098 0.048 0.504(−0.55) (−0.53) (−0.60) (−0.08) (0.40) (−0.51) (0.80) (1.53) (0.66) (5.33)
Wald test: Foreign IO target = Domestic IO target 23.470 9.120P-value 0.000 0.003Wald test: Foreign IO acquirer = Domestic IO acquirer 23.210P-value 0.000
Acquirer control variables No No No No No No Yes Yes Yes YesYear dummies Yes Yes Yes Yes Yes Yes Yes Yes Yes YesIndustry dummies Yes Yes Yes Yes Yes Yes Yes Yes Yes YesCountry dummies Yes Yes Yes Yes Yes Yes Yes Yes Yes YesObservations 2,588 2,588 2,588 1,399 1,139 470 1,432 1,432 1,432 612
This table presents the estimates of a deal-level probit model of the likelihood of being targeted in a cross-border M&A where the dependent variable is a dummy variable that equals one ifthe M&A deal is cross-border. Columns (7)–(10) include acquirer control variables (coefficients not shown). Refer to Table 1 for definitions of variables. The sample period is from 2000 to2005. Robust t-statistics adjusted for country clustering are in parentheses.
632
The R
eview of F
inancial Studies / v 23 n 2 2010

Institutional Investors and Cross-Border Mergers and Acquisitions
Overall, the findings are consistent with the facilitation hypothesis and confirmthe country-level evidence.
When we look at the control variable coefficient estimates, we find that largerfirms with strong stock market performance and firms with operations abroad(as proxied by foreign sales) attract more attention from foreign bidders. Ingeneral, the other firm-specific characteristics do not seem to play a significantrole in affecting the probability that a bid will be cross-border.
As an extension, we consider the nationality of the institutional investorsholding a stake in the acquirer firm. The idea is that a firm that already hasforeign shareholders is more likely to bid for a foreign firm.14 We thereforereestimate the probit regression including both target and acquirer characteris-tics (we report coefficients only for target firm control variables, but regressionsinclude similar controls for the acquirer). The results are reported in Columns(7)–(10) of Table 9. The presence of foreign institutional ownership in both tar-get and acquirer increases the likelihood of a cross-border deal, consistent withthe hypothesis that these investors build bridges between firms internationally.There is no similar evidence for domestic institutional ownership.
Again, we address the concern of endogeneity, using instrumental variablesestimation (2SLS). Here, we can use firm-level (target and acquirer) charac-teristics as instruments: (1) a dummy variable for whether a firm’s shares areincluded in the MSCI World index; (2) a dummy variable for whether a firm’sstock is cross-listed on US exchanges (via ordinary listings or level 2 and 3ADRs); (3) the firm’s dividend yield; (4) the statutory dividend tax rate in thefirm’s country; (5) the number of tax treaties linking a firm’s country with othercountries; (6) the time (number of years) since the official liberalization of afirm’s country’s stock market; and (7) a dummy variable on whether short sell-ing is practiced in a firm’s country. Panel A of Table 10 reports the results of thesecond-stage probit model. For brevity, only the coefficients for the ownershipvariables are reported. The Hansen overidentification tests confirm the qual-ity of our instruments.15 The results show that the likelihood of a foreign biddoes, indeed, increase with the level of target and acquirer foreign institutionalownership.
Panels B–D of Table 10 offer further robustness checks. We find that thelikelihood of attracting a foreign bid is positively related to the presence ofmedium to large foreign institutional shareholders, and to the ownership byforeign blockholders. This finding is consistent with the role played by block-holders in alleviating the free-rider problem.
14 One example of this is the 2005 acquisition of HVB—Bayerische Hypo Vereinsbank (a German bank)—byUnicredito (an Italian bank) that allowed the expansion of Unicredito to Central and Eastern Europe where HVBhad a significant presence. Foreign institutions had a significant presence in Unicredito (19% at the time of bid,which was higher than the ownership by domestic institutions) and favored the bank’s geographic expansion.HVB had previously bought Bank Austria Creditanstalt (in 2000), which also had operations in Central Europe.
15 The first-stage regression results are available upon request. We obtain similar results when we run the two-stageprocedure using only target firm explanatory variables and instruments.
633
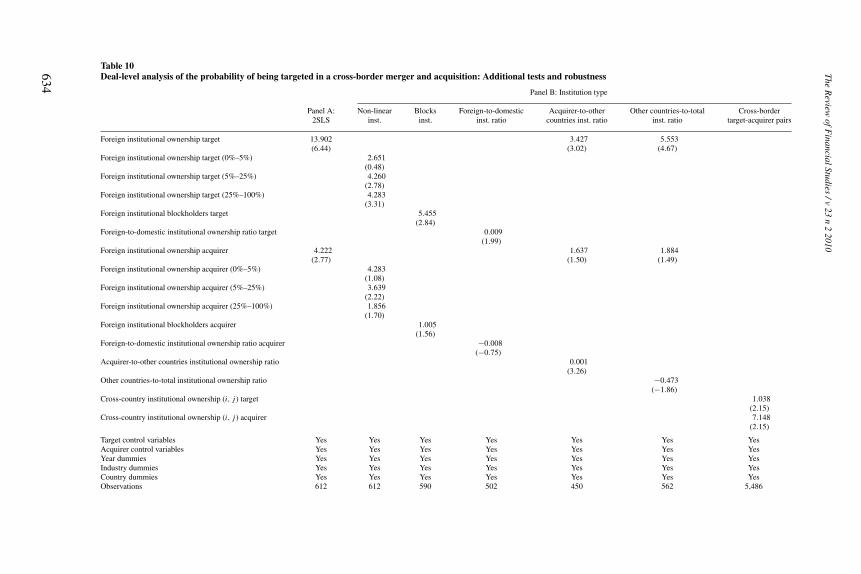
Table 10Deal-level analysis of the probability of being targeted in a cross-border merger and acquisition: Additional tests and robustness
Panel B: Institution type
Panel A: Non-linear Blocks Foreign-to-domestic Acquirer-to-other Other countries-to-total Cross-border2SLS inst. inst. inst. ratio countries inst. ratio inst. ratio target-acquirer pairs
Foreign institutional ownership target 13.902 3.427 5.553(6.44) (3.02) (4.67)
Foreign institutional ownership target (0%–5%) 2.651(0.48)
Foreign institutional ownership target (5%–25%) 4.260(2.78)
Foreign institutional ownership target (25%–100%) 4.283(3.31)
Foreign institutional blockholders target 5.455(2.84)
Foreign-to-domestic institutional ownership ratio target 0.009(1.99)
Foreign institutional ownership acquirer 4.222 1.637 1.884(2.77) (1.50) (1.49)
Foreign institutional ownership acquirer (0%–5%) 4.283(1.08)
Foreign institutional ownership acquirer (5%–25%) 3.639(2.22)
Foreign institutional ownership acquirer (25%–100%) 1.856(1.70)
Foreign institutional blockholders acquirer 1.005(1.56)
Foreign-to-domestic institutional ownership ratio acquirer −0.008(−0.75)
Acquirer-to-other countries institutional ownership ratio 0.001(3.26)
Other countries-to-total institutional ownership ratio −0.473(−1.86)
Cross-country institutional ownership (i, j) target 1.038(2.15)
Cross-country institutional ownership (i, j) acquirer 7.148(2.15)
Target control variables Yes Yes Yes Yes Yes Yes YesAcquirer control variables Yes Yes Yes Yes Yes Yes YesYear dummies Yes Yes Yes Yes Yes Yes YesIndustry dummies Yes Yes Yes Yes Yes Yes YesCountry dummies Yes Yes Yes Yes Yes Yes YesObservations 612 612 590 502 450 562 5,486
634
The R
eview of F
inancial Studies / v 23 n 2 2010

InstitutionalInvestorsand
Cross-B
orderM
ergersand
Acquisitions
Panel C: Sample Panel D: Interactions
Extended sample Investment Share InsiderExclude US of countries Size target opportunities target turnover target ownership target
Foreign institutional ownership target 15.701 5.078 25.585 3.958 7.621 4.143(5.07) (3.02) (4.77) (3.56) (2.98) (1.99)
Characteristic target −0.057 −0.090 −0.175 −0.383(−1.70) (−1.11) (−3.82) (−1.26)
Foreign institutional ownership target × Characteristic target −1.540 2.984 −3.872 5.978(−4.29) (2.01) (−2.03) (2.23)
Foreign institutional ownership acquirer −7.278 1.807(−4.07) (2.36)
Target control variables Yes Yes Yes Yes Yes YesAcquirer control variables Yes Yes Yes Yes Yes YesYear dummies Yes Yes Yes Yes Yes YesIndustry dummies Yes Yes Yes Yes Yes YesCountry dummies Yes Yes Yes Yes Yes YesObservations 264 669 612 612 612 490
This table presents the estimates of a deal-level probit model where the dependent variable is a dummy variable that equals one if the M&A deal is cross-border. PanelA presents estimates of a two-step probit model with a dummy variable that takes the value of one if a firm’s shares are included in the MSCI World index, a dummyvariable that takes the value of one if a firm’s shares are cross-listed on US exchanges, dividend yield, statutory dividend tax rate of a firm’s country, number of taxtreaties linking a firm’s country with other countries, time since the official liberalization of a firm’s country’s stock market, and a dummy variable equal to one ifshort selling is practiced in a firm’s country used as instruments for target and acquirer institutional ownership. Panel B uses alternative foreign ownership variables:nonlinear specification using low (foreign ownership below 5%), medium (foreign ownership between 5% and 25%), and high (foreign ownership above 25%) foreignownership variables; foreign blockholders ownership (holdings above 5%); foreign ownership relative to domestic ownership; foreign ownership by institutions fromthe acquirer country relative to ownership by foreign institutions based in third countries; and foreign ownership by institutions from third countries relative to totalinstitutional ownership. The last column of Panel B tests whether the likelihood of a cross-border deal involving an acquirer from country j (target from country i)is associated with the pairwise institutional ownership from country j (acquirer firm institutional ownership from country i) in the target firm from country i . PanelC uses alternative samples: excludes M&A deals that involve the target firms from the United States and extends the sample to include 21 other countries. Panel Dpresents estimates of interactions of the target foreign institutional ownership with the target firm’s characteristics. Regressions include target and acquirer controlvariables (coefficients not shown) used in Column (10) of Table 9. Refer to Table 1 for definitions of variables. The sample period is from 2000 to 2005. Robustt-statistics adjusted for country clustering are in parentheses.
635

Tests so far measure foreign institutional ownership as a percentage of marketcapitalization. An alternative is to measure foreign holdings relative to domesticholdings (“Foreign-to-domestic inst. ratio”). This better controls for biases inthe overall representation of institutional investors in the institutional holdingsdata set. The results with this measure are consistent with the findings reportedso far. We also consider the importance of foreign institutions from the acquirercountry that hold shares in the target relative to foreign institutional ownershipfrom other countries (“Acquirer-to-other countries inst.”). Ownership by insti-tutions from the acquirer country in the target firm has a positive and significanteffect on the likelihood that a firm is targeted in a cross-border deal. This findingfurther supports the facilitation hypothesis. It provides a direct link between thenationality of the acquirer firm and the nationality of the institutional investorsin the target firm shares prior to the M&A deal. In contrast, we do not find evi-dence that the presence of institutions domiciled in other countries, i.e., neitherthe country of the target nor the country of the acquirer, affects the likelihoodthat an M&A deal is cross-border (“Other countries-to-total institutional own-ership”). Overall, this supports the hypothesis that institutions build “bridges”between firms from different countries.
In the last column of Panel B of Table 10, we test whether the likelihoodof a cross-border deal involving an acquirer from country j is associated withthe percentage of shares in the target firm that are owned by institutions domi-ciled in country j . To address this question, for each target firm from countryi, we measure ownership by all other 26 possible countries. We then regressthe likelihood of each effective cross-border deal pair on the pairwise institu-tional ownership, as well as the other control variables. There is evidence of apositive relationship between the pairwise target firm institutional ownershipfrom country j and the likelihood that a cross-border deal takes place withan acquirer from country j . The Vodafone–Mannesmann case can be used toillustrate these test results: a bid by a UK company was more likely due tothe disproportional presence of UK-based institutions in Mannesmann (Kedia2001). This is consistent with the facilitation hypothesis. Likewise, the fractionof institutional ownership from country i in the acquirer is positively associ-ated with the likelihood that a cross-border deal takes place with a target fromcountry i . This is also consistent with the facilitation hypothesis but appliedto the bidder firm. The interpretation here is that foreign institutions from thetarget firm country that are already present in the bidder country can fill the in-formational gap between the bidder and the target. Additionally, investors fromthe target country are likely to be less prone to any familiarity or home bias.These tests are the deal-level equivalent of the country-pairs tests in Section 3.
Panel C of Table 10 shows that the results are robust across different countrysamples. Specifically, we exclude M&A deals that involve target firms fromthe United States and extend the sample to include 21 other countries. PanelD examines how firm-level characteristics influence the role played by foreigninstitutions in cross-border M&As. We include interaction variables (“Foreign
636
The Review of Financial Studies / v 23 n 2 2010

Institutional Investors and Cross-Border Mergers and Acquisitions
institutional ownership target × Characteristic target” ) between foreign institu-tional ownership and measures of information asymmetry (size and investmentopportunities), trading activity (share turnover), and private benefits of control(insider ownership). We find that the effect of foreign institutional ownership isstronger in companies with higher information asymmetry (small and growthfirms), with less liquid shares, and with large controlling shareholders. Thisis consistent with the hypothesis that foreigners are better able to reduce theinformation gap in international takeovers and less prone to yield to target firmmanagement efforts to block deals.
4.2 Success and full control in cross-border M&AsTo see whether foreign institutions make it more likely that a cross-border dealis successfully completed, we estimate the probit regression:
Prob(Deal is Completed)i,t = α + β(Institutional Ownership)i,t + δXi,t + εi,t ,
(4)
where the dependent variable is a dummy that takes a value of one if thecross-border M&A deal is completed, and zero otherwise. The main variableof interest is the percentage of shares held by foreign institutions in the targetand acquirer. The control variables are the same as those used in Column (10)of Table 9.
Panel A of Table 11 shows that the geography of institutions matters. Hold-ings by foreign institutional investors in both target and acquirer firms arepositively associated with the probability that a cross-border deal will be com-pleted (Column (1)). In Column (2), we find the opposite effect for domesticinstitutional ownership. A Wald test rejects the null that foreign and domesticinstitutional ownership coefficients are equal (Column (3)).
We then examine whether the decision of the bidder to take full control ina cross-border deal is related to institutional ownership. A transaction aimingat full control is more likely to effectively change the nationality of the targetfirm, with a potential relocation of corporate headquarters. We estimate theprobit regression:
Prob(Full Control)i,t = α + β(Institutional Ownership)i,t + δXi,t + εi,t , (5)
where the dependent variable is a dummy that takes a value of one if the bid isfor 100% of the target firm shares, and zero otherwise.
Panel B of Table 11 shows that foreign institutional ownership in both targetand acquirer firms is positively related to the probability of full control (Column(4)). This is consistent with the hypothesis that foreigners reduce transactioncosts in cross-border M&As that involve a change in firm nationality. Domesticinstitutional ownership is not related to the probability that a bidder will takefull control of a target’s shares (Column (5)). Kim (2007) finds that targetsin countries with weak investor protection are more likely to be acquiredthrough control stake acquisitions, rather than full control acquisitions. Our
637

Table 11Deal-level analysis of the probability of success and full control in a cross-border merger and acquisition
(1) (2) (3) (4) (5) (6)
Panel A: Probit of success Panel B: Probit full control
Foreign institutional ownership target 4.237 9.871 5.020 4.725(3.70) (3.86) (2.23) (2.24)
Domestic institutional ownership target −1.349 −8.675 0.889 0.340(−1.14) (−3.87) (1.33) (0.56)
Foreign institutional ownership acquirer 5.661 10.516 3.822 3.760(2.36) (2.80) (2.16) (2.09)
Domestic institutional ownership acquirer −1.519 −3.595 0.920 0.610(−1.87) (−2.32) (1.43) (0.89)
Wald test: Foreign IO target = Domestic IO target 16.86 5.56P-value 0.000 0.018Wald test: Foreign IO acquirer = Domestic IO acquirer 9.17 2.73P-value 0.003 0.098
Target control variables Yes Yes Yes Yes Yes YesAcquirer control variables Yes Yes Yes Yes Yes YesYear dummies Yes Yes Yes Yes Yes YesIndustry dummies Yes Yes Yes Yes Yes YesCountry dummies Yes Yes Yes Yes Yes YesObservations 150 150 150 159 159 159
Panel A presents estimates of a deal-level probit model of the likelihood of success of a cross-border dealwhere the dependent variable is a dummy variable that equals one if a cross-border M&A bid is successful (orcompleted). Panel B presents estimates of a deal-level probit model of the likelihood of the acquirer taking fullcontrol of the target shares where the dependent variable is a dummy that equals one if the percentage soughtin a cross-border M&A bid is 100%. Regressions include the control variables (coefficients not shown) used inColumn (10) of Table 9. Refer to Table 1 for definitions of variables. The sample period is from 2000 to 2005.Robust t-statistics adjusted for country clustering are in parentheses.
findings suggest that foreign institutions are effective in encouraging full controlacquisitions in international takeovers by reducing the extent of extraction ofprivate benefits.
4.3 Cross-border M&A announcement returns: Is bridge-buildingprofitable?
In this section, we examine whether the international institutional investors thatlink firms in different countries stand to gain from these cross-border corporatetransactions. Our hypotheses suggest that foreign institutions are more likely tofavor cross-border deals and not oppose them for some “patriotic” motivations,but this should be the case only if these deals earn them positive abnormalreturns on average.
We examine the returns experienced by institutions that hold firms involvedin cross-border deals, particularly the foreign institutions that hold both targetand bidder firm shares. In the Mannesmann takeover, for example, 40% ofMannesmann’s shareholders were also shareholders of Vodafone.16 Harford,Jenter, and Li (2007) and Matvos and Ostrovsky (2008) examine the importance
16 In the ABN AMRO takeover contest in 2007, the Financial Times (2007) reported that some of the largestinstitutional shareholders simultaneously held positions in the target bank and in the two bidder banks (Barclaysand Royal Bank of Scotland).
638
The Review of Financial Studies / v 23 n 2 2010

Institutional Investors and Cross-Border Mergers and Acquisitions
Table 12Deal-level analysis of the combined premium around M&A announcements
Panel A: Summary statistics of CAR
Panel A.1: CAR (−1, +1) Panel A.2: CAR (−10, +10)
Mean Std error Median Mean Std error Median Obs.
Target return 0.1181 0.0101 0.0929 0.1976 0.0164 0.1417 176Acquirer return −0.0078 0.0047 −0.0036 −0.0088 0.0083 −0.0085 176Combined return 0.0106 0.0041 0.0059 0.0188 0.0074 0.0190 176Combined return of foreign institutions 0.0104 0.0049 0.0073 0.0227 0.0087 0.0156 176Combined return of common institutions 0.0162 0.0063 0.0097 0.0302 0.0102 0.0168 125
Panel B: Regressions of CAR
Panel B.1: CAR (−1, +1) Panel B.2: CAR (−10, +10)
Combined CAR CAR Combined CAR CARDependent variable CAR difference ratio CAR difference ratio
Foreign institutional ownership target 0.027 0.072(2.09) (2.43)
Foreign institutional ownership acquirer 0.069 0.049(2.10) (1.74)
Foreign institutional ownership difference 0.071 0.088(acquirer–target) (3.00) (2.10)
Foreign institutional ownership ratio 0.350 0.346(acquirer/(target+acquirer) (1.98) (2.67)
Target control variables Yes Yes Yes Yes Yes YesAcquirer control variables Yes Yes Yes Yes Yes YesYear dummies Yes Yes Yes Yes Yes YesIndustry dummies Yes Yes Yes Yes Yes YesCountry dummies Yes Yes Yes Yes Yes YesObservations 176 176 66 176 176 66R-squared 0.31 0.45 0.80 0.31 0.40 0.54
This table reports cumulative abnormal returns (CAR) around cross-border M&A deal announcements using(−1, +1) and (−10, +10) event windows. Daily abnormal returns in US dollars are measured relative to thetwo-factor international market model estimated using a year of prior daily data. Panel A presents mean, standarderror, and median of CAR for target and acquirer. Combined return is the value-weighted average CAR of thetarget and acquirer, where the weights are the market capitalization of the target and the acquirer (prior to thedeal). Combined return of foreign institutions is the value-weighted average CAR of the target and acquirer,where the weights are given by the holdings of foreign institutions. Combined return of common institutionsis the value-weighted average CAR of the target and acquirer, where the weights are given by the holdingsof institutions that hold shares in both the target and acquirer (cross-owners). Panel B presents estimates ofregressions of the combined CAR, and CAR difference and CAR ratio between the acquirer and the target. CARdifference is the difference between the acquirer dollar CAR and the target dollar CAR (dollar CARs are givenby the product of the market capitalization by the CAR). CAR ratio is the ratio of the acquirer dollar CAR by thetarget dollar CAR plus the acquirer dollar CAR (only defined when both target and acquirer returns are positive).Regressions include the control variables (coefficients not shown) used in Column (10) of Table 9 and a dummyvariable that equals one when the deal is cash only. Refer to Table 1 for definitions of variables. The sampleperiod is from 2000 to 2005. Robust t-statistics adjusted for country clustering are in parentheses.
of institutional cross-ownership in the US takeover market. These factors seemeven more important in an international setting, given the transaction costs andbarriers to cross-border deals.
Table 12 presents the average target and acquirer announcement cumulativeabnormal stock returns (CAR) in our sample of cross-border M&A. In PanelA.1, we use target and acquirer CARs over the three-day event window (−1,+1) around the deal announcement (e.g., Bris and Cabolis 2008; Moeller,Schlingemann, and Stulz 2007). In Panel A.2, we use a longer event window
639

(−10, +10) as a robustness check. We estimate abnormal stock returns using asa benchmark model the two-factor international market model (Griffin 2002).The factors are the local market return and the world market return. The modelis estimated using daily return data in US dollars from the 260 business daysprior to the deal announcement.
The average three-day CARs for the target and acquirer are 11.81% and−0.78%. We also present the value-weighted average CAR of the target andacquirer (combined return), where the weights are the market capitalizationsof the target and acquirer firms (prior to the deal). The combined return measuresthe overall economic gains (synergy) of the transaction. Panel A.1 shows thatthe average combined return for cross-border deals is 1.06% using a (−1, +1)window and 1.88% using a (−10, +10) window. We next present the combinedreturns to foreign institutions (combined return of foreign institutions) depend-ing on their holdings in the target and acquirer (prior to the deal). The averagereturn is positive and significant for foreign investors in cross-border deals at1.04% for the (−1, +1) window and 2.27% for the (−10, +10) window. Finally,we present the combined return to institutional investors common to target andacquirer; these are called cross-owners in Matvos and Ostrovsky (2008) andHarford, Jenter, and Li (2007). The average return to common institutionalinvestors (combined return of common institutions) in cross-border deals is1.62% for the (−1, +1) window and 3.02% for the (−10, +10) window. Thesefindings suggest that common institutional investors make positive returns incross-border M&A deals from their holdings in the targets’ and acquirers’stocks. The returns to foreign and common investors are higher than the returnsto all investors. Institutions seem to gain from the deal as the profits on theirtarget holdings exceed, on average, the losses on their acquirer holdings.
We then test whether there is a link between the overall value creation andinternational institutional ownership by looking at the combined return. Wethen regress the combined return on foreign institutional ownership in thetarget and acquirer, as well as other determinants of the M&A announcementreturn. We use the same list of control variables as used in Column (10)of Table 9 for both target and acquirer and a dummy that equals one whenthe deal is cash only. Panel B of Table 12 reports the results. We find thatforeign institutional ownership in both target and acquirer firms is associatedwith higher combined returns in cross-border deals. This is consistent withthe “facilitation hypothesis” that foreign institutions promote deals that offergreater value creation (synergy).
We also examine whether the presence of foreign institutions affects thedivision of the merger gain between the target and acquirer. We use themeasures of merger gain split proposed by Ahern (2008). The first measure isthe “CAR difference.” This is defined as the difference between the acquirerdollar CAR and the target dollar CAR. Dollar CARs are constructed asthe product of the market capitalization of the firm and its CAR. We thenregress the CAR difference on the foreign institutional ownership dollar
640
The Review of Financial Studies / v 23 n 2 2010

Institutional Investors and Cross-Border Mergers and Acquisitions
difference (acquirer–target) that captures the differential dollar stake thatforeign institutions have in the acquirer versus the target. The results arereported in Panel B of Table 12. We find that a greater presence of foreigninstitutions in the acquirer affects the bargaining outcome of the M&A deal infavor of the acquirer. The results hold regardless of the way this difference isdefined (i.e., target–acquirer, as opposed to acquirer–target).
The second measure is the acquirer’s share of the merger gain (CAR ratio).This measure corresponds to the slice of the pie accruing to each party inthe deal. Following Ahern (2008), we analyze the subsample of deals whereboth target and acquirer returns are positive. We find that the slice of the pieaccruing to the acquirer is positively associated with a greater presence offoreign institutions in the acquirer relative to the target. For both measures ofthe division of the merger gain, we use CARs estimated over the (−1, +1) and(−10, +10) event windows.
5. Conclusion
Our study examines the role played by institutional investors in the internationalmarket for corporate control. Cross-border portfolio investment by institutionalmoney managers facilitates cross-border M&As and helps to reduce the bar-gaining and transaction costs associated with these deals. The effect of foreigninvestors on cross-border M&As is stronger when legal institutions are weaker,capital markets are less developed, and information asymmetry and privatebenefits of control are higher. This finding suggests that country-level gover-nance and foreign investors are substitutes in facilitating cross-border M&Atransactions.
Results for target and acquirer returns confirm the unique role of foreigninstitutions in cross-border deals, as firms with more foreign institutional own-ership experience significantly lower announcement abnormal stock returns.We also observe that institutions holding both target and acquirer stocks arecompensated by higher returns. Thus, the evidence supports the special roleplayed by foreign institutions as facilitators in cross-border deals by reducingthe transaction costs and the information asymmetry associated with cross-border takeover bids.
We conclude that overseas portfolio investments and cross-border M&Asare complementary mechanisms in promoting financial integration worldwide.Overall, our findings establish a link between the market for corporate controland the ownership structure of firms worldwide. Companies with more inter-national institutional investors benefit from shareholders at the “gates” that actas Trojan horses facilitating changes of control.
ReferencesAdler, M., and B. Dumas. 1975. Optimal International Acquisitions. Journal of Finance 30:1–19.
Agmon, T., and D. Lessard. 1977. Investor Recognition of Corporate International Diversification. Journal ofFinance 32:1049–55.
641

Ahern, K. 2008. Bargaining Power and Industry Dependence in Mergers. Working Paper, University of Michigan.
Ambrose, B., and W. Megginson. 1992. The Role of Asset Structure, Ownership Structure and Takeover Defensesin Determining Acquisition Likelihood. Journal of Financial and Quantitative Analysis 27:575–89.
Baker, M., C. F. Foley, and J. Wurgler. 2009. Multinationals as Arbitrageurs: The Effect of Stock MarketValuations on Foreign Direct Investment. Review of Financial Studies 22:337–69.
Becht, M., J. Franks, C. Mayer, and S. Rossi. 2009. Returns to Shareholder Activism: Evidence from a ClinicalStudy of the Hermes UK Focus Fund. Review of Financial Studies 22:3093–129.
Bekaert, G., and C. Harvey. 2000. Foreign Speculators and Emerging Equity Markets. Journal of Finance55:565–613.
Bekaert, G., C. Harvey, and C. Lundblad. 2005. Does Financial Liberalization Spur Growth? Journal of FinancialEconomics 77:3–55.
Bhattacharya, U., and H. Daouk. 2002. The World Price of Insider Trading. Journal of Finance 573:75–108.
Brav, A., W. Jiang, F. Partnoy, and R. Thomas. 2008. Hedge Fund Activism, Corporate Governance, and FirmPerformance. Journal of Finance 63:1729–75.
Bris, A., and C. Cabolis. 2008. The Value of Investor Protection: Firm Evidence from Cross-Border Mergers.Review of Financial Studies 21:605–48.
Bris, A., W. Goetzmann, and N. Zhu. 2007. Efficiency and the Bear: Short Sales and Markets around the World.Journal of Finance 62:1029–79.
Business Week. 2006. Special Report: Fidelity’s Divided Loyalties.
Carleton, W., J. Nelson, and M. Weisbach. 1998. The Influence of Institutions on Corporate Governance throughPrivate Negotiations: Evidence from TIAA–CREF. Journal of Finance 53:1335–62.
Chan, K., V. Covrig, and L. Ng. 2005. What Determines the Domestic Bias and Foreign Bias? Evidence fromMutual Fund Equity Allocations Worldwide. Journal of Finance 60:1495–534.
Chen, X., J. Harford, and K. Li. 2007. Monitoring: Which Institutions Matter? Journal of Financial Economics86:279–305.
Coval, J., and T. Moskowitz. 2001. The Geography of Investment: Informed Trading and Asset Prices. Journalof Political Economy 109:811–41.
Davis, G., and E. H. Kim. 2007. Business Ties and Proxy Voting by Mutual Funds. Journal of FinancialEconomics 85:552–70.
Denis, D., D. Denis, and K. Yost. 2002. Global Diversification, Industrial Diversification, and Firm Value. Journalof Finance 57:1951–79.
Doukas, J., and N. Travlos. 1988. The Effect of Corporate Multinationalism on Shareholders’ Wealth: Evidencefrom International Acquisitions. Journal of Finance 43:1161–75.
Errunza, V., and L. Senbet. 1984. International Corporate Diversification, Market Valuation, and Size-AdjustedEvidence. Journal of Finance 39:727–45.
Economist. 2007a. The Global Merger Boom: The Beat Goes On.
Economist. 2007b. Leader of the Swarm.
Fatemi, A. 1984. Shareholder Benefits from Corporate International Diversification. Journal of Finance 39:1325–44.
Ferreira, M., and P. Matos. 2008. The Colors of Investors’ Money: The Role of Institutional Investors around theWorld? Journal of Financial Economics 88:499–533.
French, K., and J. Poterba. 1991. Investor Diversification and International Equity. American Economic Review81:222–26.
642
The Review of Financial Studies / v 23 n 2 2010

Institutional Investors and Cross-Border Mergers and Acquisitions
Financial Times. 2007. Tangled Relationships Make Choices Tough.
Gaspar, J.-M., M. Massa, and P. Matos. 2005. Shareholder Investment Horizons and the Market for CorporateControl. Journal of Financial Economics 76:135–65.
Gillan, S., and L. Starks. 2003. Corporate Governance, Corporate Ownership, and the Role of InstitutionalInvestors: A Global Perspective. Journal of Applied Finance 13:4–22.
Gillan, S., and L. Starks. 2007. The Evolution of Shareholder Activism in the United States. Journal of AppliedCorporate Finance 19:55–73.
Gompers, P., and A. Metrick. 2001. Institutional Investors and Equity Prices. Quarterly Journal of Economics116:229–59.
Greenwood, R., and M. Schor. 2009. Investor Activism and Takeovers. Journal of Financial Economics 92:362–75.
Griffin, J. 2002. Are the Fama and French Factors Global or Country Specific? Review of Financial Studies15:783–803.
Grinblatt, M., and M. Keloharju. 2001. What Makes Investors Trade? Journal of Finance 56:589–616.
Grossman, S., and O. Hart. 1980. Takeover Bids, the Free-Rider Problem, and the Theory of the Corporation.Bell Journal of Economics 11:42–64.
Harford, J., D. Jenter, and K. Li. 2007. Conflicts of Interests among Shareholders: The Case of CorporateAcquisitions. Working Paper, University of Washington.
Hau, H., M. Massa, and J. Peress. 2006. Do Demand Curves for Currencies Slope Down? Evidence from theMSCI Global Index Change. Working Paper, INSEAD.
Hopner, M., and G. Jackson. 2004. An Emerging Market for Corporate Control? The Mannesmann Takeover andGerman Corporate Governance. Working Paper, Max-Planck Institute.
International Monetary Fund. 2005. Global Financial Stability Report: Market Developments and Issues.
Kang, J. K., and J.-M. Kim. 2008. The Geography of Block Acquisitions. Journal of Finance 62:2817–58.
Karolyi, G. A., and R. Stulz. 2003. Are Financial Assets Priced Locally or Globally? In George Constantinides,Milton Harris, and Rene Stulz (eds.), The Handbook of the Economics of Finance, pp. 975–1020. New York:North-Holland.
Kedia, S. 2001. Vodafone AirTouch’s Bid for Mannesmann. Harvard Business School Case Study No. 9-201-096.
Khorana, A., H. Servaes, and P. Tufano. 2005. Explaining the Size of the Mutual Fund Industry around the World.Journal of Financial Economics 78:145–85.
Kim, W. 2007. Investor Protection and the Mode of Acquisition: An Implication for the Formation of Pyramids.Working Paper, Korea University Business School.
Klein, A., and E. Zur. 2009. Entrepreneurial Shareholder Activism: Hedge Funds and Other Private Investors.Journal of Finance 64:187–229.
La Porta, R., F. Lopez-de-Silanes, and A. Shleifer. 2006. What Works in Securities Laws? Journal of Finance61:1–32.
La Porta, R., F. Lopez-de-Silanes, A. Shleifer, and R. Vishny. 1998. Law and Finance. Journal of PoliticalEconomy 106:1113–55.
La Porta, R., F. Lopez-de-Silanes, A. Shleifer, and R. Vishny. 1999. Corporate Ownership around the World.Journal of Finance 54:471–517.
Lewis, K. 1999. Trying to Explain the Home Bias in Equities and Consumption. Journal of Economic Literature37:571–608.
643

Li, D., F. Moshirian, P. Pham, and J. Zein. 2006. When Financial Institutions Are Large Shareholders: The Roleof Macro Corporate Governance Environments. Journal of Finance 61:2975–3007.
Matvos, G., and M. Ostrovsky. 2008. Cross-Ownership, Returns, and Voting in Mergers. Journal of FinancialEconomics 89:391–403.
Moeller, S., F. Schlingemann, and R. Stulz. 2007. How Do Diversity of Opinion and Information AsymmetryAffect Acquirer Returns? Review of Financial Studies 20:2047–78.
Morck, R., and B. Yeung. 1991. Why Investors Value Multinationality. Journal of Business 64:165–87.
Morck, R., B. Yeung, and W. Yu. 2000. The Information Content of Stock Markets: Why Do Emerging MarketsHave Synchronous Stock Price Movements? Journal of Financial Economics 58:215–60.
Nenova, T. 2006. Takeover Laws and Financial Development. Working Paper, World Bank.
Organization for Economic Co-Operation and Development. 2007. International Investment Perspectives: Free-dom of Investment in a Changing World.
Petersen, M. 2009. Estimating Standard Errors in Finance Panel Data Sets: Comparing Approaches. Review ofFinancial Studies 22:435–80.
Rossi, S., and P. Volpin. 2004. Cross-Country Determinants of Mergers and Acquisitions. Journal of FinancialEconomics 74:277–304.
Shleifer, A., and R. Vishny. 1986. Large Shareholders and Corporate Control. Journal of Political Economy94:461–88.
Shleifer, A., and R. Vishny. 2003. Stock Market Driven Acquisitions. Journal of Financial Economics 70:295–311.
Starks, L., and K. Wei. 2004. Cross-Border Mergers and Differences in Corporate Governance. Working Paper,University of Texas at Austin.
Stulz, R. 2005. The Limits of Financial Globalization. Journal of Finance 60:1595–638.
Stulz, R., R. Walkling, and M. Song. 1990. The Distribution of Target Ownership and the Division of Gains inSuccessful Takeovers. Journal of Finance 45:817–33.
World Bank. 2000. Pension Reform Primer: Portfolio Limits.
644
The Review of Financial Studies / v 23 n 2 2010