sharekhan pms clients 4th mar'11
TRANSCRIPT

PORTFOLIO MANAGEMENT SERVICES
More than Management :
GROWING YOUR WEALTH.. !!

Products Performance
People
Processes
Portfolio Management Services
Opportunities Philosophy
Investment
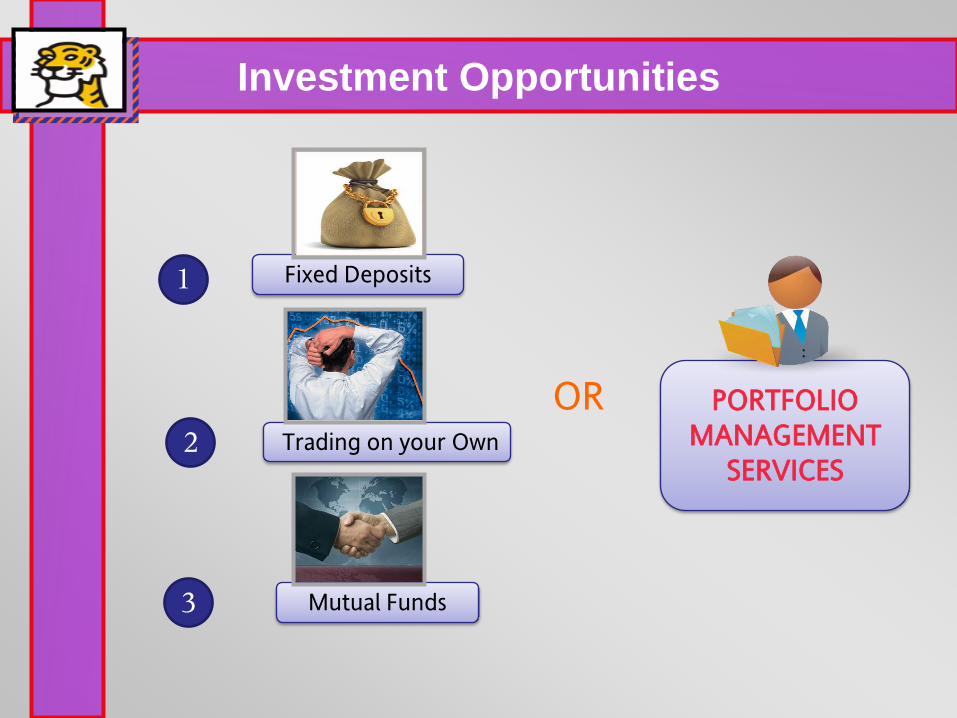
OR
Fixed Deposits1
Trading on your Own 2
Mutual Funds3
PORTFOLIO MANAGEMENT
SERVICES
Investment Opportunities

– Pros
• Fixed returns
• Capital protection
PMS Vs other investment opportunities
– Cons
• Low returns coupled with
high tax
• No possibility of riding on
markets
Fixed Deposits
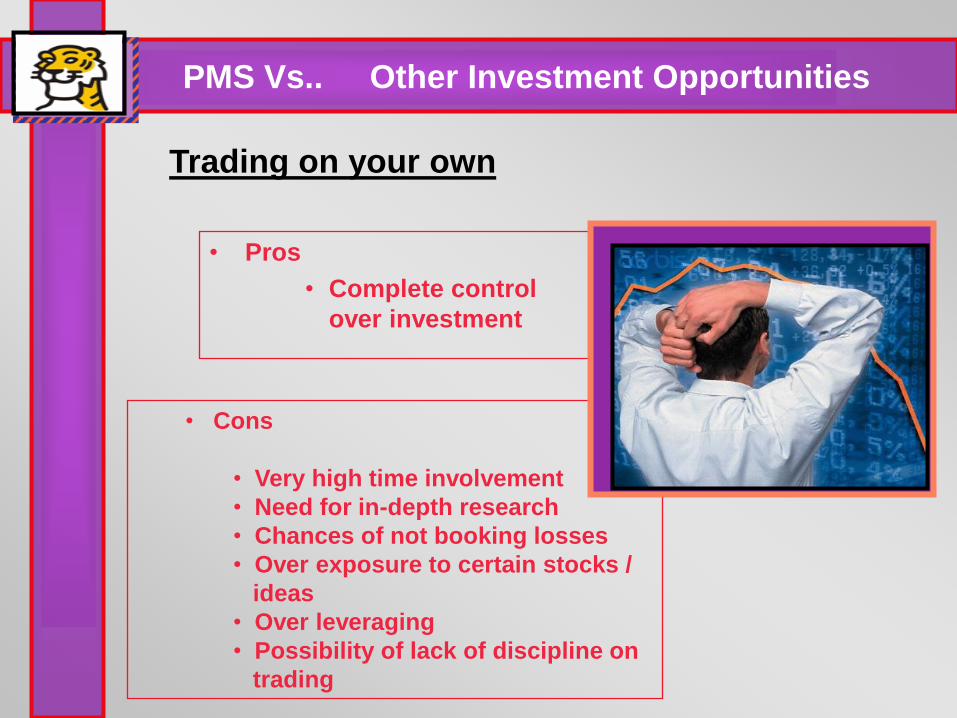
• Pros
• Complete control
over investment
PMS Vs.. Other Investment Opportunities
• Cons
• Very high time involvement
• Need for in-depth research
• Chances of not booking losses
• Over exposure to certain stocks /
ideas
• Over leveraging
• Possibility of lack of discipline on
trading
Trading on your own
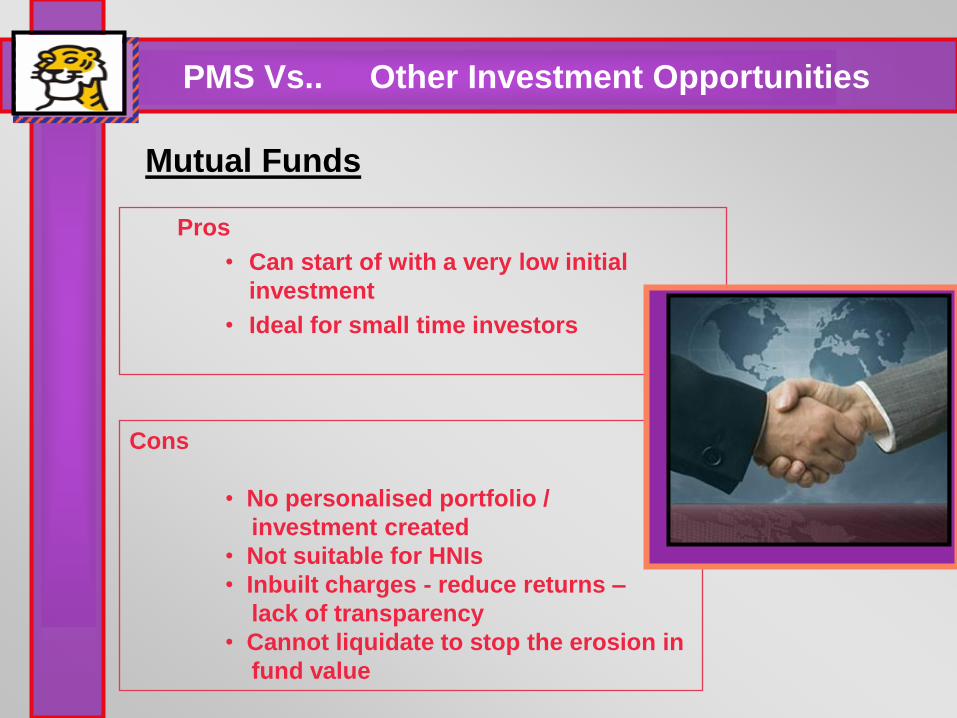
Pros
• Can start of with a very low initial
investment
• Ideal for small time investors
PMS Vs.. Other Investment Opportunities
Cons
• No personalised portfolio /
investment created
• Not suitable for HNIs
• Inbuilt charges - reduce returns –
lack of transparency
• Cannot liquidate to stop the erosion in
fund value
Mutual Funds

PORTFOLIO MANAGEMENT
SERVICES..!!
Ideal Investment Platform for HNIs??

• Professional Management –
Professional and constant
management
• Hassle Free Operation –
Periodic reporting on the
overall status of the portfolio
and performance.
Why Ideal ?

• Continuous Monitoring
It is important to recognize that
portfolios need to be constantly
monitored and periodic changes
made to optimize the results.
Flexibility
Portfolio Manager has fair amount of flexibility in
terms of holding cash (can go up to 100% also
depending on the market conditions). He can
create a reasonable concentration in the investor
portfolios by investing disproportionate amounts
in favor of compelling opportunities
Why Ideal ?

• Customized Advice
It can be structured to automatically exclude
investments you may own in another account or
investments you would prefer not to own
Why Ideal ?
• Transparency
PMS provides comprehensive communications and
performance reporting. Investors will get regular
statements and updates from the firm. Web-enabled
access will ensure that client is just a click away from all
information relating to his investment.

Why Ideal ?
• Post Sales service
– Dedicated Client Servicing Team to address your queries.
– Detailed portfolio reports are available at timely basis like
• Investment Summary
• Portfolio Holding
• Transaction Statement
• Bank Book
• Realized / Unrealized Gain Loss Details
• Fees Charged Statement (Debit Note)
• Corporate Benefit (Bonus / Dividend / Right issues declared, etc.)
• Fund Manager’s Report.

PRODUCTS
Customised Service as per your
Profile
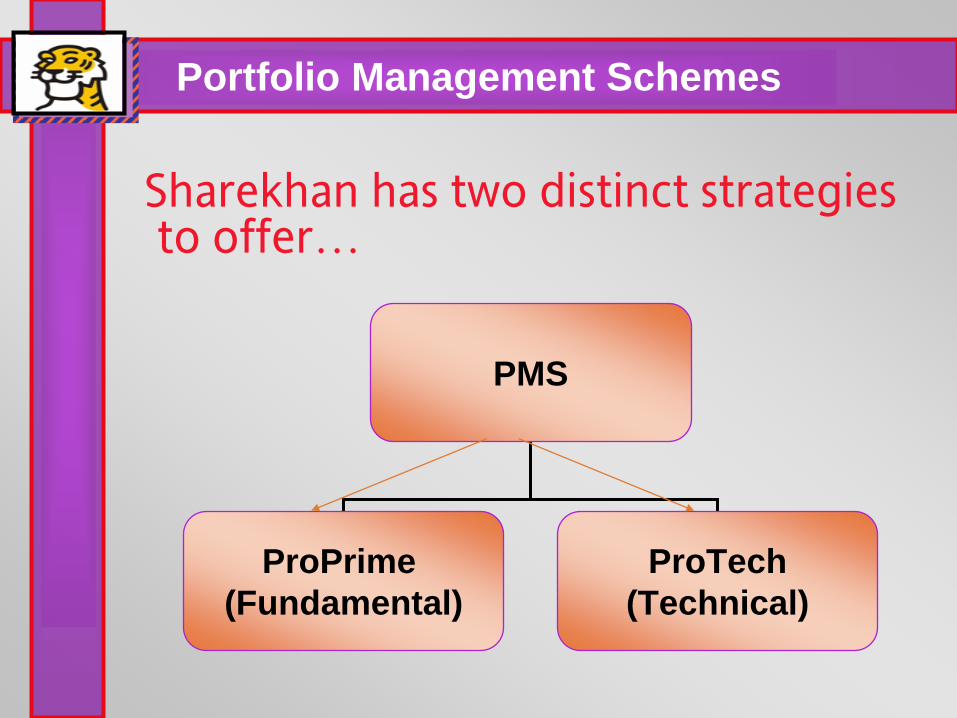
Sharekhan has two distinct strategies to offer…
PMS
ProPrime
(Fundamental)
ProTech
(Technical)
Portfolio Management Schemes

PEOPLE
MEET the MANAGERS

Over 20 years experience across Equities, Fund management, & PMS
Previous Experience:
2008-2009: Head of PMS at Asit C Mehta Investments Intermediaries Ltd (2008-2009)
2006 – 2008: Head Equity and Fund Manager for Rami Investments
1994-2006: Fund Manager for OCB, Mauritius with over Rs 40 crore of NRI funds managed
SUHAS SAMANT,
Fund Manager for Sharekhan ProPrime

Over 16 years experience in Stock Market Analysis
MMS from Mumbai University
Previous Experience:
Since 2004: Market Strategist with a team of 3 technical analysts monitoring trends across Equity and Commodity markets in India and across the world
2002: Head of the Central Research Team at Sharekhan
2001: Market Analyst at Sharekhan with Buy/Sell recommendations in Trading Products
Research Analyst at Sanwa Finance
ROHIT SHRIVASTAV, Fund Manager for Sharekhan ProTech PMS

• Over 8 years experience in the financial industry which
includes almost 3 years on the fund management side.
• Prior joining Sharekhan in 2007, he was working with Karvy
Stock Broking House as a Derivative Research Analyst.
• He is among the prominent stock market experts whose
opinions are sought after by leading media companies like
CNBC TV 18, CNBC Awaaz, NDTV Profit, Bloomberg UTV. &
ET Now
• His educational qualifications includes, bachelor of computer
application in 2003 from Bhopal University followed by MBA
in Finance from ICFAI – Hyderabad in 2005.
Mr. Abhinay Jain
Pro Tech Diversify Fund Manager

PHILOSOPHY
Our Investment Philosophy at
PMS
Based on
Fundamental Analysis
ProPrime PMS

Difficult for clients!
Judging the impact of the News for sectors & scrip's
ProPrime
PMS
Tracking the Market.
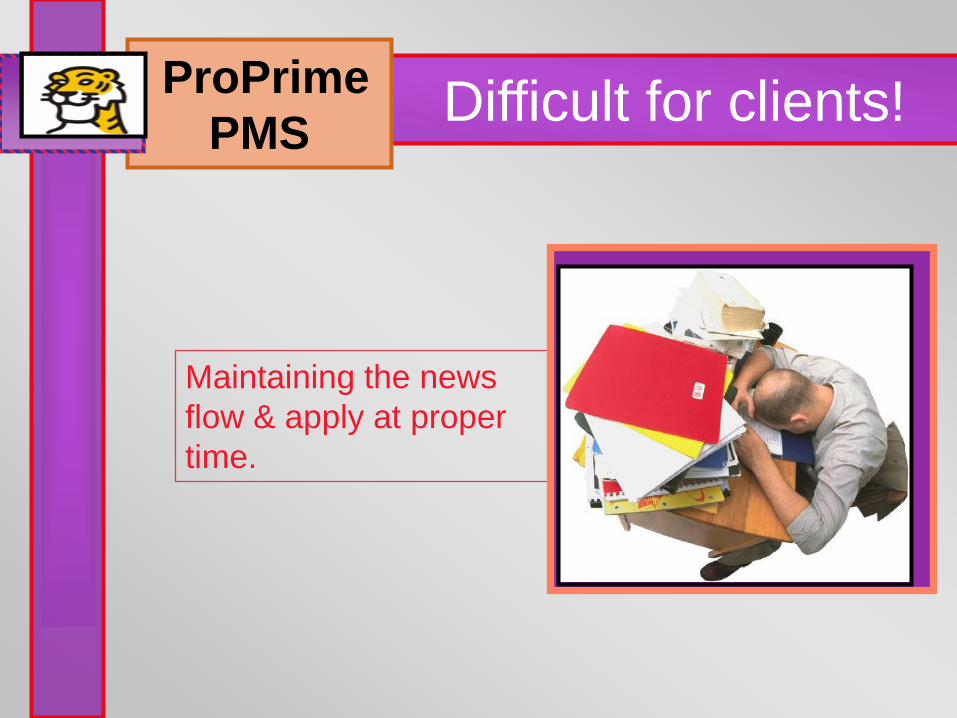
Difficult for clients!
Maintaining the news
flow & apply at proper
time.
ProPrime
PMS
Availability of basic Research .
• Basic fund management rules (Investment Philosophy, Sector Allocation, Scrip Allocation, etc.)
Difficult for clients!ProPrime
PMS

Profile the Customers
• Risk Appetite • Time duration for Investment
How it WorksProPrime
PMS

Balance risk & Descent growth
by..
• Diversifying sectors & number of
scrip's.
• Investment Philosophy is in
place.
• Allocation of maximum
percentage of scrip's.
• Stop loss in place.
• Non Leverage Portfolio.
How it WorksProPrime
PMS
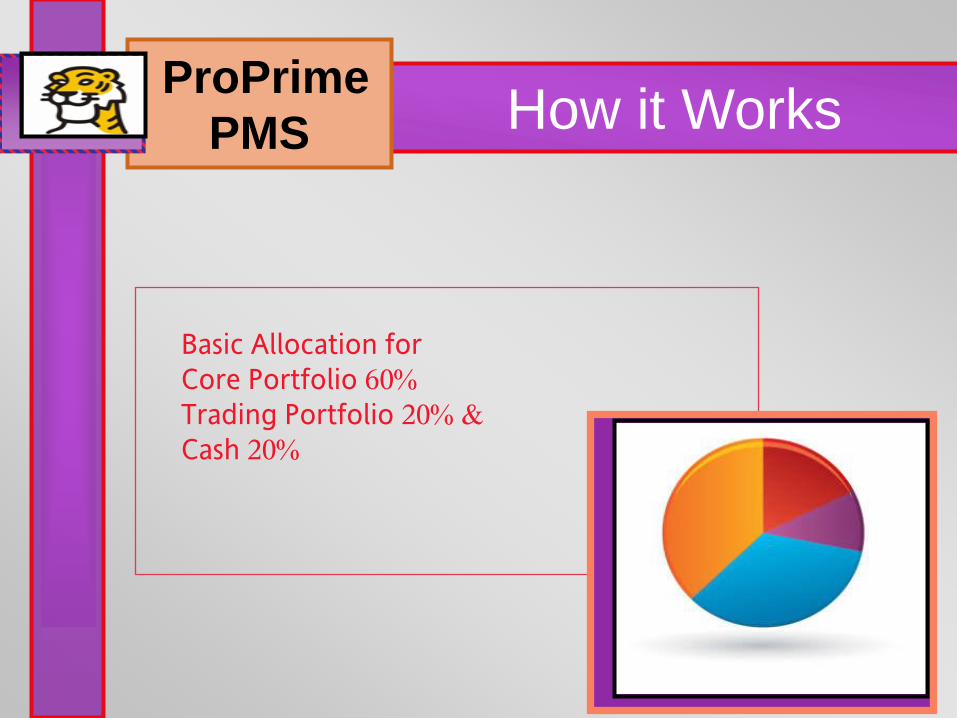
Basic Allocation for Core Portfolio 60%Trading Portfolio 20% & Cash 20%
How it WorksProPrime
PMS
This results in..
• Building a long term Portfolio
• Trading activity gives movement to
the portfolio & covers the cost
How it WorksProPrime
PMS
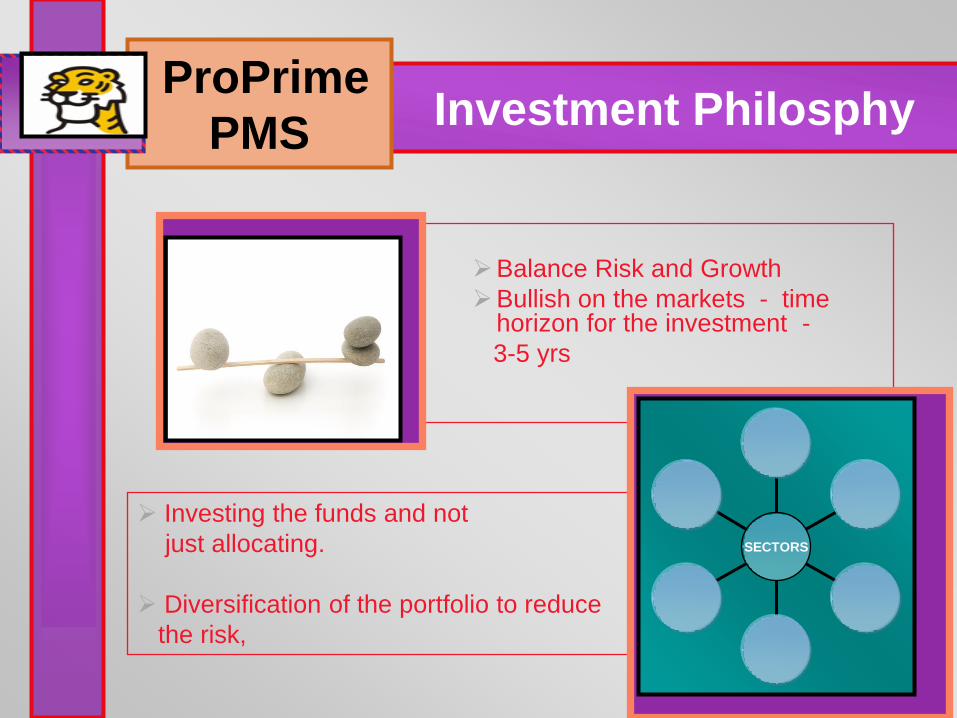
Balance Risk and Growth
Bullish on the markets - time horizon for the investment -
3-5 yrs
Investment PhilosphyProPrime
PMS
Investing the funds and not
just allocating.
Diversification of the portfolio to reduce
the risk,
SECTORS

We are bullish on
Capital Goods,
Infrastructure, Banking,
Pharma, Ites Power,
Insurance and Retail
We are underweight
on Telecom, Realty
(outside Mumbai)
Media
Investment PhilosophyProPrime
PMS
Rather than timing the
market we buy on DIP
and book profit above
25% - 30% on SEP
(systematic exit plan)
We would like to be in
stocks with less burden
on Balance sheet and
good earning visibility

Personalised portfolio selection
and management by a
dedicated Fund Manager
Our OfferingProPrime
PMS

Our OfferingProPrime
PMS
Reporting:
Online access to Portfolio Holdings.

Our OfferingProPrime
PMS
Quarterly reporting of portfolio
holdings/transactions
Corpus:
Indian Resident - Rs 5 Lakhs
NRI - We recommend Rs.10 Lakhs as an initial Investment to ensure PIS charges pertaining to bank are Rationalised.
Fees:
2.5% per annum AMC charged every quarter @ 0.625%
0.5% brokerage
20% profit sharing after 15% hurdle is crossed-chargeable at the end of the fiscal year.
Our OfferingProPrime
PMS
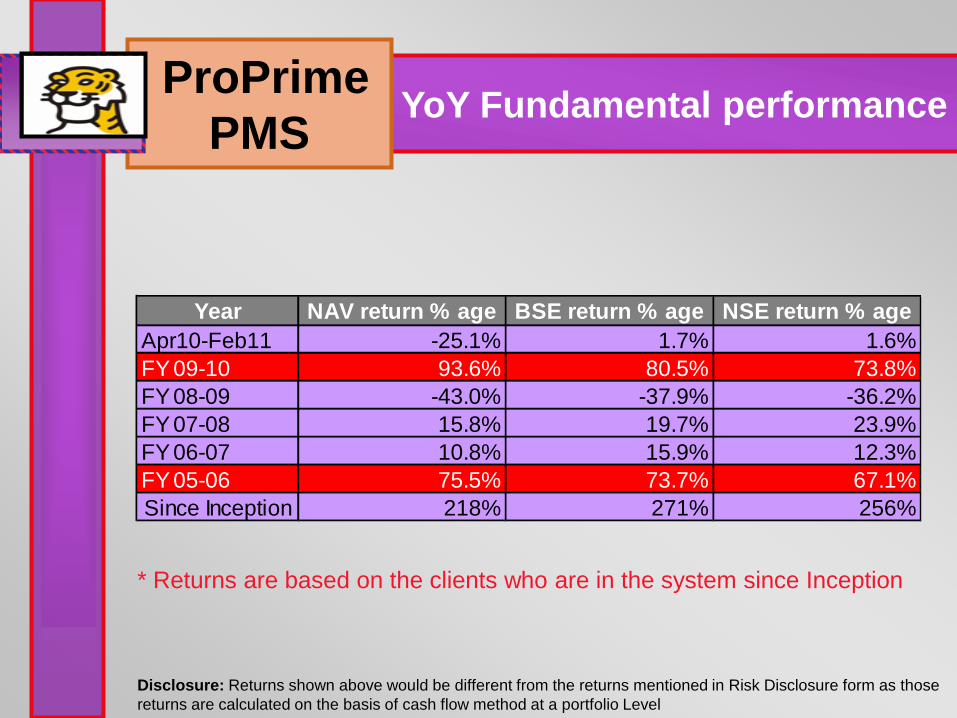
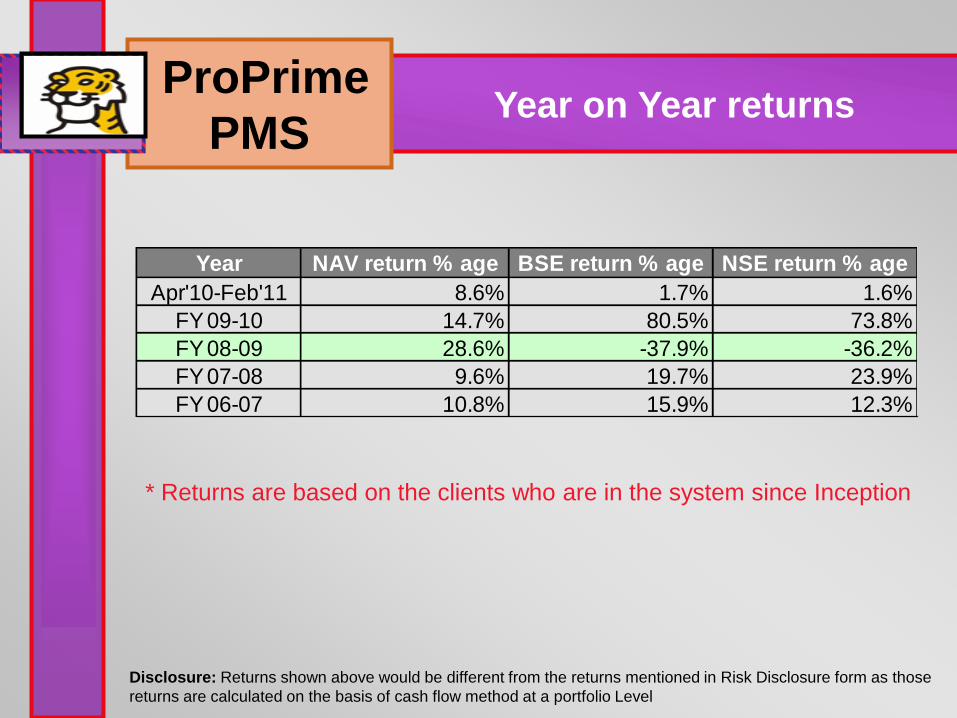
* Returns are based on the clients who are in the system since Inception
Disclosure: Returns shown above would be different from the returns mentioned in Risk Disclosure form as those
returns are calculated on the basis of cash flow method at a portfolio Level
Year NAV return % age BSE return % age NSE return % age
Apr10-Feb11 -25.1% 1.7% 1.6%
FY 09-10 93.6% 80.5% 73.8%
FY 08-09 -43.0% -37.9% -36.2%
FY 07-08 15.8% 19.7% 23.9%
FY 06-07 10.8% 15.9% 12.3%
FY 05-06 75.5% 73.7% 67.1%
Since Inception 218% 271% 256%
YoY Fundamental performanceProPrime
PMS
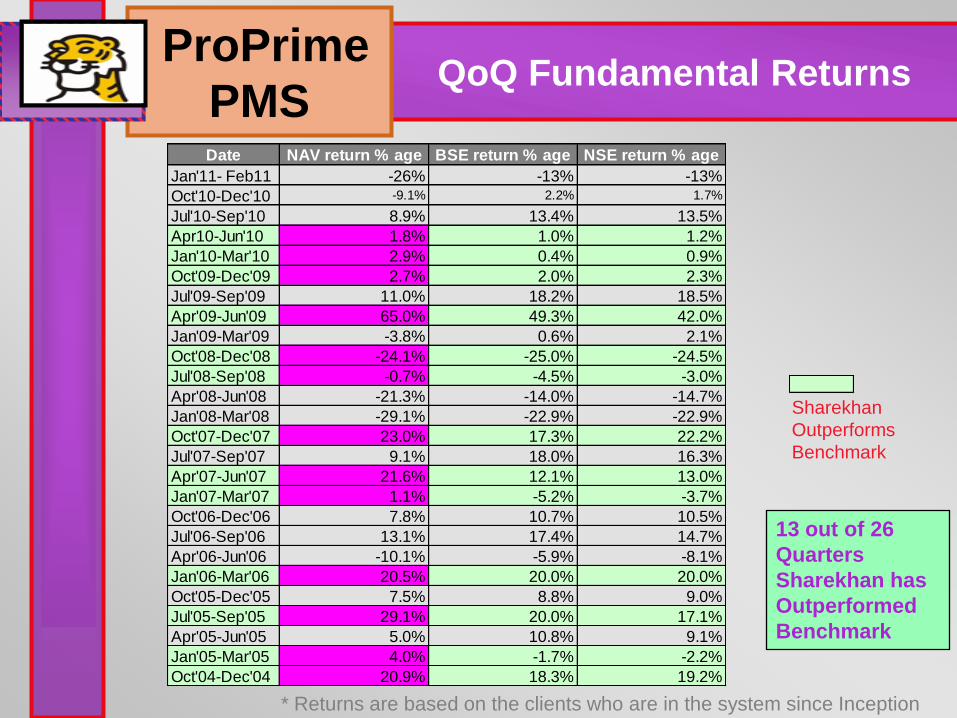
Sharekhan
Outperforms
Benchmark
13 out of 26
Quarters
Sharekhan has
Outperformed
Benchmark
* Returns are based on the clients who are in the system since Inception
Date NAV return % age BSE return % age NSE return % age
Jan'11- Feb11 -26% -13% -13%
Oct'10-Dec'10 -9.1% 2.2% 1.7%
Jul'10-Sep'10 8.9% 13.4% 13.5%
Apr10-Jun'10 1.8% 1.0% 1.2%
Jan'10-Mar'10 2.9% 0.4% 0.9%
Oct'09-Dec'09 2.7% 2.0% 2.3%
Jul'09-Sep'09 11.0% 18.2% 18.5%
Apr'09-Jun'09 65.0% 49.3% 42.0%
Jan'09-Mar'09 -3.8% 0.6% 2.1%
Oct'08-Dec'08 -24.1% -25.0% -24.5%
Jul'08-Sep'08 -0.7% -4.5% -3.0%
Apr'08-Jun'08 -21.3% -14.0% -14.7%
Jan'08-Mar'08 -29.1% -22.9% -22.9%
Oct'07-Dec'07 23.0% 17.3% 22.2%
Jul'07-Sep'07 9.1% 18.0% 16.3%
Apr'07-Jun'07 21.6% 12.1% 13.0%
Jan'07-Mar'07 1.1% -5.2% -3.7%
Oct'06-Dec'06 7.8% 10.7% 10.5%
Jul'06-Sep'06 13.1% 17.4% 14.7%
Apr'06-Jun'06 -10.1% -5.9% -8.1%
Jan'06-Mar'06 20.5% 20.0% 20.0%
Oct'05-Dec'05 7.5% 8.8% 9.0%
Jul'05-Sep'05 29.1% 20.0% 17.1%
Apr'05-Jun'05 5.0% 10.8% 9.1%
Jan'05-Mar'05 4.0% -1.7% -2.2%
Oct'04-Dec'04 20.9% 18.3% 19.2%
QoQ Fundamental ReturnsProPrime
PMS

Long Short strategies based on
Technical Analysis
ProTech PMS

1991 1992 1993 1994 1995 1996 1997 1998 1999 2000 2001 2002 2003
50000
x1000
1500
2000
2500
3000
3500
4000
4500
5000
5500
6000
6500
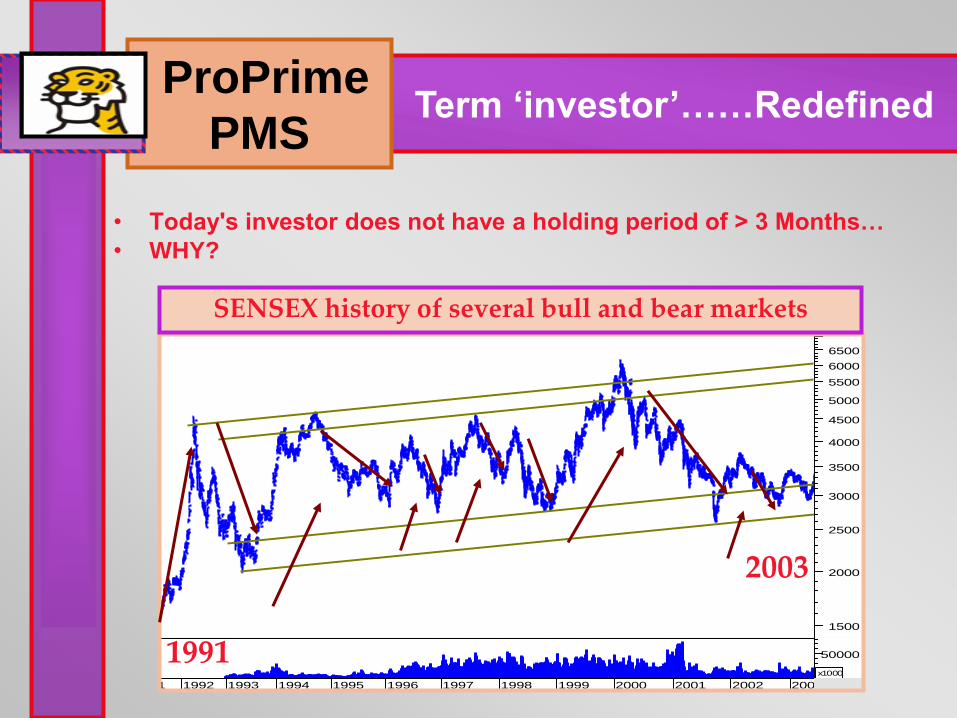
1991
2003
• Today's investor does not have a holding period of > 3 Months…
• WHY?
SENSEX history of several bull and bear markets
Term ‘investor’……RedefinedProPrime
PMS

Buy and Hold strategy did not work during 90s. Again failed during 2006-2010
Need to play both sides of the market!
Term ‘investor’……RedefinedProPrime
PMS
SENSEX

Warren Buffet = Wealth;
Because = 30% CAGR up to Y2000
Focus on performance and not out performance
Absolute returns at end of year with defined risk appetite
Result = CAGR = Wealth creation.
CAGR = WealthProPrime
PMS

REASON # 1
Trading is a Discipline
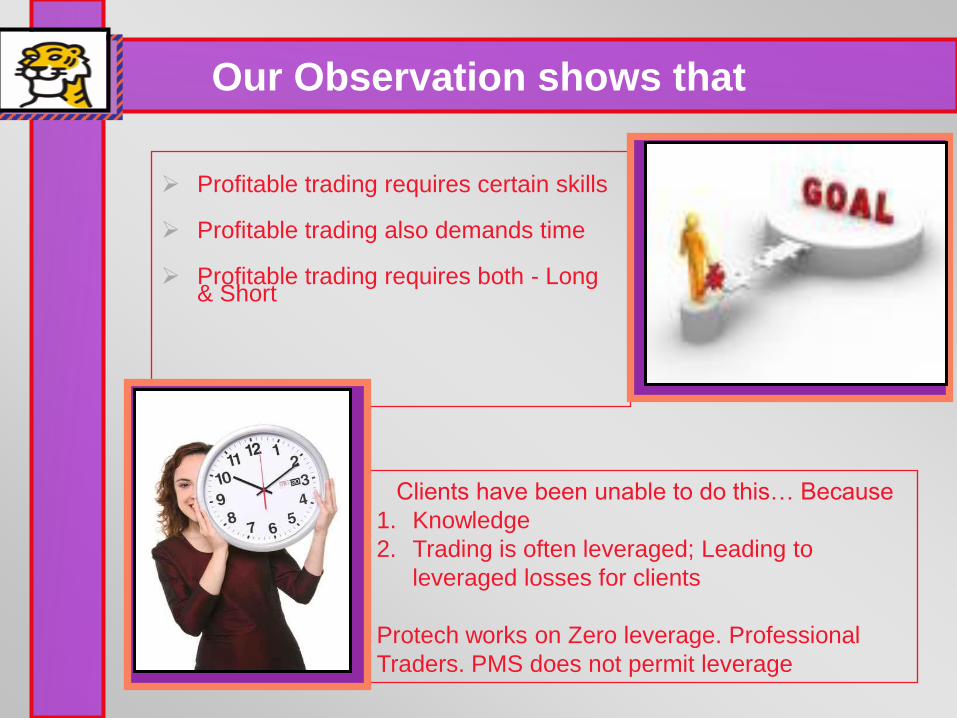
Profitable trading requires certain skills
Profitable trading also demands time
Profitable trading requires both - Long & Short
Clients have been unable to do this… Because
1. Knowledge
2. Trading is often leveraged; Leading to
leveraged losses for clients
Protech works on Zero leverage. Professional
Traders. PMS does not permit leverage
Our Observation shows that

LONG SHORT STRATEGIES
ABSOLUTE RETURN STRATEGIES
Using technical analysis for
Timing the market Building products with different risk/reward/volatility
profiles
Risk
Rew
ard
Investors Need
Legally sound – SEBI regulation,
safety for clients funds in his name
Zero leverage allowed under PMS.
Full fund utility – 100% exposure +
Cash in liquid funds
No lock in period, High liquidity,
payout in 3 days
Why ProTech PMS

Transparent Fees structure
Zero AMC fees, Profit objective is
clear – C/f of losses before fees.
Why ProTech PMS
Long term Track
record
All the above offer
edge over MFs
Aim :
Absolute returns irrespective
of direction of markets
How it WorksProTech
PMS

How it WorksProTech
PMS
NiftyThrifty :
Trades long and short depending on the trend
prevalent in the markets
Using a mathematical model with no human
intervention. Model back- tested for 30 years to give
excellent prediction of market direction
While trades in Nifty futures, it is a
non-leveraged product
Absolute

Our Offerings: Nifty Thrifty ProTech
PMS
Nifty futures bought and sold on the basis of an automated trading system generated calls
Excellent track record
on back-testing and
even in live performance
Knowledge of technical analysis and power of derivatives to identify trading opportunity in the market
PhilosphyProTech
PMS
Long Short Strategies
Focus on absolute returns

ProTech PMS
79 81 83 85 87 89 91 93 95 96 97 98 99 00 01 02 03 04 05 06 07 08 010
5000
1000015000
x10000
Rs. 1,000 invested in 1979
would be 6,40,81,524 today –
if profits were reinvested.
The rising green line shows
the rising value of a portfolio
in a straight line during
several bull and bear markets.
This is what we call
Linearity Of Returns.

Nifty Thrifty NAV Movement

Nifty Thrifty
Sensex
Nifty Thrifty vs Sensex Movement

*Tested on historical performance on Sensex [CY] Model has consistently performed over 30 years
Date % Sensex System Date % Sensex System
1979 ------ ------ 1995 -21% 34%
1980 25% 25% 1996 -1% 33%
1981 54% 25% 1997 19% 55%
1982 4% 22% 1998 -16% 62%
1983 7% 26% 1999 64% -1%
1984 7% 8% 2000 -21% 87%
1985 94% 127% 2001 -18% 67%
1986 -1% 42% 2002 4% 14%
1987 -16% 34% 2003 73% 63%
1988 51% 44% 2004 13% 41%
1989 17% 7% 2005 42% 44%
1990 35% 76% 2006 47% 38%
1991 82% 17% 2007 47% 13%
1992 37% 261% 2008 -52% 83%
1993 28% 81% 2009 81% 33%
1994 17% 54% 2010 17% 12%
Historical PerformanceProTech
PMS
* Returns are based on the clients who are in the system since Inception
Disclosure: Returns shown above would be different from the returns mentioned in Risk Disclosure form as those
returns are calculated on the basis of cash flow method at a portfolio Level
Year on Year returnsProPrime
PMS
Year NAV return % age BSE return % age NSE return % age
Apr'10-Feb'11 8.6% 1.7% 1.6%
FY 09-10 14.7% 80.5% 73.8%
FY 08-09 28.6% -37.9% -36.2%
FY 07-08 9.6% 19.7% 23.9%
FY 06-07 10.8% 15.9% 12.3%

• Out of 20 quarters
of performance, 14
quarters have given
positive returns
•Peak return in a
quarter has been
33% whereas lowest
return has been -
11%
* Returns are based on the clients who are in the system since Inception
Date NAV return % age BSE return % age NSE return % age
Jan'11 - Feb11 4.49% -13% -13%
Oct'10-Dec'10 5.06% 2.19% 1.73%
Jul'10-Sep'10 -1.45% 13.38% 13.50%
Apr10-Jun'10 0.40% 0.99% 1.21%
Jan'10-Mar'10 1.83% 0.36% 0.92%
Oct'09-Dec'09 -6.21% 1.97% 2.30%
Jul'09-Sep'09 -9.92% 18.17% 18.48%
Apr'09-Jun'09 33.28% 49.29% 42.04%
Jan'09-Mar'09 -8.45% 0.63% 2.09%
Oct'08-Dec'08 16.21% -24.98% -24.53%
Jul'08-Sep'08 6.53% -4.47% -2.95%
Apr'08-Jun'08 13.46% -13.95% -14.66%
Jan'08-Mar'08 18.68% -22.88% -22.87%
Oct'07-Dec'07 -11.75% 17.33% 22.25%
Jul'07-Sep'07 9.24% 18.02% 16.28%
Apr'07-Jun'07 -4.18% 12.07% 13.00%
Jan'07-Mar'07 1.83% -5.18% -3.65%
Oct'06-Dec'06 5.47% 10.70% 10.53%
Jul'06-Sep'06 2.87% 17.39% 14.71%
Apr'06-Jun'06 0.28% -5.95% -8.06%
Quarter on Quarter returnsProPrime
PMS

DateNifty Thrifty
NAV
Equivalent
Sensex NAV
Equivalent
Nifty NAV
Nifty Thrifty
NAV
Equivalent
Sensex NAV
Equivalent
Nifty NAV
Nifty Thrifty
NAV
Equivalent
Sensex NAV
Equivalent
Nifty NAV
1st April'06 1,000,000 1,000,000 1,000,000
1st April'07 1,108,002 1,158,878 1,123,143 1,000,000 1,000,000 1,000,000
1st April'08 1,214,758 1,386,923 1,391,456 1,096,350 1,196,781 1,238,895 1,000,000 1,000,000 1,000,000
1st April'09 1,562,091 860,686 887,849 1,409,826 742,689 790,504 1,285,927 620,572 638,072
1st April'10 1,791,219 1,553,886 1,542,696 1,616,621 1,340,853 1,373,553 1,474,548 1,120,383 1,108,692
31st Dec'10 1,862,017 1,818,188 1,802,913 1,680,518 1,568,921 1,605,239 1,532,830 1,310,951 1,295,702
Nifty Thrifty Comparative performance viz-a-viz Sensex/ NiftyRs 10 lakhs invested in 2006-07 Rs 10 lakhs invested in 2007-08 Rs 10 lakhs invested in 2008-09
DateNifty Thrifty
NAV
Equivalent
Sensex NAV
Equivalent
Nifty NAV
Nifty Thrifty
NAV
Equivalent
Sensex NAV
Equivalent
Nifty NAV
1st April'06
1st April'07
1st April'08
1st April'09 1,000,000 1,000,000 1,000,000
1st April'10 1,146,681 1,805,405 1,737,566 1,000,000 1,000,000 1,000,000
31st Dec'10 1,192,003 2,112,488 2,030,653 1,039,525 1,170,091 1,168,677
Nifty Thrifty Tool ProTech
PMS
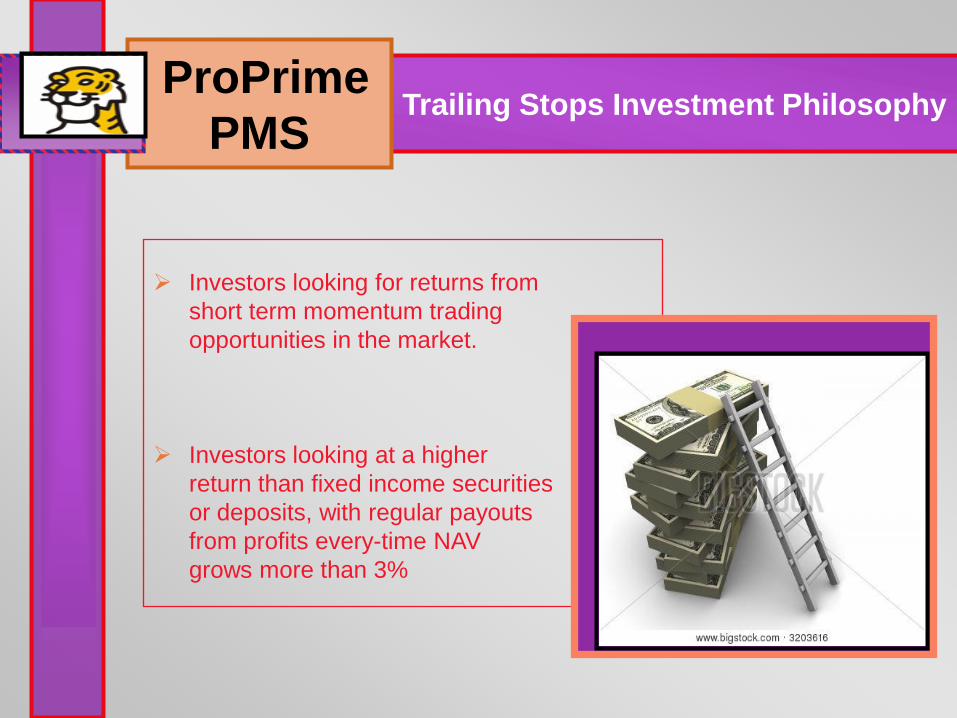
Investors looking for returns from
short term momentum trading
opportunities in the market.
Investors looking at a higher
return than fixed income securities
or deposits, with regular payouts
from profits every-time NAV
grows more than 3%
Trailing Stops Investment PhilosophyProPrime
PMS
Above average returns but not high risk trades. Risk per trade is 2-3%
1:2 risk reward ratio. Risk managed with the use of trailing stop losses on an intraday basis.
Treasury income from idle cash.
Trailing Stops Investment PhilosophyProPrime
PMS

Will trade on the long and short side of the market
Will trade in liquid stocks and mostly in stock and index futures listed on the F&O market
Exposure will not exceed value of the portfolio i.e. there will be no leverage
Exposure per trade will be max 15% of portfolio
Maximum drawdown not to exceed 20% intra year.
Trailing Stops Investment PhilosophyProTech
PMS
Moderate Risk – High Return product
ProTech – DiversifiedTrading shorter term with long term approach

“To generates absolute Return
consistently through disciplined
trading in a balanced diversified
portfolio with calculative risk.”
AimProTech
Diversified
Linearity of returns: Hedge against volatility.
Protecting capital in non-trending phase.
Key FeaturesProTech
Diversified
Ability to outperformed the benchmark on long-term basis.
Natural hedge to the portfolio as it can generate return in
downward market as well.
Profit payout on regular basis.
Balanced diversified portfolio with
exposure across sectors.
Disciplined trading approach with no human intervention.
Incorporated money management techniques that seek to control losses and protect profits.
Key FeaturesProTech
Diversified
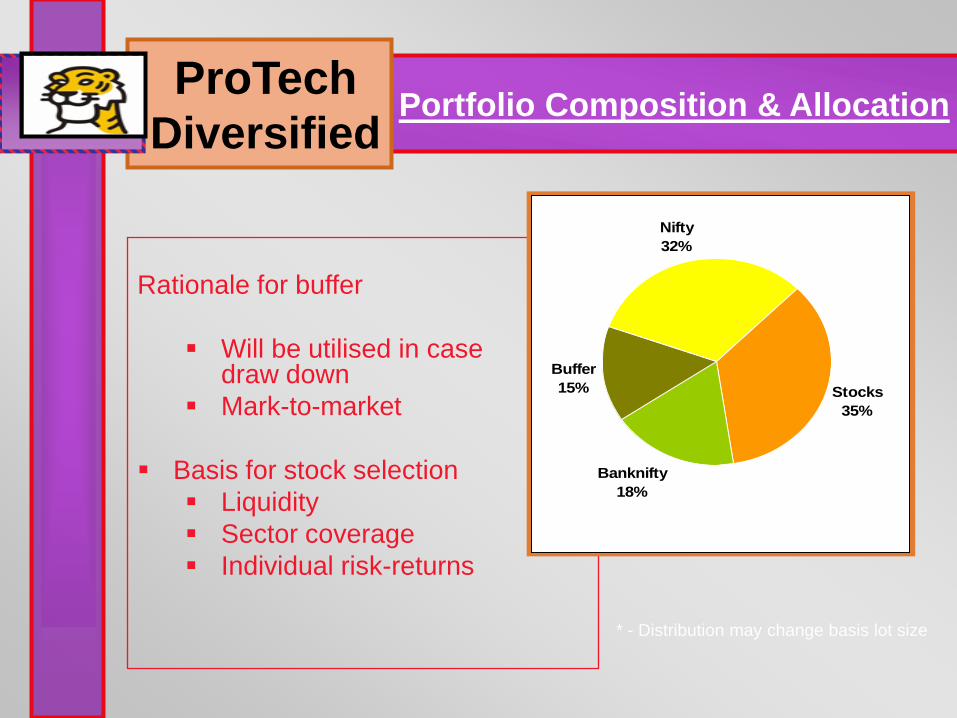
Rationale for buffer
Will be utilised in case of draw down
Mark-to-market
Basis for stock selection
Liquidity
Sector coverage
Individual risk-returns
Nifty
32%
Stocks
35%
Banknifty
18%
Buffer
15%
* - Distribution may change basis lot size
Portfolio Composition & AllocationProTech
Diversified

0
200
400
600
800
1000
1200
2-Jan
-06
2-Apr-0
6
2-Ju
l-06
2-O
ct-06
2-Jan
-07
2-Apr-0
7
2-Ju
l-07
2-O
ct-07
2-Jan
-08
2-Apr-0
8
2-Ju
l-08
2-O
ct-08
2-Jan
-09
2-Apr-0
9
2-Ju
l-09
2-O
ct-09
2-Jan
-10
2-Apr-1
0
2-Ju
l-10
2-O
ct-10
ProTech Diversified

•System is tested from 1 Jan 2006 to 31 Dec 2010
•Returns are pre-cost
Year
System
Returns
Nifty
Returns
2006 42% 40%
2007 45% 55%
2008 55% -52%
2009 49% 72%
2010 17% 18%
Results of our back testing - AnnualProTech
Diversified
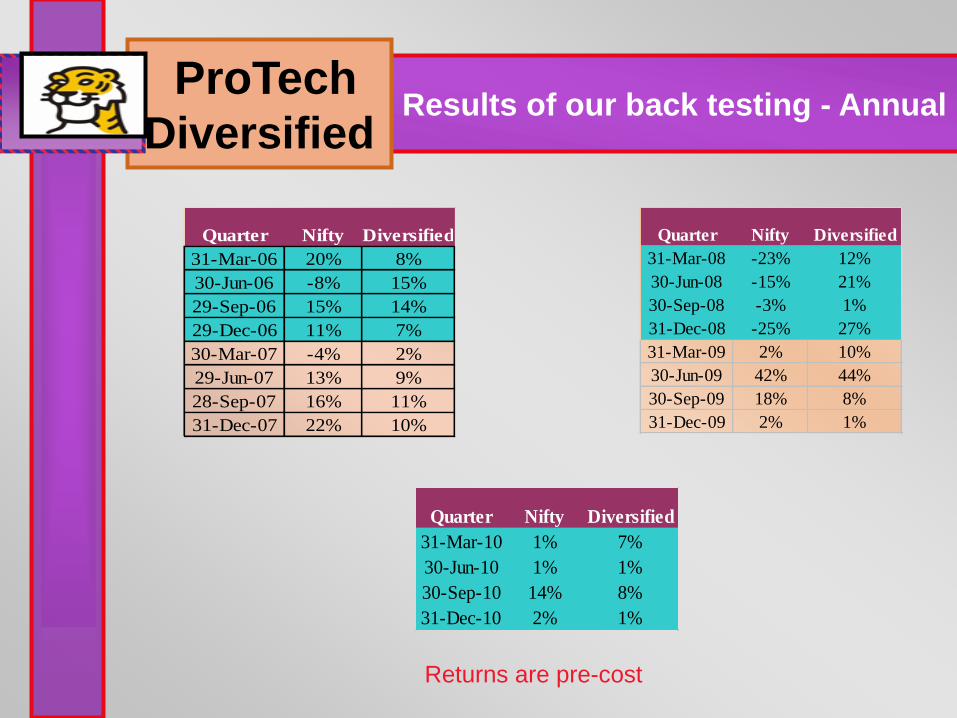
Returns are pre-cost
Quarter Nifty Diversified
31-Mar-06 20% 8%
30-Jun-06 -8% 15%
29-Sep-06 15% 14%
29-Dec-06 11% 7%
30-Mar-07 -4% 2%
29-Jun-07 13% 9%
28-Sep-07 16% 11%
31-Dec-07 22% 10%
Quarter Nifty Diversified
31-Mar-08 -23% 12%
30-Jun-08 -15% 21%
30-Sep-08 -3% 1%
31-Dec-08 -25% 27%
31-Mar-09 2% 10%
30-Jun-09 42% 44%
30-Sep-09 18% 8%
31-Dec-09 2% 1%
Quarter Nifty Diversified
31-Mar-10 1% 7%
30-Jun-10 1% 1%
30-Sep-10 14% 8%
31-Dec-10 2% 1%
Results of our back testing - AnnualProTech
Diversified
Volatility contraction.
Basis Slippage.
No clear trend.
2010 good for Absolute Return Products?ProTech
Diversified
Changes already made:
Replaced RNRL with REC Ltd.
Replaced HDIL with
JP-associate.
Increased stock exposure
from 3% to 3.5%.
Steps taken :ProTech
Diversified
Changes under consideration:
Increasing the stock exposure
further.
Introducing high beta stocks in
place of low beta stocks.
Increasing Bank nifty exposure.

Diversified Vs Nifty
-50%
0%
50%
100%
150%
200%
250%F
-06
J-0
6
O-0
6
F-0
7
J-0
7
O-0
7
F-0
8
J-0
8
O-0
8
F-0
9
J-0
9
O-0
9
F-1
0
J-1
0
O-1
0
Percentage return
Tim
e
NiftyDiversified
ProTech Diversified Vs NiftyProTech
Diversified

Non Toggle system
Not always invested – Will stay out during sideways market to reduce drawdown risk
Constant Risk Exposure
Exposure to investments will be constant even after gains
Helps in protecting the gains
Buffer Reinvesting in case of
draw-downs helps in faster
recovery.
Uniqueness of this productProTech
Diversified
Client will be given 50% of profits
on quarterly basis
Non – leveraged product

* Returns are based on the clients who are in the system since Inception
Disclosure: Returns shown above would be different from the returns
mentioned in Risk Disclosure form as those returns are calculated on the
basis of cash flow method at a portfolio Level
Date NAV return % age BSE return % age NSE return % age
Jan'11 - Feb'11 5.96% -13.10% -13.06%
Oct'10-Dec'10 1.77% 2.19% 1.73%
Jul'10-Sep'10 6.3% 13.4% 13.5%
Apr10-Jun'10 -1.4% 0.1% 0.4%
Since Inception 11.05% 3.59% 4.07%
QoQ ProTech Diversified ReturnsProTech
Diversified
Minimum Investment:
Indian Resident Rs 5 lakhs,
Our OfferingsProTech
PMS
Fees
AMC fees : 0%
Brokerage : 0.05% only
Profit Sharing :20% profit sharing on
booked profits on
quarterly basis

PROCESS
Details of How PMS Works..
TAXATION

Adjusting profits:
Profits are adjusted against the
expenses borne for maintaining
the PMS A/c which is available
in the ledger
Computation of TaxProPrime
PMS
Other charges:
Profit Sharing, Brokerage charges & any other charges are to be treated as expenses borne for the PMS A/c.
Short Term Capital Gains are charged at 33% on realised gains
Other charges: Profit Sharing, Brokerage charges & any other charges are to be treated as expenses borne for the PMS A/c
Computation of TaxProTech
PMS

Free your time & have fun
– Invest in Sharekhan PMS

Thank You