sharepoint moneyball… …a practical framework for winning the sharepoint metrics game july 24,...
TRANSCRIPT

SharePoint Moneyball……a Practical Framework for Winning the SharePoint Metrics GameJULY 24, 2012
About Me
2
• Knowledge Management• Information Architecture• Portals• Collaboration Solutions• Governance, User
Adoption, Metrics
Expertise
• www.susanhanley.com• @susanhanley• [email protected]• 301-442-0127
• Led national Portals, Collaboration, and Content Management practice for Dell
• Director of Knowledge Management at American Management Systems
• President, Susan Hanley LLC
Experience
Find Me Main Event
3
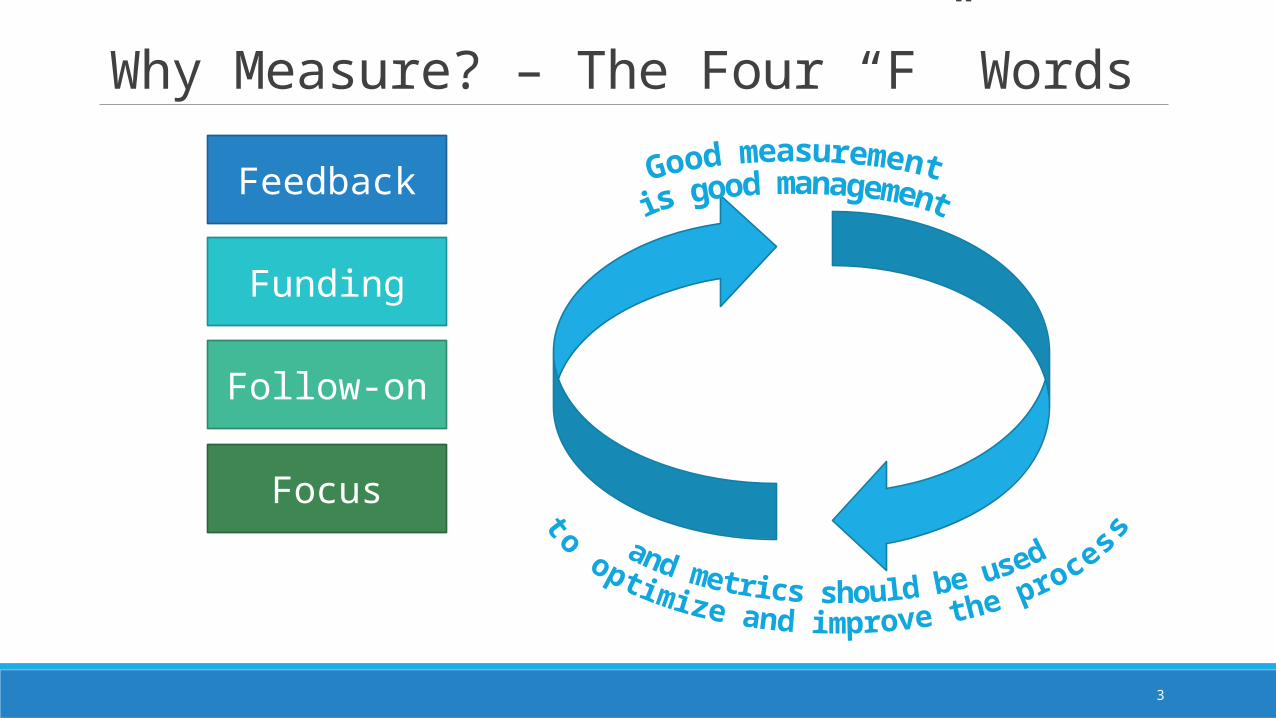
Why Measure? – The Four “F” Words
Feedback
Funding
Follow-on
Focus

4
Measurement throughout the life-cycle
Before
Make the business case
During
Provide a target
Make tradeoffs
Tune the implementation process
After
Develop benchmarks
Develop lessons learned

Measurement Process
5
1. What are the BUSINESS OBJECTIVES?
3. Who are the metrics STAKEHOLDERS?
5. How can we COLLECT the metrics?
4. What are the METRICS and how should we
PRESENT them?
Aid decision making
6. What do the metrics TELL US about how we
need to CHANGE?
Modify the process or tool
Modify the measures
2. How should the SOLUTION be DESIGNED to
meet the objectives?
6
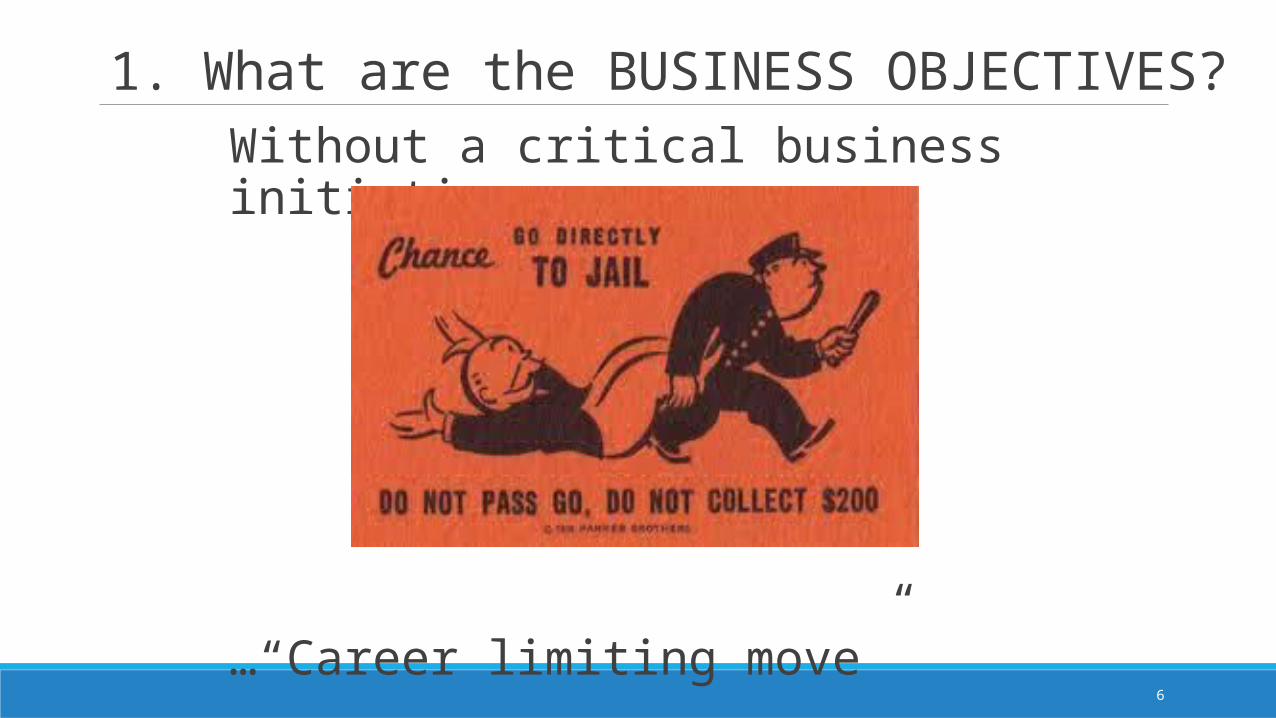
1. What are the BUSINESS OBJECTIVES?Without a critical business initiative …
…“Career limiting move”

7
It’s easy to go for the “motherhood” objectives …
More innovative products and servicesMore effective marketingBetter access to knowledgeLower cost of doing business – reduction in travel and other operational costsHigher revenuesImproved employee, customer, and partner satisfaction
8
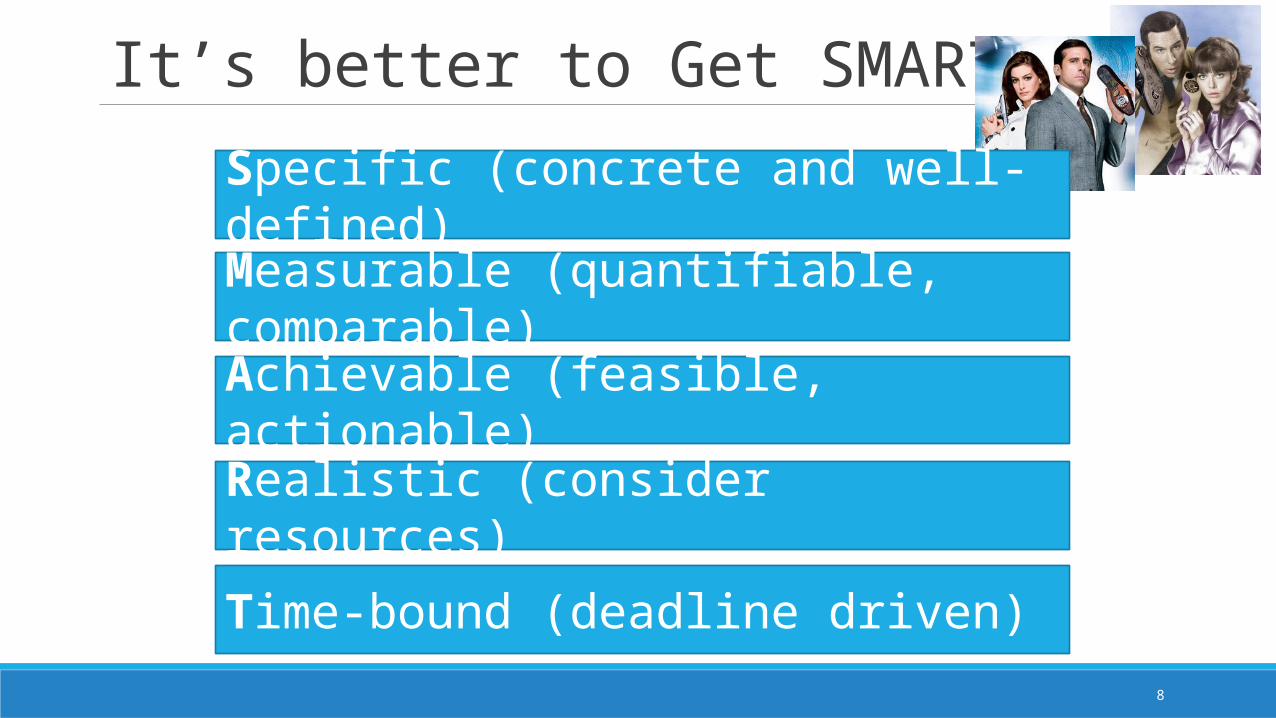
It’s better to Get SMART!
Measurable (quantifiable, comparable)
Achievable (feasible, actionable)
Realistic (consider resources)
Time-bound (deadline driven)
Specific (concrete and well-defined)
9
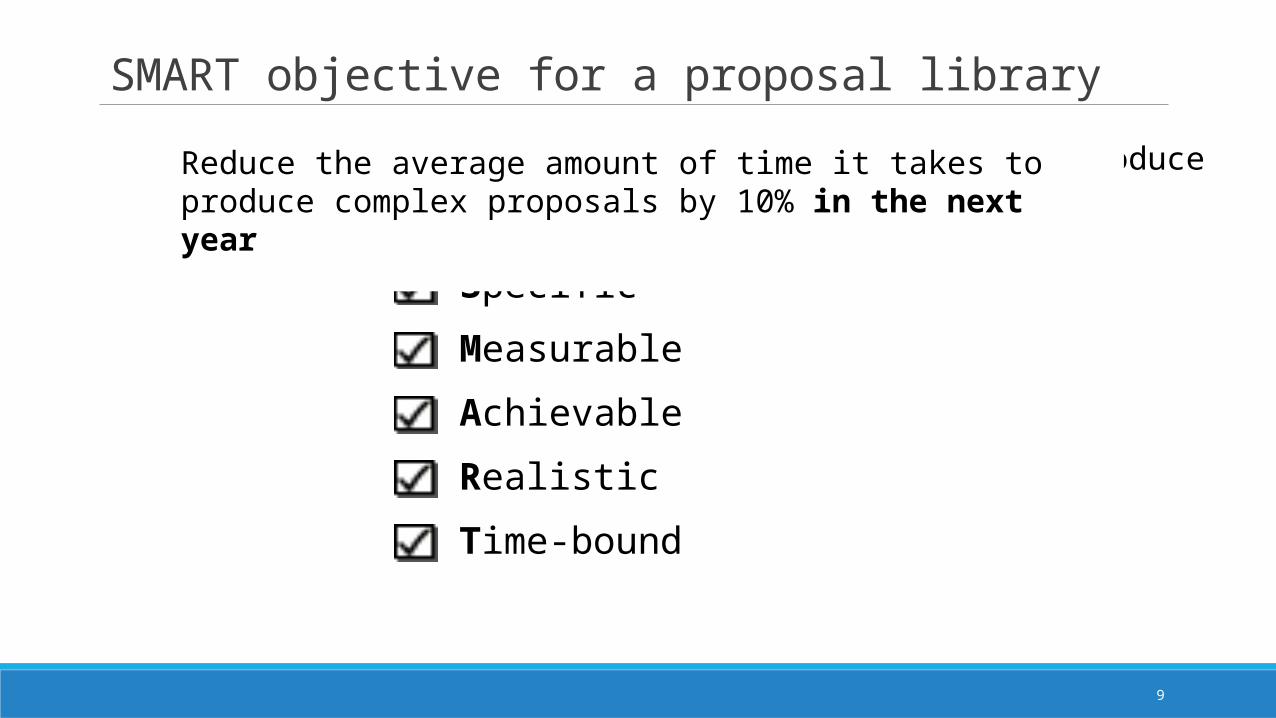
SMART objective for a proposal library
Reduce the average amount of time it takes to produce complex proposals by 10% in the next year
Specific
Measurable
Time-bound
Achievable
Realistic
Reduce the average amount of time it takes to produce complex proposals by 10% in the next year
Reduce the average amount of time it takes to produce complex proposals by 10% in the next yearReduce the average amount of time it takes to produce complex proposals by 10% in the next yearReduce the average amount of time it takes to produce complex proposals by 10% in the next year
10
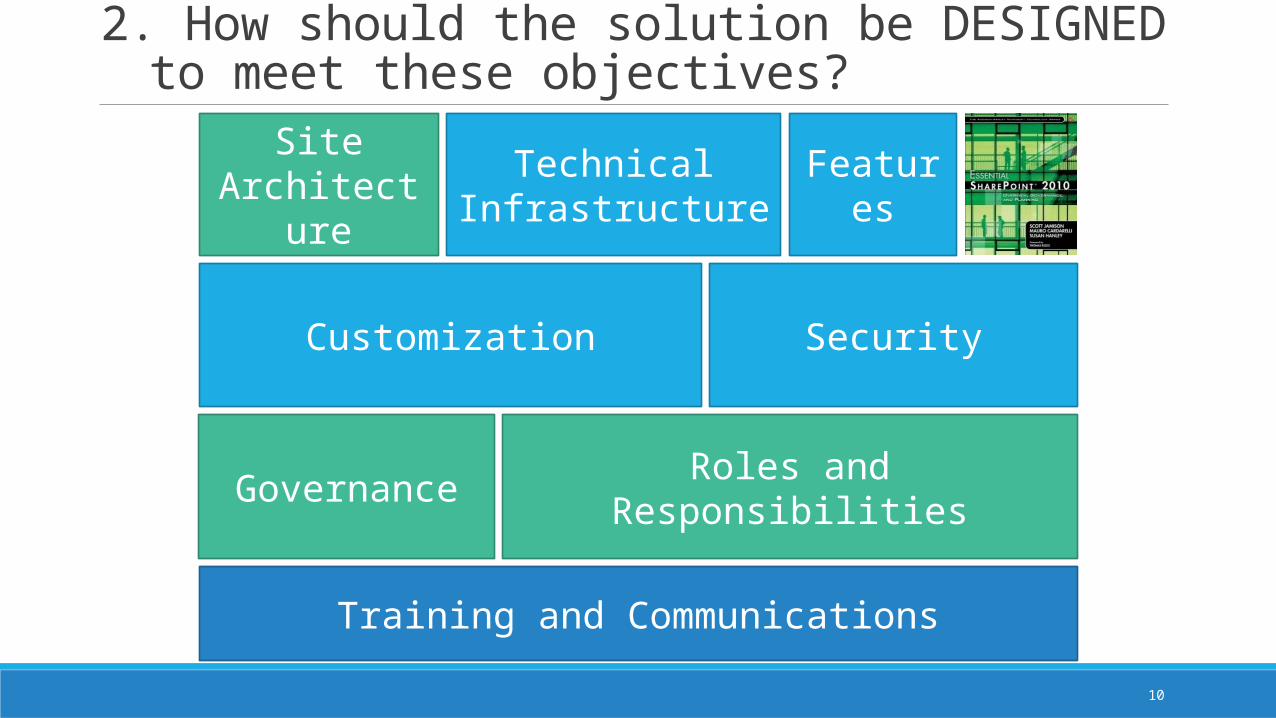
2. How should the solution be DESIGNED to meet these objectives?
Site Architecture
Technical Infrastructure Features
Customization Security
Governance Roles and Responsibilities
Training and Communications

11
3. Who are the metrics STAKEHOLDERS?
They’re at all levels - especially in the middleThey care about different things

12
For each key stakeholder, ask …
What counts?What keeps you up at night? What do you already use? What do I need to tell you?
Focus on the outcomes, then work backwards to figure out how you will
measure that outcome

13
4. What are the METRICS and how should we PRESENT them?
Identify the type• Quantitative• Qualitative
Consider the life-cycle
Establish a baseline
Gain commitment about targets
Decide the best way to communicate
14
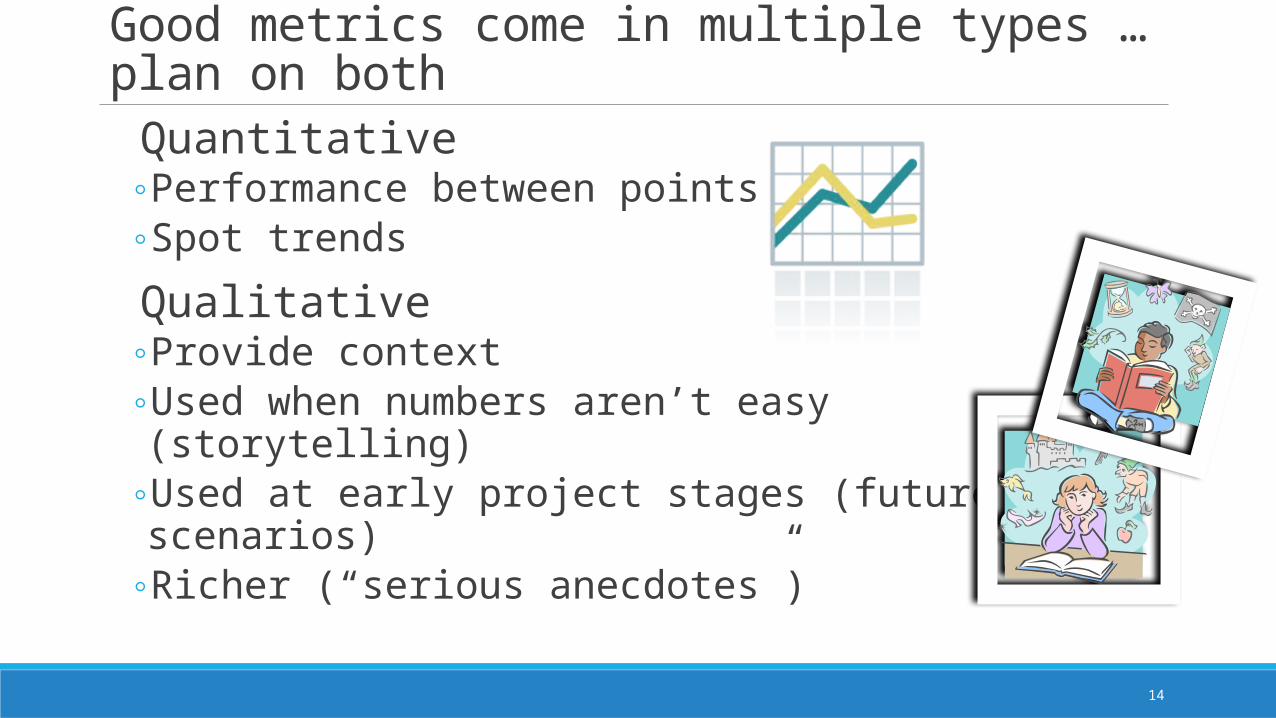
Good metrics come in multiple types … plan on both
Quantitative◦Performance between points◦Spot trends
Qualitative◦Provide context◦Used when numbers aren’t easy (storytelling)◦Used at early project stages (future scenarios)◦Richer (“serious anecdotes”)
15
Return on InvestmentPlatform investments: ◦ Traditional ROI (costs and benefits) ◦ Ongoing or trade-offs◦ ROI-lite
LINK
16
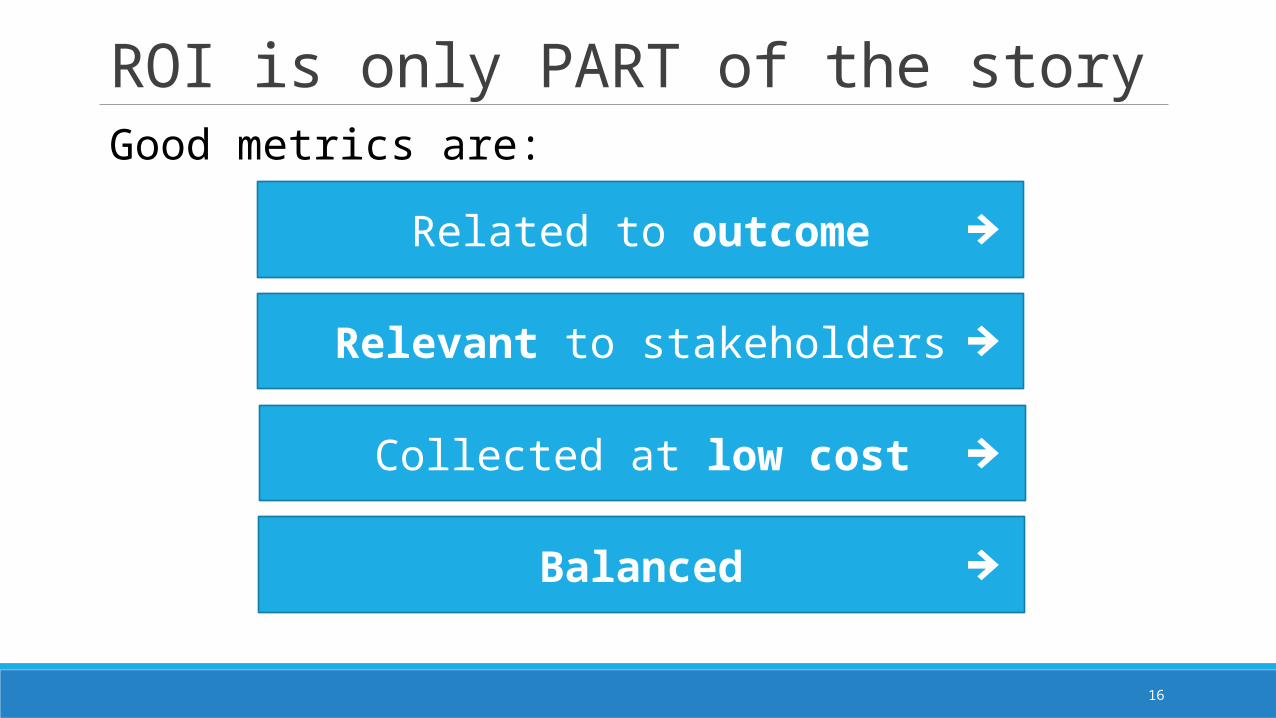
ROI is only PART of the storyGood metrics are:
Related to outcome
Relevant to stakeholders
Collected at low cost
Balanced
17
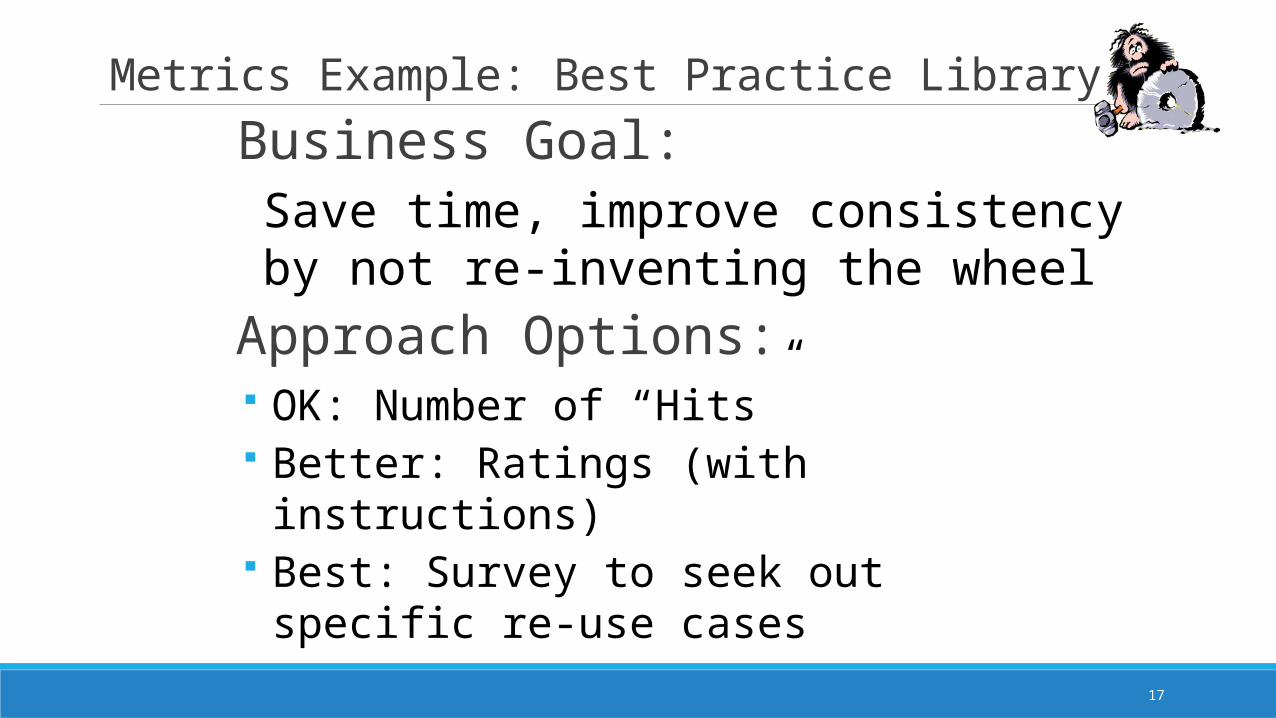
Metrics Example: Best Practice LibraryBusiness Goal:
Approach Options: OK: Number of “Hits” Better: Ratings (with instructions) Best: Survey to seek out specific re-
use cases
Save time, improve consistency by not re-inventing the wheel

18
x x x
Metrics Example: Prioritizing Projects (ROI-lite)
Business Goal:
Approach:
T = time on task (in minutes)E = number of employees performing that taskN = number of times per year a typical employee performs that taskS = average employee’s loaded salary per minute
Baseline ->Target ->Measure
Allocate limited SharePoint Resources
19
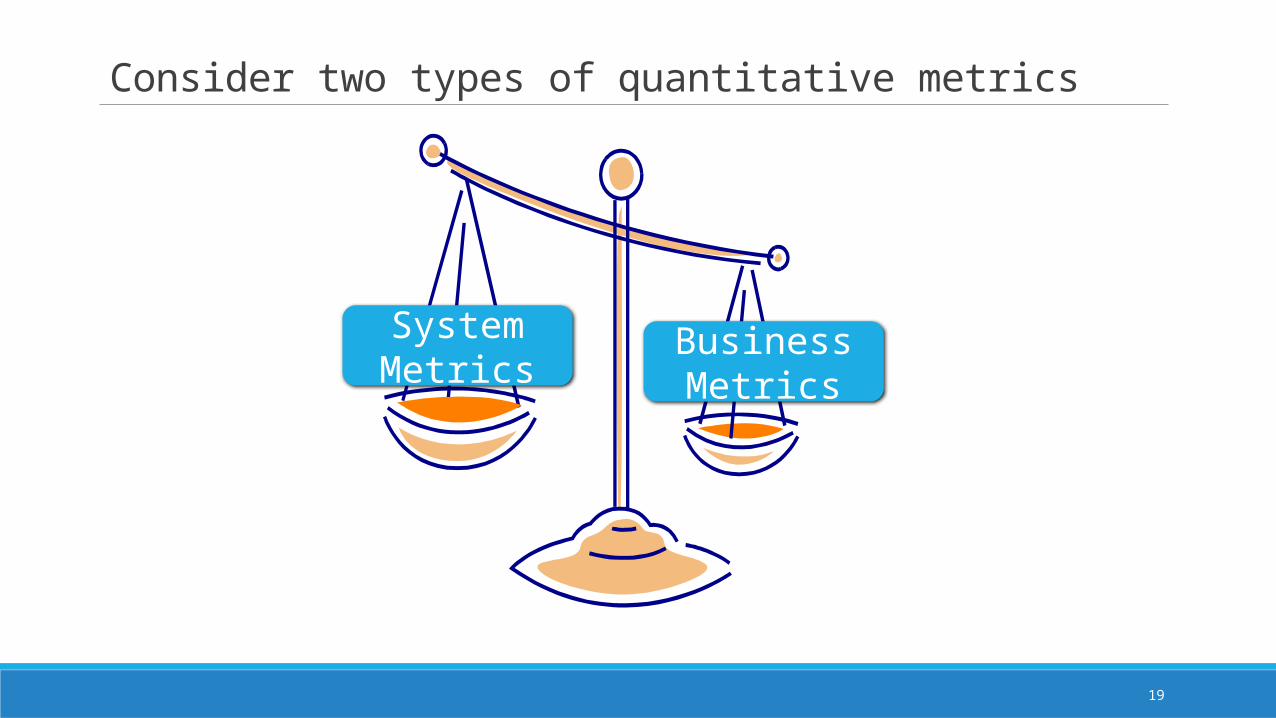
Consider two types of quantitative metrics
System Metrics
Business Metrics

20
Example of a System Metric
MORE
Top Queries (from Search)
“Trending” Content Promotable
Indicator for
21
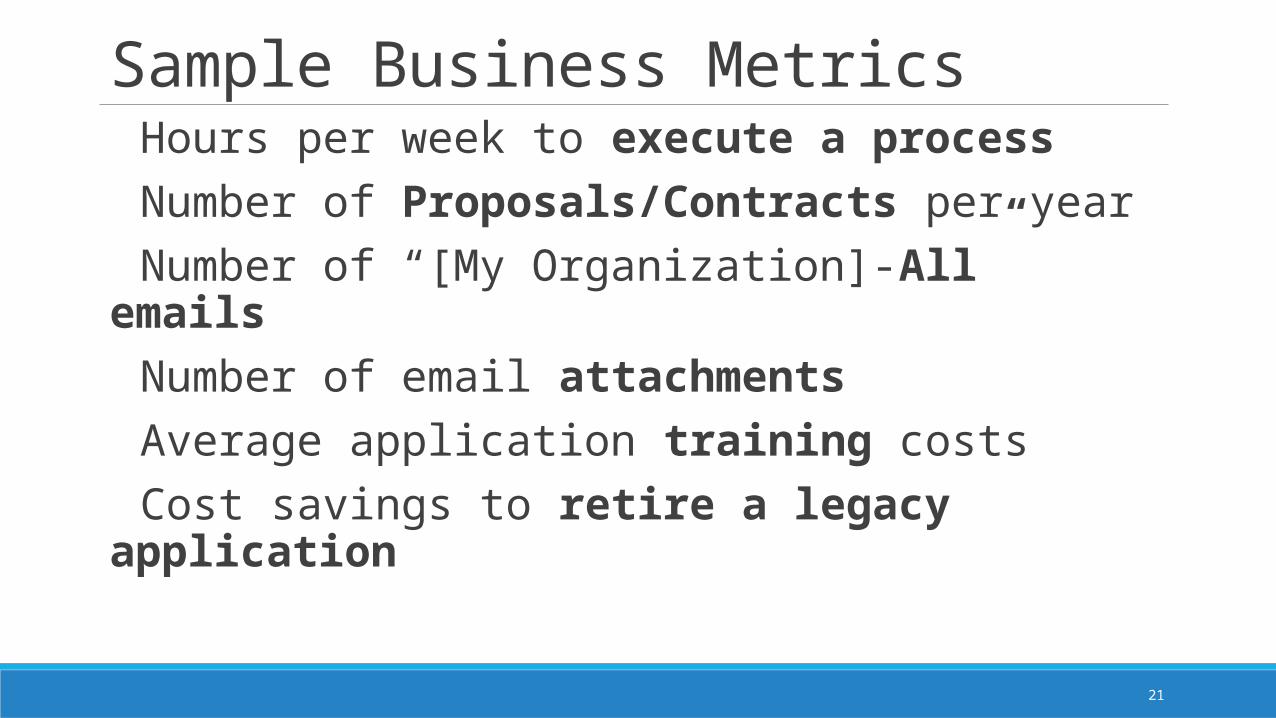
Sample Business MetricsHours per week to execute a processNumber of Proposals/Contracts per yearNumber of “[My Organization]-All” emailsNumber of email attachmentsAverage application training costsCost savings to retire a legacy application
22
Qualitative Metrics – the stories that drive it home
Keep it real
In the storyteller’s words
Serious Anecdotes
23
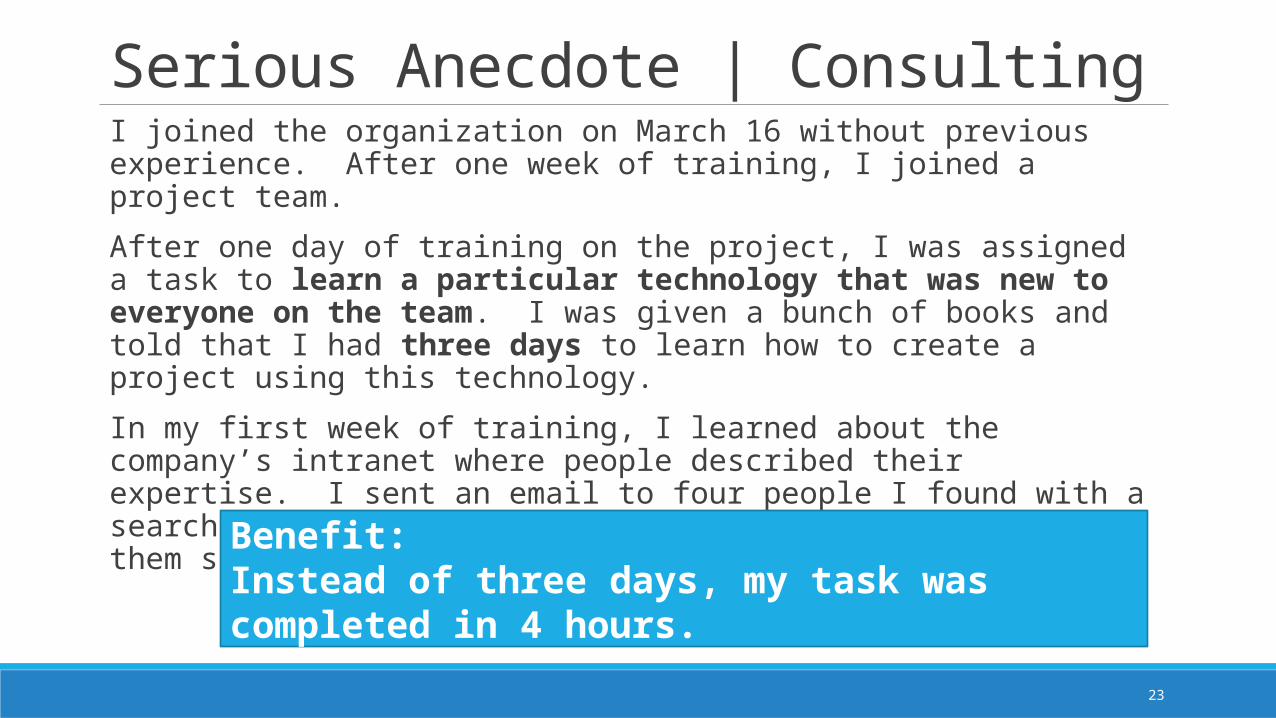
Serious Anecdote | ConsultingI joined the organization on March 16 without previous experience. After one week of training, I joined a project team.
After one day of training on the project, I was assigned a task to learn a particular technology that was new to everyone on the team. I was given a bunch of books and told that I had three days to learn how to create a project using this technology.
In my first week of training, I learned about the company’s intranet where people described their expertise. I sent an email to four people I found with a search for that technology asking for their help. One of them sent me a document containing exactly what I wanted.
Benefit: Instead of three days, my task was completed in 4 hours.
24
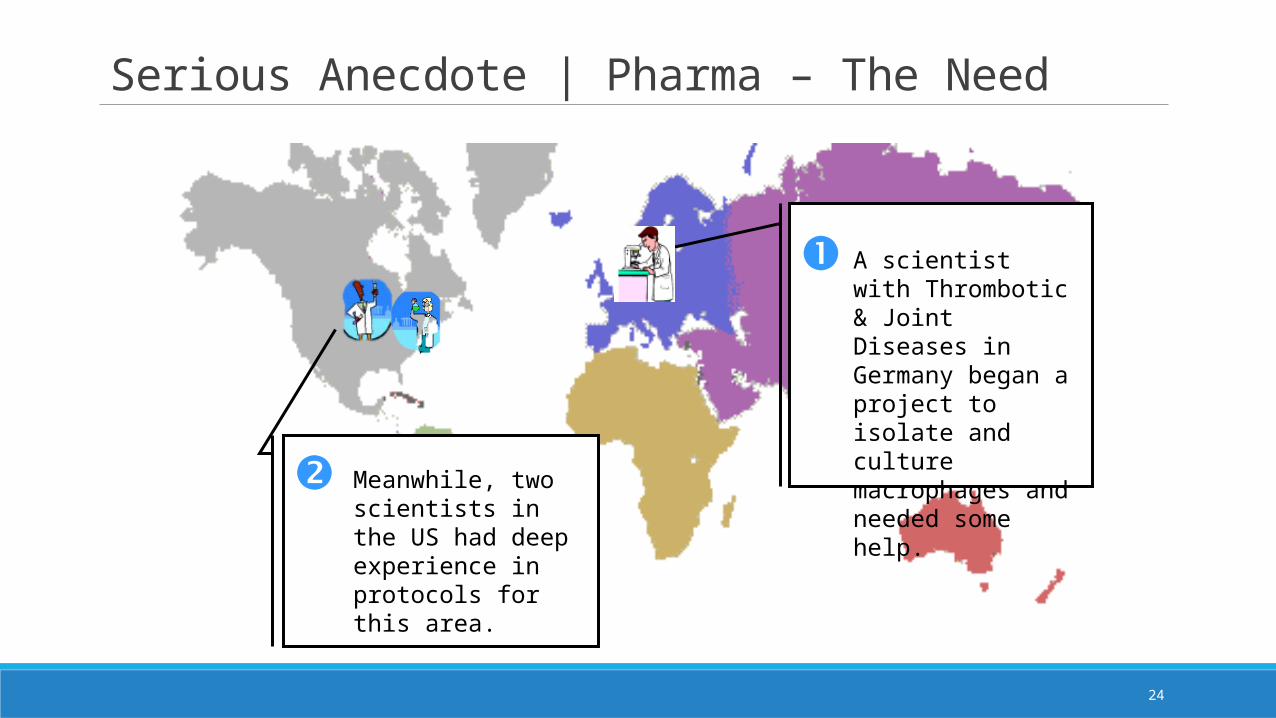
Serious Anecdote | Pharma – The Need
Meanwhile, two scientists in the US had deep experience in protocols for this area.
A scientist with Thrombotic & Joint Diseases in Germany began a project to isolate and culture macrophages and needed some help.

25
Serious Anecdote | Pharma – The Result
The German scientist consulted the expertise directory to find that expertise existed within the company and contacted the two US scientists he found in his search.
Both scientists quickly responded with assistance. One helped him with culturing protocols and the other helped him with information on magnetic cell sorting.
Benefit: The German scientist was able to leverage existing internal expertise and, in the process, reduce his research effort by four weeks.

26
Different Measures for Different Stages
Solu
tion
Mat
urity
Time
Use scenarios and simulations to explore projected results and effects.
Pre-Planning Phase
Use scenarios and simulations to explore projected results and effects.
Startup Phase
Use definitive metrics to show real value for business objectives.
Pilot Project Phase
Use mixture of metrics to show value across the organization.
Enterprise Growth Phase
EXAMPLES

27
How do you spell success? Have a Baseline and Target
28
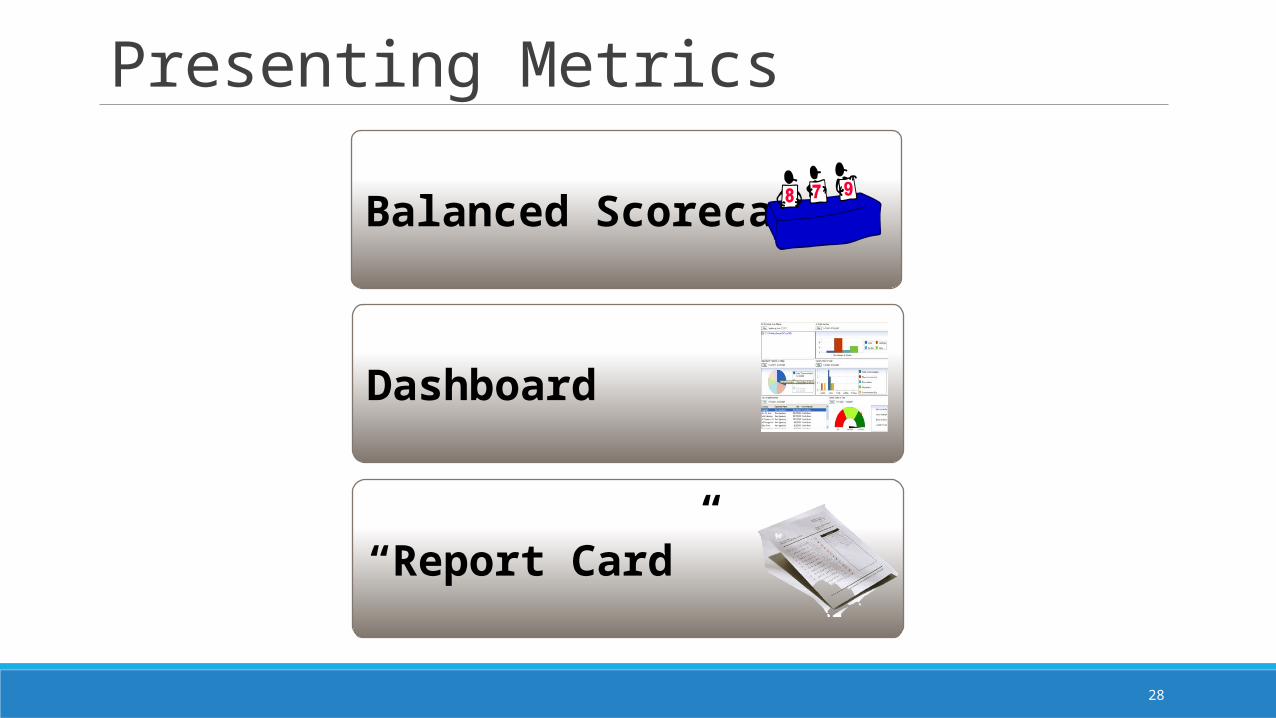
Presenting Metrics
Balanced Scorecard
Dashboard
“Report Card”

29
Balanced Scorecard Dimensions
Capabilities
Health
Business Value
30
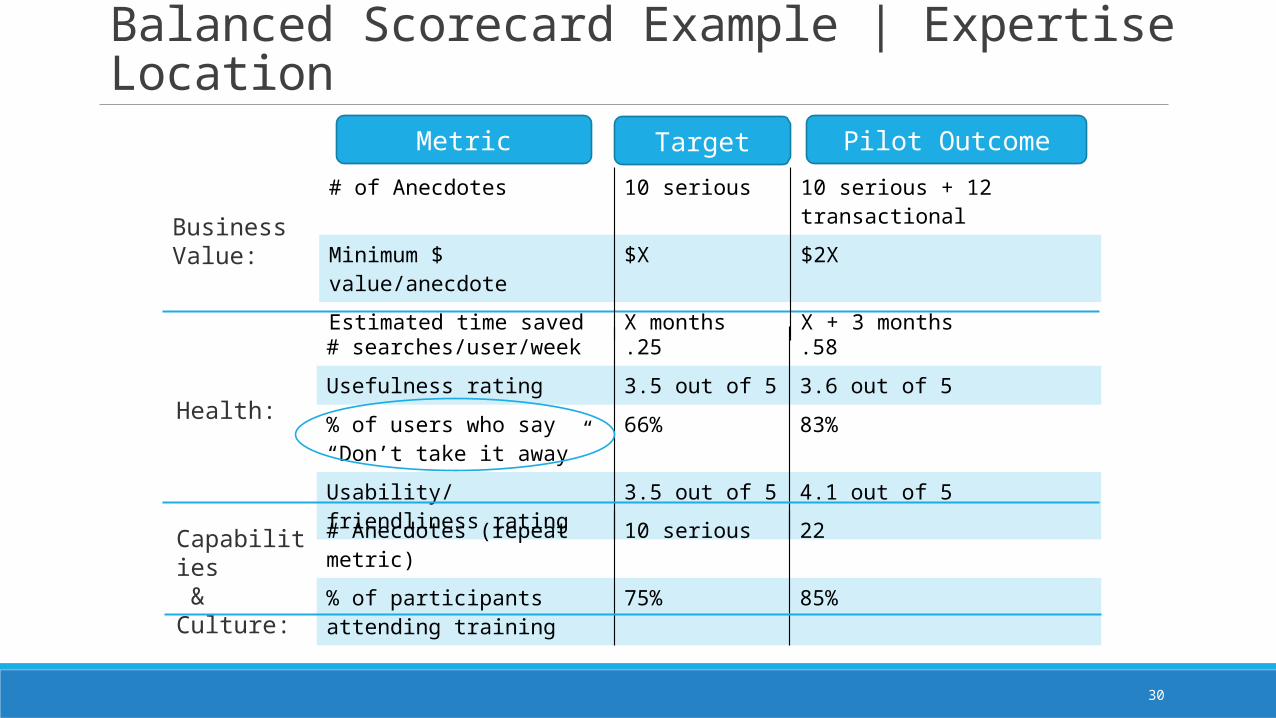
Balanced Scorecard Example | Expertise Location
Business Value:
Health:
Capabilities & Culture:
Metric Target Pilot Outcome
# searches/user/week .25 .58
Usefulness rating 3.5 out of 5 3.6 out of 5
% of users who say “Don’t take it away”
66% 83%
Usability/friendliness rating 3.5 out of 5 4.1 out of 5
# Anecdotes (repeat metric) 10 serious 22
% of participants attending training
75% 85%
# of Anecdotes 10 serious 10 serious + 12 transactional
Minimum $ value/anecdote $X $2X
Estimated time saved X months X + 3 months

31
5. How can we collect the metrics?Try not to over-achieve – balance counting with “doing”Automate where possibleGet creative when it comes to qualitative metrics
Ask◦ Survey◦ Usability Testing◦ Active Listening
Seek◦ Send out a “journalist”
Track◦ Classify by type◦ Keep storyteller value metrics – what was the benefit to you?

32
Example Survey QuestionsIf given the choice, would you KEEP it?
How does this COMPARE?
How EASY was it to …?
Don’t Take It Away
“User-Friendliness” Rating
“Intuitiveness” RatingEXAMPLE

33
Tip: Collect Qualitative Metrics with Ratings
Was it helpful?
Were you able to get value?
Trigger a survey at 4-5
Can we call you?
Follow up conversation

34
6. What do the metrics tell us about how we need to change?
Are we doing the right thing?What areas are most successful?What areas should we be promoting?In which areas should we be investing?Which initiatives should we discontinue?

35
Keep in mind
Metrics alone won’t make your program successful
A person whose job it is to monitor them
A person who is accountable for making
changes based on analysis
It’s as important to have a plan for acting on metrics as it is to have a plan for collecting them!

36
Call to Action
Develop a plan to capture quantitative and qualitative metrics.
Make sure metrics are part of
someone’s job.
Identify baseline measures – and gain commitment on targets – before you start!!
Develop a library or list to capture and categorize
qualitative metrics.
Develop an approach to produce and promote metrics.

37
Contact InformationSusan Hanley
President, Susan Hanley LLC
www.susanhanley.com
301-469-0770 (o)
301-442-0127 (m)
Blog: http://www.networkworld.com/community/sharepoint
Twitter: @susanhanley

Extras
38

39
Download the ROI Modelhttp://download.microsoft.com/documents/uk/enterprise/75_The_Total_Economic_ImpactTM_Of_Microsoft_SharePoint_Server.pdf
BACK
40
White PaperFor a white paper that explains the concepts in this presentation in more detail – with lots more examples, check out http://www.susanhanley.com.
41
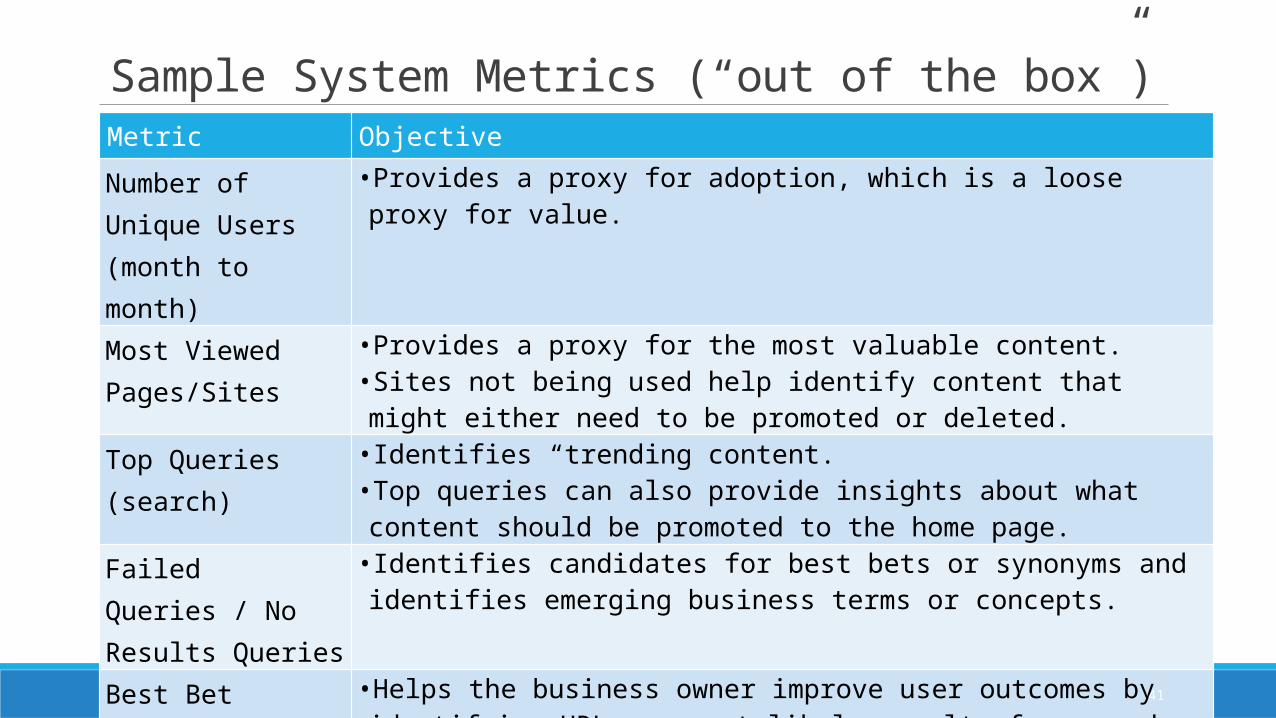
Sample System Metrics (“out of the box”)Metric ObjectiveNumber of Unique Users (month to month)
•Provides a proxy for adoption, which is a loose proxy for value.
Most Viewed Pages/Sites
•Provides a proxy for the most valuable content.•Sites not being used help identify content that might either need to be promoted or deleted.
Top Queries (search) • Identifies “trending content.•Top queries can also provide insights about what content should be promoted to the home page.
Failed Queries / No Results Queries
• Identifies candidates for best bets or synonyms and identifies emerging business terms or concepts.
Best Bet Suggestion Report
•Helps the business owner improve user outcomes by identifying URLs as most likely results for search queries.
Best Bet Usage •Helps identify which best bets are adding value and as an input to determine new best bets or best bets that need updating.

42
Additional Useful System Metrics (third-party)Metric ObjectiveMost Viewed Documents Provides a proxy for the most valuable content.
Document Contribution/Editing Analysis Provides a way to measure sustained adoption from the perspective of employee engagement.
Team Site Summary Information Total Number of Team Sites Viewed in Past 30 days Modified in Past 30 days Sites with no access in past 12 months Trend of the number of team sites
created
Provides a way to understand which sites are actively being used to monitor the health of the collaborative team sites.
Can be used to identify which sites are no longer being used and might be able to be deleted or archived.
Provides a proxy for whether or not team sites are adding value.
My Site Summary and Trends Total number of My Sites Viewed in past 30 days Modified in past 30 days Average size
Identifies adoption of people-to-people collaboration features. Proxy for employee engagement.
BACK

43
One sample metric for each stage (more in White Paper)
Life-cycle Stage Example Quantitative Metric
Example Qualitative Metric
Sources
Planning •Time to perform current process
• "Day in the life" future stories
•Work measurement studies• Interviews of key
stakeholdersStart up •N/A • Immediate term “day
in the life” stories•Employee surveys
Pilot Conclusion
•Same metrics you used for baselines
•Usage anecdotes –specific examples from pilot
•Follow up work measurement studies•Surveys and follow up
interviewsOngoing •Additional metrics
relevant to the business problem available with new process
•Usage anecdotes with a “serious” punch line that you collect and catalogue on an ongoing basis
•New solution system metrics•Employee surveys and
follow up interviews
BACK

Objectives Critical Success Factors Source Sample Metrics
Gain frequent and sustained adoption of solution
• High volume of needs that can’t be met through existing channels• Positive impact on existing workload or
work processes
• System metrics• User Surveys
• # of searches per week• # of average users per week• # unique users per week• # of “hits” on key pages/sites• “Usefulness rating” from user surveys• % of users who say “don’t take it
away” at the end of the pilotProvide reliable, easy-to-use technology that can be incorporated into work processes
• Solution user-friendliness and intuitiveness
• Solution reliability• Integration of the solution with work
processes and existing tools
• System metrics• User Surveys• Direct measurement
• “Usefulness rating” from user surveys• # of searches per week• # of average users per week• # unique users per week• # of “hits” on key pages/sites• # Help Desk calls/week
Ensure users understand objectives and how to leverage the solution
• User training• Effective help resources• Persistent, clear communications• Active, sustained management
support• Incorporation of collaboration into
performance objectives and evaluations
• System metrics• User Surveys• Direct measurement
• % of users trained• % of pilot milestones achieved• # of communications events/activities
Demonstrate clear value with respect to the business strategy
• Tangible, quantifiable examples of reductions in process cycle time
• “Serious” Anecdotes collected via surveys• Estimates and/or direct
measurement of cycle time
• # of anecdotes• $ value of anecdotes• Cycle time improvement (in hours)
Business Value
Solution Health
Capabilities
Balanced Scorecard Framework
BACK44

45
Survey Example: Post-Pilot UsabilityUsability Question Metric
If presented the choice, do you want to keep the solution?
“Don’t Take it Away”
Don't take it away Take it away Usability/friendliness - how does the usability of this solution compare to other solutions you use on a regular basis?
“User Friendliness Rating”
Much easier to use Easier to use About the same
Harder to use Much harder to use
How easy and intuitive was the solution to use for each of the following [specific task]?
“Intuitiveness Rating”
Very easy Easy Moderate
Difficult Very Difficult
BACK
46
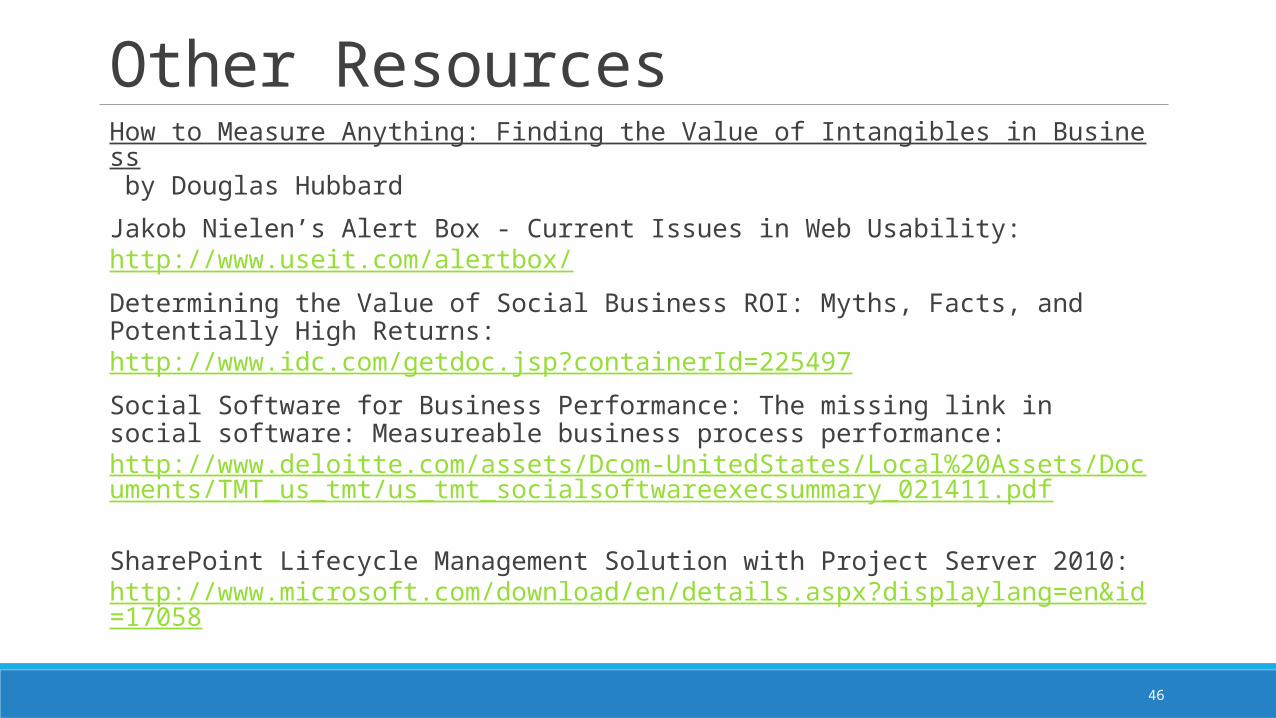
Other ResourcesHow to Measure Anything: Finding the Value of Intangibles in Business by Douglas Hubbard
Jakob Nielen’s Alert Box - Current Issues in Web Usability: http://www.useit.com/alertbox/
Determining the Value of Social Business ROI: Myths, Facts, and Potentially High Returns: http://www.idc.com/getdoc.jsp?containerId=225497
Social Software for Business Performance: The missing link in social software: Measureable business process performance: http://www.deloitte.com/assets/Dcom-UnitedStates/Local%20Assets/Documents/TMT_us_tmt/us_tmt_socialsoftwareexecsummary_021411.pdf
SharePoint Lifecycle Management Solution with Project Server 2010: http://www.microsoft.com/download/en/details.aspx?displaylang=en&id=17058

Examples of Intranet MeasuresKey Measure Objective MetricWhich features of the intranet are most important?
Knowing which pages are most used can help to prioritize which pages should be improved or developed.
You can also see which business units are the biggest intranet users and which business unit’s content is used the most.
Page Hits “Dwell” Time (Time on
Page/Site)
Which features are not being used?
If certain pages have low usage numbers, it is an indication that either the page is not very popular—and therefore should be a lower priority to develop—or that people are just not aware of its existence (which might be a communications or "promotion" problem).
Page Hits Document Downloads
Is the site navigation effective?
A high number of hits on a page that is not easily accessible from the main page indicate that the popular page should be moved up in the hierarchy.
Search results with no hits present opportunities to both promote content and add best bets.
Page Hits on pages deep in the hierarchy
Which team sites should be archived or deleted?
Sites that have not been accessed in the past 12 months might be candidates for archival or deletion if the content is no longer useful.
Page Hits
What are the peak/low usage times?
Monitoring usage trends helps identify patterns or problems and potentially alerts the Exchange Business Owner and Portal Administrator of potential user or performance issues – ideally, before they become a problem.
Usage by time
How is usage trending? Trending reports are available for a limited period of time within SharePoint 2010. Third-party tools are required to do multi-year detailed trend analysis.
Number of users and number of unique users over time