sharing methods in power bi: how to fulfill your audience · power bi free personal use licensed by...
TRANSCRIPT

Sharing methods in Power BI: how to fulfill your audience
Andrea Martorana Tusa

MET DANK AAN ONZE PARTNERS

MET DANK AAN ONZE PARTNERS

Speaker Info: Andrea Martorana Tusa• Microsoft MVP Data Platform
• Team Leader for Business Intelligence in Würth-Phoenix (Bozen, Italien)
• Previously worked by Widex a danish company which manufactures hearing aids, as BI Specialist
• Previously worked as BI Developer in an italian bank
• Speaker at SQL Saturdays, and other community-driven events in Europe, (MS Cloud Summit, SQL Konferenz, SQL Nexus, SQL Days, Dataminds Connect ...). Speaker in webinars for PASS Italian VC, DW/BI VC
• Author for sqlservercentral.com, sqlshack.com, UGISS (User Group Italiano SQL Server)

Agenda
• Introduction
• Sharing
• Workspace and App
• Sharepoint
• Subscriptions
• Interaction with MS Office
Why this session?How many times have you been asked:
“Can you share this report/dashboard, with me?”;
“Can we distribute our work to other users?”; “Shall we pay for it? How can we get licenses?”.
“How can we deal with Security and Compliance rules inside our organization”?
To make things worse, the licensing and delivering model has changed evolving, bringing more confusion to end-users.
So I want to give you a clear and complete overview of all the sharing methods in Power BI, helping you to choose the solution that best fits your needs.

Power BI Free
Personal use
Licensed by user
Self–service analysis, report authoring, etc.
Power BI Pro
Collaborative use
Licensed by user
The same as Free plus collaboration and sharing
Power BI Premium
Corporate use
Licensed by capacity
Great scale distribution and performance, delivery
contents without per user licensing
Power BI licensing model

Sharing

Sharing dashboards, reports, tilesSharing is the faster and easier collaborative method.
You can share dashboards and reports with colleagues inside and outside of your company.
Sharing is a Pro feature.
When you share:
• Everyone you share with can see your dashboard and interact with your reports, but can’t edit
• Changes you make are visible to everyone (after you save those changes)
• Dashboards and reports are read-only. No-one can save its own local copy
• No-one can see or download the dataset

To share a dashboard in Power BI Service simply click on the Share icon
Fill in the address of the recipient and he will receive an e-mail with an invitation

All the shared contents are accessible through the “Shared with me” menu.
Sharing with colleagues
• Colleagues who have the same email domain as you, and colleagues
whose domain is different but registered within the same tenant in Office
365, can reshare the dashboard.
• If you use Office 365 for email, you can share at once with members of a distribution group by entering the email address associated with the distribution group. The group limit for sharing is 500 members.
• You can even send a direct link to a dashboard, just by copying the URL. For example:
https://powerbi.com/dashboards/g12466b5-a452-4e55-8634-xxxxxxxxxxxx

Filters and data rows limitations on shared objects
• User see same data as developer, unless Row Level Security is applied
to the dataset underlying a dashboard or report, then the credentials of
every person are used to determine which data they can access.
• Sharing a filtered version of a report, is doable by creating a custom URL
Report page URL + ?filter=tablename/fieldname eq value
Es: app.powerbi.com/groups/me/reports/010ae9ad-a9ab-4904-a7a1-
xxxxxxxxxxxx/ReportSection2?filter=Store%252FTerritory%20eq%20%27NC%27
Sharing with people outside your organization
• When you share with people outside your organization, they even get an
email with a link to the shared dashboard.
• When they try to access the link, they see the shared dashboard in its own browser window without the left navigation pane, not in their usual Power BI portal.
• They can't edit any content in this dashboard or report. They can interact with the tiles in the dashboard or report but cannot modify.
• Only your direct recipients can see the shared dashboard. No-one else can see that dashboard, even if they have the link.
• People outside your organization can see data according to the role or row-level security you implemented.
Resharing
• Resharing allows your colleagues to forward the email invitation to others
in your organization.
• They can also reshare through the Power BI service and mobile apps.
• As the owner of the dashboard, you can turn off resharing and you can also revoke resharing on an individual basis.
• People outside your organization can't reshare.
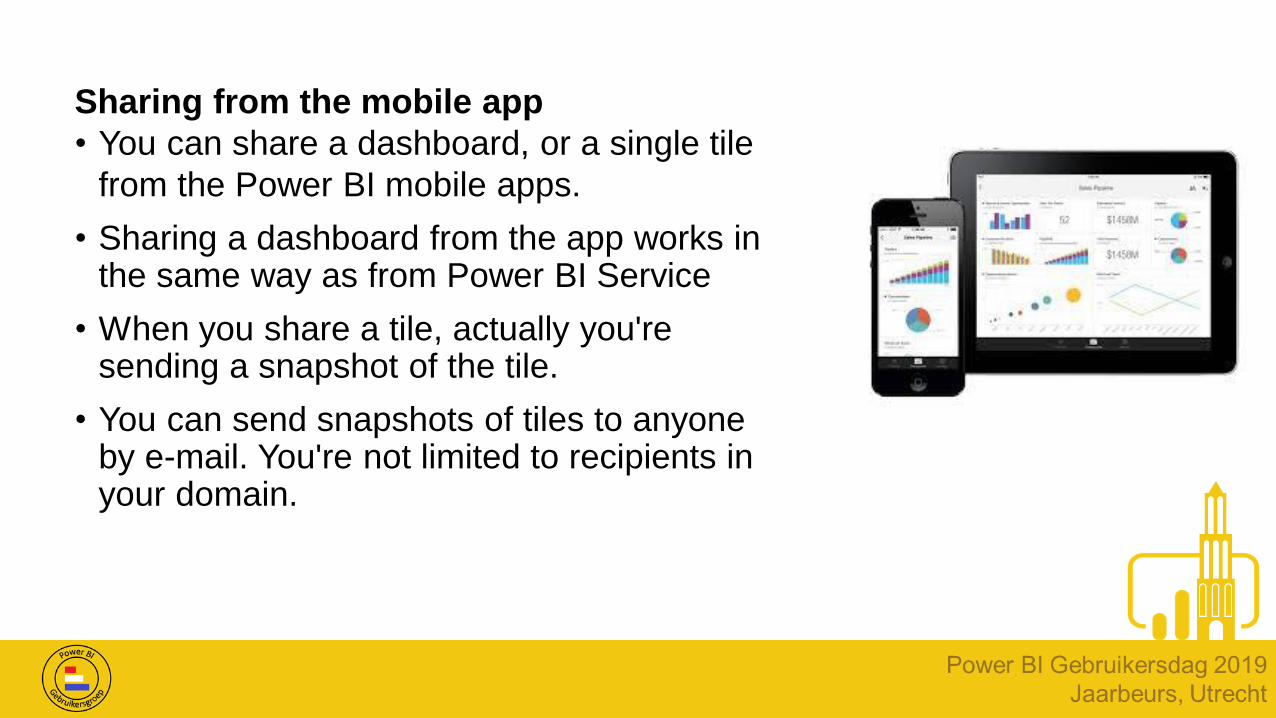
Sharing from the mobile app
• You can share a dashboard, or a single tile
from the Power BI mobile apps.
• Sharing a dashboard from the app works in the same way as from Power BI Service
• When you share a tile, actually you're sending a snapshot of the tile.
• You can send snapshots of tiles to anyone by e-mail. You're not limited to recipients in your domain.

In the admin portal you can enable / disable some features for your tenant, like sharing for example.
Power BI admin portal


Demo
• Share a dashboard inside your organization• [email protected] > My Workspace > Retail Analysis Sample >
• Share a dashboard outside your organization• [email protected] > My Workspace > Retail Analysis Sample >
• Remove/Edit access and manage permissions
• Enable/disable resharing for a single dashboard/report
• Enable / disable external sharing for the tenant

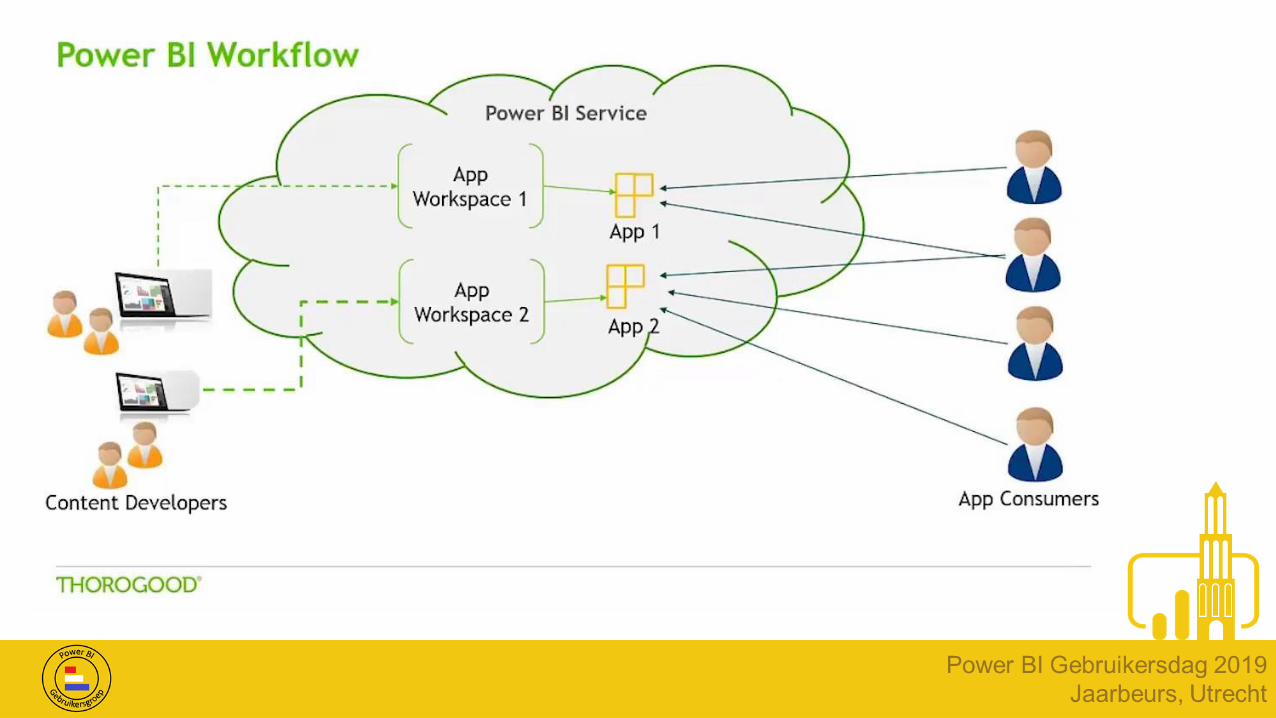
Workspaces

App WorkspaceCreate and share dashboards or reports in a workspace
A workspace is the staging area designed for collaboration in Power BI.
Inside a workspace you can collaborate with other colleagues and work
together on dashboards, reports and datasets.
Everyone in the workspace can view, interact with, and edit the dashboard
and its reports. You can set user in the group as viewer, member,
contributor or admin.
App Workspace is a Pro feature …
… unless your app resides in a PBI Premium capacity plan. In this case,
users are free to connect to the app.

Workspaces are the evolution of
groups in Power BI, traditionally
they are based on Office 365
groups and offer group services
such as OneDrive for business,
conversations, calendars, tasks,
…
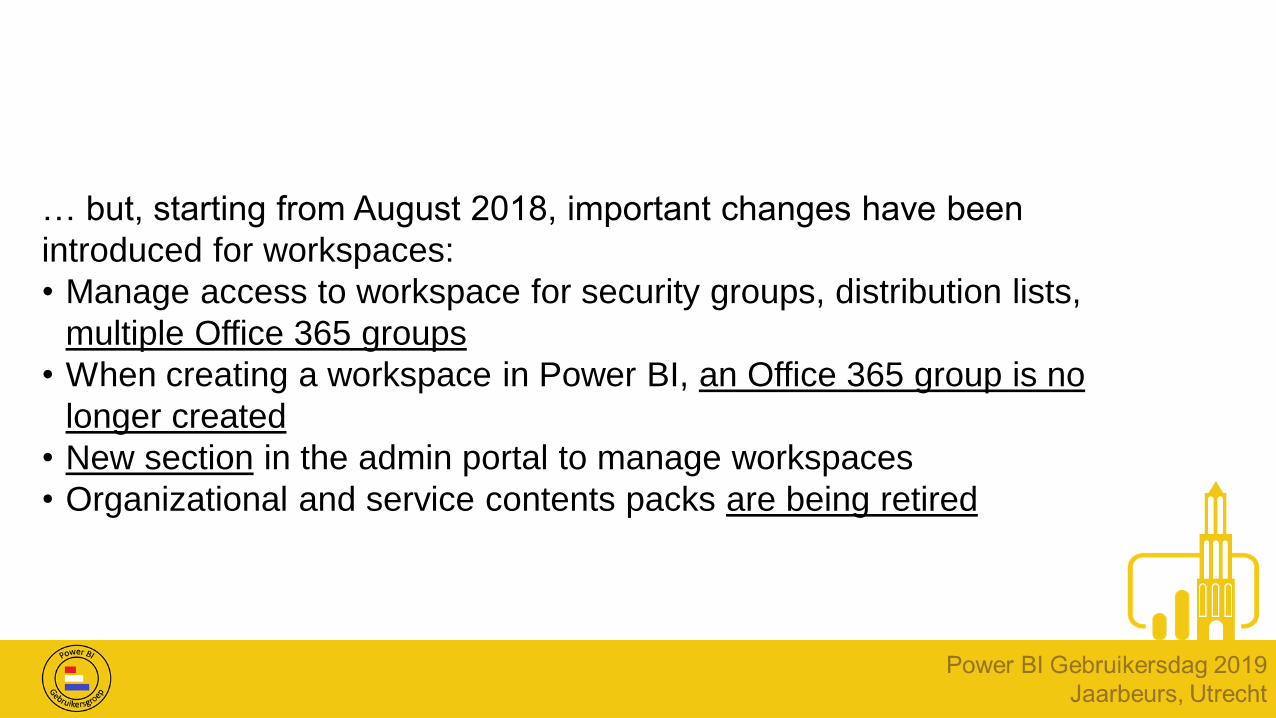
… but, starting from August 2018, important changes have been
introduced for workspaces:
• Manage access to workspace for security groups, distribution lists,
multiple Office 365 groups
• When creating a workspace in Power BI, an Office 365 group is no
longer created
• New section in the admin portal to manage workspaces
• Organizational and service contents packs are being retired

Now, when creating a
workspace you can
choose the new
improved version. As
it reaches GA the
feature will be the
default choice.
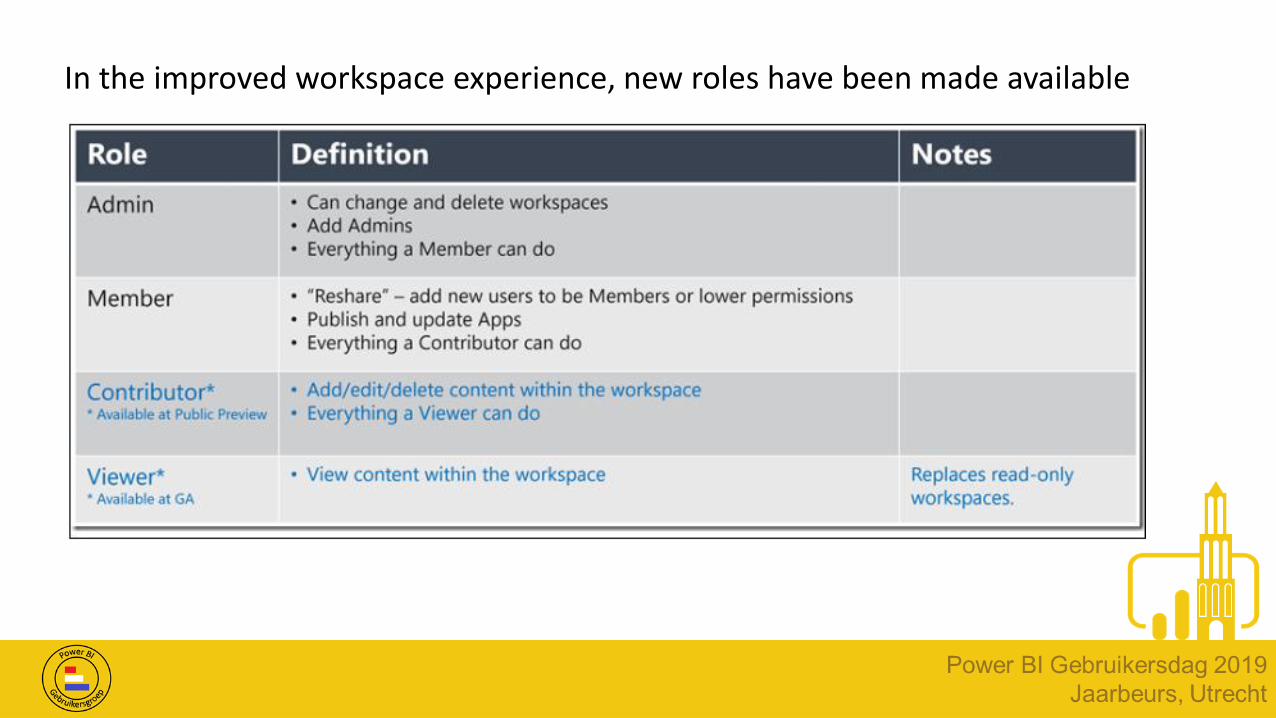
In the improved workspace experience, new roles have been made available

Once the new workspace experience reaches General Availability (GA):• All workspaces will be created using the new workspaces infrastructure• No more workspaces that create an Office 365 Group• New workspaces will have a setting where you can associate a workspace in Power
BI with an Office 365 Group
New workspaces experience features for replacing content packs:• Ability to personalize content by saving a copy of a report or dashboard to your
own workspaces• New dataset discovery experiences that enable searching for datasets in other
workspaces, and the ability to build reports and dashboards from datasets in a different workspace
• Ability to copy reports and dashboard between workspaces
https://powerbi.microsoft.com/en-us/blog/enable-your-team-with-new-workspaces-experiences-preview/

App Workspace• Once your workspace is ready you can publish it as an App. An App is
the way to distribute content to end-users in production.
• It is possible not to publish all the reports and dashboards into a
workspace, but only the ones that are ready.
• Business users can therefore connect to the published App and consume the contents you prepared for them.

Workspaces settings
- Private: Only group members can see the group’s contents.
- Public: People in your organization can make themselves members of the group, without needing permission from an admin
- Edit rights: all members of the group can modify the group's content
- View only permissions: only admin of the group can modify content. Members can only read it

App WorkspacesConsume the app
There are different ways to expose an app for business users:
• Unattended installation in the user’s Power BI account
• Sending a direct link to the app
• Searching in the AppSource repository
App Workspaces
External Sharing• Apps can furthermore be distributed to guest users outside of your
organization’s tenant • Recipients are able to securely sign into the service using their own
organization’s security credentials or personal email address• This is a feature made possible through the integration of Power BI
integration with Azure Active Directory (AD) business-to-business (B2B) collaboration

DemoApp Workspaces
• Create a workspace “Power BI Gebruikerdag 2019” as [email protected]
• Add members: [email protected]; [email protected];
• Edit workspace’s properties, change member rights
• Publish a report to a workspace from PBI Desktop
• Publish/Update app. Change settings, permissions, etc. • Add user [email protected]
• Consume app as a user (publish to [email protected])
• Get app > My Organization
• Set workspace features (image, featured dashboard, …)

Sharepoint integration
SharePoint Integration
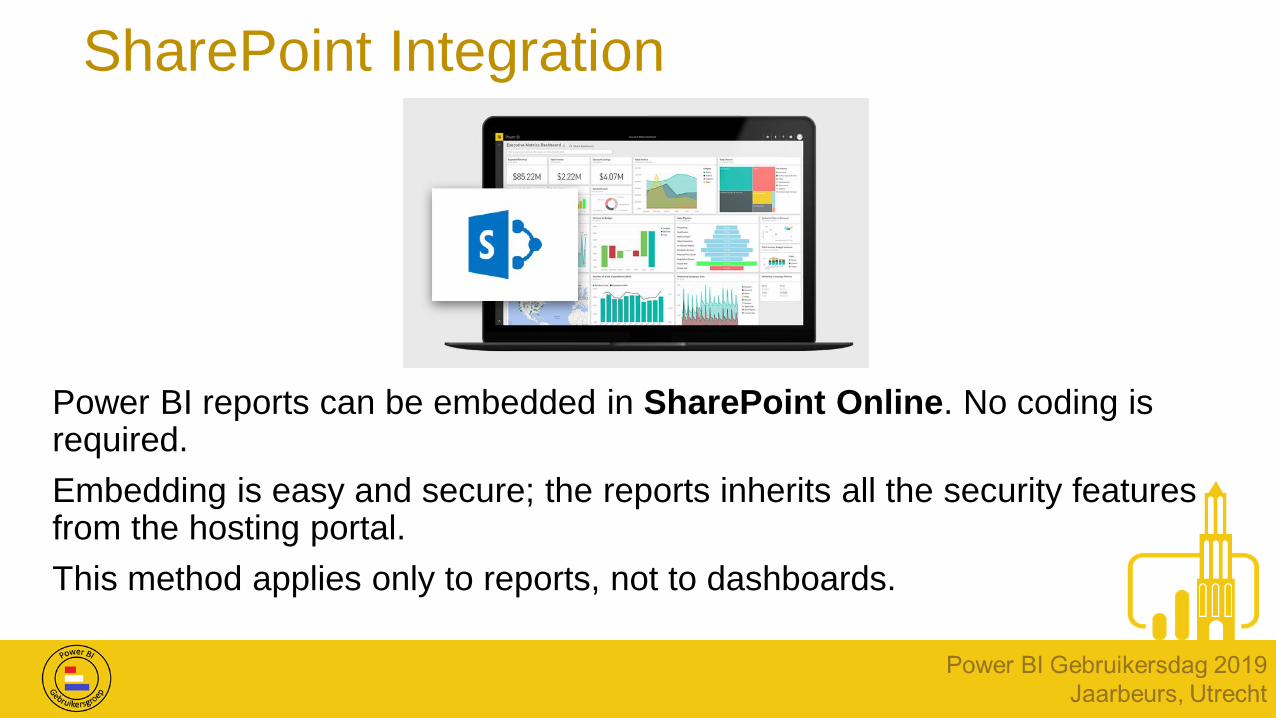
Power BI reports can be embedded in SharePoint Online. No coding is required.
Embedding is easy and secure; the reports inherits all the security features from the hosting portal.
This method applies only to reports, not to dashboards.
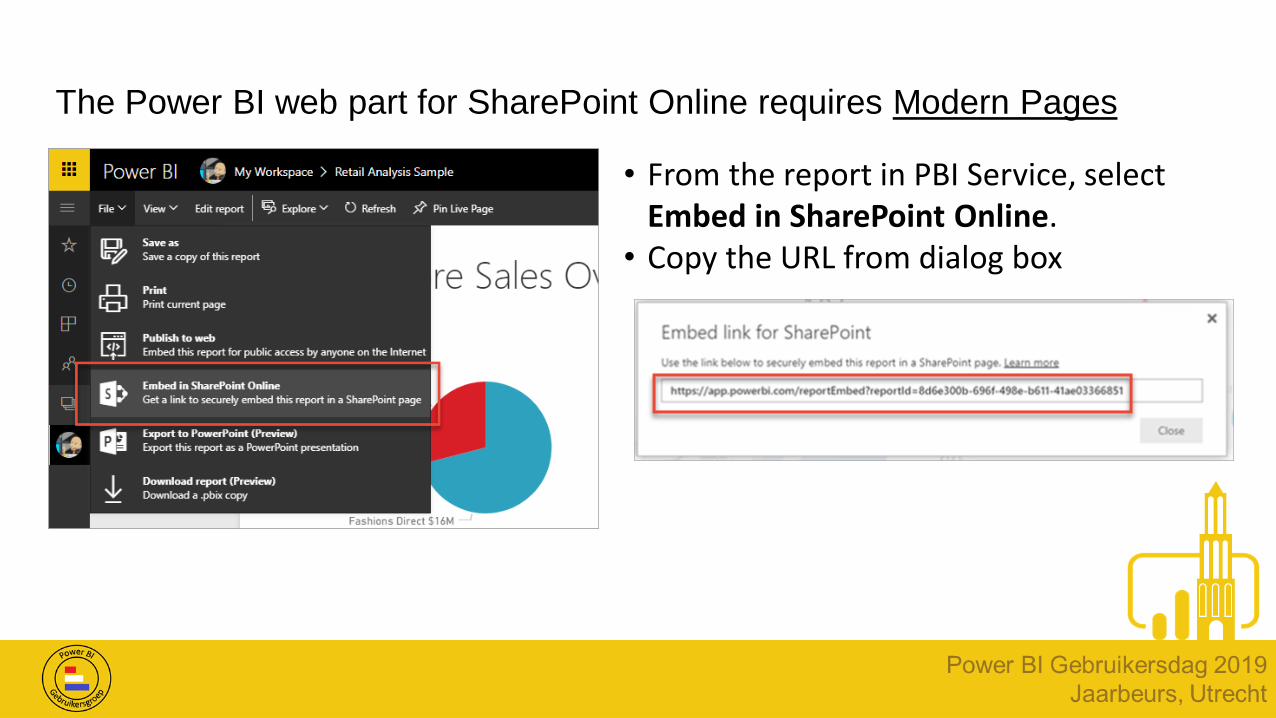
The Power BI web part for SharePoint Online requires Modern Pages
• From the report in PBI Service, select Embed in SharePoint Online.
• Copy the URL from dialog box

SharePoint IntegrationSecurity
• User’s authentication is managed by the portal through single sign-on.
Users are not prompted to sign-in again in Power BI. All filters and
features applied to reports (es RLS) are kept, when they browse contents
• Nevertheles to access reports, users must be granted in Power BI service,
too. Permissions are managed in two ways:
o Through Office 365 Groups. In this case the user must be added as a
member to the app workspace behind the group
o Creating a dashboard based on the embedded report and then sharing
the dashboard with user(s)
SharePoint Integration
As you are sharing/collaborating in Power BI Service, this feature requires a Pro license. And users need a PBI account.
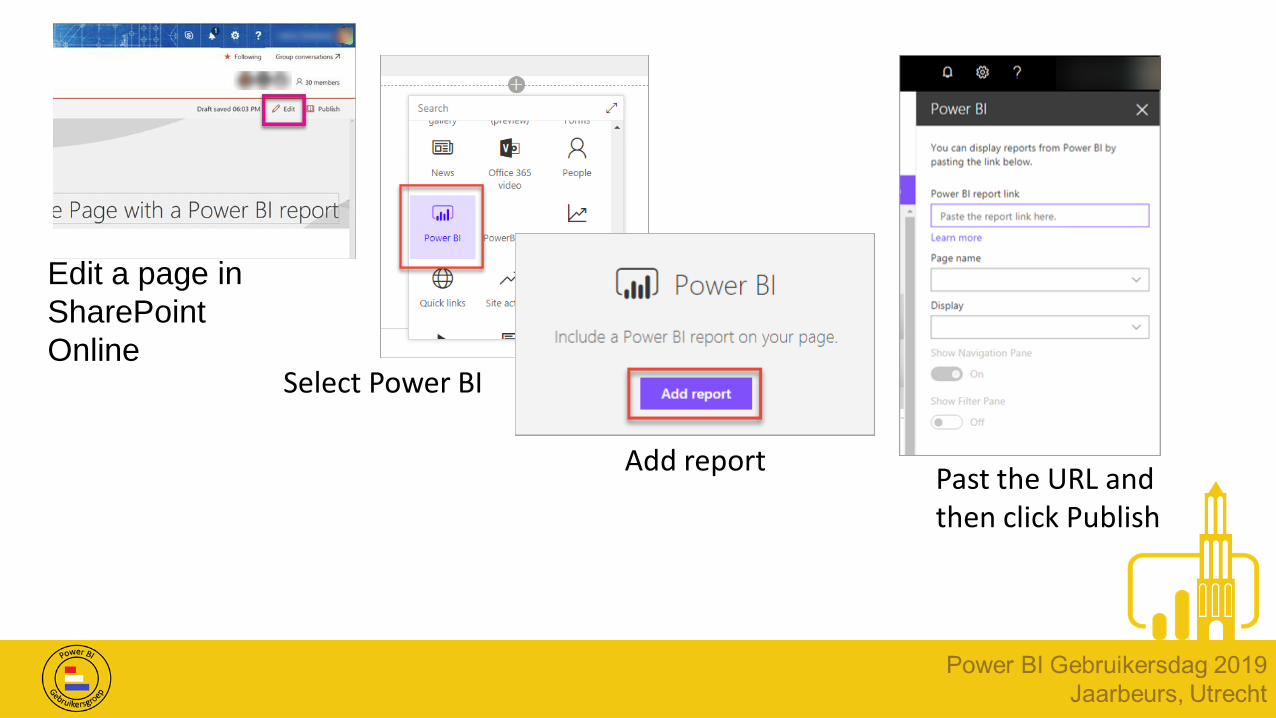
Edit a page in
SharePoint
OnlineSelect Power BI
Add reportPast the URL and then click Publish

Subscriptions
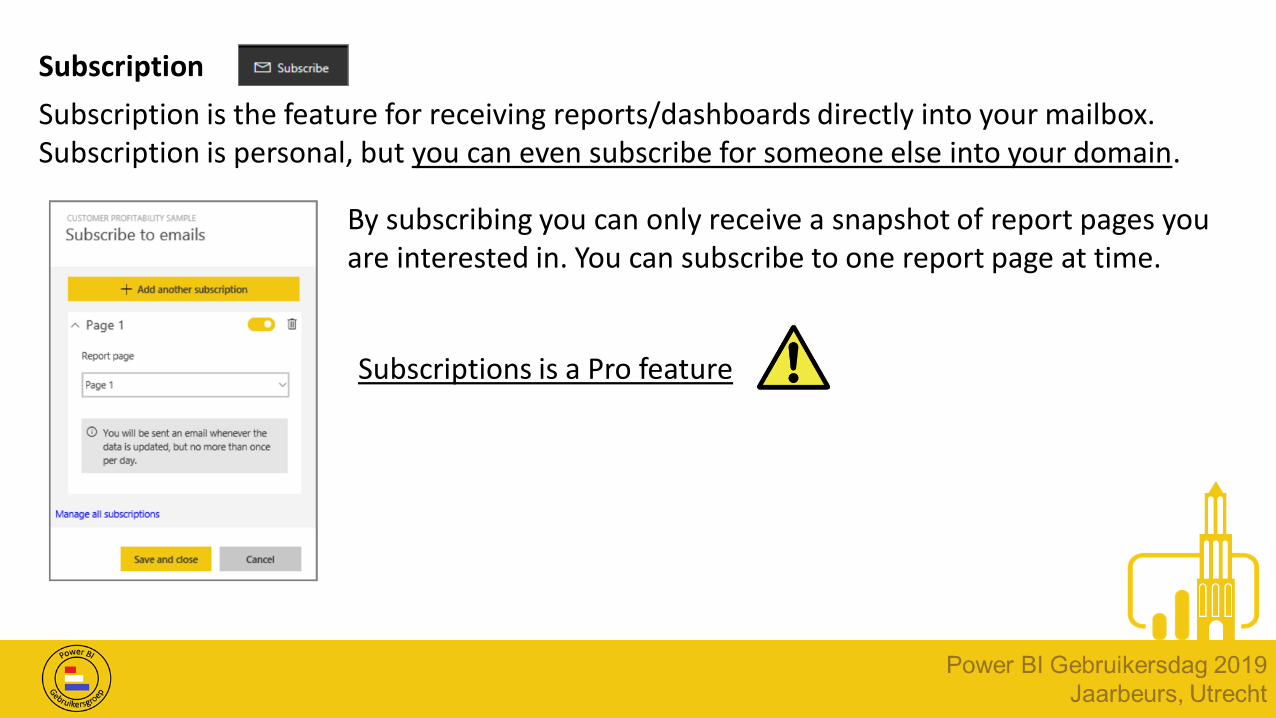
Subscription
Subscription is the feature for receiving reports/dashboards directly into your mailbox. Subscription is personal, but you can even subscribe for someone else into your domain.
Subscriptions is a Pro feature
By subscribing you can only receive a snapshot of report pages you are interested in. You can subscribe to one report page at time.

Subscription
As of 02-02-2019 you can also set a time-based subscription schedule for your reports and dashboards.
Subscription
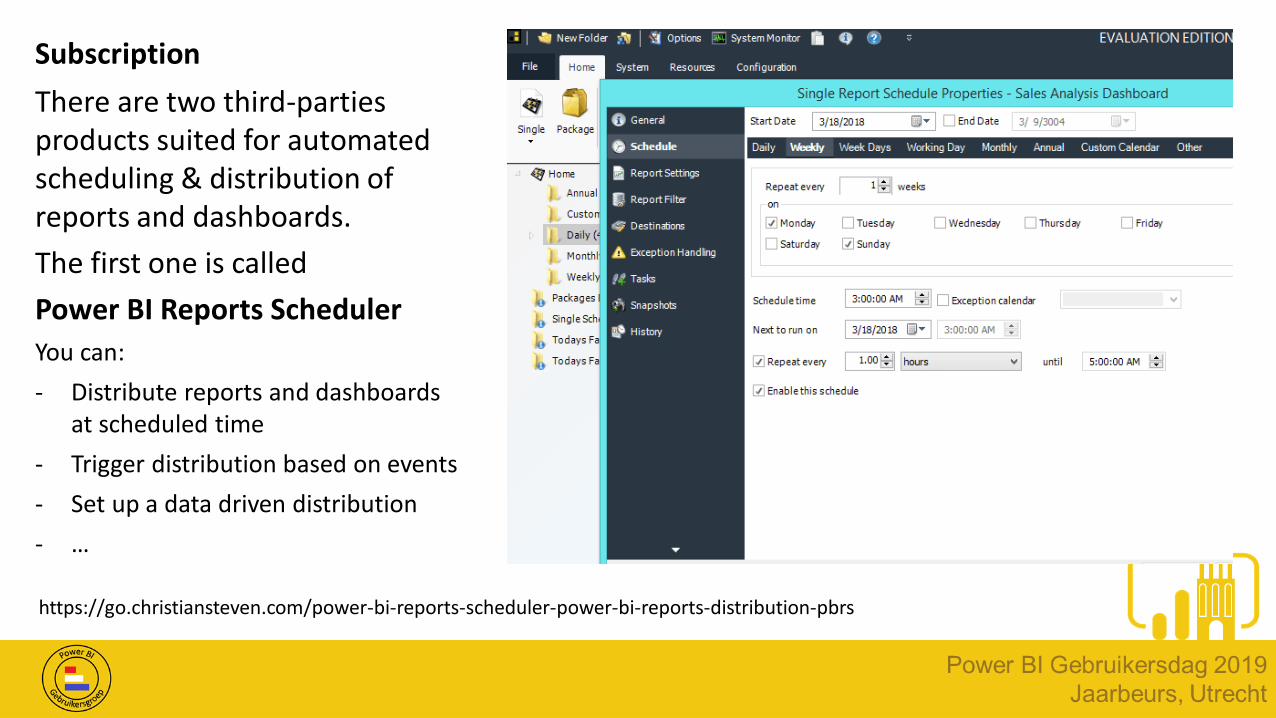
There are two third-parties products suited for automated scheduling & distribution of reports and dashboards.
The first one is called
Power BI Reports Scheduler
You can:
- Distribute reports and dashboards at scheduled time
- Trigger distribution based on events
- Set up a data driven distribution
- …
https://go.christiansteven.com/power-bi-reports-scheduler-power-bi-reports-distribution-pbrs

Subscription
The other product is called Power BI Robots. You can schedule and send reports and dashboards by e-mail.
https://blog.devscope.net/2018/05/30/how-to-schedule-and-send-power-bi-reports-and-dashboards-by-email/

DemoSubscriptions
• Open a report > Subscribe personally and for another user, then go to the e-mail to get the message

Interactions with MS Office
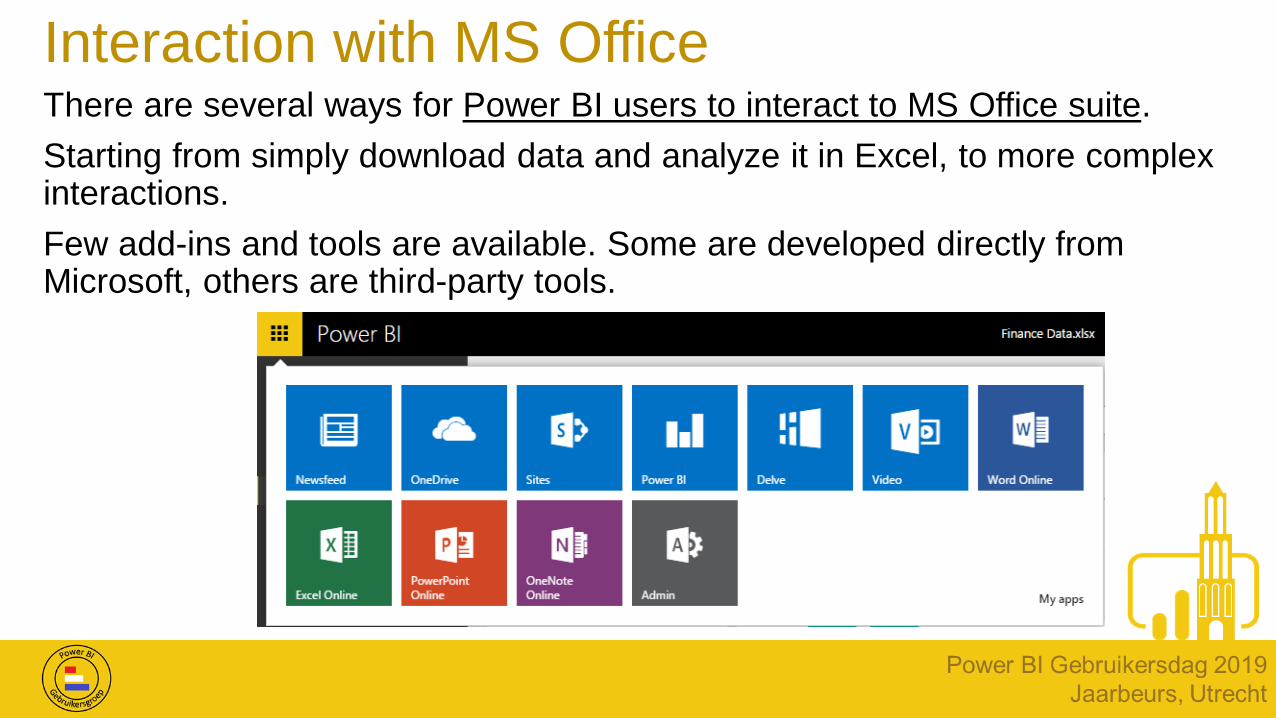
Interaction with MS OfficeThere are several ways for Power BI users to interact to MS Office suite.
Starting from simply download data and analyze it in Excel, to more complex interactions.
Few add-ins and tools are available. Some are developed directly from Microsoft, others are third-party tools.

Export dataData can be exported from visuals on a dashboard and in reports. In any visual in edit mode select … > Export data
The data is exported to a .xlsx or .csv file that you can open and analyze.
Interaction with MS Office
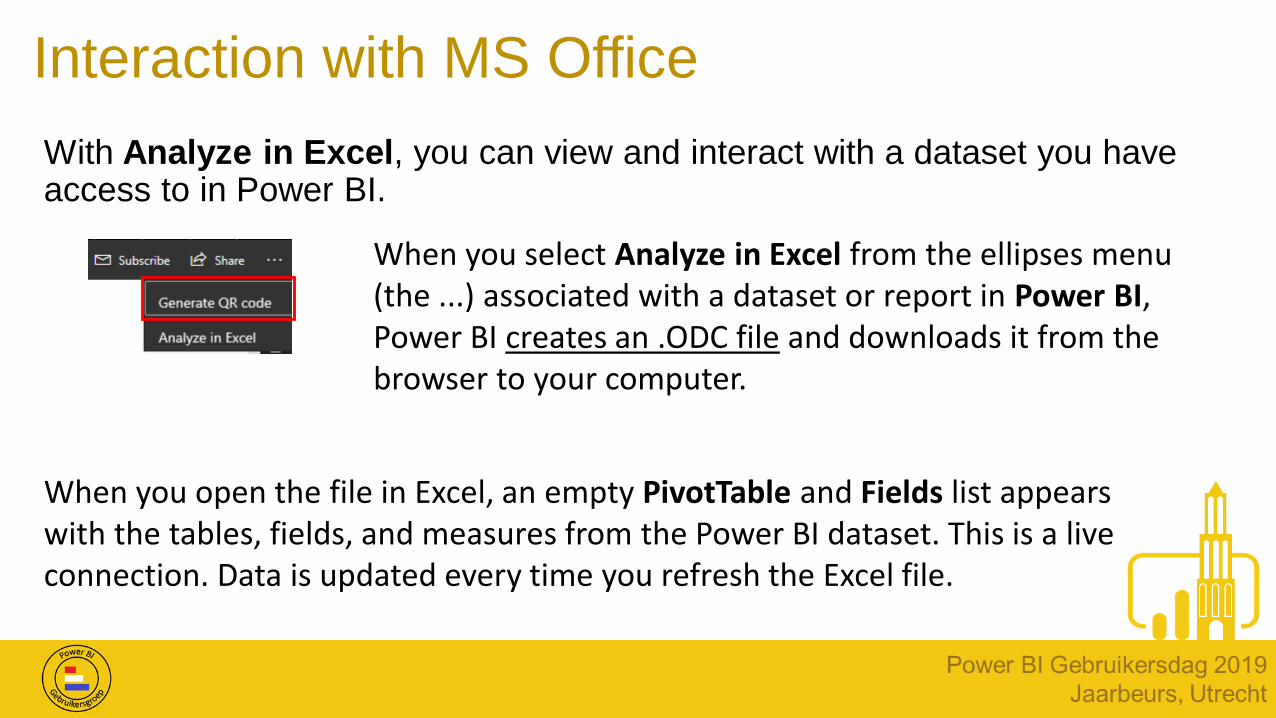
With Analyze in Excel, you can view and interact with a dataset you have access to in Power BI.
When you select Analyze in Excel from the ellipses menu (the ...) associated with a dataset or report in Power BI, Power BI creates an .ODC file and downloads it from the browser to your computer.
When you open the file in Excel, an empty PivotTable and Fields list appears with the tables, fields, and measures from the Power BI dataset. This is a live connection. Data is updated every time you refresh the Excel file.
Interaction with MS Office
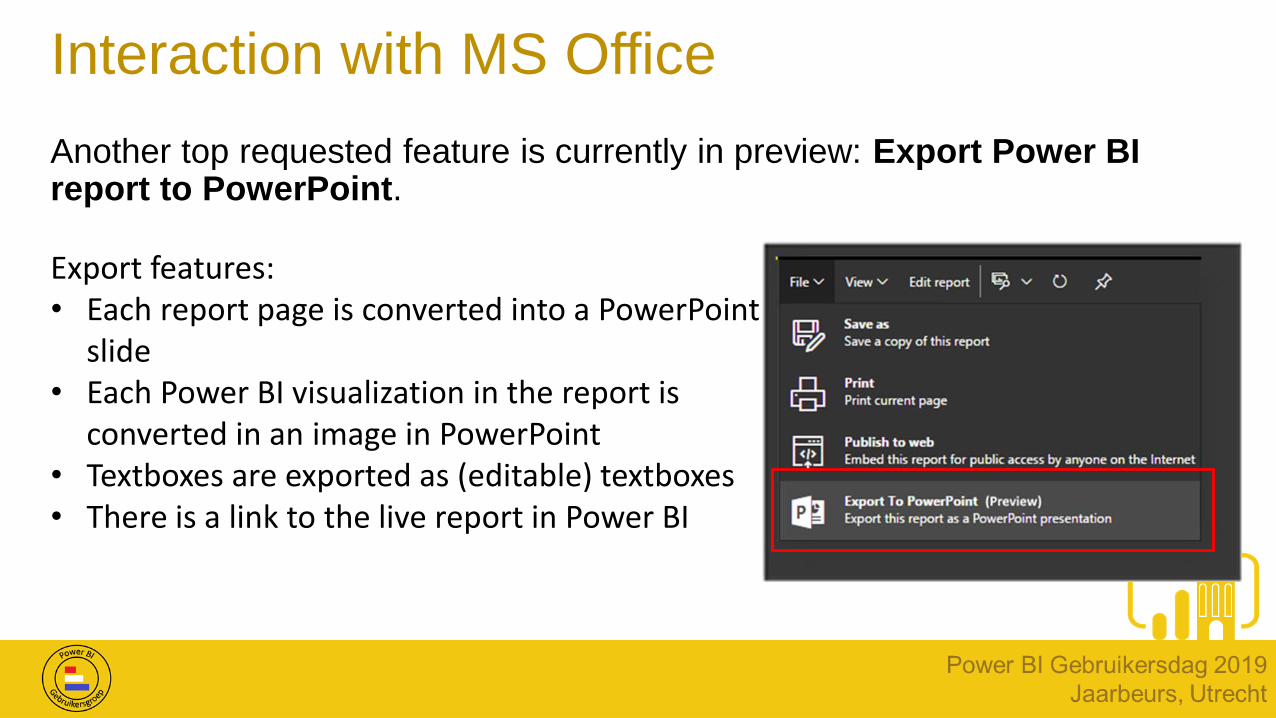
Another top requested feature is currently in preview: Export Power BI report to PowerPoint.
Export features:• Each report page is converted into a PowerPoint
slide• Each Power BI visualization in the report is
converted in an image in PowerPoint• Textboxes are exported as (editable) textboxes• There is a link to the live report in Power BI
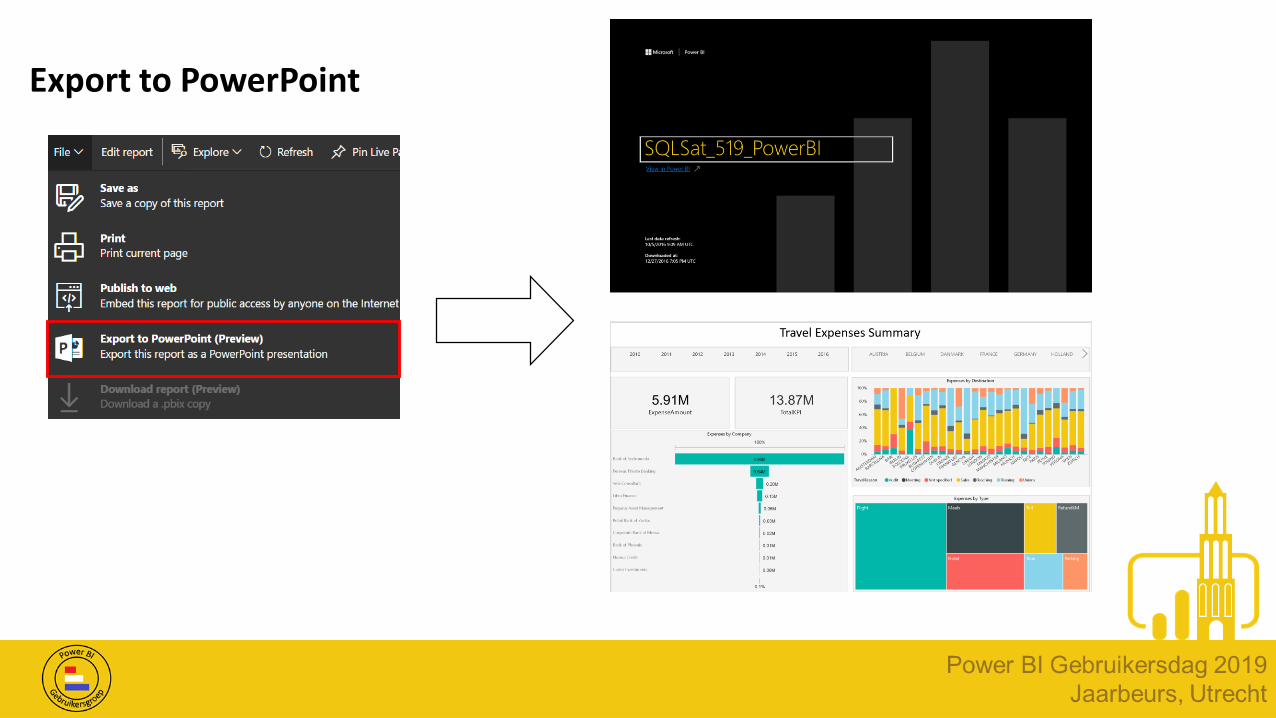
Export to PowerPoint

Excel Publish to Power BI
From Excel 2016 you can publish your workbook directly to Power BI
Service.
Two options:• Upload your workbook
to Power BI • Export workbook data to
Power BIThe workbook appears as in Excel Online. You can pin elements to dashboards and edit it (in Excel Online).
Data is exported as new dataset to Power BI and the original workbook is synchronized with dataset.
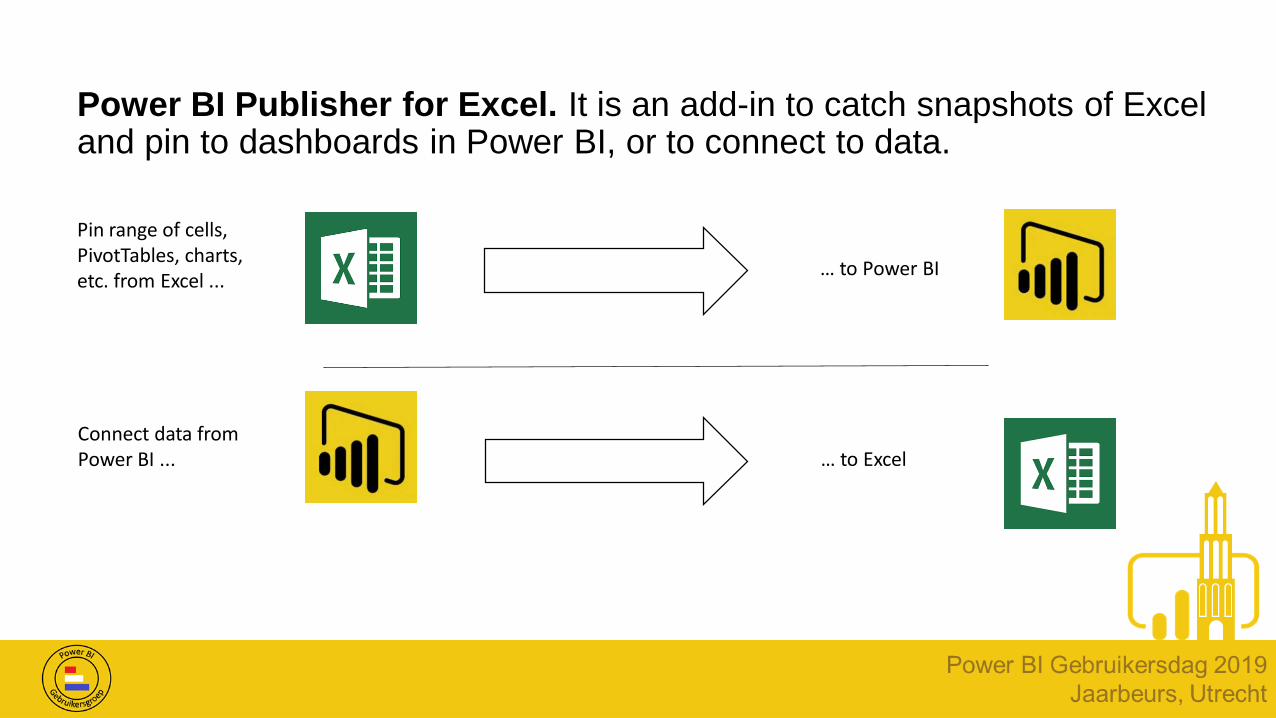
Power BI Publisher for Excel. It is an add-in to catch snapshots of Excel and pin to dashboards in Power BI, or to connect to data.
Pin range of cells, PivotTables, charts, etc. from Excel ...
… to Power BI
Connect data from Power BI ... … to Excel
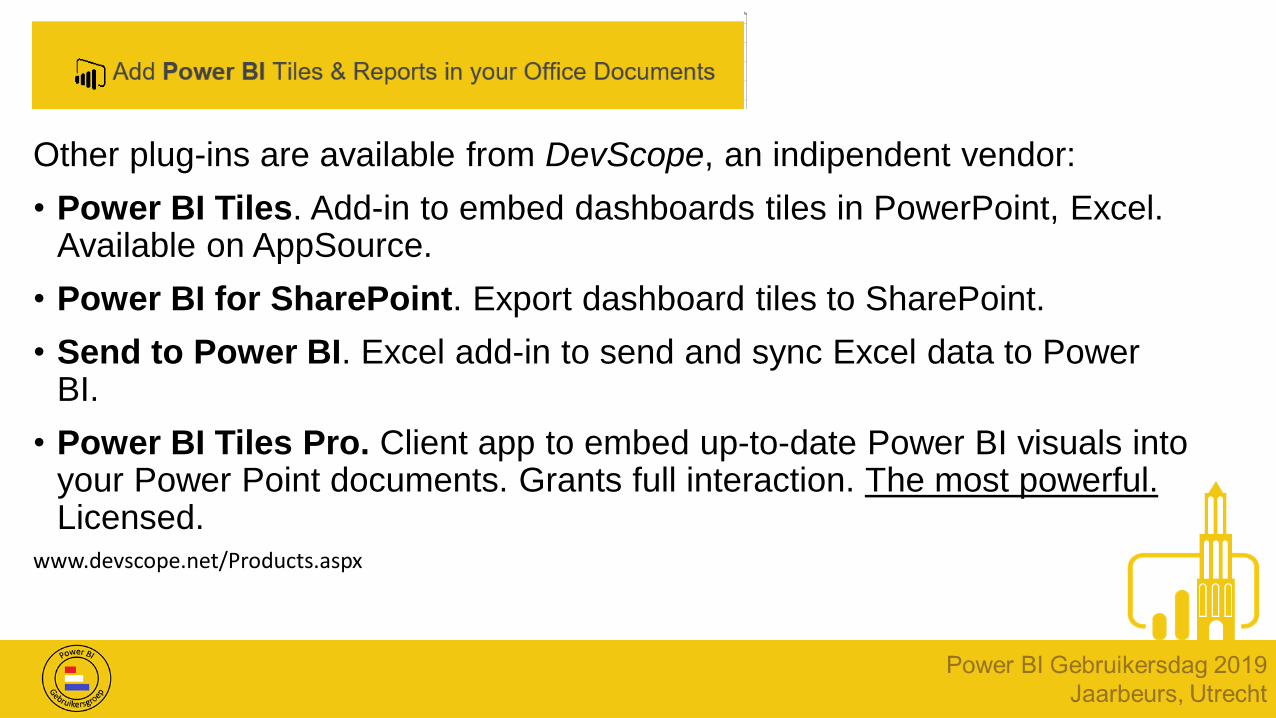
Other plug-ins are available from DevScope, an indipendent vendor:
• Power BI Tiles. Add-in to embed dashboards tiles in PowerPoint, Excel. Available on AppSource.
• Power BI for SharePoint. Export dashboard tiles to SharePoint.
• Send to Power BI. Excel add-in to send and sync Excel data to Power BI.
• Power BI Tiles Pro. Client app to embed up-to-date Power BI visuals into your Power Point documents. Grants full interaction. The most powerful.Licensed.
www.devscope.net/Products.aspx


Demo
• Export data
• Analyze with Excel
• Export to Power Point
• Power BI Excel Publisher