sharjah islamic bank - sib.ae
TRANSCRIPT

Sharjah Islamic Bank
Primary Credit Analyst:
Roman Rybalkin, CFA, Moscow + 7 49 5783 4094; [email protected]
Secondary Contact:
Puneet Tuli, Dubai + 97143727157; [email protected]
Table Of Contents
Credit Highlights
Outlook
Key Metrics
Anchor: 'bbb-' For Banks Operating Only In The UAE
Business Position: Strong Presence In Sharjah But Challenger In The UAE
Market
Capital And Earnings: Strong In A Global Context
Risk Position: Concentrated Exposures Similar To Peers
Funding And Liquidity: Deposit-Funded Franchise
Support: Three Notches Of Uplift For Systemic Importance
Ratings Above The Sovereign
Environmental, Social, And Governance
Key Statistics
Related Criteria
WWW.STANDARDANDPOORS.COM/RATINGSDIRECT AUGUST 16, 2021 1

Sharjah Islamic Bank
SACP bbb-
Anchor bbb-
Business
PositionModerate -1
Capital and
EarningsStrong +1
Risk Position Adequate 0
Funding Average
0
Liquidity Adequate
+ Support +3
ALACSupport 0
GRE Support 0
GroupSupport 0
SovereignSupport +3
+AdditionalFactors 0
Issuer Credit Rating
A-/Stable/A-2
Credit Highlights
Overview
Key strengths Key risks
Strong capitalization. High share of loans benefitting from deferrals.
High systemic importance in the United Arab Emirates (UAE). Sizable lending exposure to the real estate and construction sectors.
Strong relationship with the government of Sharjah. Limited geographic diversification.
Sharjah Islamic Bank's (SIB's) capitalization will remain strong. We expect that SIB's risk-adjusted capital (RAC)
ratio before concentration adjustments will remain at 11.5%-12.0% over the next 12-24 months. We factor an average
cost of risk of above 100 basis points (bps) over the next two to three years in our base-case forecast, and we expect
the share of stage 3 loans will revert to around 5.5%. We also expect the bank will maintain stage 3 coverage by
specific provisions of about 60%--broadly on par with the UAE market average.
SIB's credit growth will outpace that of its peers. We expect SIB will continue expanding at a faster pace than its
domestic peer group, with financings increasing by 7%-8% per year as it captures market share from other
Sharjah-based banks. Like 2020, we believe a significant portion of growth will be linked to government-related entities
(GREs) in Sharjah, and to a lesser extent Dubai.
Loan deferrals will remain a source of uncertainty. We expect some deterioration in asset-quality indicators at UAE
banks as regulatory forbearance measures are progressively lifted. On June 30, 2021, about 11% of SIB's corporate
financings and 4% of its retail book benefitted from deferrals. We understand that most borrowers continued to service
their debt and that the bank recovered some payments that were not collected in 2020 over the first half of 2021. Still,
we observe some deterioration in the quality of these deferrals with Group 2 exposure (borrowers expected to face
substantial changes in their creditworthiness) at 3.5% of the total corporate book.
WWW.STANDARDANDPOORS.COM/RATINGSDIRECT AUGUST 16, 2021 2

Outlook: Stable
The stable outlook reflects our view that the bank's business and financial profiles will remain broadly unchanged
over the next 12-24 months, despite pressure on its operating environment and our expectation that asset-quality
indicators will slightly weaken.
Downside scenario
We could consider a negative rating action if we observe higher-than-expected deterioration in asset quality or
weaker-than-expected capitalization, signaled by the RAC ratio dropping below 10%, which may come from
faster-than-expected growth. We may also take a negative rating action if the creditworthiness of Sharjah's
government, the bank's largest counterparty, comes under further pressure.
Upside scenario
A positive rating action is remote in the next 12-24 months, since it would require SIB to materially strengthen
both its franchise and capitalization, with RAC sustainably exceeding 15%.
Key Metrics
Sharjah Islamic Bank--Key Ratios And Forecasts
--Fiscal year ended Dec. 31--
(%) 2019a 2020a 2021f 2022f 2023f
Growth in operating revenue 5.5 2.3 9.6-11.8 5.6-6.8 5.0-6.2
Growth in customer loans 2.7 16.4 7.2-8.8 7.2-8.8 5.4-6.6
Growth in total assets 3.7 15.5 6.0-7.4 6.6-8.0 5.2-6.4
Net interest income/average earning assets (NIM) 2.3 2.2 2.1-2.3 2.1-2.3 2.1-2.3
Return on average common equity 9.8 7.1 6.9-7.6 9.6-10.6 9.4-10.4
Return on assets 1.2 0.8 0.7-0.8 0.9-1.1 0.9-1.1
New loan loss provisions/average customer loans 0.4 0.9 1.2-1.3 0.8-0.9 0.9-1.0
Gross nonperforming assets/customer loans 5.1 4.9 5.8-6.4 5.3-5.9 5.3-5.8
Risk-adjusted capital ratio 15.6 12.3 11.7-12.3 11.4-12.0 11.2-11.7
All figures are S&P Global Ratings-adjusted. a--Actual. f--Forecast.
Anchor: 'bbb-' For Banks Operating Only In The UAE
Our starting point for a commercial bank operating in the UAE is 'bbb-'. The UAE has a wealthy economy with strong
fiscal and external positions. The strength of the government's net asset position has helped counteract the negative
impact of lower oil prices on economic growth since late 2015. The COVID-19 pandemic, lower oil prices, and
continued pressure on the real estate sector have increased risks for UAE banks, and we expect the banking sector's
problem loans to increase further once the regulatory forbearance measures are lifted and banks start to account for
the impact of the economic shock. However, we expect this process to be gradual, minimizing the impact on the
banking system. Although UAE banks traditionally operate with healthy profitability metrics, low interest rates have
negative consequences for bank margins. We therefore expect the banking sector's profitability will remain lower for
WWW.STANDARDANDPOORS.COM/RATINGSDIRECT AUGUST 16, 2021 3
Sharjah Islamic Bank

longer.
After the pandemic started, the UAE Central Bank implemented its Targeted Economic Support Scheme (TESS), which
helped ease the pressure on corporate issuers and small and midsize enterprises. However, the scheme did not reduce
credit risk on the banking system's balance sheet. The scheme included a provision that allows banks not to classify
deferred exposures as Stage 2 and Stage 3. Rather, banks have classified deferrals into two groups: Group 1 (exposures
to clients that are temporarily and mildly impacted); and Group 2 (exposures to clients that are significantly impacted
and could see potential stage migrations) and disclosed the information, which we view as positive. At year-end 2020,
12% of the top 10 banks' exposures were classified as Group 1 and 2% as Group 2. UAE banks enjoy a good funding
profile. Public-sector and government depositors provide more than 30% of resident deposits. We expect these entities
to withdraw some deposits in 2021 but do not see any immediate liquidity challenges for banks.
Business Position: Strong Presence In Sharjah But Challenger In The UAEMarket
A small financial institution with an entrenched niche. SIB is a smaller institution in the UAE market with total assets
representing around 1.6% of systemwide total. However, it ranks fourth among local Islamic banks with a share of
around 7%-8% in UAE Islamic-finance market at year-end 2020 and has the role of the flagship financial institution in
the emirate of Sharjah. The government of Sharjah owns 37.6% of the bank and it draws around 60% of its revenue
from business in Sharjah. This position in Sharjah will help the bank to outpace its peers in terms of growth as it takes
business from weaker banks.
Lending to the Sharjah government and GREs will continue to be key exposure of the bank. Exposure to bank's major
shareholders and other related parties (mostly various government vehicles) stands at around 30% of the bank's
financing. We believe that, given projected deficits for the government of Sharjah, the bank will continue lending to the
emirate and its GREs, further linking its intrinsic credit quality with those of the Sharjah government.
WWW.STANDARDANDPOORS.COM/RATINGSDIRECT AUGUST 16, 2021 4
Sharjah Islamic Bank

Chart 1
Capital And Earnings: Strong In A Global Context
We see capitalization as a positive rating factor for SIB. This reflects our expectation that the bank's projected RAC
ratio will remain at 11.5%-12.0% over the next 12-24 months, as compared with 13.8% at year-end 2020. Although the
bank significantly expanded its lending in 2020, most of the growth was spurred by lending to government authorities,
in particular the government of Sharjah. We expect SIB will continue expanding at a faster pace than its peer group,
with financing expanding by 7%-8% per year as it captures market share from other Sharjah-based banks.
Risk Position: Concentrated Exposures Similar To Peers
Similar to other banks in the Gulf Cooperation Council, a key source of risk for SIB lies in high single-party
concentration. The 20 largest funded and unfunded corporate gross credit exposures represented around 30% of the
bank's loan book as of year-end 2020 (excluding those to the government of Sharjah and its GREs). Similar to its peers,
SIB exhibits high real estate and construction exposures. At year-end 2020, loans to these sectors comprised about
23% of the loan book, compared with a UAE banking industry average of about 20%. This number is further inflated by
bank's exposure to high net worth individuals which is frequently linked to underlying real estate risks.
WWW.STANDARDANDPOORS.COM/RATINGSDIRECT AUGUST 16, 2021 5
Sharjah Islamic Bank

SIB's stock of problematic loans as a share of total loans is broadly commensurate with the systemwide average.
Although this is partially masked by the very high share of loans with deferred payments, the volume of Group 2
exposures (3.3% of total as of the second quarter) is manageable, and we believe the bank will be able to absorb the
increase in Stage 2 and Stage 3 loans once the TESS-related waivers are lifted. We also note that SIB's coverage of
existing Stage 3 loans is broadly on par with the country average.
SIB's focus on the public sector helped it to navigate market pressure in 2020. We nevertheless expect some
deterioration in asset-quality indicators because regulatory forbearance measures are progressively lifted. At mid-2021
around 11% of the loan book continued to benefit from deferrals. We factor an average cost of risk of above 100 bps
over the next two to three years in our base-case forecast and expect the share of Stage 3 loans will revert to the 5.5%
range. We also expect the bank will maintain Stage 3 coverage by specific provisions of about 60%, broadly on par
with UAE market average.
SIB's stand-alone credit profile remains closely linked to that of the government of Sharjah. With 28% of credit risk
exposures being to sovereign risk (mostly the government of Sharjah) and sizable exposure to GREs on top of that,
SIB's credit quality is tightly linked to that of Sharjah (BBB-/Stable/A-3). Deterioration in the government's financial
profile will likely put pressure on the bank's SACP as well.
Chart 2 Chart 3
Funding And Liquidity: Deposit-Funded Franchise
SIB's funding profile is in line with its domestic peers. The bank funds itself predominantly from domestic customer
deposits. As of March 31, 2021, SIB's loan-to-deposit ratio stood at 82.6% and the ratio of stable funding resources to
funding needs was a healthy 112%, according to our calculations. SIB enjoys steady access to deposits from the
government of Sharjah and its cash-rich related entities, thanks to its privileged relationship. Like most banks in the
Gulf Cooperation Council, SIB exhibits funding concentrations. Its ratio of top 20 depositors to total deposits remained
high at 36% at year-end 2020, and mainly comprised deposits from government and public-sector entities.
WWW.STANDARDANDPOORS.COM/RATINGSDIRECT AUGUST 16, 2021 6
Sharjah Islamic Bank

The bank has a relatively liquid balance sheet. Broad liquid assets covered short-term wholesale funding needs by
1.82x and net broad liquid assets covered 14.2% of short-term customer deposits as of June 30, 2021. The latter
number, although low in the global context, is nevertheless commensurate with many other Islamic peers.
Support: Three Notches Of Uplift For Systemic Importance
The issuer credit rating on Sharjah Islamic Bank is three notches higher than its SACP, reflecting our view of a high
likelihood of extraordinary government support for SIB if needed. This is in line with the bank's high systemic
importance in the UAE. SIB is the fourth-largest Islamic bank in the UAE, with a market share of 7%-8% in terms of
Islamic loans and deposits. The assessment also reflects the bank's strong relationship with the government of Sharjah,
which owns 37.6% of SIB. We also consider the UAE authorities as highly supportive toward their banking system,
with a strong track record of support provision.
Ratings Above The Sovereign
We apply the sovereign stress test for SIB at the UAE level and not at the level of Sharjah, where the bank has material
exposure. This is because we view the UAE as the relevant level of jurisdiction for Sharjah's banks (see "Guidance |
Criteria | Financial Institutions | General: Ratings Above The Sovereign--Corporate And Government Ratings:
Methodology And Assumptions", published Feb. 13, 2019, on Ratings Direct).
Environmental, Social, And Governance
We believe environmental, social, and governance (ESG) credit factors influence SIB's credit quality to a similar extent
as industry and country peers. Although we estimate that the bank has relatively limited direct lending to sectors
exposed to energy transition risk, the indirect exposure (via the overall dependence of the UAE economy on
hydrocarbons) is higher. Social risks are not significantly different from those of its industry peers. Sharjah's
government directly and indirectly owns 37.6% of the bank, which helps SIB maintain key account relationships with
the Sharjah government and GREs. That said, we believe the ownership structure has not resulted in any governance
weakness. In the past few years, SIB has not been involved in any material reputational controversies, has not
experienced any incident related to noncompliance with laws and regulations, and has not been subject to any
significant legal or regulatory fines or settlements. Finally, we believe that bank regulation in the UAE is less focused
on consumer protection than in more developed economies, meaning SIB's exposure to mis-selling penalties or other
retail conduct risks is rather limited.
Key Statistics
WWW.STANDARDANDPOORS.COM/RATINGSDIRECT AUGUST 16, 2021 7
Sharjah Islamic Bank

Table 1
Sharjah Islamic Bank Key Figures
--Year-ended Dec. 31--
(Mil. AED) 2021* 2020 2019 2018 2017
Adjusted assets 54,351.2 53,600.8 46,390.5 44,745.5 38,288.5
Customer loans (gross) 30,638.4 30,556.4 26,261.3 25,580.5 22,837.8
Adjusted common equity 5,646.9 5,405.6 5,389.8 5,173.7 5,260.1
Operating revenues 687.1 1,247.4 1,219.9 1,156.4 1,155.1
Noninterest expenses 269.8 561.5 585.4 614.2 556.2
Core earnings 289.5 430.1 537.7 505.3 450.1
*Data as of June 30. AED--UAE dirham.
Table 2
Sharjah Islamic Bank Business Position
--Year-ended Dec. 31--
(%) 2021* 2020 2019 2018 2017
Loan market share in country of domicile N/A N/A N/A N/A N/A
Deposit market share in country of domicile N/A N/A N/A N/A N/A
Total revenues from business line (currency in millions) 687.1 1,259.2 1,227.7 1,161.4 1,182.7
Commercial banking/total revenues from business line 56.4 52.9 45.6 51.1 61.6
Retail banking/total revenues from business line 25.9 28.2 30.9 26.3 23.8
Commercial & retail banking/total revenues from business line 82.3 81.1 76.5 77.4 85.4
Trading and sales income/total revenues from business line N/A N/A N/A N/A N/A
Corporate finance/total revenues from business line N/A N/A N/A N/A N/A
Brokerage/total revenues from business line N/A N/A N/A N/A N/A
Insurance activities/total revenues from business line N/A N/A N/A N/A N/A
Agency services/total revenues from business line N/A N/A N/A N/A N/A
Payments and settlements/total revenues from business line N/A N/A N/A N/A N/A
Asset management/total revenues from business line N/A N/A N/A N/A N/A
Other revenues/total revenues from business line 17.7 18.9 23.5 22.6 14.6
Investment banking/total revenues from business line N/A N/A N/A N/A N/A
Return on average common equity 10.0 7.1 9.8 9.4 9.2
*Data as of June 30. N/A--Not applicable.
Table 3
Sharjah Islamic Bank Capital And Earnings
--Year-ended Dec. 31--
(%) 2021* 2020 2019 2018 2017
Tier 1 capital ratio 19.6 19.5 21.6 16.5 19.5
S&P Global Ratings’ RAC ratio before diversification N/A 13.8 15.6 12.3 15.7
S&P Global Ratings’ RAC ratio after diversification N/A 7.9 11.9 9.5 11.1
Adjusted common equity/total adjusted capital 75.5 75.2 75.2 100.0 100.0
Double leverage N.M. N.M. N.M. N.M. N.M.
Net interest income/operating revenues 78.3 78.1 73.6 51.8 55.1
WWW.STANDARDANDPOORS.COM/RATINGSDIRECT AUGUST 16, 2021 8
Sharjah Islamic Bank
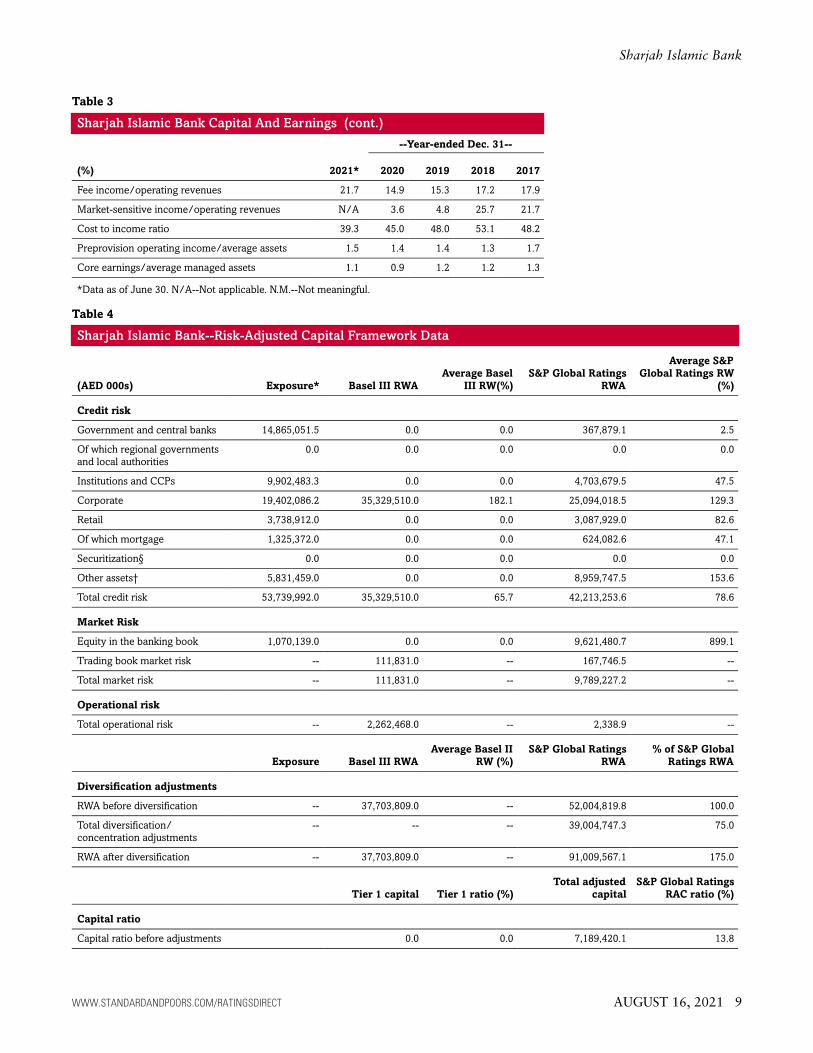
Table 3
Sharjah Islamic Bank Capital And Earnings (cont.)
--Year-ended Dec. 31--
(%) 2021* 2020 2019 2018 2017
Fee income/operating revenues 21.7 14.9 15.3 17.2 17.9
Market-sensitive income/operating revenues N/A 3.6 4.8 25.7 21.7
Cost to income ratio 39.3 45.0 48.0 53.1 48.2
Preprovision operating income/average assets 1.5 1.4 1.4 1.3 1.7
Core earnings/average managed assets 1.1 0.9 1.2 1.2 1.3
*Data as of June 30. N/A--Not applicable. N.M.--Not meaningful.
Table 4
Sharjah Islamic Bank--Risk-Adjusted Capital Framework Data
(AED 000s) Exposure* Basel III RWA
Average Basel
III RW(%)
S&P Global Ratings
RWA
Average S&P
Global Ratings RW
(%)
Credit risk
Government and central banks 14,865,051.5 0.0 0.0 367,879.1 2.5
Of which regional governments
and local authorities
0.0 0.0 0.0 0.0 0.0
Institutions and CCPs 9,902,483.3 0.0 0.0 4,703,679.5 47.5
Corporate 19,402,086.2 35,329,510.0 182.1 25,094,018.5 129.3
Retail 3,738,912.0 0.0 0.0 3,087,929.0 82.6
Of which mortgage 1,325,372.0 0.0 0.0 624,082.6 47.1
Securitization§ 0.0 0.0 0.0 0.0 0.0
Other assets† 5,831,459.0 0.0 0.0 8,959,747.5 153.6
Total credit risk 53,739,992.0 35,329,510.0 65.7 42,213,253.6 78.6
Market Risk
Equity in the banking book 1,070,139.0 0.0 0.0 9,621,480.7 899.1
Trading book market risk -- 111,831.0 -- 167,746.5 --
Total market risk -- 111,831.0 -- 9,789,227.2 --
Operational risk
Total operational risk -- 2,262,468.0 -- 2,338.9 --
Exposure Basel III RWA
Average Basel II
RW (%)
S&P Global Ratings
RWA
% of S&P Global
Ratings RWA
Diversification adjustments
RWA before diversification -- 37,703,809.0 -- 52,004,819.8 100.0
Total diversification/
concentration adjustments
-- -- -- 39,004,747.3 75.0
RWA after diversification -- 37,703,809.0 -- 91,009,567.1 175.0
Tier 1 capital Tier 1 ratio (%)
Total adjusted
capital
S&P Global Ratings
RAC ratio (%)
Capital ratio
Capital ratio before adjustments 0.0 0.0 7,189,420.1 13.8
WWW.STANDARDANDPOORS.COM/RATINGSDIRECT AUGUST 16, 2021 9
Sharjah Islamic Bank

Table 4
Sharjah Islamic Bank--Risk-Adjusted Capital Framework Data (cont.)
Capital ratio after adjustments‡ 0.0 0.0 7,189,420.1 7.9
*Exposure at default. §Securitization exposure includes the securitization tranches deducted from capital in the regulatory framework. †Exposure
and S&P Global Ratings’ risk-weighted assets for equity in the banking book include minority equity holdings in financial institutions.
‡Adjustments to Tier 1 ratio are additional regulatory requirements (e.g. transitional floor or Pillar 2 add-ons). RWA--Risk-weighted assets.
RW--Risk weight. RAC--Risk-adjusted capital. AED--UAE dirham. CCPs--Central counterparty clearing house. Sources: Company data as of Dec.
31, 2020, S&P Global Ratings.
Table 5
Sharjah Islamic Bank Risk Position
--Year-ended Dec. 31--
(%) 2021* 2020 2019 2018 2017
Growth in customer loans 0.5 16.4 2.7 12.0 26.1
Total diversification adjustment/S&P Global Ratings’ RWA before diversification N/A 75.0 31.4 29.8 42.0
Total managed assets/adjusted common equity (x) 9.6 9.9 8.6 8.6 7.3
New loan loss provisions/average customer loans 0.8 0.9 0.4 0.2 0.7
Net charge-offs/average customer loans 0.3 0.2 1.6 (0.1) (0.3)
Gross nonperforming assets/customer loans + other real estate owned 5.0 4.9 5.1 5.5 5.0
Loan loss reserves/gross nonperforming assets 88.2 86.2 82.8 104.0 99.8
*Data as of June 30. N/A--Not applicable.
Table 6
Sharjah Islamic Bank Funding And Liquidity
--Year-ended Dec. 31--
(%) 2021* 2020 2019 2018 2017
Core deposits/funding base 76.4 74.5 72.0 68.7 70.0
Customer loans (net)/customer deposits 83.7 87.1 92.1 91.2 97.3
Long-term funding ratio 88.7 87.5 88.7 89.2 93.3
Stable funding ratio 109.1 104.2 107.2 106.1 106.4
Short-term wholesale funding/funding base 13.2 14.6 13.5 12.3 7.9
Broad liquid assets/short-term wholesale funding (x) 1.8 1.4 1.7 1.7 2.2
Net broad liquid assets/short-term customer deposits 14.2 8.4 13.7 12.2 13.9
Short-term wholesale funding/total wholesale funding 47.9 49.5 41.2 39.4 26.3
Narrow liquid assets/3-month wholesale funding (x) N/A 1.7 1.9 2.5 2.1
*Data as of June 30.
Related Criteria
• General Criteria: Group Rating Methodology, July 1, 2019
• General Criteria: Hybrid Capital: Methodology And Assumptions, July 1, 2019
• Criteria | Financial Institutions | General: Risk-Adjusted Capital Framework Methodology, July 20, 2017
• General Criteria: Methodology For Linking Long-Term And Short-Term Ratings, April 7, 2017
• General Criteria: Ratings Above The Sovereign--Corporate And Government Ratings: Methodology And
WWW.STANDARDANDPOORS.COM/RATINGSDIRECT AUGUST 16, 2021 10
Sharjah Islamic Bank

Assumptions, Nov. 19, 2013
• Criteria | Financial Institutions | Banks: Quantitative Metrics For Rating Banks Globally: Methodology And
Assumptions, July 17, 2013
• Criteria | Financial Institutions | Banks: Banks: Rating Methodology And Assumptions, Nov. 9, 2011
• Criteria | Financial Institutions | Banks: Banking Industry Country Risk Assessment Methodology And
Assumptions, Nov. 9, 2011
• General Criteria: Principles Of Credit Ratings, Feb. 16, 2011
Anchor Matrix
Industry
Risk
Economic Risk
1 2 3 4 5 6 7 8 9 10
1 a a a- bbb+ bbb+ bbb - - - -
2 a a- a- bbb+ bbb bbb bbb- - - -
3 a- a- bbb+ bbb+ bbb bbb- bbb- bb+ - -
4 bbb+ bbb+ bbb+ bbb bbb bbb- bb+ bb bb -
5 bbb+ bbb bbb bbb bbb- bbb- bb+ bb bb- b+
6 bbb bbb bbb- bbb- bbb- bb+ bb bb bb- b+
7 - bbb- bbb- bb+ bb+ bb bb bb- b+ b+
8 - - bb+ bb bb bb bb- bb- b+ b
9 - - - bb bb- bb- b+ b+ b+ b
10 - - - - b+ b+ b+ b b b-
Ratings Detail (As Of August 16, 2021)*
Sharjah Islamic Bank
Issuer Credit Rating A-/Stable/A-2
Issuer Credit Ratings History
25-Mar-2021 A-/Stable/A-2
26-Mar-2020 A-/Negative/A-2
27-May-2019 A-/Stable/A-2
Sovereign Rating
Abu Dhabi (Emirate of) AA/Stable/A-1+
Related Entities
SIB Sukuk Co. III Ltd.
Senior Unsecured A-
*Unless otherwise noted, all ratings in this report are global scale ratings. S&P Global Ratings’ credit ratings on the global scale are comparable
across countries. S&P Global Ratings’ credit ratings on a national scale are relative to obligors or obligations within that specific country. Issue and
debt ratings could include debt guaranteed by another entity, and rated debt that an entity guarantees.
WWW.STANDARDANDPOORS.COM/RATINGSDIRECT AUGUST 16, 2021 11
Sharjah Islamic Bank

WWW.STANDARDANDPOORS.COM/RATINGSDIRECT AUGUST 16, 2021 12
STANDARD & POOR’S, S&P and RATINGSDIRECT are registered trademarks of Standard & Poor’s Financial Services LLC.
S&P may receive compensation for its ratings and certain analyses, normally from issuers or underwriters of securities or from obligors. S&P reserves the right to disseminateits opinions and analyses. S&P's public ratings and analyses are made available on its Web sites, www.standardandpoors.com (free of charge), and www.ratingsdirect.com(subscription), and may be distributed through other means, including via S&P publications and third-party redistributors. Additional information about our ratings fees isavailable at www.standardandpoors.com/usratingsfees.
S&P keeps certain activities of its business units separate from each other in order to preserve the independence and objectivity of their respective activities. As a result,certain business units of S&P may have information that is not available to other S&P business units. S&P has established policies and procedures to maintain theconfidentiality of certain non-public information received in connection with each analytical process.
To the extent that regulatory authorities allow a rating agency to acknowledge in one jurisdiction a rating issued in another jurisdiction for certain regulatory purposes, S&Preserves the right to assign, withdraw or suspend such acknowledgment at any time and in its sole discretion. S&P Parties disclaim any duty whatsoever arising out of theassignment, withdrawal or suspension of an acknowledgment as well as any liability for any damage alleged to have been suffered on account thereof.
Credit-related and other analyses, including ratings, and statements in the Content are statements of opinion as of the date they are expressed and not statements of fact.S&P’s opinions, analyses and rating acknowledgment decisions (described below) are not recommendations to purchase, hold, or sell any securities or to make anyinvestment decisions, and do not address the suitability of any security. S&P assumes no obligation to update the Content following publication in any form or format. TheContent should not be relied on and is not a substitute for the skill, judgment and experience of the user, its management, employees, advisors and/or clients when makinginvestment and other business decisions. S&P does not act as a fiduciary or an investment advisor except where registered as such. While S&P has obtained information fromsources it believes to be reliable, S&P does not perform an audit and undertakes no duty of due diligence or independent verification of any information it receives. Rating-related publications may be published for a variety of reasons that are not necessarily dependent on action by rating committees, including, but not limited to, the publicationof a periodic update on a credit rating and related analyses.
No content (including ratings, credit-related analyses and data, valuations, model, software or other application or output therefrom) or any part thereof (Content) may bemodified, reverse engineered, reproduced or distributed in any form by any means, or stored in a database or retrieval system, without the prior written permission ofStandard & Poor’s Financial Services LLC or its affiliates (collectively, S&P). The Content shall not be used for any unlawful or unauthorized purposes. S&P and any third-partyproviders, as well as their directors, officers, shareholders, employees or agents (collectively S&P Parties) do not guarantee the accuracy, completeness, timeliness oravailability of the Content. S&P Parties are not responsible for any errors or omissions (negligent or otherwise), regardless of the cause, for the results obtained from the useof the Content, or for the security or maintenance of any data input by the user. The Content is provided on an “as is” basis. S&P PARTIES DISCLAIM ANY AND ALL EXPRESSOR IMPLIED WARRANTIES, INCLUDING, BUT NOT LIMITED TO, ANY WARRANTIES OF MERCHANTABILITY OR FITNESS FOR A PARTICULAR PURPOSE OR USE, FREEDOMFROM BUGS, SOFTWARE ERRORS OR DEFECTS, THAT THE CONTENT’S FUNCTIONING WILL BE UNINTERRUPTED OR THAT THE CONTENT WILL OPERATE WITH ANYSOFTWARE OR HARDWARE CONFIGURATION. In no event shall S&P Parties be liable to any party for any direct, indirect, incidental, exemplary, compensatory, punitive,special or consequential damages, costs, expenses, legal fees, or losses (including, without limitation, lost income or lost profits and opportunity costs or losses caused bynegligence) in connection with any use of the Content even if advised of the possibility of such damages.
Copyright © 2021 by Standard & Poor’s Financial Services LLC. All rights reserved.