shear stresses in honeycomb sandwich...
TRANSCRIPT

1 Shear Stresses in Honeycombs Laurent Wahl
October, 2011 University of Luxembourg
Shear Stresses in Honeycomb Sandwich Plates: Analytical Solution, FEM and Experimental
Verification
Laurent Wahl, Stefan Maas, Danièle Waldmann: University of Luxembourg, Luxembourg
Arno Zürbes: FH Bingen, Germany
Patrick Frères: Eurocomposites, Echternach, Luxembourg
Summary: Honeycomb composite structures are used in airplanes, railway cars and vehicles. The sandwich panels consist of two stiff face sheets of aluminium, which are bonded to a very lightweight honeycomb core of aluminium. Compared to normal plates, sandwich panels have a very high stiffness and simultaneously a low weight. The core of these structures is mainly subjected to shear stresses. The shear stresses depend strongly on the angle of the load application. The distribution and the level of the shear stresses are investigated using analytical calculations. The load direction which induces highest stresses in the honeycomb core is derived. This direction is not the W-direction, which is the most compliant one. When doing finite element simulations of honeycomb cores, often the core is homogenized in order to reduce the calculation time. In this article, some equations are derived in order to calculate the real shear stresses from the shear stresses of the homogeneous core. The equations are validated by finite element simulations and partially by tests. Three-point bending tests and additionally some Food Cart Roller Tests were conducted in order to test the panels in different angles. Keywords: Sandwich, honeycomb, core, shear stresses, shear strength, critical angle, weakest direction, homogenization, FEM, finite elements, ANSYS, test
2 Shear Stresses in Honeycombs Laurent Wahl
October, 2011 University of Luxembourg
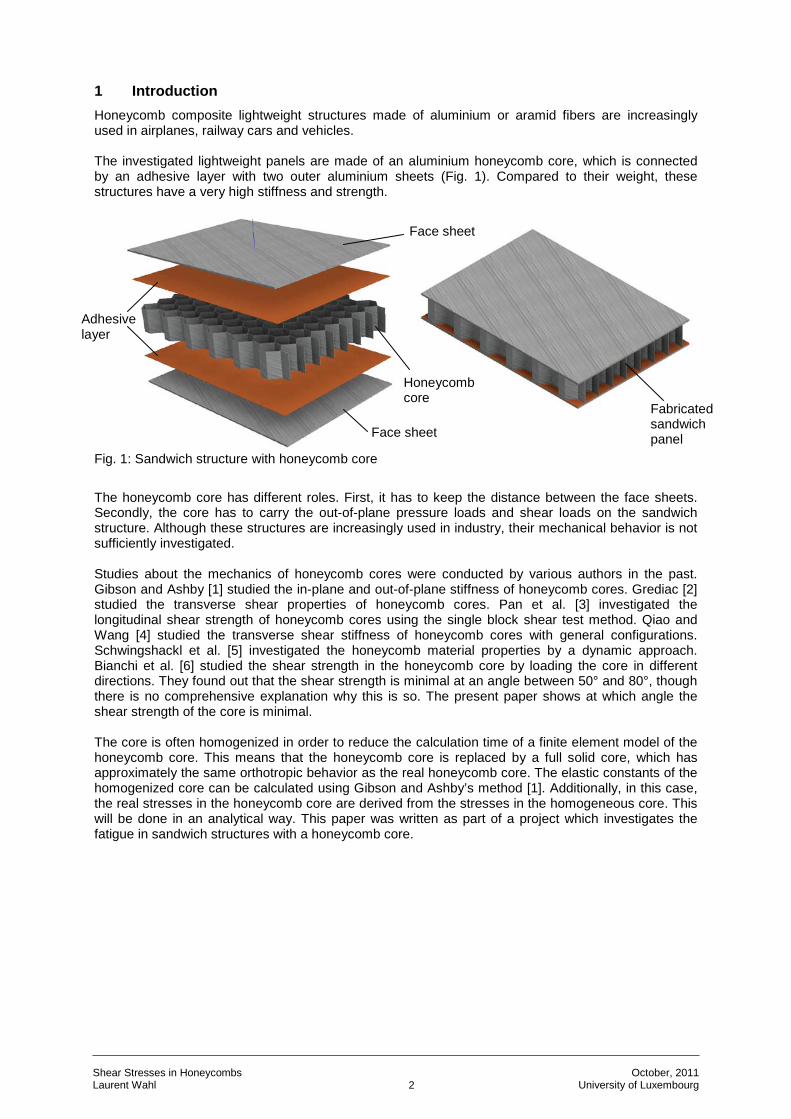
1 Introduction Honeycomb composite lightweight structures made of aluminium or aramid fibers are increasingly used in airplanes, railway cars and vehicles. The investigated lightweight panels are made of an aluminium honeycomb core, which is connected by an adhesive layer with two outer aluminium sheets (Fig. 1). Compared to their weight, these structures have a very high stiffness and strength.
Fig. 1: Sandwich structure with honeycomb core
The honeycomb core has different roles. First, it has to keep the distance between the face sheets. Secondly, the core has to carry the out-of-plane pressure loads and shear loads on the sandwich structure. Although these structures are increasingly used in industry, their mechanical behavior is not sufficiently investigated. Studies about the mechanics of honeycomb cores were conducted by various authors in the past. Gibson and Ashby [1] studied the in-plane and out-of-plane stiffness of honeycomb cores. Grediac [2] studied the transverse shear properties of honeycomb cores. Pan et al. [3] investigated the longitudinal shear strength of honeycomb cores using the single block shear test method. Qiao and Wang [4] studied the transverse shear stiffness of honeycomb cores with general configurations. Schwingshackl et al. [5] investigated the honeycomb material properties by a dynamic approach. Bianchi et al. [6] studied the shear strength in the honeycomb core by loading the core in different directions. They found out that the shear strength is minimal at an angle between 50° and 80°, though there is no comprehensive explanation why this is so. The present paper shows at which angle the shear strength of the core is minimal. The core is often homogenized in order to reduce the calculation time of a finite element model of the honeycomb core. This means that the honeycomb core is replaced by a full solid core, which has approximately the same orthotropic behavior as the real honeycomb core. The elastic constants of the homogenized core can be calculated using Gibson and Ashby’s method [1]. Additionally, in this case, the real stresses in the honeycomb core are derived from the stresses in the homogeneous core. This will be done in an analytical way. This paper was written as part of a project which investigates the fatigue in sandwich structures with a honeycomb core.
Face sheet
Face sheet
Adhesive layer
Honeycomb core
Fabricated sandwich panel

3 Shear Stresses in Honeycombs Laurent Wahl
October, 2011 University of Luxembourg
2 Parameters of the honeycomb core Since the behavior of the panels is orthotropic, the panels react differently depending on the direction of the loading. Therefore it is necessary to distinguish between the directions of symmetry, the so-called L and W-direction (Fig. 2). The walls of the honeycomb cells have different thicknesses, due to the manufacturing process in which the foils are partly glued together. The glued walls with double thickness are called “nodes” while the others are called “free walls” [7]. The different parameters, which are used in the next chapters, are shown in Fig. 2. The parameters a, b, c and h describe the cell size. The parameter t is the thickness of the free walls. As the structure is not isotropic, the angle α has to be introduced with α=0° meaning L-direction and α=90° meaning W-direction. In this paper, the core direction α=0° (L-direction) is always in the x-direction of the coordinate system. The coordinate system is fixed to the orientation of the core.
Fig. 2: Parameter notations
Calculations are presented with the above-defined variable parameters for a general case (Fig. 2). Simulations and tests had to be done with a specific cell geometry. The parameter values of the examined panels are shown in Table 1. 6.4mm cell (=2*b) Material Aluminium a=c 3mm b 3.2mm Panel height h 10mm Face sheet thickness 0.6mm Honeycomb foil thickness t 0.08mm Table 1: Material and dimensions of the panels used in the simulations and the tests (the calculations apply to a general case)

4 Shear Stresses in Honeycombs Laurent Wahl
October, 2011 University of Luxembourg
3 Shear Stresses Sandwich panels loaded transversely are subjected to normal and shear stresses: First, the face sheets are mainly subjected to tension and compression loads. Secondly, the core is subjected to shear stresses (Fig. 3). The analytical determination of the shear stresses in the core is detailed later. Clamped sandwich panel with Shear stresses in the core Simplified constant shear transverse load and shear flow show a parabolic distribution stress distribution
Fig. 3: Shear flow and shear stresses in a sandwich panel loaded in W-direction (same shear stress in every free wall)
In the case of Fig. 3 (W-direction), the shear stresses are equally distributed in the free walls, which makes calculating the stresses easy. The nodes are not subjected to any shear stress. In Fig. 4, the orientation of the honeycomb core is rotated. The shear loads are no longer equally distributed. The cell walls are oriented in three different angles, subjected to the different shear stresses τ1, τ2 and τ3. In the following, the shear stresses are calculated for any core orientation. The shear stresses τ1, τ2 and τ3 are defined as indicated in Fig. 4.
Fig. 4: The shear stresses τ1, τ2 and τ3 are not identical for a core orientation of 70°

5 Shear Stresses in Honeycombs Laurent Wahl
October, 2011 University of Luxembourg
3.1 Distribution of shear stresses in a sandwich panel The shear stresses in the core of the structure are calculated for a transverse load and any orientation. α is the orientation of the core with respect to the nodes as shown in Fig. 4. α=0° is always the L-direction (stiffest direction) and α=90° is the W-direction.
3.1.1 Assumptions
The shear stresses τ1, τ2 and τ3 in the core are constant in one cell wall (the stresses throughout the depth of the core have in reality a parabolic shape, but analog to the web in an I-beam, the error of this assumption is small). The cell walls are only subjected to shear stresses in the plane of the wall. The shear stresses in every cell wall depend on the angle α in a sinusoidal way as will be shown in Chapter 3.2:
3,2,13,2,13,2,13,2,13,2,1 )cos()( CBA=τ ++⋅ ϕαα (1)
In equation (1), α is the variable orientation angle, φ is a constant phase shift and the indices 1, 2 and 3 are defined in Fig. 4.
3.1.2 Simplifications
The shear stresses are periodic with a period of 360°:
1)360()( 3,2,13,2,13,2,1 =⇒°+ Bτ=τ αα (2)
If the α-direction of the load is inverted (rotated by 180°), the shear stresses are opposed:
0)180()( 3,2,13,2,13,2,1 =⇒°+− Cτ=τ αα (3)
Substituting the equations (2) and (3) in equation (1):
)cos()( 3,2,13,2,13,2,1 ϕαα +⋅A=τ (4)
The nodes are parallel to the xz-plane and the honeycomb core is orthotropic, hence:
0)()( 111 =⇒− ϕαα τ=τ (5)
The free walls are not parallel to the xz or yz-plane, so:
0 and 0 32 ≠≠ ϕϕ (6)
The free walls are symmetric to the xz-plane, following:
322332 and )()( AAτ=τ ==−=⇒− ϕϕϕαα (7)
In summary:
)cos()( 11 αα ⋅= Aτ (8)
)cos()( 22 ϕαα −⋅= Aτ (9)
)cos()( 23 ϕαα +⋅= Aτ (10)

6 Shear Stresses in Honeycombs Laurent Wahl
October, 2011 University of Luxembourg
3.1.3 Shear stresses in L and W-direction
In this chapter, the shear stresses in the L-direction (0°) and W-direction (90°) are derived. Concerning these particular directions, the shear stresses can be derived after some straightforward reflections. With these results, it will be possible to derive the unknown constants A1, A2 and φ. L-direction:
Fig. 5: Shear flow in a panel oriented in L-direction
The shear flow in the honeycomb core of a sandwich panel oriented in the L-direction is illustrated in Fig. 5. All the free walls are subjected to the same shear flow, while the nodes are subjected to the double amount of shear flow. Because the nodes are twice as thick as the free walls, every cell wall is subjected to the same shear stress (geometric properties refer to Fig. 2):
bt
q=
blt
lq==τ=τ=τ⋅⋅
⋅°°°
hhAreaForce)0()0()0( 321
(11)
In equation (11), the stress is the force divided by the area. The area is the product of the height h times the wall thickness times the number of walls. The number of walls is equal to l/b. W-direction:
Fig. 6: Shear flow in a panel loaded in W-direction

7 Shear Stresses in Honeycombs Laurent Wahl
October, 2011 University of Luxembourg
Fig. 6 illustrates the shear flow in the core of a sandwich panel loaded in the W-direction. The nodes are not subjected to any shear stress:
0)90(1 =τ ° (12)
The free walls are subjected to the following shear stress:
cath
calth
)90()90( 32
+⋅
=
+⋅
⋅⋅°°
qlq=A
lq=τ=τ (13)
The only difference between equation (13) and (11) is the number of cell walls over length l. In the W-direction, there are l/(a+c) cell walls over length l.
3.1.4 Determination of the phase shift φ (=weakest direction)
Equations (9) and (10) state that the shear stresses in the free walls vary with the cosine of the angle α. It was derived that the cosine is still containing the phase angle φ. ±φ specifies at which angle α the stresses reach their maximum. The phase shift φ is different from 0° and 90°, meaning that the weakest direction is neither the L nor the W-direction, but the φ-direction as τ2 reaches its maximum at α=+φ (and τ3 at α=-φ). We can insert equation (11) in equation (9):
bt
q=A
bt
q=τ⋅
⋅⇒⋅
°h
)cos(h
)0( 22 ϕ (14)
Substituting equation (13) in (9):
cath
)sin(
cath
)90( 22
+⋅
⋅⇒
+⋅
°q=Aq=τ ϕ
(15)
By dividing equation (15) by equation (14), we yield:
b)tan( ca= +ϕ (16)
Therefore, the weakest direction (i.e. the maximum shear stress τ2) is just depending on the cell geometry and is given by the phase angle φ, which can be determined by equation (16). For the cell geometry of Table 1, φ is exactly 62°. In Chapter 3.1.6, an easy example shows that 62° is the weakest direction.
3.1.5 Determination of the shear stress amplitudes
In this chapter the amplitudes A1 and A2 of the shear stresses are derived. We can insert the boundary condition in the L-direction (11) in equation (8) in order to get A1:
bt
qA
bt
q=τ⋅
=⇒⋅
°hh
)0( 11 (17)
Substituting equation (9) in (11):
bt
q=A
bt
q=τ⋅
⋅⇒⋅
°h
)cos(h
)0( 22 ϕ (18)

8 Shear Stresses in Honeycombs Laurent Wahl
October, 2011 University of Luxembourg
With equation (18), we derive the amplitude A2:
)cos(th2 ϕ⋅⋅⋅bq=A (19)
A summary of the results is shown in Table 2. These formulas allow us to calculate analytically the shear stresses in a honeycomb core in the case of a panel subjected to a transverse shear force q.
)cos()( 11 αα ⋅= Aτ (20)
)cos()( 22 ϕαα −⋅= Aτ (21)
)cos()( 23 ϕαα +⋅= Aτ (22)
With :
b)tan( ca= +ϕ (23)
tbqA⋅⋅
=h1 (24)
)cos(th2 ϕ⋅⋅⋅bq=A (25)
Table 2: Analytical formulas in order to calculate the shear stresses in a honeycomb core
3.1.6 Exemplification
The most flexible direction of honeycomb sandwiches is the W-direction, but the shear stresses reach their maximum in the φ-direction as described in Chapter 3.1.4. Fig. 7 illustrates the shear flows in the L, W and φ-direction for a round panel with the cell geometry described in Table 1 (for this cell geometry φ=62°). A shear load in φ=62°-direction induces a shear flow over 11 walls only, compared to 13 (or 25) in the W (or L) direction. Therefore, the shear stresses reach their maximum in 62°-direction.
Fig. 7: Shear flow in L, W and φ-direction
τ1
τ2 τ3
9 Shear Stresses in Honeycombs Laurent Wahl
October, 2011 University of Luxembourg
3.2 Comparison of analytical formulas vs. finite element method (FEM)
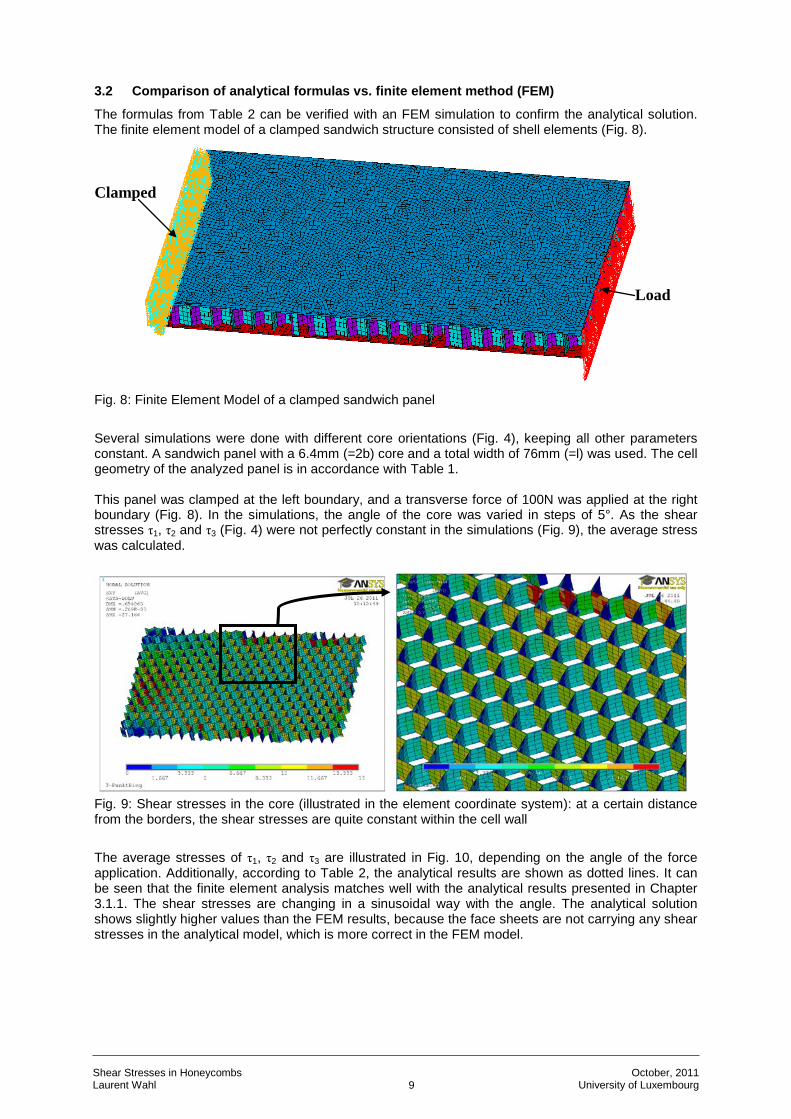
The formulas from Table 2 can be verified with an FEM simulation to confirm the analytical solution. The finite element model of a clamped sandwich structure consisted of shell elements (Fig. 8).
Fig. 8: Finite Element Model of a clamped sandwich panel
Several simulations were done with different core orientations (Fig. 4), keeping all other parameters constant. A sandwich panel with a 6.4mm (=2b) core and a total width of 76mm (=l) was used. The cell geometry of the analyzed panel is in accordance with Table 1. This panel was clamped at the left boundary, and a transverse force of 100N was applied at the right boundary (Fig. 8). In the simulations, the angle of the core was varied in steps of 5°. As the shear stresses τ1, τ2 and τ3 (Fig. 4) were not perfectly constant in the simulations (Fig. 9), the average stress was calculated.
Fig. 9: Shear stresses in the core (illustrated in the element coordinate system): at a certain distance from the borders, the shear stresses are quite constant within the cell wall
The average stresses of τ1, τ2 and τ3 are illustrated in Fig. 10, depending on the angle of the force application. Additionally, according to Table 2, the analytical results are shown as dotted lines. It can be seen that the finite element analysis matches well with the analytical results presented in Chapter 3.1.1. The shear stresses are changing in a sinusoidal way with the angle. The analytical solution shows slightly higher values than the FEM results, because the face sheets are not carrying any shear stresses in the analytical model, which is more correct in the FEM model.
Load
Clamped

10 Shear Stresses in Honeycombs Laurent Wahl
October, 2011 University of Luxembourg
Fig. 10: Comparison of the analytical results with an FEM simulation
4 Homogenization The finite element method (FEM) is frequently used in order to calculate the stresses in a structure. If a honeycomb core should be analyzed by FEM, a huge amount of elements is necessary due to the complex geometry. As for analyzing a big structure, this large amount of elements makes computation times explode. The number of elements can be highly reduced by replacing the honeycomb core with a homogeneous core boasting orthotropic properties. The homogeneous core must have the same stiffness as the honeycomb core. However, this simplification of the honeycomb core is only acceptable if nonlinear effects are not occurring in the core (e.g. buckling). Under this condition, the simulation with the homogeneous core gives the same displacements as the real honeycomb. However, the stresses in the homogeneous core are very different to the real stresses in the honeycomb core. In Chapter 4.1, the shear stresses in the homogeneous core are analyzed; in Chapter 4.2, a method is derived in order to calculate the real stresses in the honeycomb core, using the simulation results with a homogeneous core.
4.1 Shear stresses in the homogeneous core
Fig. 11: Sandwich with a homogeneous core in L and W-direction
τ2
τ1
τ3
L-direction W-direction

11 Shear Stresses in Honeycombs Laurent Wahl
October, 2011 University of Luxembourg
As in the calculations presented in Chapter 3, α is the rotation angle of the core with respect to the acting forces. 0° is always the core’s L-direction (stiffest direction). The homogenized core is orthotropic and homogeneous. Therefore we can assume that:
)cos(α⋅= xxz Aτ and )sin(α⋅= yyz Aτ (26)
In the load case in Fig. 11, the shear stress in the homogenized core can be assumed to be the force divided by the area (as shown in Fig. 3, it can be supposed that the shear stresses are constant across the thickness of the core):
hhAreaForce)0( q
llq==τ xz =⋅⋅
° (27)
The shear stress is not depending on the direction of the core. Therefore, the shear stress is the same if the core is oriented in either the L or W-direction. Hence:
)0(hhArea
Force)90( °==⋅⋅
° xzyz τqllq==τ (28)
Substituting equation (27) in equation (26):
hqAq=τ xxz =⇒°
h)0( (29)
Substituting (28) in (26):
hqAq=τ yyz =⇒°
h)90( (30)
From equation (29) and (30) we can conclude that:
AAA yx == (31)
Table 3 shows a summary of the results. Contrary to the honeycomb core, in the homogeneous core no weakest direction exists. The resultant of the shear stresses )()( 22 αταττ yzxzres += is equal to A at
every angle. Because of the orthotropic properties of the core, the stiffness is depending on the core orientation, but the stresses in the homogeneous core are the same in every direction.
)cos()( αα ⋅= Aτ xz (32)
)sin()( αα ⋅= Aτ yz (33)
With:
hqA = (34)
Table 3: Analytical formulas serving to calculate the shear stresses in a homogeneous core

12 Shear Stresses in Honeycombs Laurent Wahl
October, 2011 University of Luxembourg
4.2 Transformation of the stresses in the homogenized core into real stresses in the honeycomb core
In order to reduce the calculation time in finite element simulations, it is possible to replace the honeycomb core by an orthotropic homogeneous core with the same stiffness. When such a simplified simulation is done, it is possible to calculate analytically the stresses in the honeycomb core from the simulation with the homogeneous core, which is shown in this chapter. This calculation is only possible if the shear stresses τxz and τyz in the homogenized core are constant within one elementary cell (Fig. 12). In this case, the shear stresses τ1, τ2 and τ3 are also constant in one elementary cell.
Fig. 12: Stress components in one elementary cell of the honeycomb core and the homogeneous core
In Fig. 13, the shear stresses of the homogeneous and the honeycomb core are shown in dependence of the loading angle. The values in the diagram correspond to a sandwich panel with a 6.4mm core (Table 1). The structure is loaded by a transverse force q of 1.32N/mm as shown in Fig. 4 and Fig. 11. The formulas of Table 2 and Table 3 were used.
Fig. 13: A comparison of the shear loads in the homogenized core and the honeycomb core
In the following lines, the real honeycomb stresses from the homogenized stresses are calculated. From equation (20) and equation (32) we can conclude that:
tb
xz
=ττ1 (35)
τ1 τ2
τ3
τxz
τyz

13 Shear Stresses in Honeycombs Laurent Wahl
October, 2011 University of Luxembourg
Dividing equation (33) by (32):
xz
yz=ττ
α )tan( (36)
Equation (32) and equation (33) also result in:
)()( 22 ατατ yzxzA += (37)
Substituting equation (34) in equation (25):
)cos(t)cos(th2 ϕϕ ⋅⋅
=⋅⋅⋅ Abbq=A (38)
Substituting equation (37) in equation (38):
)cos(t)()( 22
2 ϕ
ατατ
⋅
+⋅= yzxzb
A (39)
Table 4 gives a summary of the formulas used to calculate the shear stresses in the honeycomb core from the shear stresses of the homogeneous core.
xztbτ τ⋅=1 (40)
)cos(22 ϕα −⋅= Aτ (41)
)cos(23 ϕα +⋅= Aτ (42)
With:
x
y=ττ
α )tan( (43)
b)tan( ca= +ϕ (44)
)cos(
22
2 ϕ
ττ
⋅
+⋅=
tb
A yzxz (45)
Table 4: Analytical formulas serving to calculate the shear stresses in the honeycomb core from the shear stresses of the homogeneous core
Additionally, if some tension or compression forces are acting in the z-direction on the homogeneous core, these stresses have to be superimposed on the stresses calculated in Table 4. Contrary to the homogeneous core, the tension or compression forces in the z-direction have to be carried in the honeycomb core by a much smaller volume of material. The tension/compression stresses in the homogeneous core can be calculated by multiplying the tension/compression stresses of the homogeneous core by the ratio of their areas. These stresses have the same direction as the homogeneous stresses.
)()(
22shomogeneou,honeycomb,cbat
cabzz
++⋅
+⋅⋅=σσ (46)

14 Shear Stresses in Honeycombs Laurent Wahl
October, 2011 University of Luxembourg
4.2.1 Verification
The formulas in Table 4 are verified in this chapter through a simple example, in which we use a clamped sandwich panel with the core oriented in 40°-direction and loaded by a transverse force q=1.32N/mm. Equations (32) and (33) show the shear stresses in the homogeneous core:
MPahqτ xz 1145.0)40cos()40( =°⋅=° (47)
0961.0)40sin()40( =°⋅=°hqτ yz (48)
Using the formulas from Table 4, we can now calculate the real shear stresses in the core: τ1 = 4.6MPa τ2 = 11.8MPa τ3 = -2.6MPa These correspond exactly to the FEM results shown in Fig. 10.
5 Experimental verification of the critical angle φ In order to verify the analytical results of Chapter 3, we analyze some experimental results in this chapter. In the case of the examined honeycomb structures, it is difficult to measure stresses in the core as the wall thicknesses in the core are extremely thin. For example, the application of strain gages would significantly influence the results. Additionally, the fact that this is a closed structure makes it difficult to analyze the structure’s interior. Due to these difficulties, the shear stresses could not be determined by static tests. However, some fatigue tests, which were done for other reasons too, can be used to evaluate the shear stress and to confirm the previous considerations. Other publications by the author [8] provide further details on the fatigue behavior of the honeycomb core.
5.1 Three-point bending tests
Fig. 14: Three-point bending setup used for fatigue testing

15 Shear Stresses in Honeycombs Laurent Wahl
October, 2011 University of Luxembourg
Dynamic three-point bending tests were carried out with a hydraulic cylinder from Instron Structural Testing Systems (IST) in order to provoke shear failure in the core. The hydraulic cylinder was used in a force-controlled manner. The tests were made at three orientation angles: 0° (L), 62° and 90° (W), with 0° being the stiffest direction, 90° the most compliant direction and 62° the weakest direction (In this direction the stresses are highest as is shown in Fig. 10.) Fig. 15 contains the fatigue strength diagrams of these three angles. As predicted in Chapter 3, the 62°-direction is less resistant than the 90°-direction. Lifetime analysis showed that the calculated stress amplitudes correspond very well to the stress amplitudes of the tests [8].
Fig. 15: Fatigue strength diagram for samples loaded in different directions
5.2 Food Cart Roller Test
Another common fatigue test for sandwich structures is the “Food Cart Roller Test” [9, 10]. This test consists of a plate charged with weights, rolling on three wheels on a sandwich structure (Fig. 16). The wheels move in a circle, which makes them act at every angle on the structure. Two sandwich panels are fixed with screws to the rig as is illustrated in Fig. 16. This test makes measuring several values possible: The vertical displacement of the panel was measured with inductive displacement sensors placed at several locations. Some strain gages were applied on the face sheets of the panel in order to measure the strains acting in the plates of the sandwich structure. The vertical displacement of the rotating plate was measured by a contactless capacitive sensor able to reveal progressive damage of the panel. Finally, the number of revolutions was also recorded.

16 Shear Stresses in Honeycombs Laurent Wahl
October, 2011 University of Luxembourg
Fig. 16: Food Cart Roller testing rig
The Food Cart Roller Tests were carried out with the sandwich panels described in Table 1. The dimensions of the testing rig are listed in Table 5. Panel size 543mm x 1003mm Testing speed 20 rev/minute Wheel diameter 76mm Wheel width 32mm Wheel hardness 80 +- 5 Shore A Diameter on which the wheels ran 508mm Table 5: Dimensions of the Food Cart Roller testing rig The tests proved that damage always occurs at about 60° from the panel’s support, i.e. at 60° from the L-direction, fitting well with the previous theoretical considerations (Fig. 17).
Fig. 17: Damage always occurs at around 60° from the support

17 Shear Stresses in Honeycombs Laurent Wahl
October, 2011 University of Luxembourg
6 Conclusions The core shear stresses in a honeycomb structure can be calculated using straightforward formulas in the case of a clamped sandwich panel loaded by transverse forces. The calculations showed that the stresses are highest at a core orientation between the L and W-direction. Hence, this direction – and not the W-direction as generally assumed – is the panel’s weakest direction. In the sample discussed above the weakest angle is 62°. However, the angle can be slightly different when it comes to other cell geometries. The L-direction is the strongest direction, because here the three shear stresses τ1, τ2 and τ3 have the same value which implies that the stresses are well distributed. In a finite element simulation with a homogenized core calculating the shear stresses in the honeycomb core is easily possible. The analytical formulas presented in this paper were verified by simulations and fatigue tests. The formulas are not always valid at the edges of the structure and in regions where the loads are introduced.
7 Acknowledgement Many thanks go to Eurocomposites (Echternach, Luxembourg) for sponsoring the materials used.
8 References 1. Gibson, L.J. and Ashby, M.F. (1997). The mechanics of honeycombs, Cellular solids, Structure
and properties, Second edition, Cambridge University Press. 2. Grediac, M. (1997). A finite element study of the transverse shear in honeycomb cores,
International journal of solids and structures, 30(13), 1777-1788. 3. Pan, S.-D., Wu, L.-Z., Sun, Y.-G., Zhou, Z.-G. and Qu, J.-L. (2006). Longitudinal shear strength
and failure process of honeycomb cores, Composite Structures, 72(1), 42–46. 4. Qiao, P. and Wang, J., (2005). Transverse Shear Stiffness of Composite Honeycomb Cores
and Efficiency of Material, Mechanics of Advanced Materials and Structures, 12(2), 159-172. 5. Schwingshackl, C.W., Aglietti, G.S. and Cunningham P.R. (2006). Determination of Honeycomb
Material Properties: Existing Theories and an Alternative Dynamic Approach, Journal of Aerospace Engineering, 19(3), 177-181.
6. Bianchi, G., Aglietti, G.S. and Richardson, G. (2011). Static and Fatigue Behaviour of
Hexagonal Honeycomb Cores under In-plane Shear Loads, Applied Composite Materials, Springer.
7. Blitzer, T. (1997). Introduction, Honeycomb Technology, Materials, design, manufacturing,
applications and testing, first edition, Chapman & Hall. 8. Wahl, L., Zürbes, A., Maas, S., Waldmann, D., Frères, P. and Wintgens, W. (2011). Fatigue in
Aluminium Honeycomb-core Plates, NAFEMS Benchmark Magazine, January 2011, 26-32. 9. Boeing Specification BMS 4-17: Types I, II, III, IV. 10. Douglas specification DAC 7954400.