shell report
TRANSCRIPT
iiiiil EQUITY MARKETS
Oil & Gas Western Europe
Reserves no longer an issue but volumes modest ◆
Return to fundamental valuation expected post unification ◆
No real catalysts for growth until 2007/2008 ◆
Angus McPhail(44 131) 527 [email protected]
Jason Kenney(44 131) 527 [email protected]
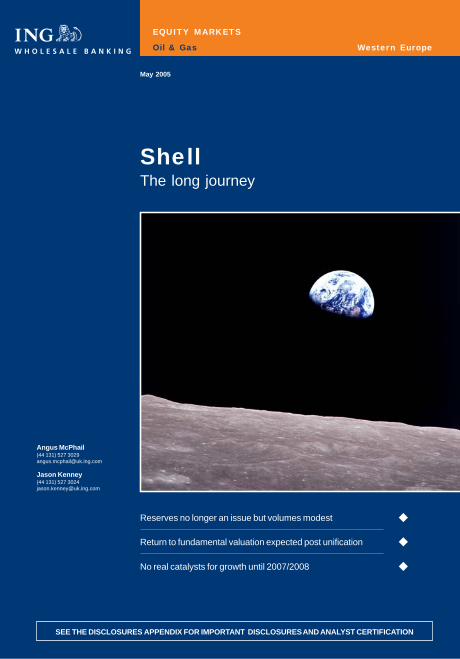
ShellThe long journey
May 2005
Sh
ell
May 2005
SEE THE DISCLOSURES APPENDIX FOR IMPORTANT DISCLOSURES AND ANALYST CERTIFICATION
AMSTERDAM BRUSSELS LONDON NEW YORK SINGAPORE Foppingadreef 7 Amsterdam Netherlands 1102BD
Avenue Marnix 24 Brussels Belgium B-1000
60 London Wall London United Kingdom EC2M 5TQ
1325 Avenue of the Americas New York USA 10019
19/F Republic Plaza, 9 Raffles Place, #19-02, Singapore 048619
Tel: 31 20 563 87 98 Tel: 32 2 557 10 26 Tel: 44 20 7767 1000 Tel: 1 646 424 6000 Tel: 65 6535 3688
BRATISLAVA
Tel: 421 2 5934 61 11
BUCHAREST
Tel: 40 21 222 1600
BUDAPEST
Tel: 36 1 268 0140
BUENOS AIRES
Tel: 54 11 4310 4700
DUBLIN
Tel: 353 1 638 4000
EDINBURGH
Tel: 44 131 527 3000
GENEVA
Tel: 41 22 593 8050
HONG KONG
Tel: 852 2848 8488
ISTANBUL
Tel: 90 212 258 8770
KIEV
Tel: 380 44 230 3030
MADRID
Tel: 34 91 789 8880
MANILA
Tel: 632 840 8888
MEXICO CITY
Tel: 52 55 5258 2000
MILAN
Tel: 39 02 89629 3660
MOSCOW
Tel: 7095 755 5400
PARIS
Tel: 33 1 56 39 31 41
PRAGUE
Tel: 420 2 5747 1111
SANTIAGO
Tel: 562 452 2700
SAO PAULO
Tel: 55 11 4504 6000
SEOUL
Tel: 822 317 1500
SHANGHAI
Tel: 86 21 6841 3355
SOFIA
Tel: 359 2 917 6400
TAIPEI
Tel: 886 2 2734 7500
TOKYO
Tel: 813 5210 1500
WARSAW
Tel: 48 22 820 5018
Disclaimer This publication has been prepared on behalf of ING (being for this purpose the wholesale and investment banking business of ING Bank NV and certain of its subsidiary companies) solely for the information of its clients. ING forms part of ING Group (being for this purpose ING Groep NV and its subsidiary and affiliated companies). It is not investment advice or an offer or solicitation for the purchase or sale of any financial instrument. While reasonable care has been taken to ensure that the information contained herein is not untrue or misleading at the time of publication, ING makes no representation that it is accurate or complete. The information contained herein is subject to change without notice. ING Group and any of its officers, employees, related and discretionary accounts may, to the extent not disclosed above and to the extent permitted by law, have long or short positions or may otherwise be interested in any transactions or investments (including derivatives) referred to in this publication. In addition, ING Group may provide banking, insurance or asset management services for, or solicit such business from, any company referred to in this publication. Neither ING nor any of its officers or employees accepts any liability for any direct or consequential loss arising from any use of this publication or its contents. Copyright and database rights protection exists in this publication and it may not be reproduced, distributed or published by any person for any purpose without the prior express consent of ING. All rights are reserved.
Any investments referred to herein may involve significant risk, are not necessarily available in all jurisdictions, may be illiquid and may not be suitable for all investors. The value of, or income from, any investments referred to herein may fluctuate and/or be affected by changes in exchange rates. Past performance is not indicative of future results. Investors should make their own investment decisions without relying on this publication. Only investors with sufficient knowledge and experience in financial matters to evaluate the merits and risks should consider an investment in any issuer or market discussed herein and other persons should not take any action on the basis of this publication. This publication is issued:1) in the United Kingdom only to persons described in Articles 19, 47 and 49 of the Financial Services and Markets Act 2000 (Financial Promotion) Order 2001 and is not intended to be distributed, directly or indirectly, to any other class of persons (including private investors); 2) in Italy only to persons described in Article No. 31 of Consob Regulation No. 11522/98.Clients should contact analysts at, and execute transactions through, an ING entity in their home jurisdiction unless governing law permits otherwise.
ING Bank N.V., London branch is authorised by the Dutch Central Bank and regulated by the Financial Services Authority for the conduct of UK business. It is incorporated in the Netherlands and its London branch is registered in the UK (number BR000341) at 60 London Wall, London EC2M 5TQ. ING Financial Markets LLC, which is a member of the NYSE, NASD and SIPC and part of ING, has accepted responsibility for the distribution of this report in the United States under applicable requirements.
This document is classified as UK Independent Research as defined in the ING Bank London Branch Research policy drawn up in accordance with FSA Rule COB 7.16.5R (2).
EQ_UK IND Additional information is available on request
See back of report for important disclosures and disclaimer
1
Shell May 2005
Contents Summary 2
Indexation & valuation 3
Pros & cons 22
Exploration & production 24
Gas & power 41
Oil products 52
Chemicals 60
Others 62
Financials 66
Glossary 72
Conversion factors 73
Disclosures Appendix 74
Oil & Gas
Angus McPhail Edinburgh +44 (0)131 527 3029 [email protected]
Cover photo courtesy of NASA, Apollo 8 December 1968
Acknowledgement: Nadia Kappou, Doctoral Researcher, ISMA Centre, University of Reading.
See back of report for important disclosures and disclaimer 2
Shell May 2005
Summary
The long journey Shell is facing a long journey to refocus upstream, achieve a more efficient downstream and realise unification. Our valuation methodology concludes that the market appears to have fully discounted RD/Shell’s lower upstream growth rate and reserves re-categorisations, which is positive. Higher growth rates, however, will not transpire until 2007/08 at the earliest, with Shell clearly setting out on a long journey to obtain higher growth through reserve bookings, a revised exploration strategy, and a renewed focus on global integrated gas. Any oil price upside appears limited given the market’s reticence to increase longer-term oil price assumptions beyond 2009. We therefore maintain our HOLD recommendation, and set our target price at €44.35/475p (prev. €44.2/467p).
For investors, market timing is critical given the technical support behind the stock expected prior to reweighting. We would advise investors to HOLD the stock (either A or B shares) after any reweighting on respective global indices. The potential for short-term speculators to buy both stocks after unification and prior to reweighting on various indices in the hope of realising some technical gain is very real, particularly given the current relative arbitrage between A (Royal Dutch) shares and B (Shell T&T) shares. However, we remain cautious longer term, with a return to fundamental valuation expected after 20 July, which should offset short-term technical gains.
The problems associated with re-categorisations now appear to be behind Shell. Any potential fallout from the US Justice Department over investigations of criminal liability could emerge in the next six months. On the positive front, Reserve Replacement targets look potentially achievable given the large resource base which Shell has at its disposal. Shell still lags peers substantially on the volume front, with only 1.3% out to 2009F on a compound basis which is lower than peers at 5.4%.
Downstream, further action could be made to reduce underlying costs via lower manpower levels. Shell employs over 86,000 in Oil products globally versus BP at half that level (39,500). The fact that Shell still manages to achieve higher returns versus BP would suggest that it has this fixed cost under control; however, we still find it an easy option to address should Shell wish to achieve even higher rates of return in the future.
Fig 1 Forecasts and key ratios
2004 2005F 2006F 2007F 2008F 2009F
EBITDA US$(m) 18,789 18,229 16,350 13,479 13,463 12,942 Net income US$(m) 16,623 16,678 14,799 11,928 11,912 11,391 Shell T&T EPS clean (p) 39.80 38.19 33.89 27.29 27.25 26.06 RDS EPS clean (US$) 4.10 3.68 3.22 3.53 3.53 3.37 Shell DPS (p) 16.95 21.33 17.95 18.45 18.95 19.45 RDS DPS (€) 1.79 2.22 1.87 1.91 1.95 1.99 EV/EBITDA (x) 7.36 7.26 7.86 9.24 9.94 10.40 EV/DACF (x) 9.30 8.12 8.82 10.99 11.95 12.62 Dividend yield (T&T) (%) 3.5 4.4 3.7 3.8 3.9 4.0 Dividend yield (Royal Dutch) (%) 3.8 4.7 4.0 4.0 4.1 4.2 Oil & Gas production (000’s b/d) 3,771 3,681 3,733 3,868 3,978 4,014 Volume growth (%) -3.4 -2.4 1.4 3.6 2.8 0.9
Source: ING
See back of report for important disclosures and disclaimer
3
Shell May 2005
Indexation & valuation
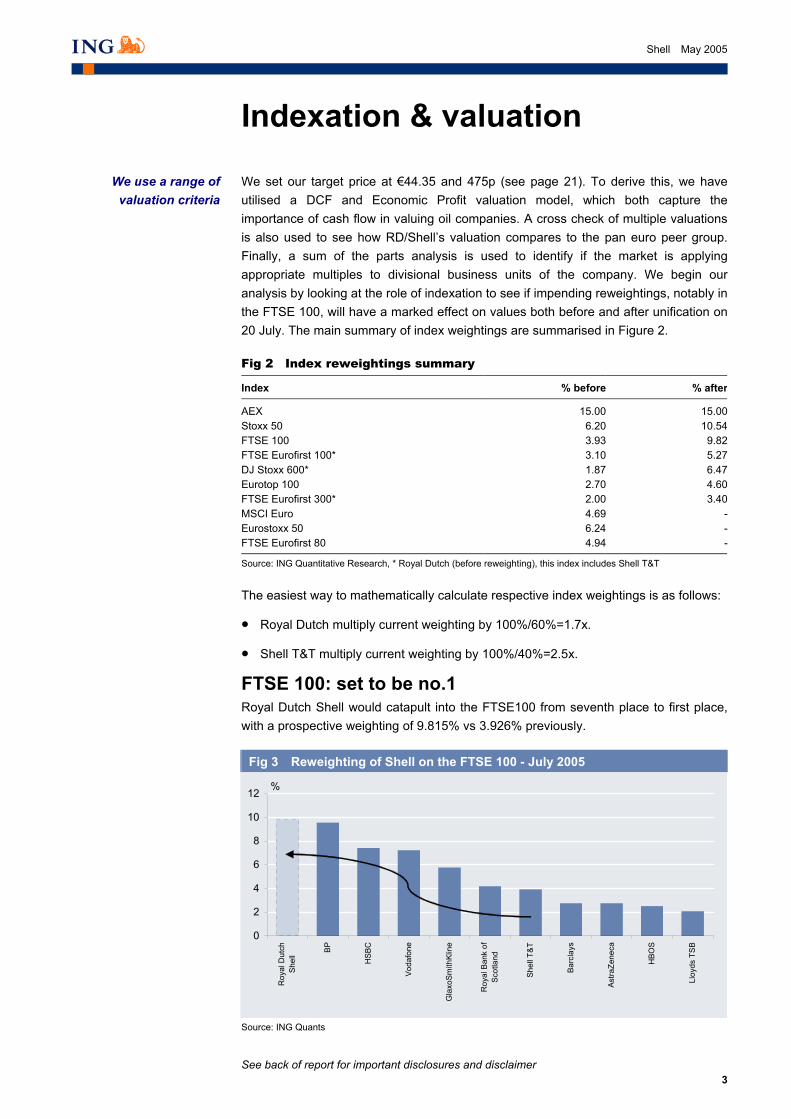
We set our target price at €44.35 and 475p (see page 21). To derive this, we have utilised a DCF and Economic Profit valuation model, which both capture the importance of cash flow in valuing oil companies. A cross check of multiple valuations is also used to see how RD/Shell’s valuation compares to the pan euro peer group. Finally, a sum of the parts analysis is used to identify if the market is applying appropriate multiples to divisional business units of the company. We begin our analysis by looking at the role of indexation to see if impending reweightings, notably in the FTSE 100, will have a marked effect on values both before and after unification on 20 July. The main summary of index weightings are summarised in Figure 2.
Fig 2 Index reweightings summary
Index % before % after
AEX 15.00 15.00Stoxx 50 6.20 10.54FTSE 100 3.93 9.82FTSE Eurofirst 100* 3.10 5.27DJ Stoxx 600* 1.87 6.47Eurotop 100 2.70 4.60FTSE Eurofirst 300* 2.00 3.40MSCI Euro 4.69 -Eurostoxx 50 6.24 -FTSE Eurofirst 80 4.94 -
Source: ING Quantitative Research, * Royal Dutch (before reweighting), this index includes Shell T&T
_
The easiest way to mathematically calculate respective index weightings is as follows:
• Royal Dutch multiply current weighting by 100%/60%=1.7x.
• Shell T&T multiply current weighting by 100%/40%=2.5x.
FTSE 100: set to be no.1 Royal Dutch Shell would catapult into the FTSE100 from seventh place to first place, with a prospective weighting of 9.815% vs 3.926% previously.
Fig 3 Reweighting of Shell on the FTSE 100 - July 2005
0
2
4
6
8
10
12
Roy
al D
utch
Shel
l BP
HSB
C
Voda
fone
Gla
xoSm
ithKl
ine
Roy
al B
ank
ofSc
otla
nd
Shel
l T&T
Barc
lays
Astra
Zene
ca
HBO
S
Lloy
ds T
SB
%
Source: ING Quants
_
We use a range of valuation criteria
See back of report for important disclosures and disclaimer
4
Shell May 2005
Four central questions are crucial to understanding what may follow Shell’s reweighting on the FTSE100:
• Has the indexation effect been fully factored into current valuations?
The full effect on the FTSE has yet to be factored in. Index tracking funds have a legal requirement to wait until the effective date. There has been some evidence of hedge funds buying options ahead of the re-weighting last October, which may have accounted for the rally in the stock. Academic studies1 have shown that stock liquidity implies speculators may trade in advance of the announcement, while index trackers trade between the announcement and effective dates. There is strong evidence to suggest that stocks exhibit cumulative abnormal returns (CAR) 17 days prior to the effective date, or around 3 July given the effective date is 20 July. This equates to 4.7% CAR after adjusting for market returns.
• What may happen to the new entities valuation after 20 July?
Figure 4 shows that the prospective price of Royal Dutch Shell in London and Amsterdam is 1665p and €24.1 respectively. The UK’s lower equity risk premium relative to the European market should help stabilise Royal Dutch Shell’s stock price longer term.
Recent academic research on the FTSE1002 points towards insignificant returns between the announcement date, and 120 days after the effective date (AD+120), or in this case 17 November 2005. A recent academic study by Brunel University indicated that AD+120 a CAR of 1.63% was achieved. After adjusting for information and press coverage effects, as well as financial (EPS changes), the firm age and other adjustments, this return falls to 0.81%. These studies only analysed for inclusion and exclusion from the index, but do not examine the effect on current index constituents. Given the fact that Shell T&T is currently a large market constituent of the FTSE 100, with a high stock liquidity inferred by low transaction costs and a high degree of publicly-available information, the CAR could be higher given the size and liquidity of Shell T&T.
ING consider fundamental rather than technical effects to be paramount after the effective date – the ongoing legal risks through the US Justice department and other legal authorities, the low growth profile, rising cost base upstream, and obvious unit cost restructuring potential downstream. We advise investors to exercise caution and not be carried way with what amounts to a short-term technical rally.
• Will the FTSE 100 automatically be re-weighted on 20 July?
FTSE 100 Index reviews have occurred in the second weeks of March, June, September and December with changes being applied on the Monday after the third Friday of the same month. This means that there are seven days from the review date through to the effective date, being 20 July. FTSE have confirmed that given the size of the re-weighting, changes will be implemented automatically and not subjected to the usual time schedule.
• How can investors in the FTSE limit their risk given the large weighting of Royal Dutch Shell?
1 Dr Bryan Mase, Brunel University, ‘The Impact of Changes in the FTSE 100 Index’ 2 Jay Dahya, Baruch College, City University of New York ‘Playing Footsy with the FTSE 100 Index’, March 2005
Cumulative abnormal returns expected ahead
of unification
ING cautious after unification
See back of report for important disclosures and disclaimer
5
Shell May 2005
FTSE is due to launch the FTSE All-Share capped indices on 20 June, which will offer pension funds an alternative to the traditional FTSE100. The cap on these indices will be 5% for BP and Royal Dutch Shell.
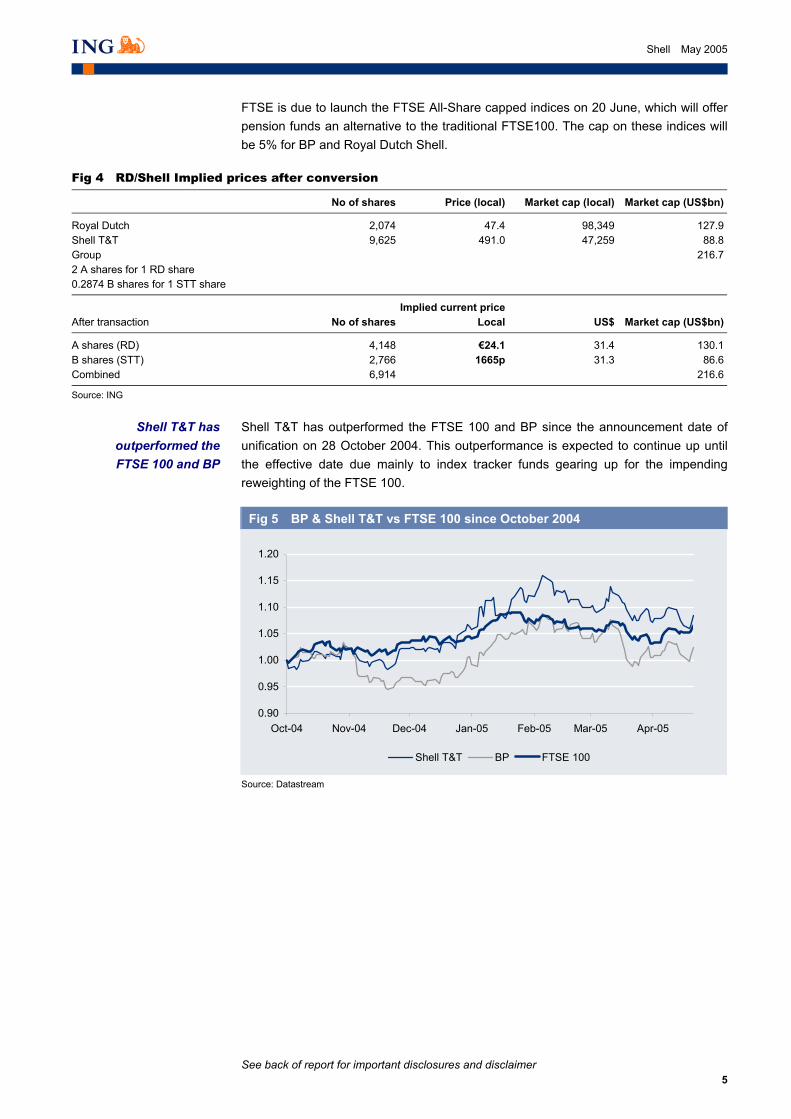
Fig 4 RD/Shell Implied prices after conversion
No of shares Price (local) Market cap (local) Market cap (US$bn)
Royal Dutch 2,074 47.4 98,349 127.9Shell T&T 9,625 491.0 47,259 88.8Group 216.72 A shares for 1 RD share 0.2874 B shares for 1 STT share
Implied current price After transaction No of shares Local US$ Market cap (US$bn)
A shares (RD) 4,148 €24.1 31.4 130.1B shares (STT) 2,766 1665p 31.3 86.6Combined 6,914 216.6
Source: ING
_
Shell T&T has outperformed the FTSE 100 and BP since the announcement date of unification on 28 October 2004. This outperformance is expected to continue up until the effective date due mainly to index tracker funds gearing up for the impending reweighting of the FTSE 100.
Fig 5 BP & Shell T&T vs FTSE 100 since October 2004
0.90
0.95
1.00
1.05
1.10
1.15
1.20
Oct-04 Nov-04 Dec-04 Jan-05 Feb-05 Mar-05 Apr-05
Shell T&T BP FTSE 100
Source: Datastream
_
Shell T&T has outperformed the FTSE 100 and BP
See back of report for important disclosures and disclaimer
6
Shell May 2005
AEX: implications Royal Dutch Shell’s weighting moved on 2 March from 10% to 15%. No change in this is expected after the new entity is formed. Under the scenario of A shares being predominantly traded in London as opposed to Amsterdam, under AEX listing rules at least 10% of total turnover in a stock should be executed on the exchange. If we were to suppose that the majority of trades were executed in London, then this could potentially lead to Royal Dutch Shell being excluded form the AEX.
In addition, the AEX also specifies that at least 25% of the issued shares of a security should be freely available for trading (“free float”) at Euronext Amsterdam. However, a security may nevertheless be included in the index if its free float, although less than 25%, ‘equals, or is greater than, the free float of the security which ranks 25th on Euronext Amsterdam in terms of free float market capitalisation.’
Under either scenario, ING consider it likely that the AEX inclusion rules would probably change. In addition, some European investors may be unwilling to trade in London given the stamp duty levy.
Other indices RD Shell will be deleted from the MSCI NL and MSCI EMU indices. As the MSCI uses so-called 'building blocks', all individual indices can be added to form a larger index. As RD Shell will be a constituent of the UK indices for the full market cap weight, it cannot be a constituent anymore for the Dutch or Euroland indices, otherwise it would be counted twice. It will also be deleted from the DJ EuroStoxx 50 index which does not include UK-based stocks, although will remain in the Stoxx 50 index which does. Examining the FTSE Eurotop 100, Shell’s weighting will increase from 2.7% to 4.6%.
The AEX will remain the same
Some deletions will occur by virtue of the
UK primary listing
See back of report for important disclosures and disclaimer
7
Shell May 2005
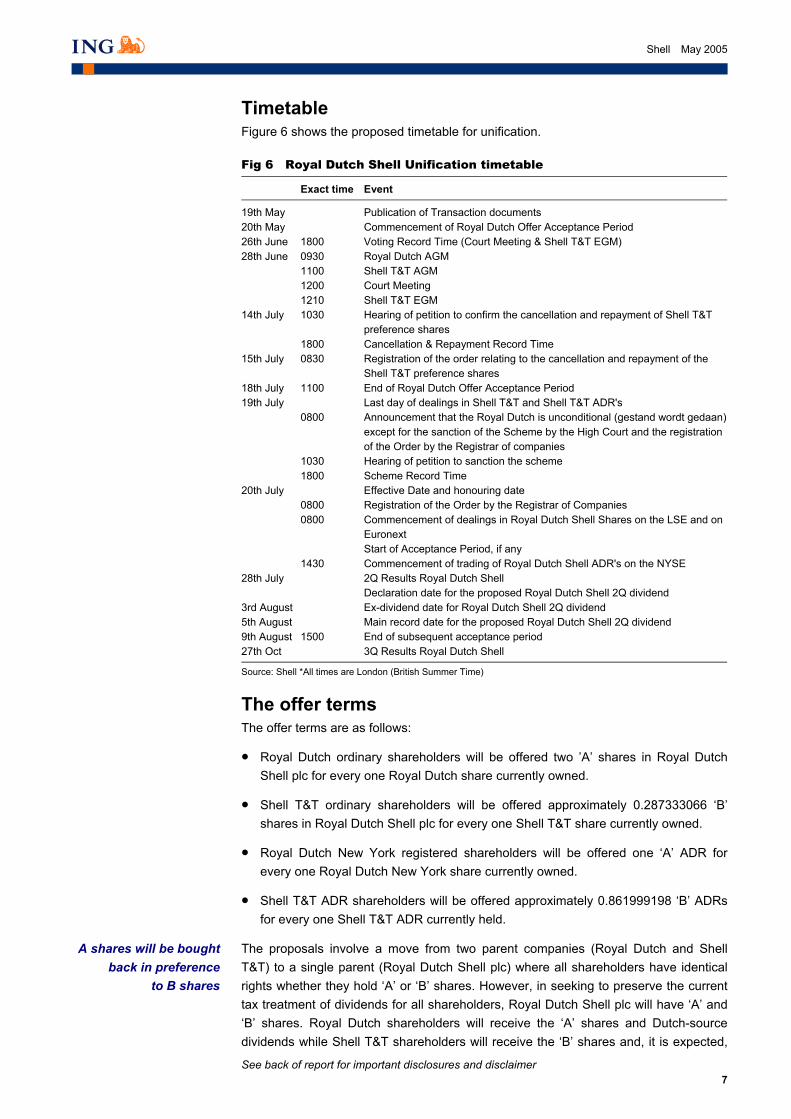
Timetable Figure 6 shows the proposed timetable for unification.
Fig 6 Royal Dutch Shell Unification timetable
Exact time Event
19th May Publication of Transaction documents 20th May Commencement of Royal Dutch Offer Acceptance Period 26th June 1800 Voting Record Time (Court Meeting & Shell T&T EGM) 28th June 0930 Royal Dutch AGM 1100 Shell T&T AGM 1200 Court Meeting 1210 Shell T&T EGM 14th July 1030 Hearing of petition to confirm the cancellation and repayment of Shell T&T
preference shares 1800 Cancellation & Repayment Record Time 15th July 0830 Registration of the order relating to the cancellation and repayment of the
Shell T&T preference shares 18th July 1100 End of Royal Dutch Offer Acceptance Period 19th July Last day of dealings in Shell T&T and Shell T&T ADR's 0800 Announcement that the Royal Dutch is unconditional (gestand wordt gedaan)
except for the sanction of the Scheme by the High Court and the registration of the Order by the Registrar of companies
1030 Hearing of petition to sanction the scheme 1800 Scheme Record Time 20th July Effective Date and honouring date 0800 Registration of the Order by the Registrar of Companies 0800 Commencement of dealings in Royal Dutch Shell Shares on the LSE and on
Euronext Start of Acceptance Period, if any 1430 Commencement of trading of Royal Dutch Shell ADR's on the NYSE 28th July 2Q Results Royal Dutch Shell Declaration date for the proposed Royal Dutch Shell 2Q dividend 3rd August Ex-dividend date for Royal Dutch Shell 2Q dividend 5th August Main record date for the proposed Royal Dutch Shell 2Q dividend 9th August 1500 End of subsequent acceptance period 27th Oct 3Q Results Royal Dutch Shell
Source: Shell *All times are London (British Summer Time)
_
The offer terms The offer terms are as follows:
• Royal Dutch ordinary shareholders will be offered two ’A’ shares in Royal Dutch Shell plc for every one Royal Dutch share currently owned.
• Shell T&T ordinary shareholders will be offered approximately 0.287333066 ‘B’ shares in Royal Dutch Shell plc for every one Shell T&T share currently owned.
• Royal Dutch New York registered shareholders will be offered one ‘A’ ADR for every one Royal Dutch New York share currently owned.
• Shell T&T ADR shareholders will be offered approximately 0.861999198 ‘B’ ADRs for every one Shell T&T ADR currently held.
The proposals involve a move from two parent companies (Royal Dutch and Shell T&T) to a single parent (Royal Dutch Shell plc) where all shareholders have identical rights whether they hold ‘A’ or ‘B’ shares. However, in seeking to preserve the current tax treatment of dividends for all shareholders, Royal Dutch Shell plc will have ‘A’ and ‘B’ shares. Royal Dutch shareholders will receive the ‘A’ shares and Dutch-source dividends while Shell T&T shareholders will receive the ‘B’ shares and, it is expected,
A shares will be bought back in preference
to B shares
See back of report for important disclosures and disclaimer
8
Shell May 2005
UK source dividends. This has been done to reflect the different tax treatment in the two countries, with A shares being subject to Dutch withholding tax, and B shares to UK base stamp duty.
Both ‘A’ and ‘B’ shares will be listed on the London Stock Exchange and the Euronext Amsterdam Exchange as well as the New York Stock Exchange (in ADR form). The shares are not fungible/interchangeable. Although they are not interchangeable, they have identical rights. The only difference between the ‘A’ and ‘B’ shares is that holders of the ‘A’ shares will receive Dutch sourced dividends which are paid in euros and Holders of the ‘B’ shares are expected to receive UK-sourced dividends paid in Pounds Sterling.
The company has stated clearly that it intends to buy back A shares over B shares depending on ‘prevailing market prices and the relative tax treatment’, although recently there did appear to be some speculation that B shares would not be subjected to UK taxes which would put both classes of share on a level playing field for share buybacks. The upper limits on Shell's ability to buy back A (RD) shares under Dutch tax law are governed by Article 4c ‘Wet op Dividendbelasting' which allows companies to buy back shares if the company increases dividends, and secondly does not buy back more than 10 times the average cash dividend payment over a specified five-year period. Shell can easily satisfy both criteria, given the fact that its dividend policy has achieved consistent growth in dividends, and secondly total dividends paid amount to around US$36bn over the last five years, some seven-12 times higher than the proposed dividend.
The 95% acceptance level for Royal Dutch shareholders looks ambitious. Although given the wording in the Royal Dutch offer document under 'Other Risk factors' one could draw the opinion that Shell is banking on shareholders taking fright and converting anyway. An extended offer period for those classes of shareholders not converting does look a very real possibility.
With the euphoria over the new entity ‘Royal Dutch Shell’, the company may aim to scrap A shares at some stage in the future, which in our view could be linked to the European taxation convergence which could see Dutch withholding taxes applied in the UK instead of the current stamp duty. This issue is of course highly speculative and any convergence appears unlikely, particularly given the UK stance over the adoption of the euro.
One point of concern involves UK-based retail investors who will not qualify for UK rollover tax relief, with the Inland Revenue treating the transfer of shares as a disposal. This means that for retail investors in Shell T&T the transaction will be treated as a capital gains tax liability. Shell has clearly opted for the greater good principle whereby only certain classes of UK funds will be exempt such as Pension Funds, Investment Trusts, and OEICs. Retail investors account for only about 18% of Shell T&T current shareholder base.
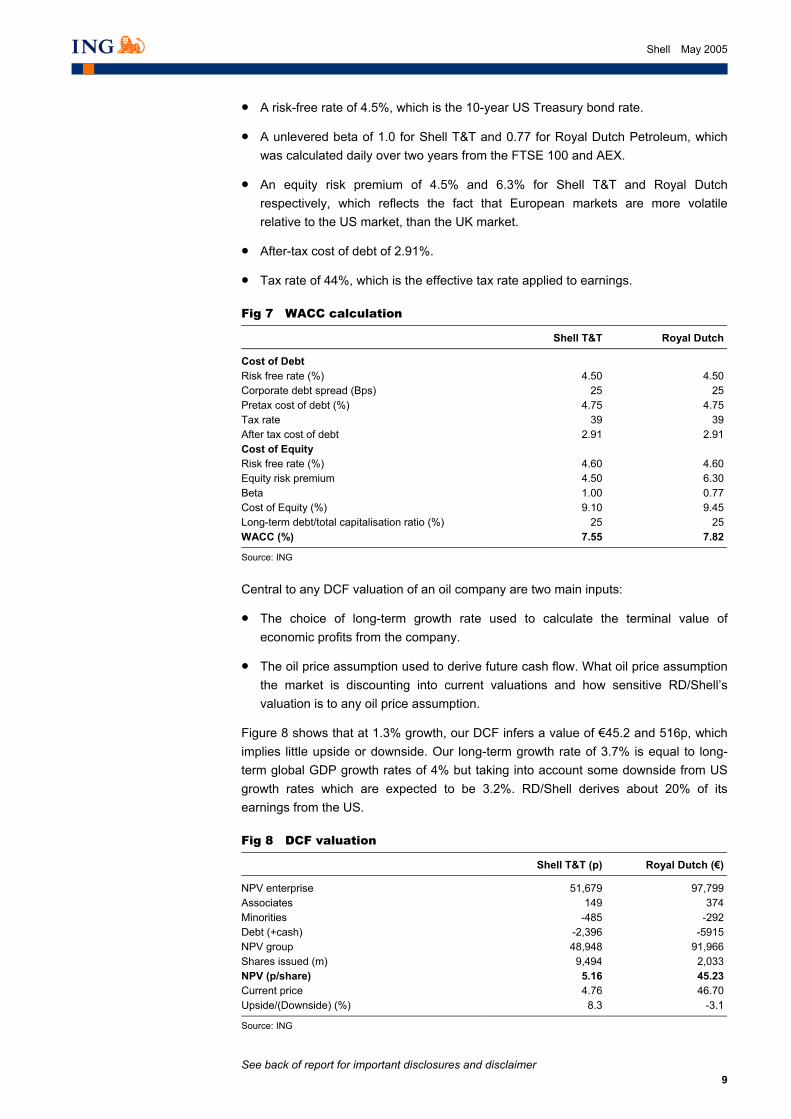
DCF Our DCF model utilises the weighted average cost of capital (WACC) over 50 years in order to capture the time value of money. Shell has low levels of gearing; in fact, it is sub-optimal since net debt is now negative given the high excess cash base. This means that the WACC is effectively the cost of equity.
In calculating our WACC of 6.8%, we assumed the following:
A shares may be scrapped at some point
in the future
We have utilised a DCF model over 50 years
UK retail investors will not qualify for tax relief
The 95% acceptance level looks ambitious
A shares may be bought back in preference
to B shares
There will be A shares and B shares
See back of report for important disclosures and disclaimer
9
Shell May 2005
• A risk-free rate of 4.5%, which is the 10-year US Treasury bond rate.
• A unlevered beta of 1.0 for Shell T&T and 0.77 for Royal Dutch Petroleum, which was calculated daily over two years from the FTSE 100 and AEX.
• An equity risk premium of 4.5% and 6.3% for Shell T&T and Royal Dutch respectively, which reflects the fact that European markets are more volatile relative to the US market, than the UK market.
• After-tax cost of debt of 2.91%.
• Tax rate of 44%, which is the effective tax rate applied to earnings.
Fig 7 WACC calculation
Shell T&T Royal Dutch
Cost of Debt Risk free rate (%) 4.50 4.50Corporate debt spread (Bps) 25 25Pretax cost of debt (%) 4.75 4.75Tax rate 39 39After tax cost of debt 2.91 2.91Cost of Equity Risk free rate (%) 4.60 4.60Equity risk premium 4.50 6.30Beta 1.00 0.77Cost of Equity (%) 9.10 9.45Long-term debt/total capitalisation ratio (%) 25 25WACC (%) 7.55 7.82
Source: ING
_
Central to any DCF valuation of an oil company are two main inputs:
• The choice of long-term growth rate used to calculate the terminal value of economic profits from the company.
• The oil price assumption used to derive future cash flow. What oil price assumption the market is discounting into current valuations and how sensitive RD/Shell’s valuation is to any oil price assumption.
Figure 8 shows that at 1.3% growth, our DCF infers a value of €45.2 and 516p, which implies little upside or downside. Our long-term growth rate of 3.7% is equal to long-term global GDP growth rates of 4% but taking into account some downside from US growth rates which are expected to be 3.2%. RD/Shell derives about 20% of its earnings from the US.
Fig 8 DCF valuation
Shell T&T (p) Royal Dutch (€)
NPV enterprise 51,679 97,799 Associates 149 374Minorities -485 -292Debt (+cash) -2,396 -5915NPV group 48,948 91,966 Shares issued (m) 9,494 2,033NPV (p/share) 5.16 45.23Current price 4.76 46.70Upside/(Downside) (%) 8.3 -3.1
Source: ING
_
See back of report for important disclosures and disclaimer
10
Shell May 2005
While resilient to low oil prices because of Shell’s high gas exposure and downstream earnings base, in valuation terms the implications of higher long-term oil prices (post 2008) remain important for underlying valuations on a sector and stock-specific basis.
Current valuations would appear to be factoring in US$30/bbl. Any paradigm shift to increase this cannot come from any short-term supply shocks alone or through the influences of inventory hedging, which has introduced its own premium into current oil prices; but from low global exploration success rates, faster demand for oil in key regions such as China and India, and the slower development of the new global LNG infrastructure, which is acting as a valuable substitution resource to traditional crude supplies.
The implications of higher longer-term oil prices remain
important for valuations
11
Royal D
utch Petroleum
May 2005
Fig 9 DCF RD/Shell
US$ (m) 1999 2000 2001 2002 2003 2004 2005F 2006F 2007F 2008F 2009F 2010F
Net profit before minority 9,429 12,558 10,613 10,137 11,836 17,890 17,330 15,451 12,580 12,564 12,043 12,810 Profit from associates -4,015 3,859 2,644 2,816 3,456 5,653 1,800 1,800 2,600 2,600 2,600 2,600 Taxed profit from associates -1,807 1,737 1,190 1,267 1,555 2,544 2,000 2,000 2,000 2,000 2,001 2,002 Net interest paid 767 586 74 606 -592 -491 -234 -496 -421 -268 -62 172 Taxed net interest paid 470 317 41 334 -331 -262 -129 -273 -232 -148 -34 95 Operating income 7,152 13,977 11,761 11,071 13,722 20,695 19,459 17,724 14,812 14,711 14,903 15,096 DDA 6,520 7,885 6,117 8,528 11,422 12,273 12,764 12,264 11,296 10,164 10,256 10,892 Exploration charge 1,062 753 857 915 1,059 651 664 677 691 705 719 733 Deferred taxation 491 -447 17 -313 -313 -313 -313 -313 -313 -313 -313 Other non-cash items - (1,026) (133) (150) (2,141) (3,033) (150) -150 -150 -150 -150 -150 Working capital movement - 24,978 -24,990 32,672 1,179 -486 300 300 300 300 300 300 Operating cash flow 14,734 47,058 -6,835 53,053 24,928 29,787 32,724 30,502 26,635 25,417 25,714 26,558 Capital expenditure 7,409 6,209 9,626 22,444 12,252 13,566 15,450 15,450 13,450 13,450 13,450 13,450 Divestments 5,026 3,852 1,265 1,099 4,275 5,142 8,600 2,000 2,000 2,000 2,000 2,000 Investing activities 2,383 2,357 8,361 21,345 7,977 8,424 6,850 13,450 11,450 11,450 11,450 11,450 Net investments (capex and working cap) -5,199 -31,259 26,377 -20,770 -5,683 -4,014 -6,878 209 -837 281 176 -475 Free cash flow 12,351 44,701 -15,196 31,708 16,951 21,363 25,874 17,052 15,185 13,967 14,264 15,108 Shell T&T FOCF (£) 7,969 26,687 -9,969 22,703 3,874 4,670 5,564 3,707 3,301 3,036 3,101 3,284 Royal Dutch Petroleum FOCF (€) 7,411 28,533 -10,244 20,026 9,000 10,337 11,585 7,523 6,699 6,162 6,293 6,666 Shell T&T EV (US$) 81,499 70,526 77,368 91,708 89,837 91,854 90,349 90,250 91,937 94,213 96,797 98,958 Royal Dutch Petroleum EV(US$) 106,608 92,796 87,823 104,777 122,592 129,721 134,959 138,109 140,639 144,054 147,929 151,171 Opening capital employed 72,387 68,000 65,540 83,717 96,403 97,305 101,381 104,501 105,349 106,209 107,036 107,331 Associates/investments 394 605 704 684 758 681 695 709 723 737 752 767 Opening operating capital employed 71,993 67,395 64,836 83,033 95,645 96,624 100,686 103,792 104,626 103,790 119,221 120,771 Operating income growth (%) 95 -16 -6 24 51 -6 -8.90 -16.40 -0.70 1.30 1.30 ROCE (%) 9.93% 20.74 18.14 13.33 14.35 21.42 19.33 17.08 14.16 12.50 12.50 12.50 Net investments/capital employed (%) -7% -46 41 -25 -6 -4 -7 0 14.50 13.50 12.00 12.50
Source: Company data
_
See back of report for important disclosures and disclaimer
12
Shell May 2005
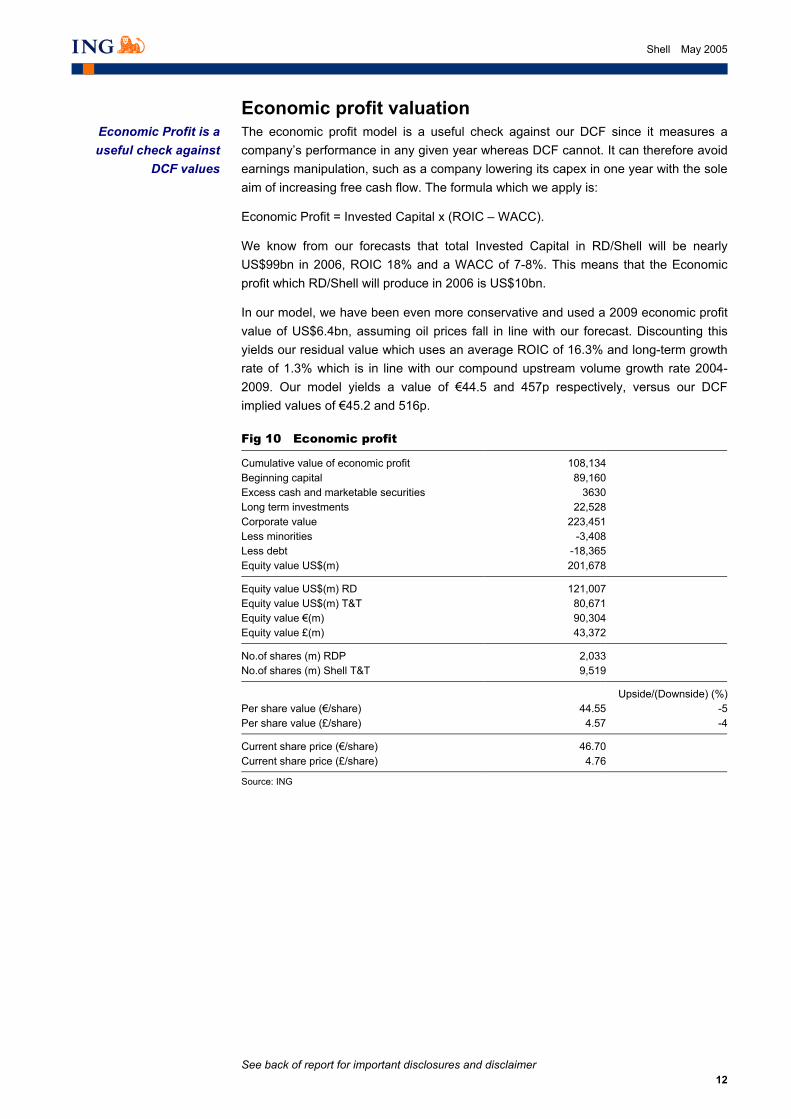
Economic profit valuation The economic profit model is a useful check against our DCF since it measures a company’s performance in any given year whereas DCF cannot. It can therefore avoid earnings manipulation, such as a company lowering its capex in one year with the sole aim of increasing free cash flow. The formula which we apply is:
Economic Profit = Invested Capital x (ROIC – WACC).
We know from our forecasts that total Invested Capital in RD/Shell will be nearly US$99bn in 2006, ROIC 18% and a WACC of 7-8%. This means that the Economic profit which RD/Shell will produce in 2006 is US$10bn.
In our model, we have been even more conservative and used a 2009 economic profit value of US$6.4bn, assuming oil prices fall in line with our forecast. Discounting this yields our residual value which uses an average ROIC of 16.3% and long-term growth rate of 1.3% which is in line with our compound upstream volume growth rate 2004-2009. Our model yields a value of €44.5 and 457p respectively, versus our DCF implied values of €45.2 and 516p.
Fig 10 Economic profit
Cumulative value of economic profit 108,134 Beginning capital 89,160 Excess cash and marketable securities 3630Long term investments 22,528Corporate value 223,451 Less minorities -3,408Less debt -18,365Equity value US$(m) 201,678
Equity value US$(m) RD 121,007 Equity value US$(m) T&T 80,671 Equity value €(m) 90,304 Equity value £(m) 43,372
No.of shares (m) RDP 2,033No.of shares (m) Shell T&T 9,519
Upside/(Downside) (%)Per share value (€/share) 44.55 -5Per share value (£/share) 4.57 -4
Current share price (€/share) 46.70Current share price (£/share) 4.76
Source: ING _
Economic Profit is a useful check against
DCF values
13
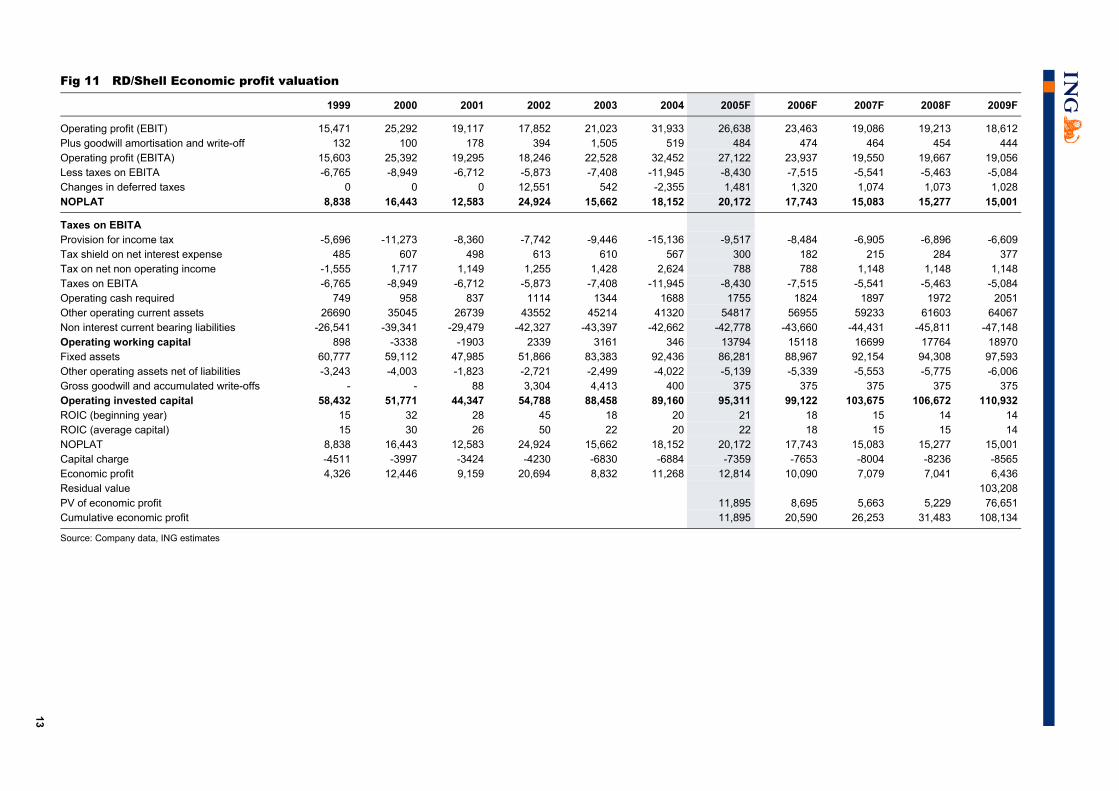
Fig 11 RD/Shell Economic profit valuation
1999 2000 2001 2002 2003 2004 2005F 2006F 2007F 2008F 2009F
Operating profit (EBIT) 15,471 25,292 19,117 17,852 21,023 31,933 26,638 23,463 19,086 19,213 18,612 Plus goodwill amortisation and write-off 132 100 178 394 1,505 519 484 474 464 454 444 Operating profit (EBITA) 15,603 25,392 19,295 18,246 22,528 32,452 27,122 23,937 19,550 19,667 19,056 Less taxes on EBITA -6,765 -8,949 -6,712 -5,873 -7,408 -11,945 -8,430 -7,515 -5,541 -5,463 -5,084 Changes in deferred taxes 0 0 0 12,551 542 -2,355 1,481 1,320 1,074 1,073 1,028 NOPLAT 8,838 16,443 12,583 24,924 15,662 18,152 20,172 17,743 15,083 15,277 15,001
Taxes on EBITA Provision for income tax -5,696 -11,273 -8,360 -7,742 -9,446 -15,136 -9,517 -8,484 -6,905 -6,896 -6,609 Tax shield on net interest expense 485 607 498 613 610 567 300 182 215 284 377 Tax on net non operating income -1,555 1,717 1,149 1,255 1,428 2,624 788 788 1,148 1,148 1,148 Taxes on EBITA -6,765 -8,949 -6,712 -5,873 -7,408 -11,945 -8,430 -7,515 -5,541 -5,463 -5,084 Operating cash required 749 958 837 1114 1344 1688 1755 1824 1897 1972 2051 Other operating current assets 26690 35045 26739 43552 45214 41320 54817 56955 59233 61603 64067 Non interest current bearing liabilities -26,541 -39,341 -29,479 -42,327 -43,397 -42,662 -42,778 -43,660 -44,431 -45,811 -47,148 Operating working capital 898 -3338 -1903 2339 3161 346 13794 15118 16699 17764 18970 Fixed assets 60,777 59,112 47,985 51,866 83,383 92,436 86,281 88,967 92,154 94,308 97,593 Other operating assets net of liabilities -3,243 -4,003 -1,823 -2,721 -2,499 -4,022 -5,139 -5,339 -5,553 -5,775 -6,006 Gross goodwill and accumulated write-offs - - 88 3,304 4,413 400 375 375 375 375 375 Operating invested capital 58,432 51,771 44,347 54,788 88,458 89,160 95,311 99,122 103,675 106,672 110,932 ROIC (beginning year) 15 32 28 45 18 20 21 18 15 14 14 ROIC (average capital) 15 30 26 50 22 20 22 18 15 15 14 NOPLAT 8,838 16,443 12,583 24,924 15,662 18,152 20,172 17,743 15,083 15,277 15,001 Capital charge -4511 -3997 -3424 -4230 -6830 -6884 -7359 -7653 -8004 -8236 -8565 Economic profit 4,326 12,446 9,159 20,694 8,832 11,268 12,814 10,090 7,079 7,041 6,436 Residual value 103,208 PV of economic profit 11,895 8,695 5,663 5,229 76,651 Cumulative economic profit 11,895 20,590 26,253 31,483 108,134
Source: Company data, ING estimates
_
See back of report for important disclosures and disclaimer
14
Shell May 2005
Sum of the parts valuation We have included a sum of the parts valuation in our analysis to cross-check our DCF and to also take account of the value of RD/Shell given the increased possibility that after unification Royal Dutch Shell may become more attractive for M&A activity, with the market focusing on the potential break-up value of the company. We have assigned a low weighting within our multifactor model towards this (10%) given the low probability of this happening given current high oil prices.
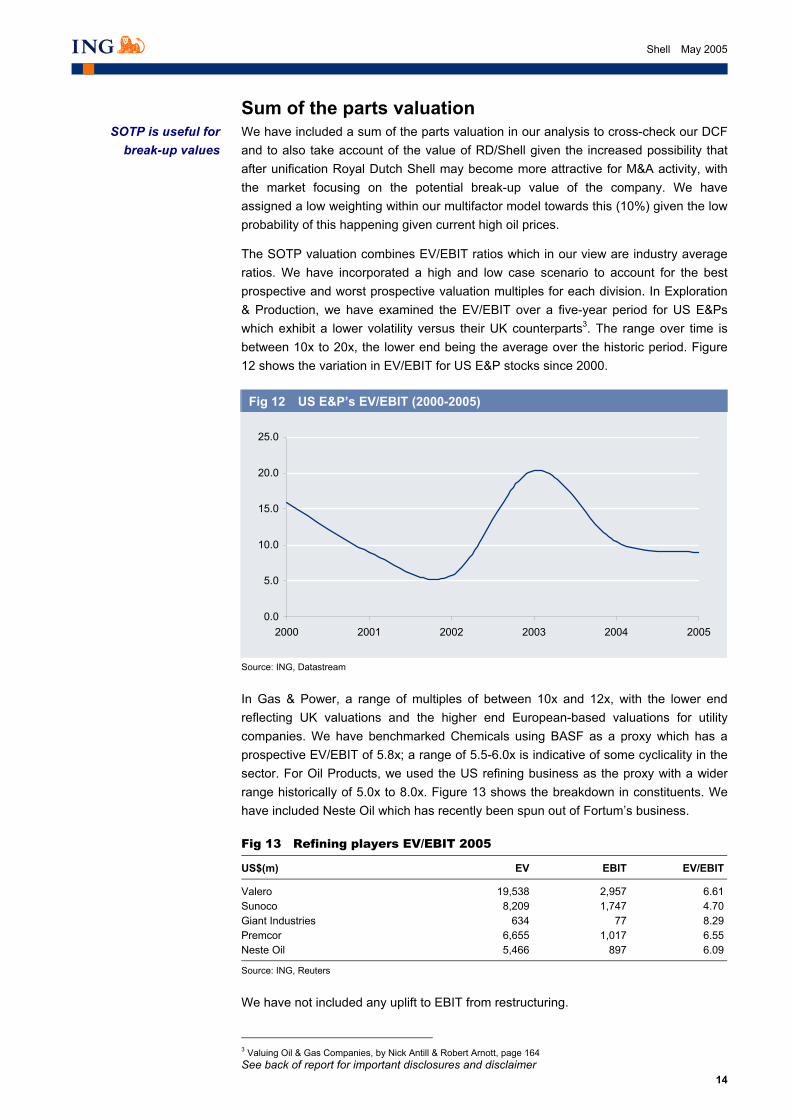
The SOTP valuation combines EV/EBIT ratios which in our view are industry average ratios. We have incorporated a high and low case scenario to account for the best prospective and worst prospective valuation multiples for each division. In Exploration & Production, we have examined the EV/EBIT over a five-year period for US E&Ps which exhibit a lower volatility versus their UK counterparts3. The range over time is between 10x to 20x, the lower end being the average over the historic period. Figure 12 shows the variation in EV/EBIT for US E&P stocks since 2000.
Fig 12 US E&P’s EV/EBIT (2000-2005)
0.0
5.0
10.0
15.0
20.0
25.0
2000 2001 2002 2003 2004 2005
Source: ING, Datastream
_
In Gas & Power, a range of multiples of between 10x and 12x, with the lower end reflecting UK valuations and the higher end European-based valuations for utility companies. We have benchmarked Chemicals using BASF as a proxy which has a prospective EV/EBIT of 5.8x; a range of 5.5-6.0x is indicative of some cyclicality in the sector. For Oil Products, we used the US refining business as the proxy with a wider range historically of 5.0x to 8.0x. Figure 13 shows the breakdown in constituents. We have included Neste Oil which has recently been spun out of Fortum’s business.
Fig 13 Refining players EV/EBIT 2005
US$(m) EV EBIT EV/EBIT
Valero 19,538 2,957 6.61Sunoco 8,209 1,747 4.70Giant Industries 634 77 8.29Premcor 6,655 1,017 6.55Neste Oil 5,466 897 6.09
Source: ING, Reuters
_
We have not included any uplift to EBIT from restructuring.
3 Valuing Oil & Gas Companies, by Nick Antill & Robert Arnott, page 164
SOTP is useful for break-up values

See back of report for important disclosures and disclaimer
15
Shell May 2005
From our analysis, RD/Shell has a range in valuations which are between 298p and 500p for Shell T&T, and €28 to €47 for Royal Dutch for the next three years. The top end of the valuation indicates limited upside.
16
Fig 14 RD/Shell SOTP
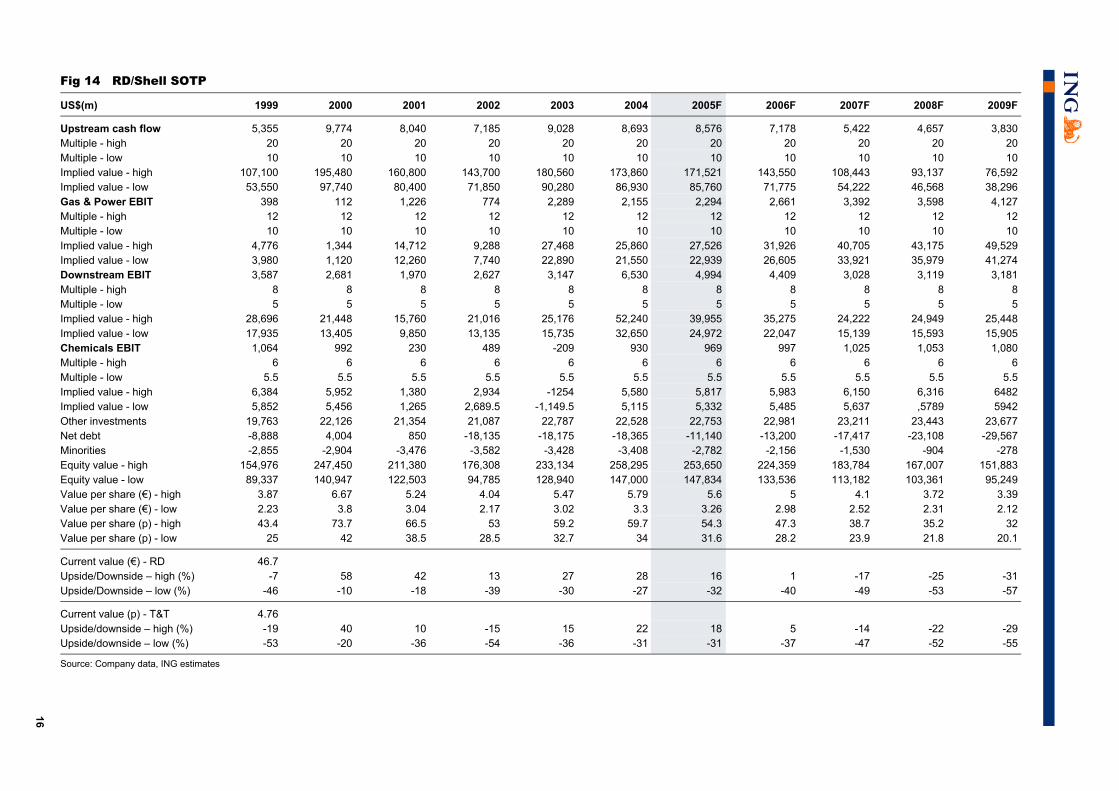
US$(m) 1999 2000 2001 2002 2003 2004 2005F 2006F 2007F 2008F 2009F
Upstream cash flow 5,355 9,774 8,040 7,185 9,028 8,693 8,576 7,178 5,422 4,657 3,830 Multiple - high 20 20 20 20 20 20 20 20 20 20 20 Multiple - low 10 10 10 10 10 10 10 10 10 10 10 Implied value - high 107,100 195,480 160,800 143,700 180,560 173,860 171,521 143,550 108,443 93,137 76,592 Implied value - low 53,550 97,740 80,400 71,850 90,280 86,930 85,760 71,775 54,222 46,568 38,296 Gas & Power EBIT 398 112 1,226 774 2,289 2,155 2,294 2,661 3,392 3,598 4,127 Multiple - high 12 12 12 12 12 12 12 12 12 12 12 Multiple - low 10 10 10 10 10 10 10 10 10 10 10 Implied value - high 4,776 1,344 14,712 9,288 27,468 25,860 27,526 31,926 40,705 43,175 49,529 Implied value - low 3,980 1,120 12,260 7,740 22,890 21,550 22,939 26,605 33,921 35,979 41,274 Downstream EBIT 3,587 2,681 1,970 2,627 3,147 6,530 4,994 4,409 3,028 3,119 3,181 Multiple - high 8 8 8 8 8 8 8 8 8 8 8 Multiple - low 5 5 5 5 5 5 5 5 5 5 5 Implied value - high 28,696 21,448 15,760 21,016 25,176 52,240 39,955 35,275 24,222 24,949 25,448 Implied value - low 17,935 13,405 9,850 13,135 15,735 32,650 24,972 22,047 15,139 15,593 15,905 Chemicals EBIT 1,064 992 230 489 -209 930 969 997 1,025 1,053 1,080 Multiple - high 6 6 6 6 6 6 6 6 6 6 6 Multiple - low 5.5 5.5 5.5 5.5 5.5 5.5 5.5 5.5 5.5 5.5 5.5 Implied value - high 6,384 5,952 1,380 2,934 -1254 5,580 5,817 5,983 6,150 6,316 6482 Implied value - low 5,852 5,456 1,265 2,689.5 -1,149.5 5,115 5,332 5,485 5,637 ,5789 5942 Other investments 19,763 22,126 21,354 21,087 22,787 22,528 22,753 22,981 23,211 23,443 23,677 Net debt -8,888 4,004 850 -18,135 -18,175 -18,365 -11,140 -13,200 -17,417 -23,108 -29,567 Minorities -2,855 -2,904 -3,476 -3,582 -3,428 -3,408 -2,782 -2,156 -1,530 -904 -278 Equity value - high 154,976 247,450 211,380 176,308 233,134 258,295 253,650 224,359 183,784 167,007 151,883 Equity value - low 89,337 140,947 122,503 94,785 128,940 147,000 147,834 133,536 113,182 103,361 95,249 Value per share (€) - high 3.87 6.67 5.24 4.04 5.47 5.79 5.6 5 4.1 3.72 3.39 Value per share (€) - low 2.23 3.8 3.04 2.17 3.02 3.3 3.26 2.98 2.52 2.31 2.12 Value per share (p) - high 43.4 73.7 66.5 53 59.2 59.7 54.3 47.3 38.7 35.2 32 Value per share (p) - low 25 42 38.5 28.5 32.7 34 31.6 28.2 23.9 21.8 20.1
Current value (€) - RD 46.7 Upside/Downside – high (%) -7 58 42 13 27 28 16 1 -17 -25 -31 Upside/Downside – low (%) -46 -10 -18 -39 -30 -27 -32 -40 -49 -53 -57
Current value (p) - T&T 4.76 Upside/downside – high (%) -19 40 10 -15 15 22 18 5 -14 -22 -29 Upside/downside – low (%) -53 -20 -36 -54 -36 -31 -31 -37 -47 -52 -55
Source: Company data, ING estimates
_
See back of report for important disclosures and disclaimer
17
Shell May 2005
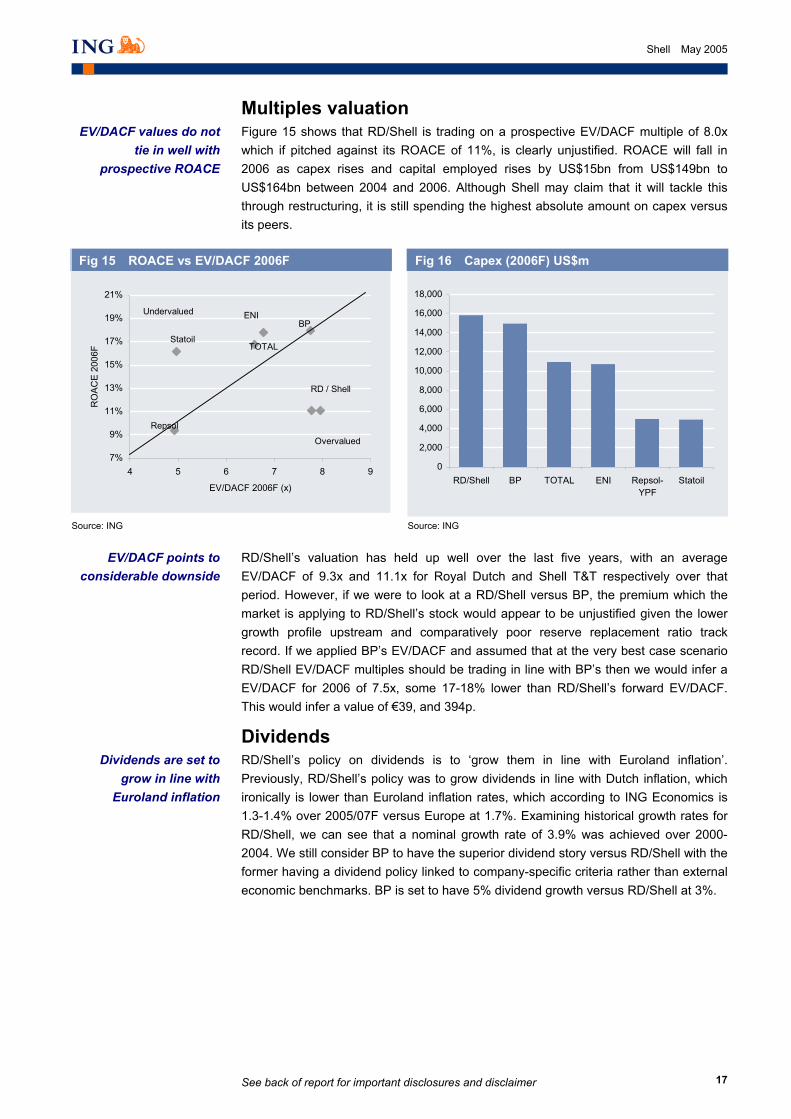
Multiples valuation Figure 15 shows that RD/Shell is trading on a prospective EV/DACF multiple of 8.0x which if pitched against its ROACE of 11%, is clearly unjustified. ROACE will fall in 2006 as capex rises and capital employed rises by US$15bn from US$149bn to US$164bn between 2004 and 2006. Although Shell may claim that it will tackle this through restructuring, it is still spending the highest absolute amount on capex versus its peers.
Fig 15 ROACE vs EV/DACF 2006F
Fig 16 Capex (2006F) US$m
7%
9%
11%
13%
15%
17%
19%
21%
4 5 6 7 8 9
EV/DACF 2006F (x)
RO
AC
E 2
006F
Repsol
ENI
TOTAL
BP
RD / Shell
Statoil
Undervalued
Overvalued
0
2,000
4,000
6,000
8,000
10,000
12,000
14,000
16,000
18,000
RD/Shell BP TOTAL ENI Repsol-YPF
Statoil
Source: ING Source: ING
_
RD/Shell’s valuation has held up well over the last five years, with an average EV/DACF of 9.3x and 11.1x for Royal Dutch and Shell T&T respectively over that period. However, if we were to look at a RD/Shell versus BP, the premium which the market is applying to RD/Shell’s stock would appear to be unjustified given the lower growth profile upstream and comparatively poor reserve replacement ratio track record. If we applied BP’s EV/DACF and assumed that at the very best case scenario RD/Shell EV/DACF multiples should be trading in line with BP’s then we would infer a EV/DACF for 2006 of 7.5x, some 17-18% lower than RD/Shell’s forward EV/DACF. This would infer a value of €39, and 394p.
Dividends RD/Shell’s policy on dividends is to ‘grow them in line with Euroland inflation’. Previously, RD/Shell’s policy was to grow dividends in line with Dutch inflation, which ironically is lower than Euroland inflation rates, which according to ING Economics is 1.3-1.4% over 2005/07F versus Europe at 1.7%. Examining historical growth rates for RD/Shell, we can see that a nominal growth rate of 3.9% was achieved over 2000-2004. We still consider BP to have the superior dividend story versus RD/Shell with the former having a dividend policy linked to company-specific criteria rather than external economic benchmarks. BP is set to have 5% dividend growth versus RD/Shell at 3%.
EV/DACF points to considerable downside
Dividends are set to grow in line with
Euroland inflation
EV/DACF values do not tie in well with
prospective ROACE
See back of report for important disclosures and disclaimer
18
Shell May 2005
Fig 17 Dividend growth (2000-2009)
-2.0%0.0%2.0%4.0%6.0%8.0%
10.0%12.0%14.0%16.0%
2000 2001 2002 2003 2004 2005F 2006F 2007F 2008F 2009F
Shell T&T BP
Source: ING
_
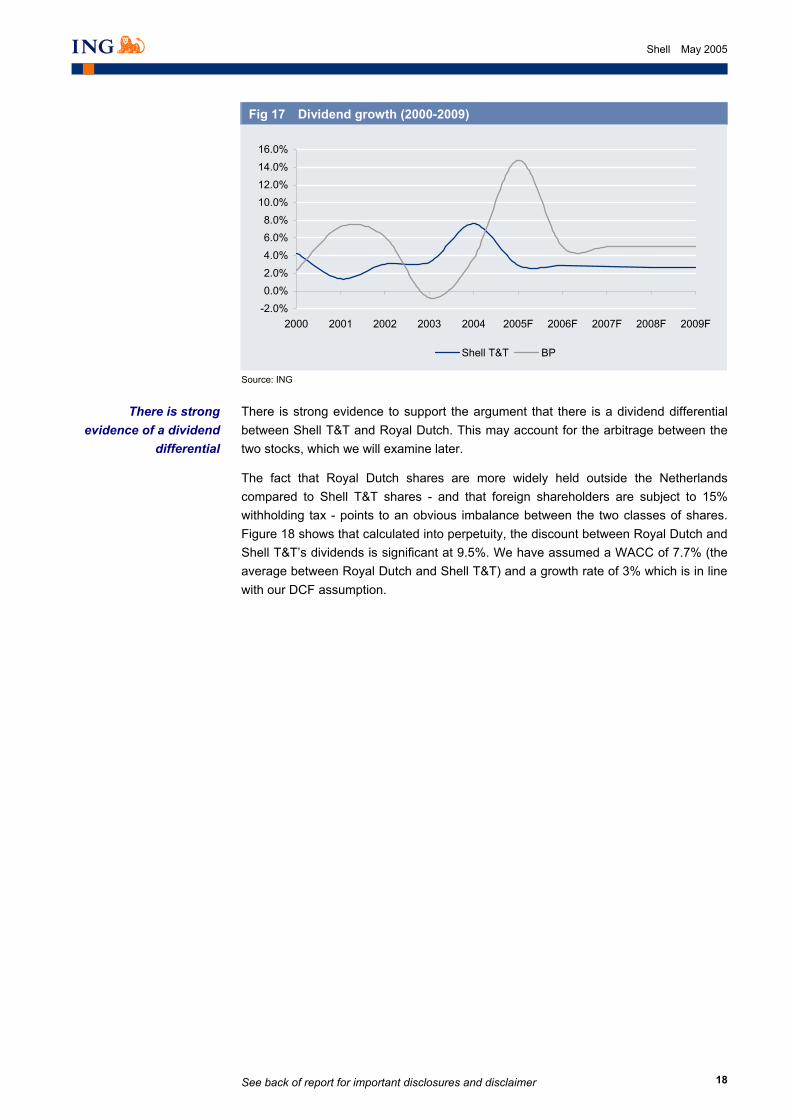
There is strong evidence to support the argument that there is a dividend differential between Shell T&T and Royal Dutch. This may account for the arbitrage between the two stocks, which we will examine later.
The fact that Royal Dutch shares are more widely held outside the Netherlands compared to Shell T&T shares - and that foreign shareholders are subject to 15% withholding tax - points to an obvious imbalance between the two classes of shares. Figure 18 shows that calculated into perpetuity, the discount between Royal Dutch and Shell T&T’s dividends is significant at 9.5%. We have assumed a WACC of 7.7% (the average between Royal Dutch and Shell T&T) and a growth rate of 3% which is in line with our DCF assumption.
There is strong evidence of a dividend
differential
See back of report for important disclosures and disclaimer
19
Shell May 2005
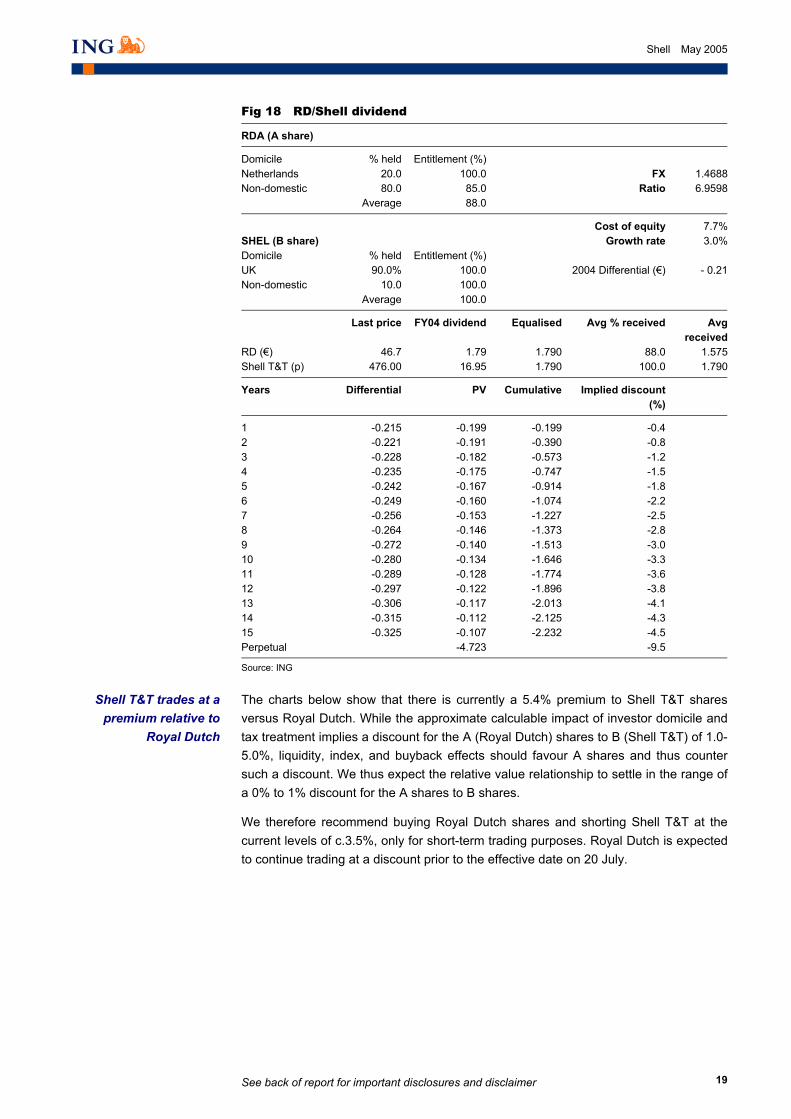
Fig 18 RD/Shell dividend
RDA (A share)
Domicile % held Entitlement (%)Netherlands 20.0 100.0 FX 1.4688 Non-domestic 80.0 85.0 Ratio 6.9598 Average 88.0
Cost of equity 7.7%SHEL (B share) Growth rate 3.0%Domicile % held Entitlement (%)UK 90.0% 100.0 2004 Differential (€) - 0.21 Non-domestic 10.0 100.0 Average 100.0
Last price FY04 dividend Equalised Avg % received Avg received
RD (€) 46.7 1.79 1.790 88.0 1.575 Shell T&T (p) 476.00 16.95 1.790 100.0 1.790
Years Differential PV Cumulative Implied discount(%)
1 -0.215 -0.199 -0.199 -0.42 -0.221 -0.191 -0.390 -0.83 -0.228 -0.182 -0.573 -1.24 -0.235 -0.175 -0.747 -1.55 -0.242 -0.167 -0.914 -1.86 -0.249 -0.160 -1.074 -2.27 -0.256 -0.153 -1.227 -2.58 -0.264 -0.146 -1.373 -2.89 -0.272 -0.140 -1.513 -3.010 -0.280 -0.134 -1.646 -3.311 -0.289 -0.128 -1.774 -3.612 -0.297 -0.122 -1.896 -3.813 -0.306 -0.117 -2.013 -4.114 -0.315 -0.112 -2.125 -4.315 -0.325 -0.107 -2.232 -4.5Perpetual -4.723 -9.5
Source: ING
_
The charts below show that there is currently a 5.4% premium to Shell T&T shares versus Royal Dutch. While the approximate calculable impact of investor domicile and tax treatment implies a discount for the A (Royal Dutch) shares to B (Shell T&T) of 1.0-5.0%, liquidity, index, and buyback effects should favour A shares and thus counter such a discount. We thus expect the relative value relationship to settle in the range of a 0% to 1% discount for the A shares to B shares.
We therefore recommend buying Royal Dutch shares and shorting Shell T&T at the current levels of c.3.5%, only for short-term trading purposes. Royal Dutch is expected to continue trading at a discount prior to the effective date on 20 July.
Shell T&T trades at a premium relative to
Royal Dutch
See back of report for important disclosures and disclaimer
20
Shell May 2005
Fig 19 Shell T&T/Royal Dutch Arbitrage 2002 - 05
Fig 20 Shell T&T/Royal Dutch arbitrage 2005
-20%
-15%
-10%
-5%
0%
5%
10%
1/02 4/02 7/02 10/02 1/03 4/03 7/03 10/03 1/04
0%
1%
2%
3%
4%
5%
6%
7%
8%
1/05 1/05 1/05 2/05 2/05 3/05 3/05 4/05 4/05 5/05
Source: ING Source: ING
_
Special dividends in 2005
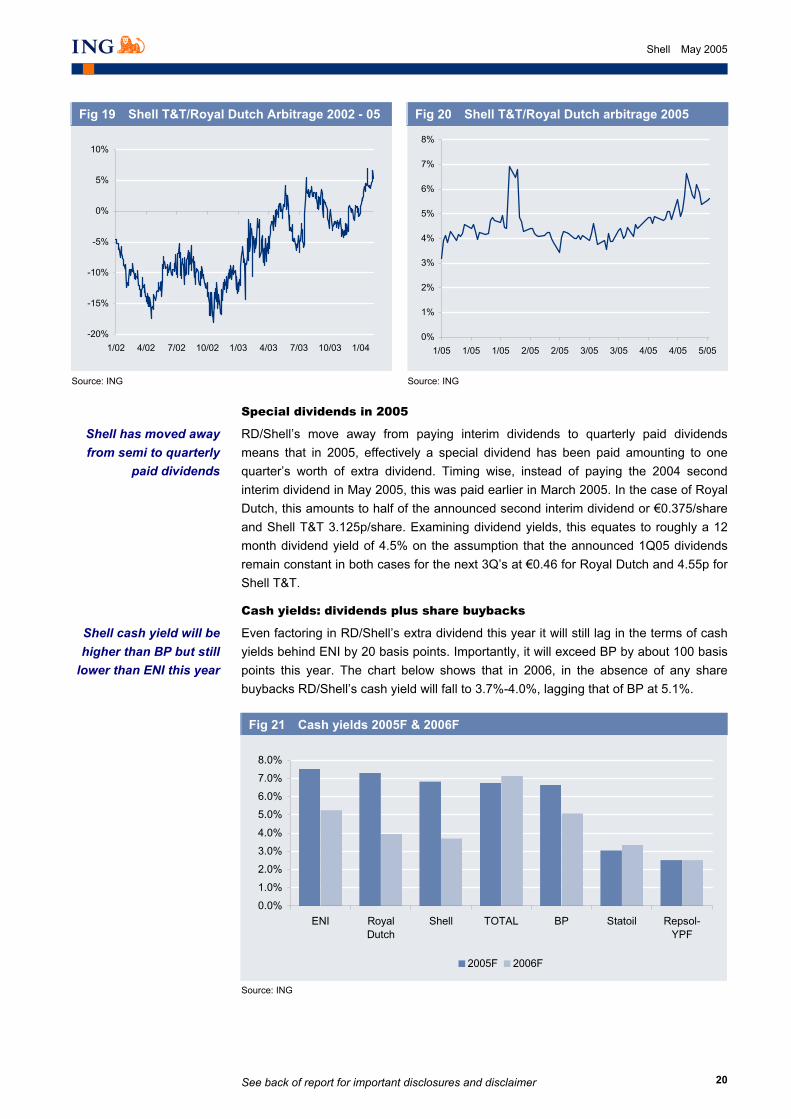
RD/Shell’s move away from paying interim dividends to quarterly paid dividends means that in 2005, effectively a special dividend has been paid amounting to one quarter’s worth of extra dividend. Timing wise, instead of paying the 2004 second interim dividend in May 2005, this was paid earlier in March 2005. In the case of Royal Dutch, this amounts to half of the announced second interim dividend or €0.375/share and Shell T&T 3.125p/share. Examining dividend yields, this equates to roughly a 12 month dividend yield of 4.5% on the assumption that the announced 1Q05 dividends remain constant in both cases for the next 3Q’s at €0.46 for Royal Dutch and 4.55p for Shell T&T.
Cash yields: dividends plus share buybacks
Even factoring in RD/Shell’s extra dividend this year it will still lag in the terms of cash yields behind ENI by 20 basis points. Importantly, it will exceed BP by about 100 basis points this year. The chart below shows that in 2006, in the absence of any share buybacks RD/Shell’s cash yield will fall to 3.7%-4.0%, lagging that of BP at 5.1%.
Fig 21 Cash yields 2005F & 2006F
0.0%
1.0%
2.0%
3.0%
4.0%
5.0%
6.0%
7.0%
8.0%
ENI RoyalDutch
Shell TOTAL BP Statoil Repsol-YPF
2005F 2006F
Source: ING
Shell has moved away from semi to quarterly
paid dividends
Shell cash yield will be higher than BP but still
lower than ENI this year
See back of report for important disclosures and disclaimer
21
Shell May 2005
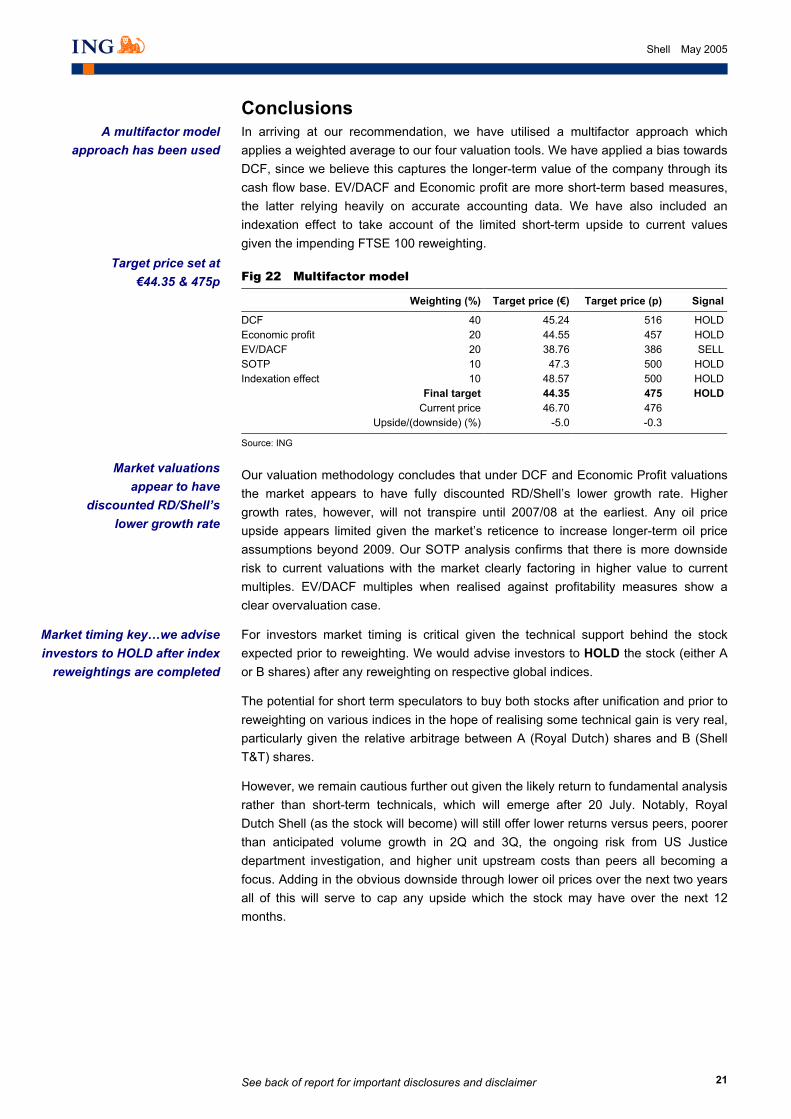
Conclusions In arriving at our recommendation, we have utilised a multifactor approach which applies a weighted average to our four valuation tools. We have applied a bias towards DCF, since we believe this captures the longer-term value of the company through its cash flow base. EV/DACF and Economic profit are more short-term based measures, the latter relying heavily on accurate accounting data. We have also included an indexation effect to take account of the limited short-term upside to current values given the impending FTSE 100 reweighting.
Fig 22 Multifactor model
Weighting (%) Target price (€) Target price (p) Signal
DCF 40 45.24 516 HOLDEconomic profit 20 44.55 457 HOLD EV/DACF 20 38.76 386 SELLSOTP 10 47.3 500 HOLDIndexation effect 10 48.57 500 HOLD Final target 44.35 475 HOLD Current price 46.70 476 Upside/(downside) (%) -5.0 -0.3
Source: ING
_
Our valuation methodology concludes that under DCF and Economic Profit valuations the market appears to have fully discounted RD/Shell’s lower growth rate. Higher growth rates, however, will not transpire until 2007/08 at the earliest. Any oil price upside appears limited given the market’s reticence to increase longer-term oil price assumptions beyond 2009. Our SOTP analysis confirms that there is more downside risk to current valuations with the market clearly factoring in higher value to current multiples. EV/DACF multiples when realised against profitability measures show a clear overvaluation case.
For investors market timing is critical given the technical support behind the stock expected prior to reweighting. We would advise investors to HOLD the stock (either A or B shares) after any reweighting on respective global indices.
The potential for short term speculators to buy both stocks after unification and prior to reweighting on various indices in the hope of realising some technical gain is very real, particularly given the relative arbitrage between A (Royal Dutch) shares and B (Shell T&T) shares.
However, we remain cautious further out given the likely return to fundamental analysis rather than short-term technicals, which will emerge after 20 July. Notably, Royal Dutch Shell (as the stock will become) will still offer lower returns versus peers, poorer than anticipated volume growth in 2Q and 3Q, the ongoing risk from US Justice department investigation, and higher unit upstream costs than peers all becoming a focus. Adding in the obvious downside through lower oil prices over the next two years all of this will serve to cap any upside which the stock may have over the next 12 months.
Market timing key…we advise investors to HOLD after index
reweightings are completed
A multifactor model approach has been used
Target price set at €44.35 & 475p
Market valuations appear to have
discounted RD/Shell’s lower growth rate
See back of report for important disclosures and disclaimer
22
Shell May 2005
Pros & cons
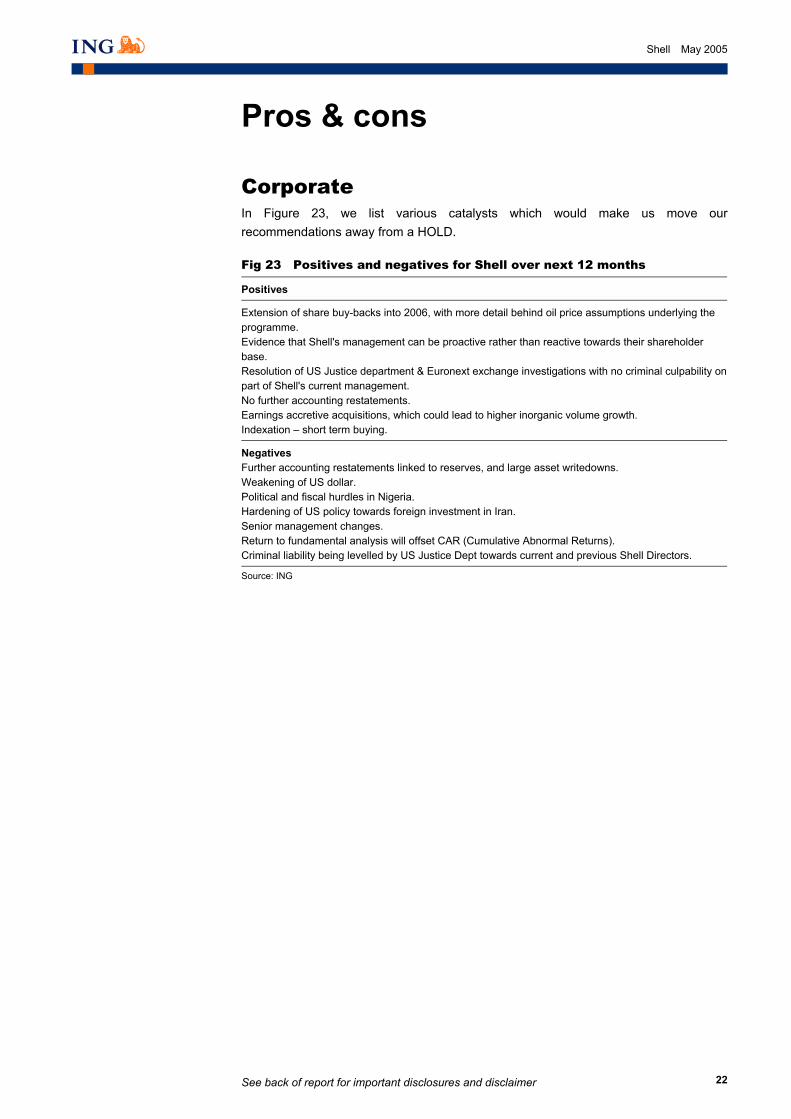
Corporate In Figure 23, we list various catalysts which would make us move our recommendations away from a HOLD.
Fig 23 Positives and negatives for Shell over next 12 months
Positives
Extension of share buy-backs into 2006, with more detail behind oil price assumptions underlying the programme. Evidence that Shell's management can be proactive rather than reactive towards their shareholder base. Resolution of US Justice department & Euronext exchange investigations with no criminal culpability on part of Shell's current management. No further accounting restatements. Earnings accretive acquisitions, which could lead to higher inorganic volume growth. Indexation – short term buying.
Negatives Further accounting restatements linked to reserves, and large asset writedowns. Weakening of US dollar. Political and fiscal hurdles in Nigeria. Hardening of US policy towards foreign investment in Iran. Senior management changes. Return to fundamental analysis will offset CAR (Cumulative Abnormal Returns). Criminal liability being levelled by US Justice Dept towards current and previous Shell Directors.
Source: ING
_
See back of report for important disclosures and disclaimer
23
Shell May 2005
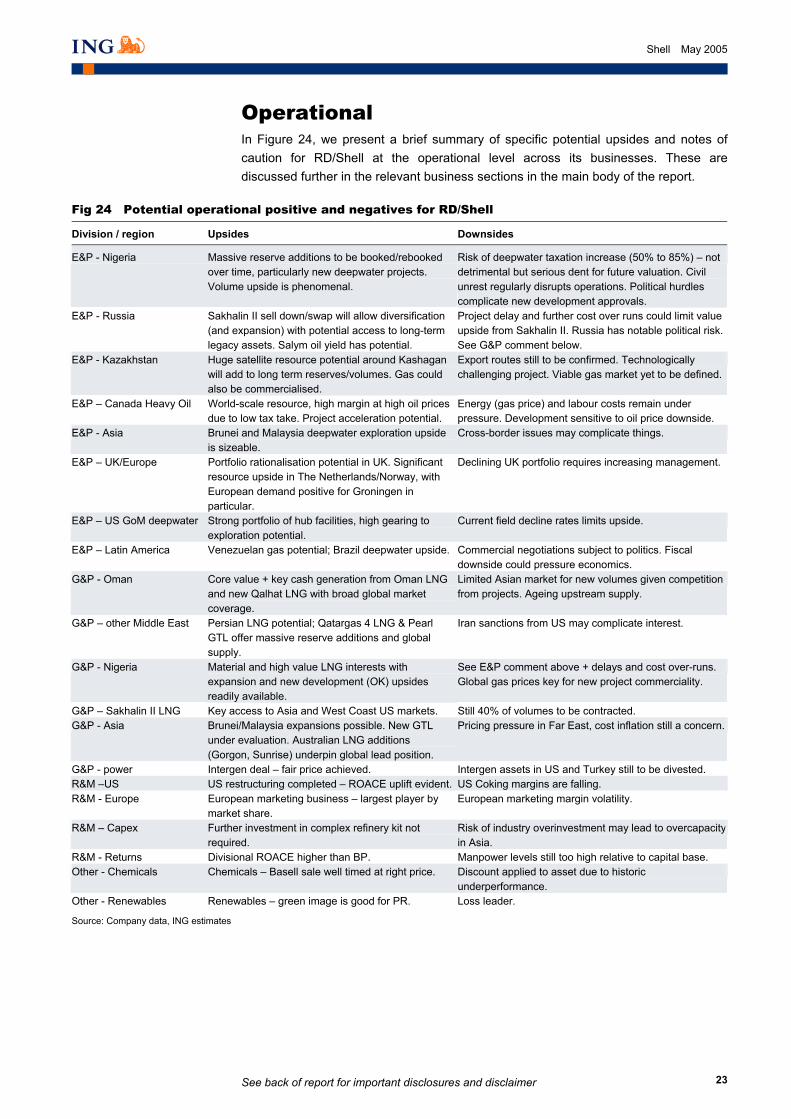
Operational In Figure 24, we present a brief summary of specific potential upsides and notes of caution for RD/Shell at the operational level across its businesses. These are discussed further in the relevant business sections in the main body of the report.
Fig 24 Potential operational positive and negatives for RD/Shell
Division / region Upsides Downsides
E&P - Nigeria Massive reserve additions to be booked/rebooked over time, particularly new deepwater projects. Volume upside is phenomenal.
Risk of deepwater taxation increase (50% to 85%) – not detrimental but serious dent for future valuation. Civil unrest regularly disrupts operations. Political hurdles complicate new development approvals.
E&P - Russia Sakhalin II sell down/swap will allow diversification (and expansion) with potential access to long-term legacy assets. Salym oil yield has potential.
Project delay and further cost over runs could limit value upside from Sakhalin II. Russia has notable political risk. See G&P comment below.
E&P - Kazakhstan Huge satellite resource potential around Kashagan will add to long term reserves/volumes. Gas could also be commercialised.
Export routes still to be confirmed. Technologically challenging project. Viable gas market yet to be defined.
E&P – Canada Heavy Oil World-scale resource, high margin at high oil prices due to low tax take. Project acceleration potential.
Energy (gas price) and labour costs remain under pressure. Development sensitive to oil price downside.
E&P - Asia Brunei and Malaysia deepwater exploration upside is sizeable.
Cross-border issues may complicate things.
E&P – UK/Europe Portfolio rationalisation potential in UK. Significant resource upside in The Netherlands/Norway, with European demand positive for Groningen in particular.
Declining UK portfolio requires increasing management.
E&P – US GoM deepwater Strong portfolio of hub facilities, high gearing to exploration potential.
Current field decline rates limits upside.
E&P – Latin America Venezuelan gas potential; Brazil deepwater upside. Commercial negotiations subject to politics. Fiscal downside could pressure economics.
G&P - Oman Core value + key cash generation from Oman LNG and new Qalhat LNG with broad global market coverage.
Limited Asian market for new volumes given competition from projects. Ageing upstream supply.
G&P – other Middle East Persian LNG potential; Qatargas 4 LNG & Pearl GTL offer massive reserve additions and global supply.
Iran sanctions from US may complicate interest.
G&P - Nigeria Material and high value LNG interests with expansion and new development (OK) upsides readily available.
See E&P comment above + delays and cost over-runs. Global gas prices key for new project commerciality.
G&P – Sakhalin II LNG Key access to Asia and West Coast US markets. Still 40% of volumes to be contracted. G&P - Asia Brunei/Malaysia expansions possible. New GTL
under evaluation. Australian LNG additions (Gorgon, Sunrise) underpin global lead position.
Pricing pressure in Far East, cost inflation still a concern.
G&P - power Intergen deal – fair price achieved. Intergen assets in US and Turkey still to be divested. R&M –US US restructuring completed – ROACE uplift evident. US Coking margins are falling. R&M - Europe European marketing business – largest player by
market share. European marketing margin volatility.
R&M – Capex Further investment in complex refinery kit not required.
Risk of industry overinvestment may lead to overcapacity in Asia.
R&M - Returns Divisional ROACE higher than BP. Manpower levels still too high relative to capital base. Other - Chemicals Chemicals – Basell sale well timed at right price. Discount applied to asset due to historic
underperformance. Other - Renewables Renewables – green image is good for PR. Loss leader.
Source: Company data, ING estimates
_
See back of report for important disclosures and disclaimer
24
Shell May 2005
Exploration & production
Introduction The wide range of group ROACEs for the pan-Euro majors (12% to 22%) reflects the integrated structure of the majors and company’s bias toward the upstream business. The upstream division remains core to returns for oil majors providing a ROACE in excess of 25% currently, and even above 30% for the most efficient operators and those able to provide for growth. This compares to only 15% to 20% ROACE downstream and barely double-digit ROACE from Chemicals despite recent cycle upturn.
The key factors supporting a sound performance upstream include an ability to find and replace produced volumes, a disciplined focus on efficient recovery and costs, and foresight to gain access to new resources with which to underpin the longer-term sustainability of a group’s operations. Obviously, volume growth helps differentiate performance, particularly when combined with a robust macro environment in the short term.
For RD/Shell, reserves (and more explicitly the hydrocarbon accounting of reserves) have dogged the company of late. While the company technically still has resources in the ground, the long-term sustainability of the group’s upstream division has been brought into question, with the company’s ability to progress the development of new projects and commercialise its resource base effectively in dispute.
While admitting underinvestment in its upstream division 1998 to 2003, and having spent most of 2004 reassessing it options, RD/Shell is embarking on a new phase of investment for growth across its portfolio. Unfortunately, there will be a lead time for this to make a credible and obvious impact for long-term earnings and valuation and we remain cautious at this stage as to the company’s outlook upstream on this basis.
In the following section, we analyse briefly the key issues for RD/Shell in the short term (namely reserves replacement, production growth and rising costs). As part of our production review, we also look at some of the current and future focus for activity across the company’s portfolio in order to better understand the potential this offers.
Upstream issues There are three main issues currently affecting RD/Shell’s upstream business:
• Reserves replacement – surprisingly, not a problem.
• Production growth – poor to 2007 but deep value potential from new regions and a new focus on material oil, integrated gas and unconventional energy.
• Rising costs – an industry wide issue.
Reserves replacement – potential upside The problems associated with re-categorisations (or historic hydrocarbon accounting) now appear to be behind Shell, although we note that any potential fallout from the US Justice Department over allegations of criminal liability could emerge in the next six months. This may weigh on the stock once implications are disclosed.
The reserve problems of Shell now appear to be
behind them
A credible upstream division will underpin
group returns
Reserves issues bring sustainable growth into
question
New investment commitment has a lead
time to reinvigorate performance
ING cautious of new drivers and timing of upstream turnaround
See back of report for important disclosures and disclaimer
25
Shell May 2005
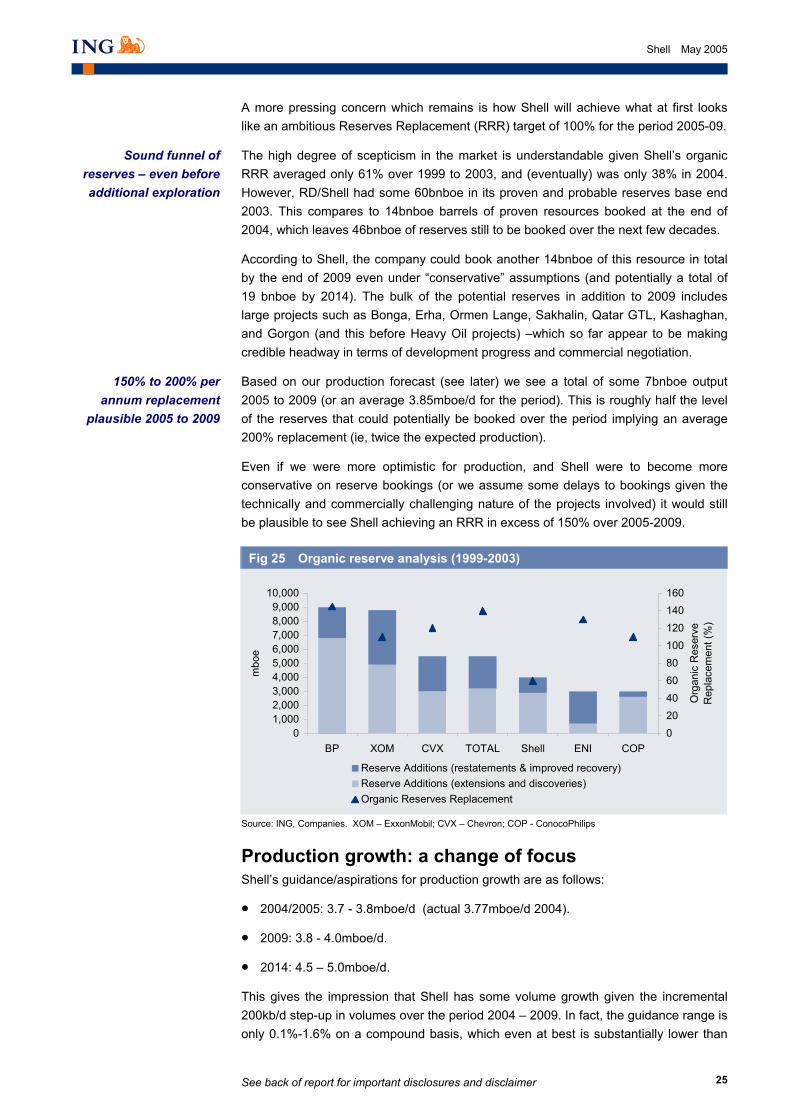
A more pressing concern which remains is how Shell will achieve what at first looks like an ambitious Reserves Replacement (RRR) target of 100% for the period 2005-09.
The high degree of scepticism in the market is understandable given Shell’s organic RRR averaged only 61% over 1999 to 2003, and (eventually) was only 38% in 2004. However, RD/Shell had some 60bnboe in its proven and probable reserves base end 2003. This compares to 14bnboe barrels of proven resources booked at the end of 2004, which leaves 46bnboe of reserves still to be booked over the next few decades.
According to Shell, the company could book another 14bnboe of this resource in total by the end of 2009 even under “conservative” assumptions (and potentially a total of 19 bnboe by 2014). The bulk of the potential reserves in addition to 2009 includes large projects such as Bonga, Erha, Ormen Lange, Sakhalin, Qatar GTL, Kashaghan, and Gorgon (and this before Heavy Oil projects) –which so far appear to be making credible headway in terms of development progress and commercial negotiation.
Based on our production forecast (see later) we see a total of some 7bnboe output 2005 to 2009 (or an average 3.85mboe/d for the period). This is roughly half the level of the reserves that could potentially be booked over the period implying an average 200% replacement (ie, twice the expected production).
Even if we were more optimistic for production, and Shell were to become more conservative on reserve bookings (or we assume some delays to bookings given the technically and commercially challenging nature of the projects involved) it would still be plausible to see Shell achieving an RRR in excess of 150% over 2005-2009.
Fig 25 Organic reserve analysis (1999-2003)
01,0002,0003,0004,0005,0006,0007,0008,0009,000
10,000
BP XOM CVX TOTAL Shell ENI COP
mbo
e
020406080100120140160
Org
anic
Res
erve
R
epla
cem
ent (
%)
Reserve Additions (restatements & improved recovery)Reserve Additions (extensions and discoveries)Organic Reserves Replacement
Source: ING, Companies. XOM – ExxonMobil; CVX – Chevron; COP - ConocoPhilips
_
Production growth: a change of focus Shell’s guidance/aspirations for production growth are as follows:
• 2004/2005: 3.7 - 3.8mboe/d (actual 3.77mboe/d 2004).
• 2009: 3.8 - 4.0mboe/d.
• 2014: 4.5 – 5.0mboe/d.
This gives the impression that Shell has some volume growth given the incremental 200kb/d step-up in volumes over the period 2004 – 2009. In fact, the guidance range is only 0.1%-1.6% on a compound basis, which even at best is substantially lower than
150% to 200% per annum replacement
plausible 2005 to 2009
Sound funnel of reserves – even before additional exploration
See back of report for important disclosures and disclaimer
26
Shell May 2005
that expected by peers over a similar timeframe (BP 5% to 2008, TOTAL 4% to 2010, ENI 5% to 2008, Repsol 5% to 2007, Statoil 8% to 2007). Having undertaken an in depth review of the group's upstream projects on an asset by asset basis, a 1.3% volume CAGR aspiration to 2009 – while poor - looks credible.
Fig 26 RD/Shell production volumes by country/region (000 boe/d)
2P boe (000's b/d) 2002 2003 2004 2005F 2006F 2007F 2008F 2009F 2010F 2011F 2012F 2013F 2014F
US Lower 48 / GoM shelf 196 135 67 32 27 23 20 17 14 12 10 9 7GoM (deep) profile 535 542 537 525 502 457 381 338 282 229 180 147 124US 731 677 604 557 529 481 401 355 296 241 190 156 131Volume growth (%YoY) 7 -7 -11 -8 -5 -9 -17 -11 -16 -19 -21 -18 -16
UK/Europe Total UK 600 526 445 425 387 340 282 228 189 151 135 114 95EU ex UK 728 763 780 752 750 768 787 809 798 787 737 665 625UK/Europe 1,328 1,289 1,225 1,177 1,137 1,108 1,069 1,038 987 937 872 780 720Volume growth (%YoY) 12 -3 -5 -4 -3 -3 -3 -3 -5 -5 -7 -11 -8
Rest of world Canada - ex heavy oil 125 124 117 118 118 121 120 115 109 105 101 93 82Argentina 8 9 10 9 9 8 8 7 6 5 5 4 3Brazil 2 11 46 47 46 46 42 37 51 77 73 69 65Venezuela 46 46 22 30 40 40 40 49 71 97 92 82 79Other Western Hem' ex Canada 56 66 78 86 95 94 89 93 129 180 170 155 147Other Western Hem’ ex heavy oil 184 194 198 205 213 216 210 208 237 284 271 248 229
Egypt 51 50 46 33 29 25 21 17 14 11 10 9 6Cameroon 17 16 15 15 15 15 14 14 13 12 11 9 7Gabon 46 35 35 34 32 30 28 25 24 21 17 16 14Nigeria (SV & PSC) 257 375 414 424 497 605 703 757 843 847 831 811 804Other Africa 114 101 96 82 76 70 63 56 51 44 38 34 27Africa 322 426 464 473 544 650 745 796 880 880 859 836 825
Iran 36 35 36 36 36 36 36 35 35 35 30 30 25Oman 455 350 327 331 331 342 353 353 353 353 353 353 353Syria 52 46 37 37 32 27 21 16 10 8 5 0 0UAE 100 126 133 132 125 120 120 120 120 120 110 100 90Qatar GTL + LNG 0 0 0 0 0 0 100 100 200 217 243 272 272Middle East 642 557 533 536 524 524 630 623 718 733 741 755 740Kazakhstan 0 0 0 0 0 0 15 69 114 114 114 224 224Russia 33 30 32 34 58 144 171 197 278 268 268 383 383Russia/CIS 33 30 32 34 58 144 186 266 391 381 381 608 607Middle East, Russia, CIS 703 619 590 581 590 672 817 887 1,103 1,106 1,112 1,347 1,335
Australia 156 143 135 129 141 154 150 160 206 253 257 264 303New Zealand 108 69 59 57 57 51 61 63 54 52 50 36 31Brunei 189 198 194 190 185 180 175 170 165 165 160 160 155Malaysia 173 172 174 172 175 174 164 155 152 156 125 128 122Philippines 5 10 14 16 16 16 16 16 16 16 16 16 16Thailand 24 23 0 0 0 0 0 0 0 0 0 0 0China 24 22 20 20 36 52 57 53 53 53 52 51 51Bangladesh 6 6 0 0 0 0 0 0 0 0 0 0 0Pakistan 5 10 14 15 15 15 15 15 14 14 11 9 9Asia Pacific 691 653 610 598 624 642 637 631 660 709 671 665 686
Other (already split as necessary) 18 20 18 17 16 16 16 15 15 15 10 6 6Total ROW inc heavy oil exc Iran 1,900 1,938 1,942 1,947 2,067 2,280 2,508 2,621 2,980 3,139 3,073 3,256 3,356Volume growth (%YoY) 1 2 0 0 6 10 10 5 14 5 -2 6 3
UK/Europe 1,328 1,289 1,225 1,177 1,137 1,108 1,069 1,038 987 937 872 780 720Africa 322 426 464 473 544 650 745 796 880 880 859 836 825Asia Pacific 691 653 610 598 624 642 637 631 660 709 671 665 686Middle East, Russia, CIS 703 619 590 581 590 672 817 887 1,103 1,106 1,112 1,347 1,335US 731 677 604 557 529 481 401 355 296 241 190 156 131Other Western Hem’ - ex heavy oil 184 194 198 205 213 216 210 208 237 284 271 248 229Canada - heavy oil 0 46 80 90 95 100 100 100 100 160 160 160 280
Shell total World (000 boe/d) 3,959 3,904 3,771 3,681 3,733 3,868 3,978 4,014 4,263 4,317 4,135 4,192 4,207
Volume growth (%) 5.7 -1.4 -3.4 -2.4 1.4 3.6 2.8 0.9 6.2 1.3 -4.2 1.4 0.4Rolling 5yr CAGR (%) 1.5 1.2 0.9 0.1 -0.1 -0.5 0.4 1.3 3.0 2.9 1.3 1.1 0.9TARGET (mboe/d) 3.5 - 3.8 3.8-4.0 4.5-5.0
ING Split oil vs gas (% oil) 59.6 60.9 59.7 59.1 59.0 58.0 58.4 57.9 58.5 57.0 56.4 56.3 57.4
Source: Company data, ING estimates. Includes non-zero historical contributions from exited positions (e.g. Bangladesh, Thailand, US Michigan assets). Future profiles exclude potential contributions from Persian LNG (Iran) from 2010, UAE incremental development post 2006, Norwegian gas exploration/development upside (e.g. Onyx), recent Egypt gas discoveries (La52, Kg45), and Malaysia oil upside (Gumusut).
_
See back of report for important disclosures and disclaimer
27
Shell May 2005
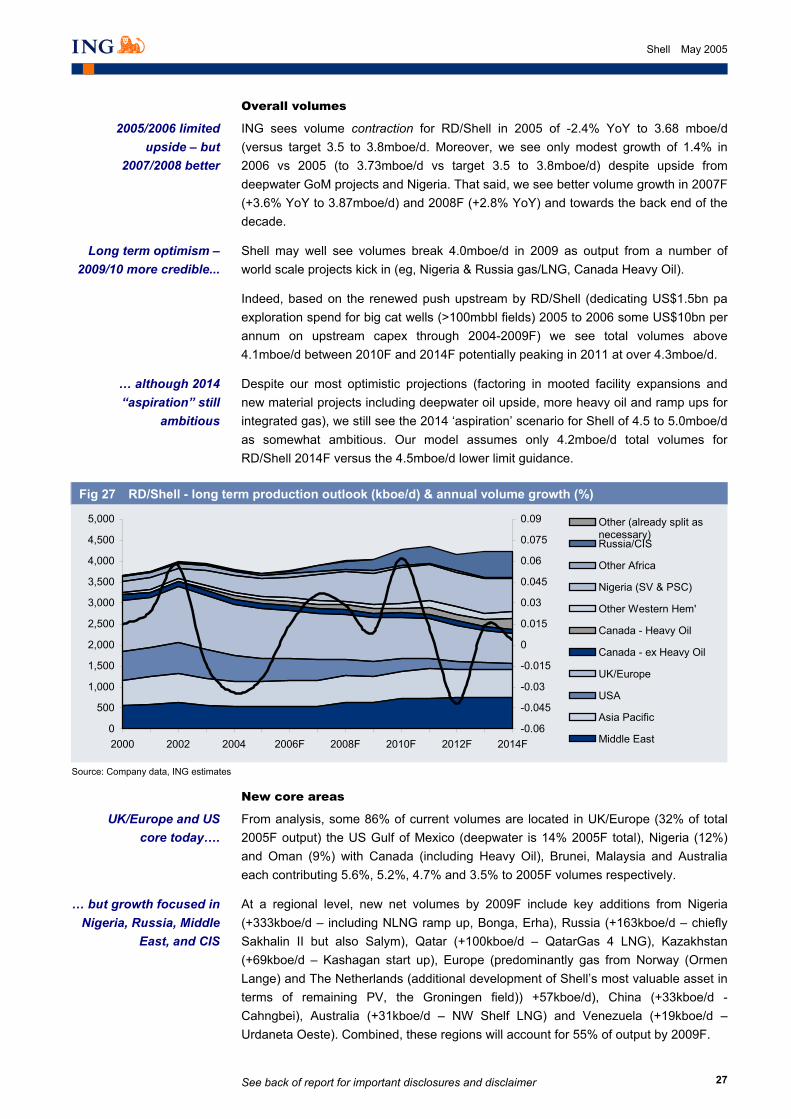
Overall volumes
ING sees volume contraction for RD/Shell in 2005 of -2.4% YoY to 3.68 mboe/d (versus target 3.5 to 3.8mboe/d. Moreover, we see only modest growth of 1.4% in 2006 vs 2005 (to 3.73mboe/d vs target 3.5 to 3.8mboe/d) despite upside from deepwater GoM projects and Nigeria. That said, we see better volume growth in 2007F (+3.6% YoY to 3.87mboe/d) and 2008F (+2.8% YoY) and towards the back end of the decade.
Shell may well see volumes break 4.0mboe/d in 2009 as output from a number of world scale projects kick in (eg, Nigeria & Russia gas/LNG, Canada Heavy Oil).
Indeed, based on the renewed push upstream by RD/Shell (dedicating US$1.5bn pa exploration spend for big cat wells (>100mbbl fields) 2005 to 2006 some US$10bn per annum on upstream capex through 2004-2009F) we see total volumes above 4.1mboe/d between 2010F and 2014F potentially peaking in 2011 at over 4.3mboe/d.
Despite our most optimistic projections (factoring in mooted facility expansions and new material projects including deepwater oil upside, more heavy oil and ramp ups for integrated gas), we still see the 2014 ‘aspiration’ scenario for Shell of 4.5 to 5.0mboe/d as somewhat ambitious. Our model assumes only 4.2mboe/d total volumes for RD/Shell 2014F versus the 4.5mboe/d lower limit guidance.
Fig 27 RD/Shell - long term production outlook (kboe/d) & annual volume growth (%)
0
500
1,000
1,500
2,000
2,500
3,000
3,500
4,000
4,500
5,000
2000 2002 2004 2006F 2008F 2010F 2012F 2014F-0.06
-0.045
-0.03
-0.015
0
0.015
0.03
0.045
0.06
0.075
0.09 Other (already split asnecessary)Russia/CIS
Other Africa
Nigeria (SV & PSC)
Other Western Hem'
Canada - Heavy Oil
Canada - ex Heavy Oil
UK/Europe
USA
Asia Pacific
Middle East
Source: Company data, ING estimates _
New core areas
From analysis, some 86% of current volumes are located in UK/Europe (32% of total 2005F output) the US Gulf of Mexico (deepwater is 14% 2005F total), Nigeria (12%) and Oman (9%) with Canada (including Heavy Oil), Brunei, Malaysia and Australia each contributing 5.6%, 5.2%, 4.7% and 3.5% to 2005F volumes respectively.
At a regional level, new net volumes by 2009F include key additions from Nigeria (+333kboe/d – including NLNG ramp up, Bonga, Erha), Russia (+163kboe/d – chiefly Sakhalin II but also Salym), Qatar (+100kboe/d – QatarGas 4 LNG), Kazakhstan (+69kboe/d – Kashagan start up), Europe (predominantly gas from Norway (Ormen Lange) and The Netherlands (additional development of Shell’s most valuable asset in terms of remaining PV, the Groningen field)) +57kboe/d), China (+33kboe/d - Cahngbei), Australia (+31kboe/d – NW Shelf LNG) and Venezuela (+19kboe/d – Urdaneta Oeste). Combined, these regions will account for 55% of output by 2009F.
2005/2006 limited upside – but
2007/2008 better
Long term optimism – 2009/10 more credible...
… although 2014 “aspiration” still
ambitious
UK/Europe and US core today….
… but growth focused in Nigeria, Russia, Middle
East, and CIS
See back of report for important disclosures and disclaimer
28
Shell May 2005
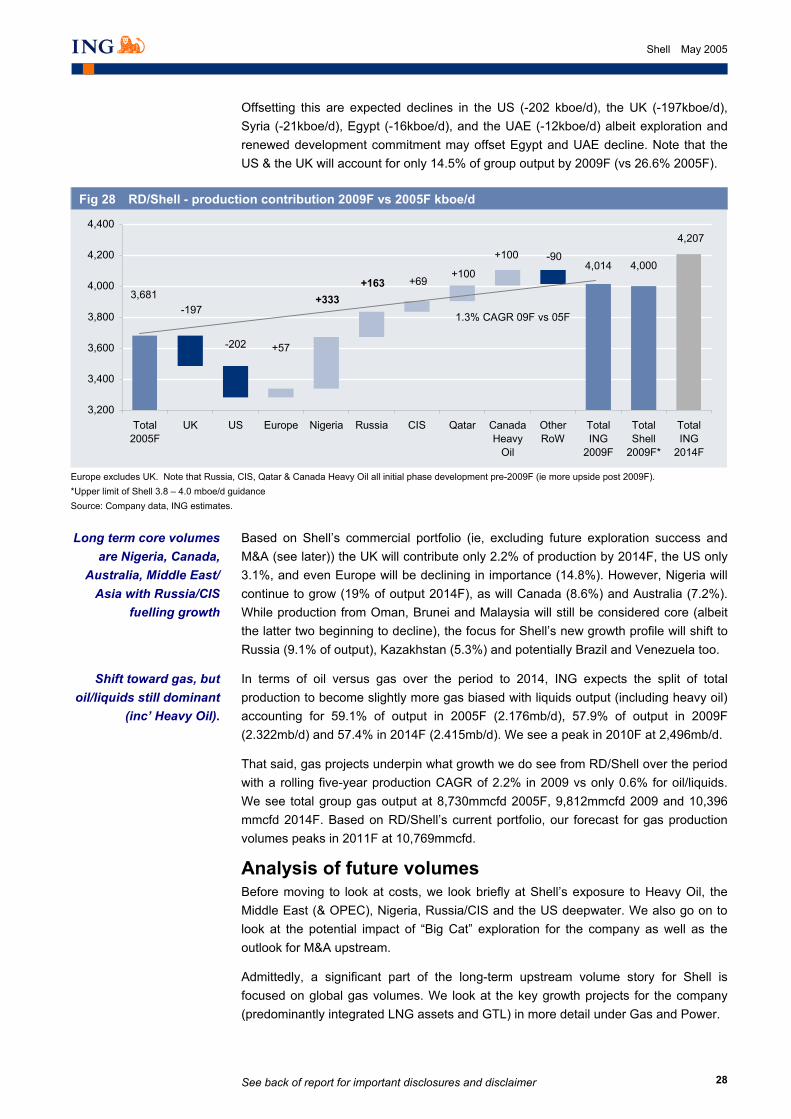
Offsetting this are expected declines in the US (-202 kboe/d), the UK (-197kboe/d), Syria (-21kboe/d), Egypt (-16kboe/d), and the UAE (-12kboe/d) albeit exploration and renewed development commitment may offset Egypt and UAE decline. Note that the US & the UK will account for only 14.5% of group output by 2009F (vs 26.6% 2005F).
Fig 28 RD/Shell - production contribution 2009F vs 2005F kboe/d
4,207
4,0004,014
3,681
+100
+100 -90
+57-202
+69+163+333
-197
3,200
3,400
3,600
3,800
4,000
4,200
4,400
Total2005F
UK US Europe Nigeria Russia CIS Qatar CanadaHeavy
Oil
OtherRoW
TotalING
2009F
TotalShell
2009F*
TotalING
2014F
1.3% CAGR 09F vs 05F
Europe excludes UK. Note that Russia, CIS, Qatar & Canada Heavy Oil all initial phase development pre-2009F (ie more upside post 2009F). *Upper limit of Shell 3.8 – 4.0 mboe/d guidance Source: Company data, ING estimates.
_
Based on Shell’s commercial portfolio (ie, excluding future exploration success and M&A (see later)) the UK will contribute only 2.2% of production by 2014F, the US only 3.1%, and even Europe will be declining in importance (14.8%). However, Nigeria will continue to grow (19% of output 2014F), as will Canada (8.6%) and Australia (7.2%). While production from Oman, Brunei and Malaysia will still be considered core (albeit the latter two beginning to decline), the focus for Shell’s new growth profile will shift to Russia (9.1% of output), Kazakhstan (5.3%) and potentially Brazil and Venezuela too.
In terms of oil versus gas over the period to 2014, ING expects the split of total production to become slightly more gas biased with liquids output (including heavy oil) accounting for 59.1% of output in 2005F (2.176mb/d), 57.9% of output in 2009F (2.322mb/d) and 57.4% in 2014F (2.415mb/d). We see a peak in 2010F at 2,496mb/d.
That said, gas projects underpin what growth we do see from RD/Shell over the period with a rolling five-year production CAGR of 2.2% in 2009 vs only 0.6% for oil/liquids. We see total group gas output at 8,730mmcfd 2005F, 9,812mmcfd 2009 and 10,396 mmcfd 2014F. Based on RD/Shell’s current portfolio, our forecast for gas production volumes peaks in 2011F at 10,769mmcfd.
Analysis of future volumes Before moving to look at costs, we look briefly at Shell’s exposure to Heavy Oil, the Middle East (& OPEC), Nigeria, Russia/CIS and the US deepwater. We also go on to look at the potential impact of “Big Cat” exploration for the company as well as the outlook for M&A upstream.
Admittedly, a significant part of the long-term upstream volume story for Shell is focused on global gas volumes. We look at the key growth projects for the company (predominantly integrated LNG assets and GTL) in more detail under Gas and Power.
Long term core volumes are Nigeria, Canada,
Australia, Middle East/ Asia with Russia/CIS
fuelling growth
Shift toward gas, but oil/liquids still dominant
(inc’ Heavy Oil).
See back of report for important disclosures and disclaimer
29
Shell May 2005
Heavy oil - resource upside
Part of Shell’s long-term growth strategy is based on non-conventional energy including heavy oil (essentially viscous Bitumen - high specific gravity, low hydrogen to carbon ratio) with the company’s efforts focused on the mining of Canadian oil sands. Why? In terms of remaining resources, it is estimated that Canada has some 320 billion barrels of recoverable bitumen contained in its oil sands (20% mineable; 80% In Situ recovery) or around 300bn barrels synthetic crude once upgraded. This compares to estimates of Saudi Arabia’s remaining oil reserves of around 260bn barrels. So, Canada truly offers a world-scale opportunity albeit deep value.
On a global scale, non-conventional oil production (including Gas-To-Liquids (GTL) – see Gas and Power section) is projected to grow from 1.6mb/d in 2002 to 3.8mb/d 2010 and potentially 10.1mb/d in 2030, at which stage it will account for around 8% of global oil supply. The majority (76%) of the non-conventional production gains will come primarily from upgraded Bitumen/synthetic crudes from Canada and also the Orinoco extra-heavy crude oil belt in Venezuela.
In particular, with some US$75bn of investment possible (CN$60bn), Alberta alone is expected to be producing some 700kboe/d of synthetic crude by around 2018-2020 with output of this level sustainable for decades thereafter. Around 50% of this will be upgraded crude from the Athabasca region. Note that while Heavy Oil has comparatively higher operating costs, it offers high margin at high prices due to low government take. Moreover, oil sand assets carry virtually zero exploration risk too.
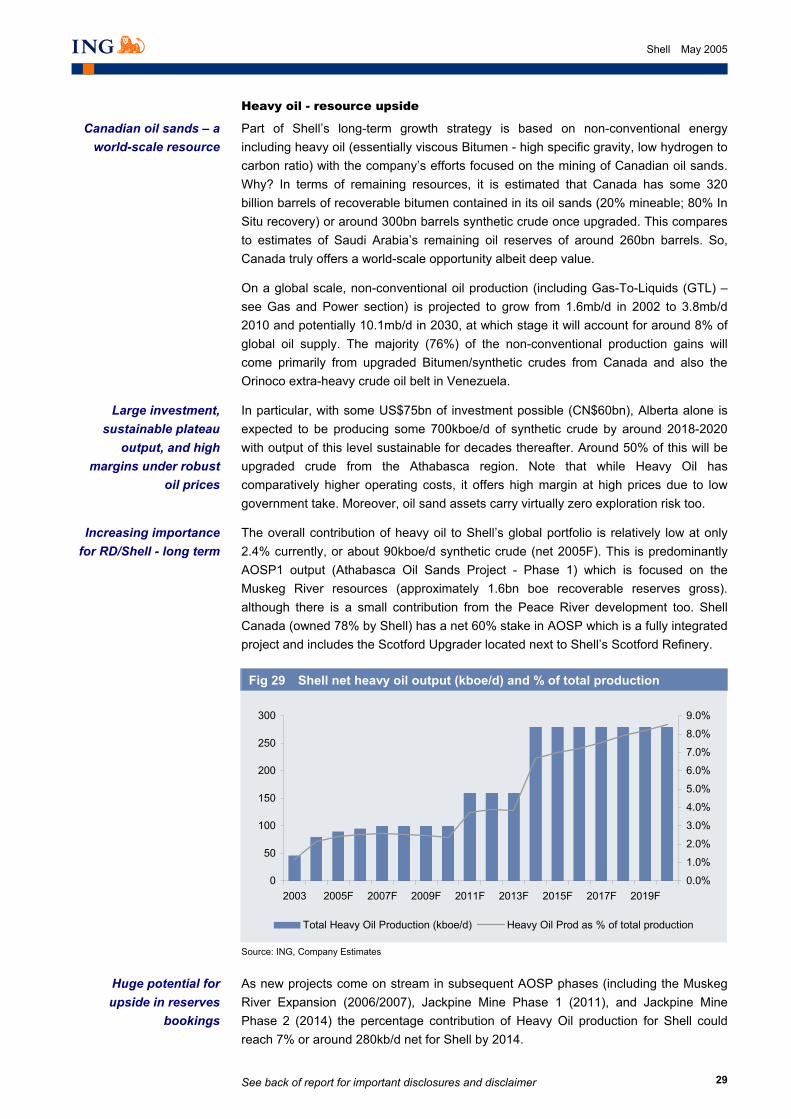
The overall contribution of heavy oil to Shell’s global portfolio is relatively low at only 2.4% currently, or about 90kboe/d synthetic crude (net 2005F). This is predominantly AOSP1 output (Athabasca Oil Sands Project - Phase 1) which is focused on the Muskeg River resources (approximately 1.6bn boe recoverable reserves gross). although there is a small contribution from the Peace River development too. Shell Canada (owned 78% by Shell) has a net 60% stake in AOSP which is a fully integrated project and includes the Scotford Upgrader located next to Shell’s Scotford Refinery.
Fig 29 Shell net heavy oil output (kboe/d) and % of total production
0
50
100
150
200
250
300
2003 2005F 2007F 2009F 2011F 2013F 2015F 2017F 2019F0.0%
1.0%
2.0%
3.0%
4.0%
5.0%
6.0%
7.0%
8.0%
9.0%
Total Heavy Oil Production (kboe/d) Heavy Oil Prod as % of total production
Source: ING, Company Estimates
_
As new projects come on stream in subsequent AOSP phases (including the Muskeg River Expansion (2006/2007), Jackpine Mine Phase 1 (2011), and Jackpine Mine Phase 2 (2014) the percentage contribution of Heavy Oil production for Shell could reach 7% or around 280kb/d net for Shell by 2014.
Canadian oil sands – a world-scale resource
Increasing importance for RD/Shell - long term
Large investment, sustainable plateau
output, and high margins under robust
oil prices
Huge potential for upside in reserves
bookings
See back of report for important disclosures and disclaimer
30
Shell May 2005
This plateau level of output is considered plausible for 30 years thereafter – with upside from additional development very possible given the giant resource availability and expansion opportunities. ING estimates that so far only around 0.9bn boe of the potential 3.9bn boe net (6.5bn boe gross) recoverable resource exposure has been booked by Shell, which in itself offers upside for reserve replacement to 2010F (see earlier). Moreover, gross reserves in place are estimated at 9bn to 10bn boe in place offering room for recovery upside.
Mining and upgrading projects in Canada have become much more competitive these days with a total cost for recovery/upgrading estimated at around US$12/bbl today (versus >US$20/bbl in the early 1990s). This is now in line with the more energy-intensive in situ projects which usually incorporate steam-assisted gravity drainage (SAGD) or the injection of heat (as steam) to allow bitumen to flow and be recovered.
While both types of recovery are attractive at today’s oil price (returns of 20% plus under a US$20/bbl base case obviously vastly increased under the current US$45/bbl oil price, with the value of projects also increasing directly in proportion to oil price moves in percent terms), we note that the cost of steam production remains particularly sensitive to gas prices, which remain high. This provides added pressure for in-situ heavy oil recovery over mining projects, albeit higher energy costs affect both. Labour remains a key cost concern in Canada too given limited manpower availability.
Note that heavy oil and synthetic crude by its nature requires refineries with a higher complexity to refine it into oil products such as gasoline or jet fuel. Obviously the integrated nature of AOSP and Scotford in Canada offers particular synergies for Shell. In addition though, Shell’s higher Nelson’s complexity in Canada and the US also offers upside for the medium-term at least given the fact that Heavy/Light crude differentials have increased and a greater margin on refining heavy crude is possible. This is looked at further in the Oil Products section later.
While unlikely to displace conventional oil supply to the North American market from the international crude markets short term, incremental demand growth and the need for security of supply guarantees a market for heavy oil, assuming prices do not collapse.
Middle East exposure – integrated gas to drive growth
The benefits of Middle Eastern exposure are simple: The region has the world’s largest proven reserves base for conventional (cheap to produce and implicitly higher return) oil and also significant yet to be developed, high value gas resources.
The difficulty for IOCs is the limited access to new investment with attractive returns in the region given the dominance of National Oil Companies and the competitive pressure for the few potential opportunities (see “Limited Access”, October 2004).
At 15.4% of current global production, Shell’s Middle Eastern exposure is second only to TOTAL in relative terms (15.8% of current output located in the region). Shell’s portfolio is becoming increasingly diverse, with its core Oman and UAE base being added to by output from Iran, Egypt and Qatar.
Total output is set to remain relatively stable at around 550kboe/d 2005F to 2007F. However, the addition from Qatar LNG in particular 2008F and expansion there in 2010F will boost output to around 750kboe/d in the early part of next decade (split 78%
Costs have improved – but sensitive to
energy prices
Upside from wide heavy-light differential
medium term
Good market for Canada heavy oil as long as no
price collapse
Middle East – a core region – with Qatar LNG
boosting importance
Huge resources…
…but Limited Access
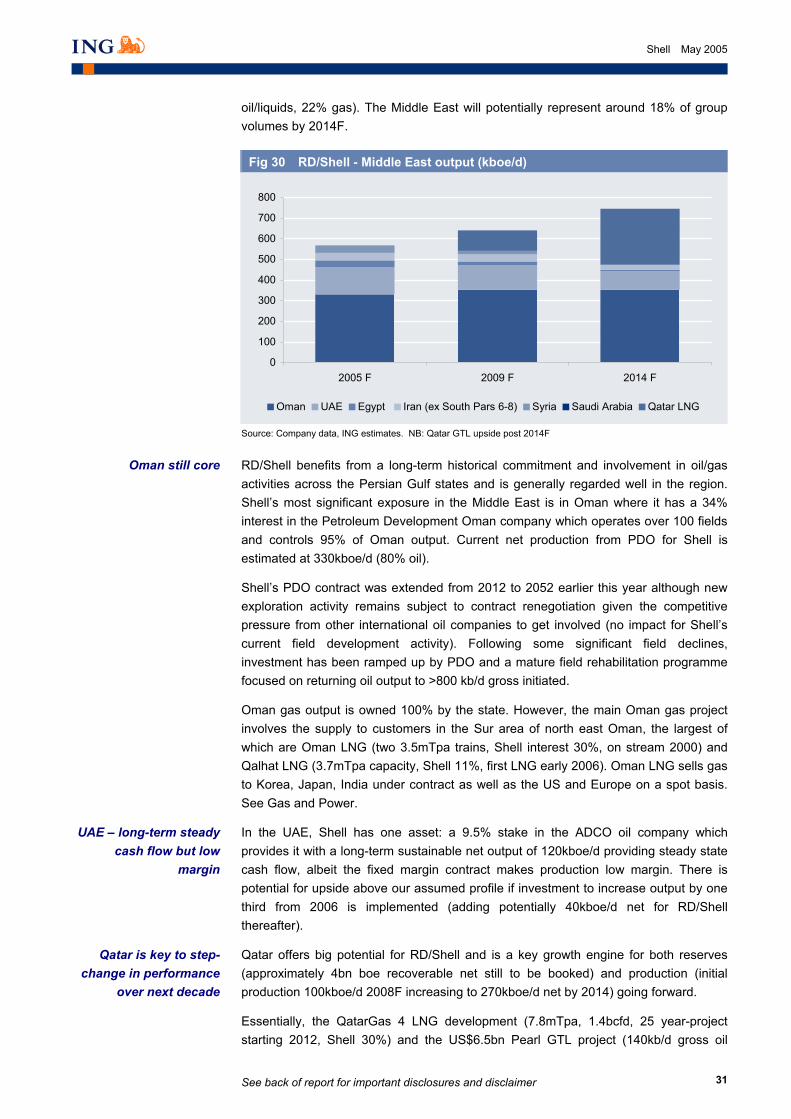
See back of report for important disclosures and disclaimer
31
Shell May 2005
oil/liquids, 22% gas). The Middle East will potentially represent around 18% of group volumes by 2014F.
Fig 30 RD/Shell - Middle East output (kboe/d)
0
100
200
300
400
500
600
700
800
2005 F 2009 F 2014 F
Oman UAE Egypt Iran (ex South Pars 6-8) Syria Saudi Arabia Qatar LNG
Source: Company data, ING estimates. NB: Qatar GTL upside post 2014F
_
RD/Shell benefits from a long-term historical commitment and involvement in oil/gas activities across the Persian Gulf states and is generally regarded well in the region. Shell’s most significant exposure in the Middle East is in Oman where it has a 34% interest in the Petroleum Development Oman company which operates over 100 fields and controls 95% of Oman output. Current net production from PDO for Shell is estimated at 330kboe/d (80% oil).
Shell’s PDO contract was extended from 2012 to 2052 earlier this year although new exploration activity remains subject to contract renegotiation given the competitive pressure from other international oil companies to get involved (no impact for Shell’s current field development activity). Following some significant field declines, investment has been ramped up by PDO and a mature field rehabilitation programme focused on returning oil output to >800 kb/d gross initiated.
Oman gas output is owned 100% by the state. However, the main Oman gas project involves the supply to customers in the Sur area of north east Oman, the largest of which are Oman LNG (two 3.5mTpa trains, Shell interest 30%, on stream 2000) and Qalhat LNG (3.7mTpa capacity, Shell 11%, first LNG early 2006). Oman LNG sells gas to Korea, Japan, India under contract as well as the US and Europe on a spot basis. See Gas and Power.
In the UAE, Shell has one asset: a 9.5% stake in the ADCO oil company which provides it with a long-term sustainable net output of 120kboe/d providing steady state cash flow, albeit the fixed margin contract makes production low margin. There is potential for upside above our assumed profile if investment to increase output by one third from 2006 is implemented (adding potentially 40kboe/d net for RD/Shell thereafter).
Qatar offers big potential for RD/Shell and is a key growth engine for both reserves (approximately 4bn boe recoverable net still to be booked) and production (initial production 100kboe/d 2008F increasing to 270kboe/d net by 2014) going forward.
Essentially, the QatarGas 4 LNG development (7.8mTpa, 1.4bcfd, 25 year-project starting 2012, Shell 30%) and the US$6.5bn Pearl GTL project (140kb/d gross oil
Oman still core
UAE – long-term steady cash flow but low
margin
Qatar is key to step-change in performance
over next decade
See back of report for important disclosures and disclaimer
32
Shell May 2005
products plus 60kboe/d NGL’s) offers real step change upside for both upstream and group performance long term. See Gas and Power for more detail.
Elsewhere in the Middle East Shell has a 100% buy-back agreement with the National Iranian Oil Company (NIOC) to develop Soroosh & Nowruz fields in the northern Gulf. The plan is to hand over operatorship to NIOC once plateau production is reached (2009). Shell is also looking to leverage its leading integrated LNG portfolio via the development of Persian LNG with partner Repsol-YPF (first gas is potentially possible by 2010). We have not included a gas profile for this project to date. Also, in Syria (around 32kboe/d net output currently) Shell is involved in three Production Sharing Contracts that are due to expire between 2008 and 2014. Further out, gas exploration in Saudi Arabia (via a JV with TOTAL and Saudi Aramco) may prove prospective and albeit considerable challenges exist (culturally, technically, commercially).
OPEC
Historically, Shell has been impacted by OPEC production quota changes, although currently OPEC is producing above quotas in an effort to cool down global oil prices.
In terms of OPEC-10 (ex-Iraq) oil exposure Shell is involved in oil activity in the Middle East (including Iran, UAE, Qatar, Saudi Arabia discussed above but excluding Kuwait) and also in Nigeria and Venezuela. While Shell also has significant gas projects in Nigeria and gas interests in Venezuela, Algeria and Libya these are not subject to OPEC oil production quotas. Shell has no oil (or gas) assets in Indonesia.
Oil/liquid output for Shell from OPEC (ie, its Nigeria, Venezuela, UAE, and Iran output) is currently estimated at 556kboe/d (2005F) which is around 15% of group volumes. The majority of this volume is from Nigeria (358kboe/d) and the UAE (120kboe/d). With production additions in Nigeria, a forecast OPEC output of 880kboe/d in 2010F is possible by 2010F, representing almost 21% of group production in that year. For the purpose of this analysis, we have assumed that the Qatar GTL liquids output will not be subject to OPEC quotas, given its gas basis and the unique processing involved.
Nigeria – core value, material growth – but not without risk
Nigeria and the 30% stake in the NNPC JV in particular, is core to Shell’s current valuation. However, new material deepwater oil projects in Nigeria (focused on Bonga (plus satellites), Erha/Bosi (plus satellites) and Bolia) are key to Shell’s future growth and overall long-term sustainability upstream – albeit not without risk.
Currently, Nigeria underpins some 11.5% of group volumes (424kboe/d 2005F (358kb/d oil, 380mmcfd gas)), and still offers a strong pipeline of development activity with deepwater projects (see below) and additional LNG potential driving notable value upside (Nigeria LNG and potential from OK LNG is discussed in Gas and Power). Overall output from Nigeria could reach some 614 kb/d of oil and 827 mmcfd by 2009F (757kboe/d, 19% of group output) and 645kb/d oil and 925mmcfd by 2014F (804 kboe/d – 19.1% of group volumes) with almost all of this growth driven by the recent move into the deepwater sector (Abo is already on stream).
Notably, Shell is operator of the massive deepwater Bonga field with a 55% stake (licence OML118). The field has gross reserves of around 700mboe (85% oil) and is due on-stream late 2005F (with a forecast plateau of 120kb/d and 80mmcfd by 2009F). The 2001 Bonga South West discovery could provide substantial upside to this project, adding net reserves of 250 mbbls (albeit subject to unitisation). Bonga North West (c.150mbbls reserves) should also add to output by 2012-2015F. Furthermore, the Erha field (in block OPL209 - Shell 43.8%) is expected on stream by 2006, adding
Iran, Syria short-term contribution; Saudi
Arabia gas potential long term
Legacy position in Nigeria – with
phenomenal growth still to come
Nigeria is core value for Shell
Deepwater is key to forward growth
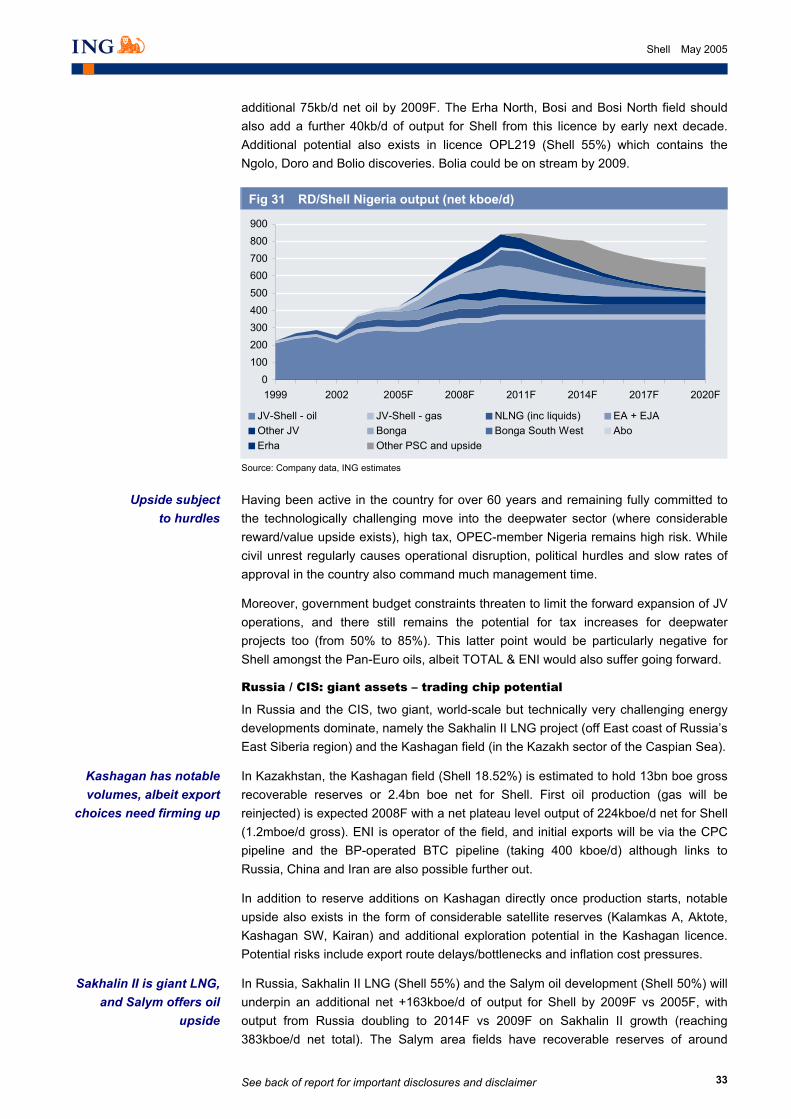
See back of report for important disclosures and disclaimer
33
Shell May 2005
additional 75kb/d net oil by 2009F. The Erha North, Bosi and Bosi North field should also add a further 40kb/d of output for Shell from this licence by early next decade. Additional potential also exists in licence OPL219 (Shell 55%) which contains the Ngolo, Doro and Bolio discoveries. Bolia could be on stream by 2009.
Fig 31 RD/Shell Nigeria output (net kboe/d)
0100200300400500600700800900
1999 2002 2005F 2008F 2011F 2014F 2017F 2020F
JV-Shell - oil JV-Shell - gas NLNG (inc liquids) EA + EJAOther JV Bonga Bonga South West AboErha Other PSC and upside
Source: Company data, ING estimates
_
Having been active in the country for over 60 years and remaining fully committed to the technologically challenging move into the deepwater sector (where considerable reward/value upside exists), high tax, OPEC-member Nigeria remains high risk. While civil unrest regularly causes operational disruption, political hurdles and slow rates of approval in the country also command much management time.
Moreover, government budget constraints threaten to limit the forward expansion of JV operations, and there still remains the potential for tax increases for deepwater projects too (from 50% to 85%). This latter point would be particularly negative for Shell amongst the Pan-Euro oils, albeit TOTAL & ENI would also suffer going forward.
Russia / CIS: giant assets – trading chip potential
In Russia and the CIS, two giant, world-scale but technically very challenging energy developments dominate, namely the Sakhalin II LNG project (off East coast of Russia’s East Siberia region) and the Kashagan field (in the Kazakh sector of the Caspian Sea).
In Kazakhstan, the Kashagan field (Shell 18.52%) is estimated to hold 13bn boe gross recoverable reserves or 2.4bn boe net for Shell. First oil production (gas will be reinjected) is expected 2008F with a net plateau level output of 224kboe/d net for Shell (1.2mboe/d gross). ENI is operator of the field, and initial exports will be via the CPC pipeline and the BP-operated BTC pipeline (taking 400 kboe/d) although links to Russia, China and Iran are also possible further out.
In addition to reserve additions on Kashagan directly once production starts, notable upside also exists in the form of considerable satellite reserves (Kalamkas A, Aktote, Kashagan SW, Kairan) and additional exploration potential in the Kashagan licence. Potential risks include export route delays/bottlenecks and inflation cost pressures.
In Russia, Sakhalin II LNG (Shell 55%) and the Salym oil development (Shell 50%) will underpin an additional net +163kboe/d of output for Shell by 2009F vs 2005F, with output from Russia doubling to 2014F vs 2009F on Sakhalin II growth (reaching 383kboe/d net total). The Salym area fields have recoverable reserves of around
Upside subject to hurdles
Kashagan has notable volumes, albeit export
choices need firming up
Sakhalin II is giant LNG, and Salym offers oil
upside
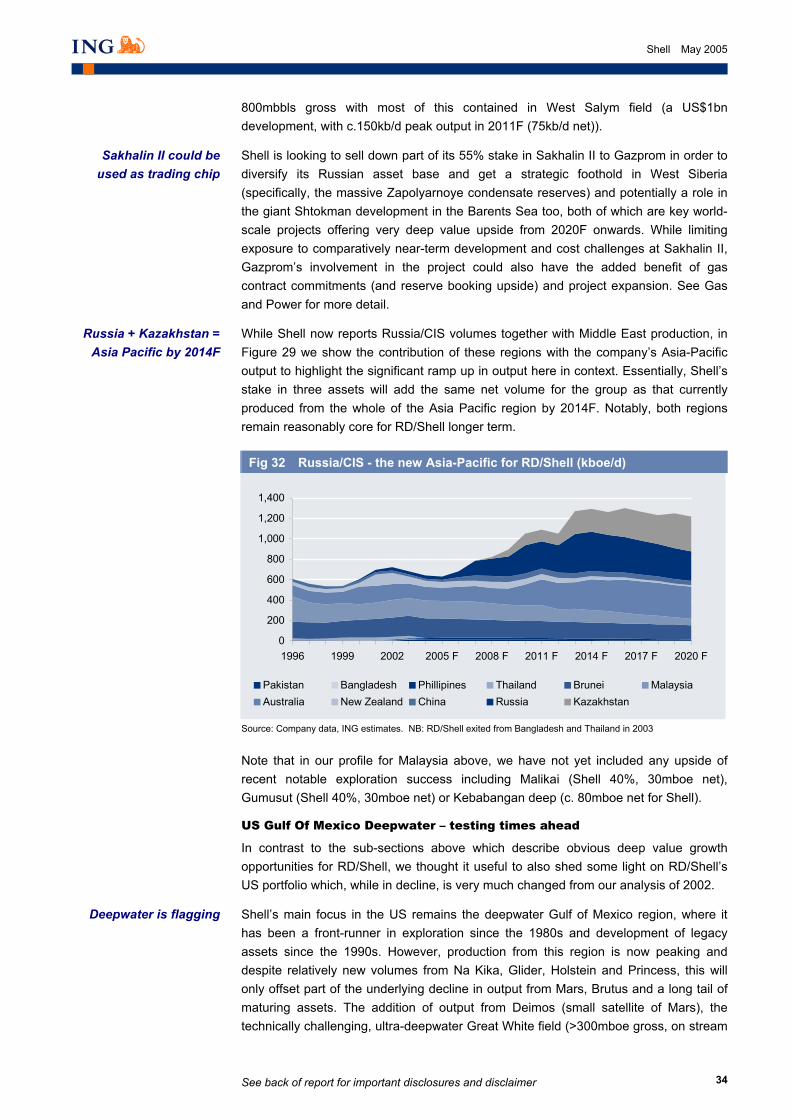
See back of report for important disclosures and disclaimer
34
Shell May 2005
800mbbls gross with most of this contained in West Salym field (a US$1bn development, with c.150kb/d peak output in 2011F (75kb/d net)).
Shell is looking to sell down part of its 55% stake in Sakhalin II to Gazprom in order to diversify its Russian asset base and get a strategic foothold in West Siberia (specifically, the massive Zapolyarnoye condensate reserves) and potentially a role in the giant Shtokman development in the Barents Sea too, both of which are key world-scale projects offering very deep value upside from 2020F onwards. While limiting exposure to comparatively near-term development and cost challenges at Sakhalin II, Gazprom’s involvement in the project could also have the added benefit of gas contract commitments (and reserve booking upside) and project expansion. See Gas and Power for more detail.
While Shell now reports Russia/CIS volumes together with Middle East production, in Figure 29 we show the contribution of these regions with the company’s Asia-Pacific output to highlight the significant ramp up in output here in context. Essentially, Shell’s stake in three assets will add the same net volume for the group as that currently produced from the whole of the Asia Pacific region by 2014F. Notably, both regions remain reasonably core for RD/Shell longer term.
Fig 32 Russia/CIS - the new Asia-Pacific for RD/Shell (kboe/d)
0
200
400
600
800
1,000
1,200
1,400
1996 1999 2002 2005 F 2008 F 2011 F 2014 F 2017 F 2020 F
Pakistan Bangladesh Phillipines Thailand Brunei MalaysiaAustralia New Zealand China Russia Kazakhstan
Source: Company data, ING estimates. NB: RD/Shell exited from Bangladesh and Thailand in 2003
_
Note that in our profile for Malaysia above, we have not yet included any upside of recent notable exploration success including Malikai (Shell 40%, 30mboe net), Gumusut (Shell 40%, 30mboe net) or Kebabangan deep (c. 80mboe net for Shell).
US Gulf Of Mexico Deepwater – testing times ahead
In contrast to the sub-sections above which describe obvious deep value growth opportunities for RD/Shell, we thought it useful to also shed some light on RD/Shell’s US portfolio which, while in decline, is very much changed from our analysis of 2002.
Shell’s main focus in the US remains the deepwater Gulf of Mexico region, where it has been a front-runner in exploration since the 1980s and development of legacy assets since the 1990s. However, production from this region is now peaking and despite relatively new volumes from Na Kika, Glider, Holstein and Princess, this will only offset part of the underlying decline in output from Mars, Brutus and a long tail of maturing assets. The addition of output from Deimos (small satellite of Mars), the technically challenging, ultra-deepwater Great White field (>300mboe gross, on stream
Deepwater is flagging
Sakhalin II could be used as trading chip
Russia + Kazakhstan = Asia Pacific by 2014F
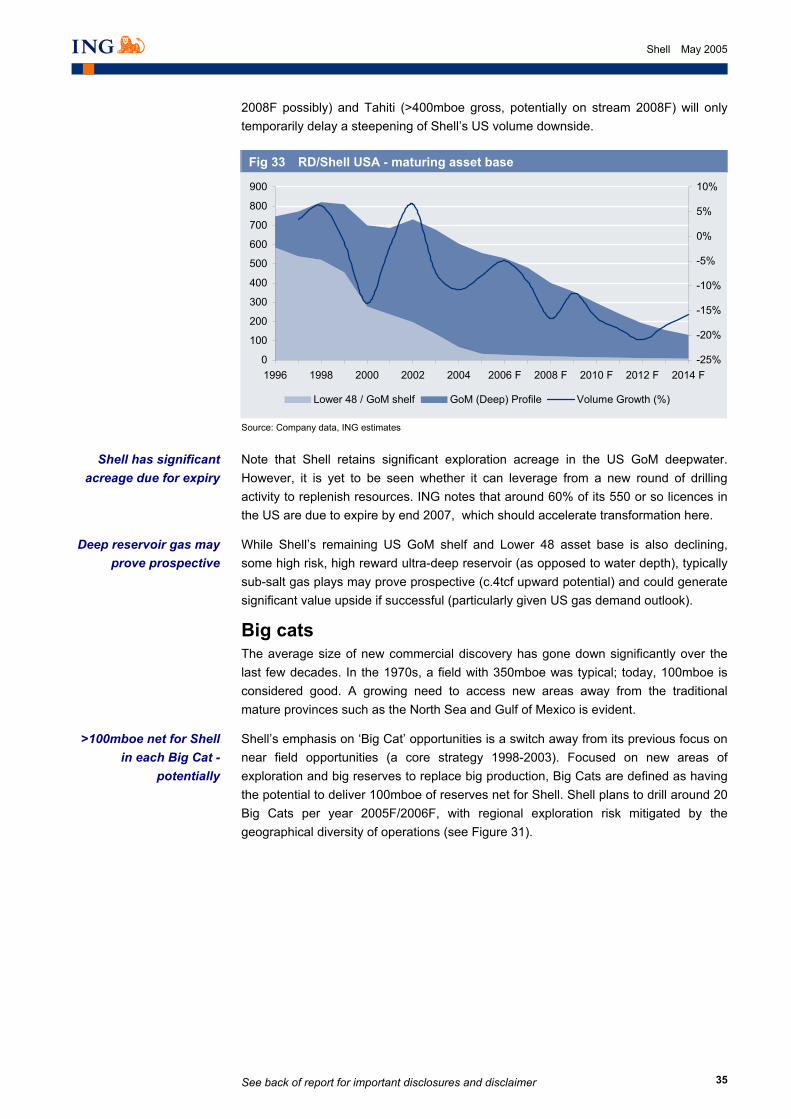
See back of report for important disclosures and disclaimer
35
Shell May 2005
2008F possibly) and Tahiti (>400mboe gross, potentially on stream 2008F) will only temporarily delay a steepening of Shell’s US volume downside.
Fig 33 RD/Shell USA - maturing asset base
0
100
200
300
400
500
600
700
800
900
1996 1998 2000 2002 2004 2006 F 2008 F 2010 F 2012 F 2014 F-25%
-20%
-15%
-10%
-5%
0%
5%
10%
Lower 48 / GoM shelf GoM (Deep) Profile Volume Growth (%)
Source: Company data, ING estimates
_
Note that Shell retains significant exploration acreage in the US GoM deepwater. However, it is yet to be seen whether it can leverage from a new round of drilling activity to replenish resources. ING notes that around 60% of its 550 or so licences in the US are due to expire by end 2007, which should accelerate transformation here.
While Shell’s remaining US GoM shelf and Lower 48 asset base is also declining, some high risk, high reward ultra-deep reservoir (as opposed to water depth), typically sub-salt gas plays may prove prospective (c.4tcf upward potential) and could generate significant value upside if successful (particularly given US gas demand outlook).
Big cats The average size of new commercial discovery has gone down significantly over the last few decades. In the 1970s, a field with 350mboe was typical; today, 100mboe is considered good. A growing need to access new areas away from the traditional mature provinces such as the North Sea and Gulf of Mexico is evident.
Shell’s emphasis on ‘Big Cat’ opportunities is a switch away from its previous focus on near field opportunities (a core strategy 1998-2003). Focused on new areas of exploration and big reserves to replace big production, Big Cats are defined as having the potential to deliver 100mboe of reserves net for Shell. Shell plans to drill around 20 Big Cats per year 2005F/2006F, with regional exploration risk mitigated by the geographical diversity of operations (see Figure 31).
Shell has significant acreage due for expiry
Deep reservoir gas may prove prospective
>100mboe net for Shell in each Big Cat -
potentially
See back of report for important disclosures and disclaimer
36
Shell May 2005
Fig 34 Planned big cats in 2005/06
2005 2006
US Deepwater GoM 5 5Norway 2 3Denmark 1 -UK 1 2Brunei 1 1Malaysia 1 3Egypt 2 -Nigeria 4 2Brazil 2 3Total 19 19
Source: Shell. Note that in Norway, the Onyx SW well was declared a significant discovery May 23 2005 (Shell 30%, with recoverable reserves of 2.1tcf gas)
_
Shell plans to spend some US$1.5bn/year on exploration 2005F/2006F. This is US$300m higher than its previous annual commitment, and is significantly higher than the exploration budgets of BP or ExxonMobil. However, in order to re-invigorate its upstream opportunity set, this is deemed very necessary. As part of Shell’s drive to improve its success, it is also in the process of hiring 1,000 engineers to bolster its geological, geophysics and reservoir capabilities, all crucial to the exploration effort.
In 2003, Shell made a number of significant finds including US GoM (Deimos), Kazakhstan (Aktote, Kashagan SW, Kairan), Nigeria (Bonga NW), Malaysia (Gumusut), and Egypt (Kg45). We estimate net reserves from around 26 commercial potentially commercial discoveries in 2003 at 430mboe.
In 2004, some 15 commercial finds and potentially commercial discoveries including US GoM (Cheyenne and Coulomb North), Egypt (La 52) and Malaysia (Malikai) are considered to have yielded some 280mboe net reserves for Shell.
In 2005 – the Onyx gas find in Norway (c.2.1tcf gross (370mboe) or 111mboe net) announced 23 May is the most significant discovery for Shell year to date. The company has also had continued success in Malaysia.
Modest success of late, but recent Onyx find a
boost (May 2005)
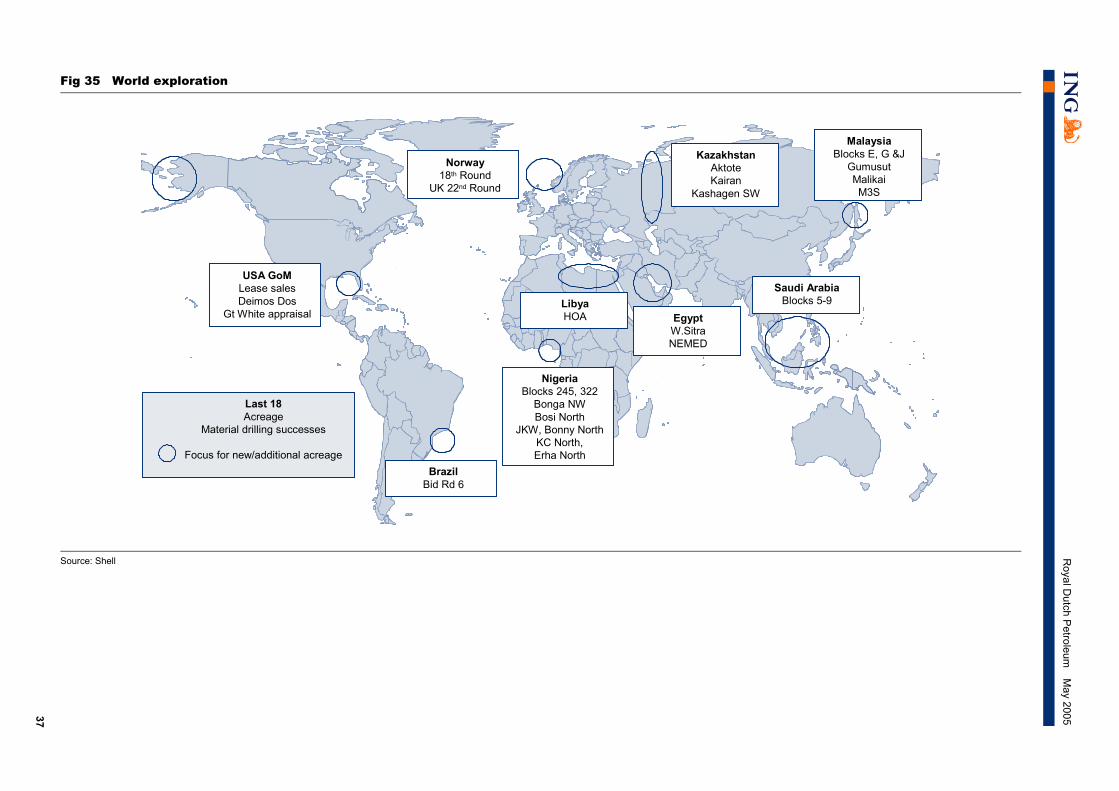
37
Royal D
utch Petroleum
May 2005
Fig 35 World exploration
USA GoMLease salesDeimos Dos
Gt White appraisal
BrazilBid Rd 6
Norway18th Round
UK 22nd Round
NigeriaBlocks 245, 322
Bonga NWBosi North
JKW, Bonny NorthKC North,Erha North
LibyaHOA Egypt
W.SitraNEMED
Saudi ArabiaBlocks 5-9
MalaysiaBlocks E, G &J
GumusutMalikaiM3S
KazakhstanAktoteKairan
Kashagen SW
Last 18Acreage
Material drilling successes
Focus for new/additional acreage
Source: Shell
_
See back of report for important disclosures and disclaimer
38
Shell May 2005
M&A and divestments While not really a stated strategy under the current robust oil macro, Shell could opt to boost its underlying low level production volume growth through acquisitions. The problem with this type of approach is that it would not solve its underlying ‘organic’ reserves problem; there are usually peripheral assets involved with corporate approaches; and the risk of overpaying is very real given: a) the competition for access to reserves; and b) the current high oil prices.
Shell has made efforts to become more aggressive in the deployment of its M&A strategy due in part to changes in senior management and pressure from reserve replacement numbers. However, in the recent past much of the focus has been on consolidating its current asset base globally, for example the acquisition of Fletcher Challenge Energy in 2000 consolidated its New Zealand base; the blocked hostile bid for Woodside Petroleum 2001 would have facilitated consolidation in Australian LNG, and the failed bid for Barrett Resources would have enabled Shell to increase its US gas exposure (this was thwarted by Williams). Even the acquisition of Enterprise Oil in 2001 (at a 45% premium to Enterprise’s share price at the time) was driven by consolidation upsides in the UK, Norway and Gulf of Mexico.
Over the last four years, Shell has divested some US$3.5bn of upstream assets and has suggested that a further US$4bn of divestments is possible by end 2006F including potential withdrawals from certain peripheral countries such as Argentina or Gabon. In summary, the continued divestment programme has helped underpin Shell’s sound financial strength.
Moreover, it has also raised the spectre of a “war chest” ie, a sizeable fund for future M&A ammunition. With gearing of 16% in 1Q05, some 4% below the 20-25% gearing range and strong cash flow enabling massive excess cash (even after supporting share buybacks, dividends and capex), Shell actually has a US$20bn war chest if opportunities arise.
We maintain our belief that while a slide rule has probably been run over BG by Shell, the operational focus of BG is not something that Shell needs currently, or going forward. Assets in South America and the UK are not necessary for Shell’s portfolio – albeit access to the US gas market for international supply could be attractive enough to offset this. Overall though, the traditional upstream values that Shell is striving for in its own business (new material oil, upstream gas reserves in the US (probably only gained through exploration in ultra deep reservoir shelf region) and full value chain integrated gas projects (with upstream reserves access) are not really in play with the midstream-focused BG. Indeed, Shell has potentially better opportunities elsewhere.
A more likely candidate for acquisition is potentially a company like Suncor (Market capitalisation US$16.6bn) where significant overlap and integration potential exists. Suncor is essentially a mini-Shell Canada with upside in unconventional oil sands projects located near Fort McMurray in Alberta. Suncor also has a strong gas position in Western Canada, and a retail presence in Ontario where it refines crude oil and markets a range of petroleum and petrochemical products, primarily under the Sunoco brand. In the United States, Suncor’s downstream assets include a Denver-based refinery, crude oil pipeline systems and 43 retail stations branded as Phillips 66.
One downside of Suncor could be that with a current PER of 21x and Suncor’s stock having risen 35% over the last year, Shell could be faced with a high possibility of overpaying for the company if it were to progress such a deal.
Suncor could be a better candidate than BG
Shell has a significant war chest
M&A would solve production growth but
not organic reserves
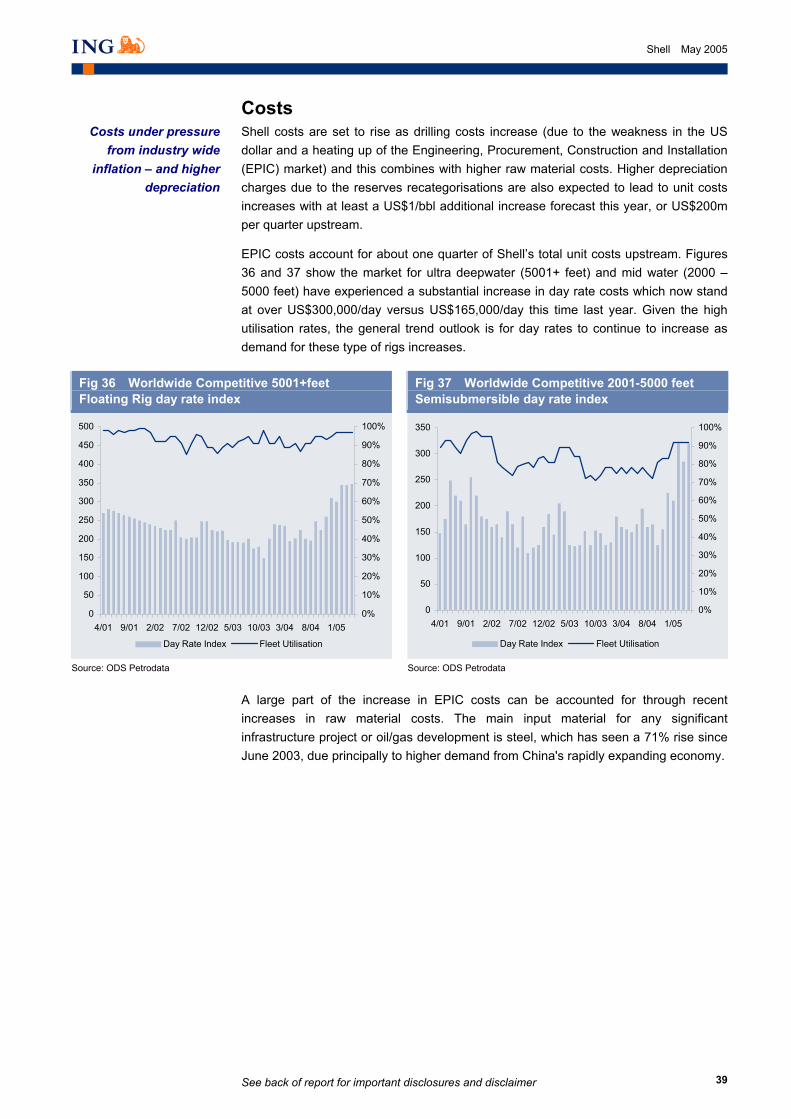
See back of report for important disclosures and disclaimer
39
Shell May 2005
Costs Shell costs are set to rise as drilling costs increase (due to the weakness in the US dollar and a heating up of the Engineering, Procurement, Construction and Installation (EPIC) market) and this combines with higher raw material costs. Higher depreciation charges due to the reserves recategorisations are also expected to lead to unit costs increases with at least a US$1/bbl additional increase forecast this year, or US$200m per quarter upstream.
EPIC costs account for about one quarter of Shell’s total unit costs upstream. Figures 36 and 37 show the market for ultra deepwater (5001+ feet) and mid water (2000 – 5000 feet) have experienced a substantial increase in day rate costs which now stand at over US$300,000/day versus US$165,000/day this time last year. Given the high utilisation rates, the general trend outlook is for day rates to continue to increase as demand for these type of rigs increases.
Fig 36 Worldwide Competitive 5001+feet Floating Rig day rate index
Fig 37 Worldwide Competitive 2001-5000 feet Semisubmersible day rate index
0
50
100
150
200
250
300
350
400
450
500
4/01 9/01 2/02 7/02 12/02 5/03 10/03 3/04 8/04 1/050%
10%
20%
30%
40%
50%
60%
70%
80%
90%
100%
Day Rate Index Fleet Utilisation
0
50
100
150
200
250
300
350
4/01 9/01 2/02 7/02 12/02 5/03 10/03 3/04 8/04 1/050%
10%
20%
30%
40%
50%
60%
70%
80%
90%
100%
Day Rate Index Fleet Utilisation
Source: ODS Petrodata Source: ODS Petrodata
_
A large part of the increase in EPIC costs can be accounted for through recent increases in raw material costs. The main input material for any significant infrastructure project or oil/gas development is steel, which has seen a 71% rise since June 2003, due principally to higher demand from China's rapidly expanding economy.
Costs under pressure from industry wide
inflation – and higher depreciation
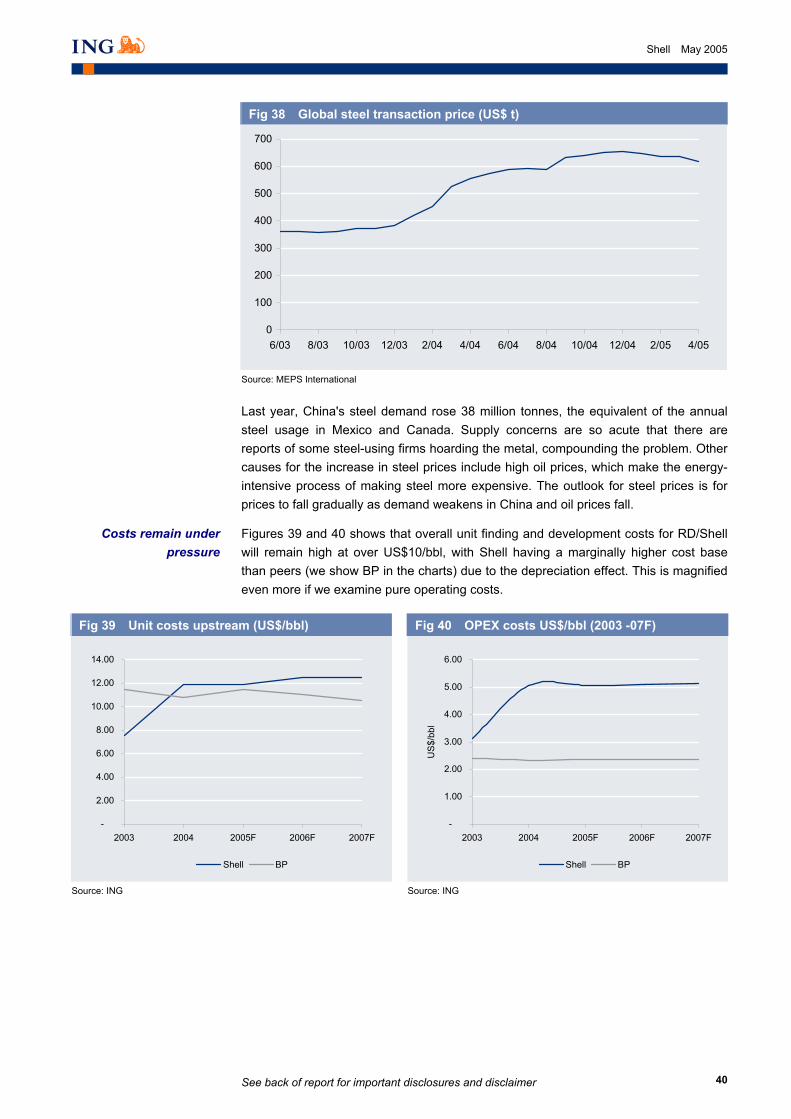
See back of report for important disclosures and disclaimer
40
Shell May 2005
Fig 38 Global steel transaction price (US$ t)
0
100
200
300
400
500
600
700
6/03 8/03 10/03 12/03 2/04 4/04 6/04 8/04 10/04 12/04 2/05 4/05
Source: MEPS International
_
Last year, China's steel demand rose 38 million tonnes, the equivalent of the annual steel usage in Mexico and Canada. Supply concerns are so acute that there are reports of some steel-using firms hoarding the metal, compounding the problem. Other causes for the increase in steel prices include high oil prices, which make the energy-intensive process of making steel more expensive. The outlook for steel prices is for prices to fall gradually as demand weakens in China and oil prices fall.
Figures 39 and 40 shows that overall unit finding and development costs for RD/Shell will remain high at over US$10/bbl, with Shell having a marginally higher cost base than peers (we show BP in the charts) due to the depreciation effect. This is magnified even more if we examine pure operating costs.
Fig 39 Unit costs upstream (US$/bbl)
Fig 40 OPEX costs US$/bbl (2003 -07F)
-
2.00
4.00
6.00
8.00
10.00
12.00
14.00
2003 2004 2005F 2006F 2007F
Shell BP
-
1.00
2.00
3.00
4.00
5.00
6.00
2003 2004 2005F 2006F 2007F
US
$/bb
l
Shell BP
Source: ING Source: ING
_
Costs remain under pressure
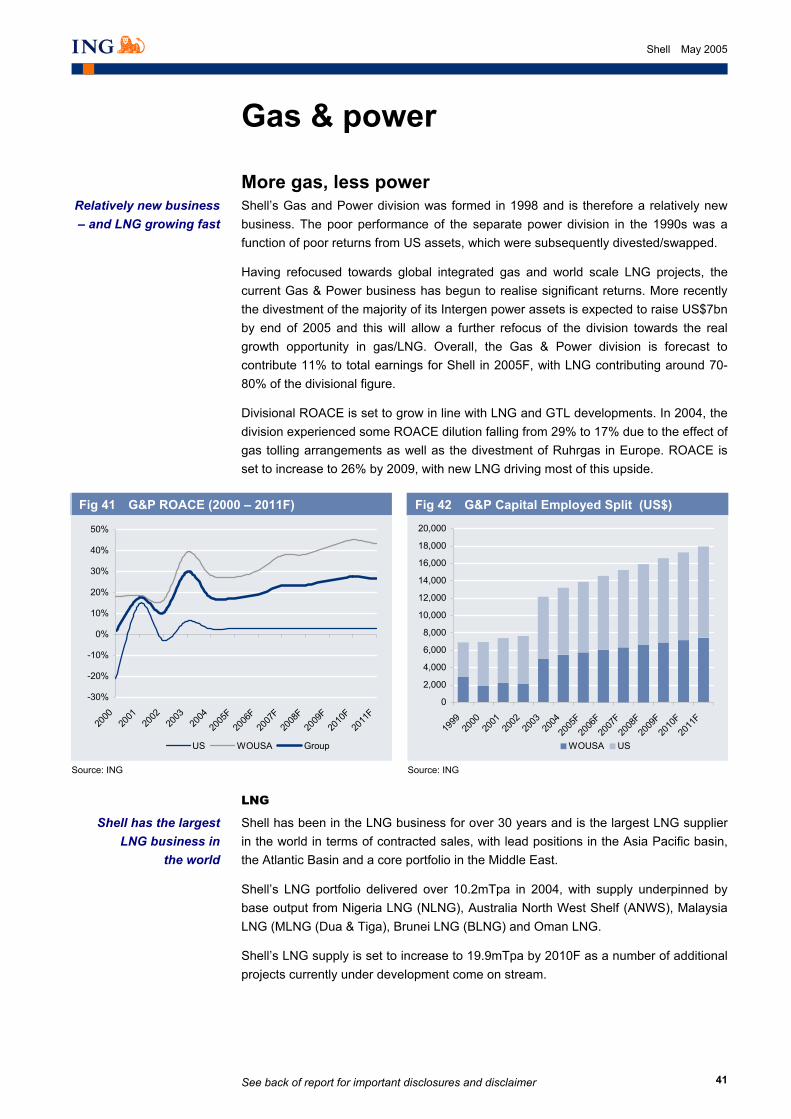
See back of report for important disclosures and disclaimer
41
Shell May 2005
Gas & power
More gas, less power Shell’s Gas and Power division was formed in 1998 and is therefore a relatively new business. The poor performance of the separate power division in the 1990s was a function of poor returns from US assets, which were subsequently divested/swapped.
Having refocused towards global integrated gas and world scale LNG projects, the current Gas & Power business has begun to realise significant returns. More recently the divestment of the majority of its Intergen power assets is expected to raise US$7bn by end of 2005 and this will allow a further refocus of the division towards the real growth opportunity in gas/LNG. Overall, the Gas & Power division is forecast to contribute 11% to total earnings for Shell in 2005F, with LNG contributing around 70-80% of the divisional figure.
Divisional ROACE is set to grow in line with LNG and GTL developments. In 2004, the division experienced some ROACE dilution falling from 29% to 17% due to the effect of gas tolling arrangements as well as the divestment of Ruhrgas in Europe. ROACE is set to increase to 26% by 2009, with new LNG driving most of this upside.
Fig 41 G&P ROACE (2000 – 2011F)
Fig 42 G&P Capital Employed Split (US$)
-30%
-20%
-10%
0%
10%
20%
30%
40%
50%
2000
2001
2002
2003
2004
2005
F20
06F
2007
F20
08F
2009
F20
10F
2011
F
US WOUSA Group
0
2,000
4,000
6,000
8,000
10,000
12,000
14,000
16,000
18,000
20,000
1999
2000
2001
2002
2003
2004
2005
F20
06F
2007
F20
08F
2009
F20
10F
2011
F
WOUSA US
Source: ING Source: ING
_
LNG
Shell has been in the LNG business for over 30 years and is the largest LNG supplier in the world in terms of contracted sales, with lead positions in the Asia Pacific basin, the Atlantic Basin and a core portfolio in the Middle East.
Shell’s LNG portfolio delivered over 10.2mTpa in 2004, with supply underpinned by base output from Nigeria LNG (NLNG), Australia North West Shelf (ANWS), Malaysia LNG (MLNG (Dua & Tiga), Brunei LNG (BLNG) and Oman LNG.
Shell’s LNG supply is set to increase to 19.9mTpa by 2010F as a number of additional projects currently under development come on stream.
Relatively new business – and LNG growing fast
Shell has the largest LNG business in
the world
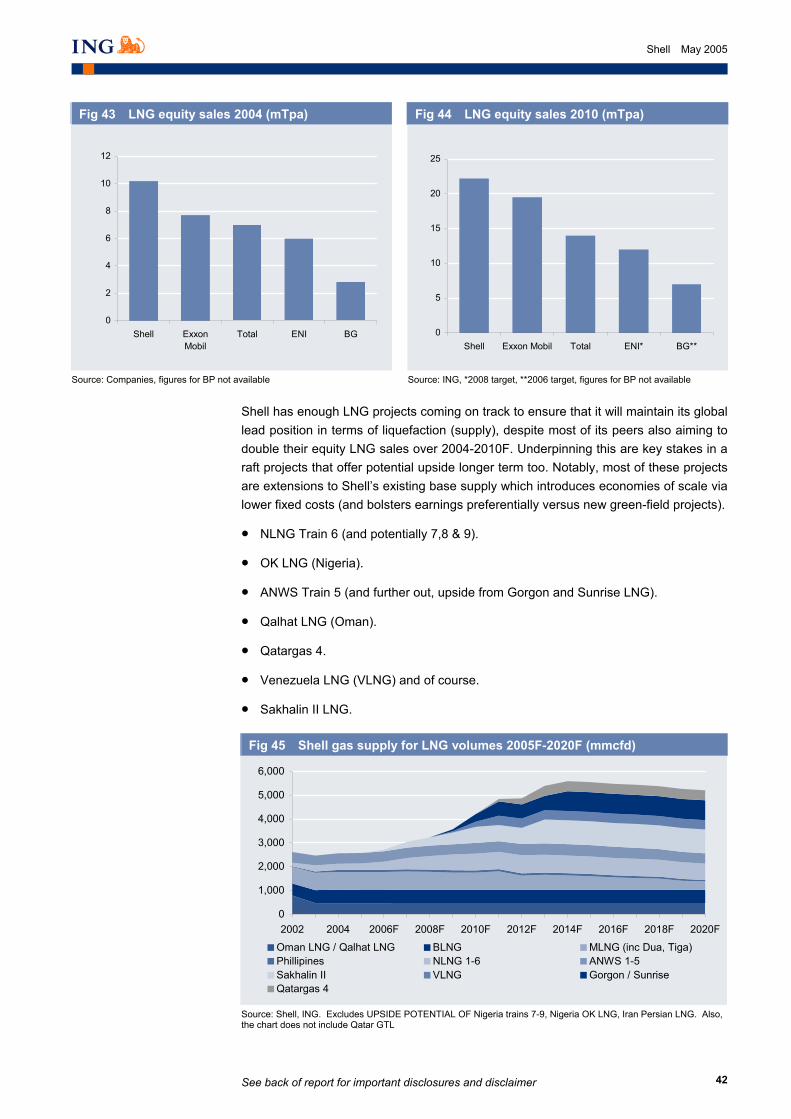
See back of report for important disclosures and disclaimer
42
Shell May 2005
Fig 43 LNG equity sales 2004 (mTpa)
Fig 44 LNG equity sales 2010 (mTpa)
0
2
4
6
8
10
12
Shell ExxonMobil
Total ENI BG
0
5
10
15
20
25
Shell Exxon Mobil Total ENI* BG**
Source: Companies, figures for BP not available Source: ING, *2008 target, **2006 target, figures for BP not available
of if earnings in Gas & Power from LNG operations.
Shell has enough LNG projects coming on track to ensure that it will maintain its global lead position in terms of liquefaction (supply), despite most of its peers also aiming to double their equity LNG sales over 2004-2010F. Underpinning this are key stakes in a raft projects that offer potential upside longer term too. Notably, most of these projects are extensions to Shell’s existing base supply which introduces economies of scale via lower fixed costs (and bolsters earnings preferentially versus new green-field projects).
• NLNG Train 6 (and potentially 7,8 & 9).
• OK LNG (Nigeria).
• ANWS Train 5 (and further out, upside from Gorgon and Sunrise LNG).
• Qalhat LNG (Oman).
• Qatargas 4.
• Venezuela LNG (VLNG) and of course.
• Sakhalin II LNG.
Fig 45 Shell gas supply for LNG volumes 2005F-2020F (mmcfd)
0
1,000
2,000
3,000
4,000
5,000
6,000
2002 2004 2006F 2008F 2010F 2012F 2014F 2016F 2018F 2020F
Oman LNG / Qalhat LNG BLNG MLNG (inc Dua, Tiga)Phillipines NLNG 1-6 ANWS 1-5Sakhalin II VLNG Gorgon / SunriseQatargas 4
Source: Shell, ING. Excludes UPSIDE POTENTIAL OF Nigeria trains 7-9, Nigeria OK LNG, Iran Persian LNG. Also, the chart does not include Qatar GTL
_
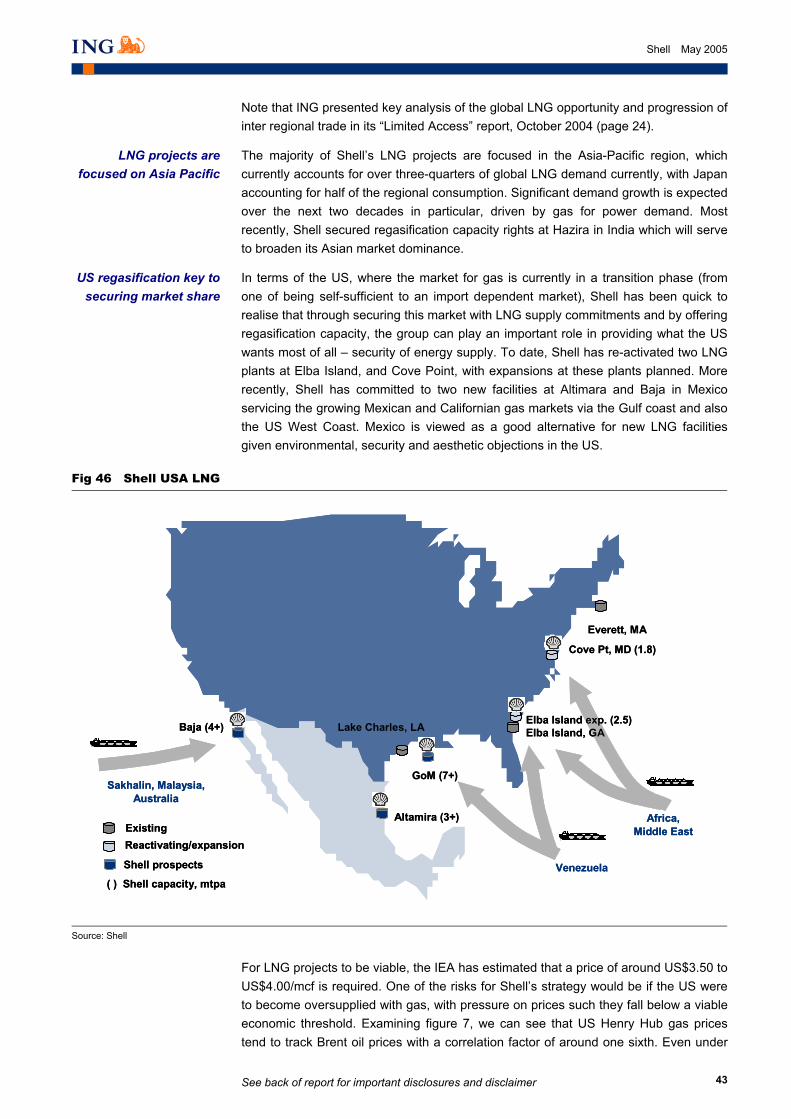
See back of report for important disclosures and disclaimer
43
Shell May 2005
Note that ING presented key analysis of the global LNG opportunity and progression of inter regional trade in its “Limited Access” report, October 2004 (page 24).
The majority of Shell’s LNG projects are focused in the Asia-Pacific region, which currently accounts for over three-quarters of global LNG demand currently, with Japan accounting for half of the regional consumption. Significant demand growth is expected over the next two decades in particular, driven by gas for power demand. Most recently, Shell secured regasification capacity rights at Hazira in India which will serve to broaden its Asian market dominance.
In terms of the US, where the market for gas is currently in a transition phase (from one of being self-sufficient to an import dependent market), Shell has been quick to realise that through securing this market with LNG supply commitments and by offering regasification capacity, the group can play an important role in providing what the US wants most of all – security of energy supply. To date, Shell has re-activated two LNG plants at Elba Island, and Cove Point, with expansions at these plants planned. More recently, Shell has committed to two new facilities at Altimara and Baja in Mexico servicing the growing Mexican and Californian gas markets via the Gulf coast and also the US West Coast. Mexico is viewed as a good alternative for new LNG facilities given environmental, security and aesthetic objections in the US.
Fig 46 Shell USA LNG
Shell prospects
Everett, MA
Lake Charles, LA
ExistingReactivating/expansion
Sakhalin, Malaysia, Australia
Venezuela
Africa, Middle East
Cove Pt, MD (1.8)
Baja (4+)
Altamira (3+)
GoM (7+)
Elba Island exp. (2.5) Elba Island, GA
( ) Shell capacity, mtpa
Shell prospects
Everett, MA
Lake Charles, LA
ExistingReactivating/expansion
Sakhalin, Malaysia, Australia
Venezuela
Africa, Middle East
Cove Pt, MD (1.8)
Baja (4+)
Altamira (3+)
GoM (7+)
Elba Island exp. (2.5) Elba Island, GA
( ) Shell capacity, mtpa
Source: Shell
_
For LNG projects to be viable, the IEA has estimated that a price of around US$3.50 to US$4.00/mcf is required. One of the risks for Shell’s strategy would be if the US were to become oversupplied with gas, with pressure on prices such they fall below a viable economic threshold. Examining figure 7, we can see that US Henry Hub gas prices tend to track Brent oil prices with a correlation factor of around one sixth. Even under
LNG projects are focused on Asia Pacific
US regasification key to securing market share
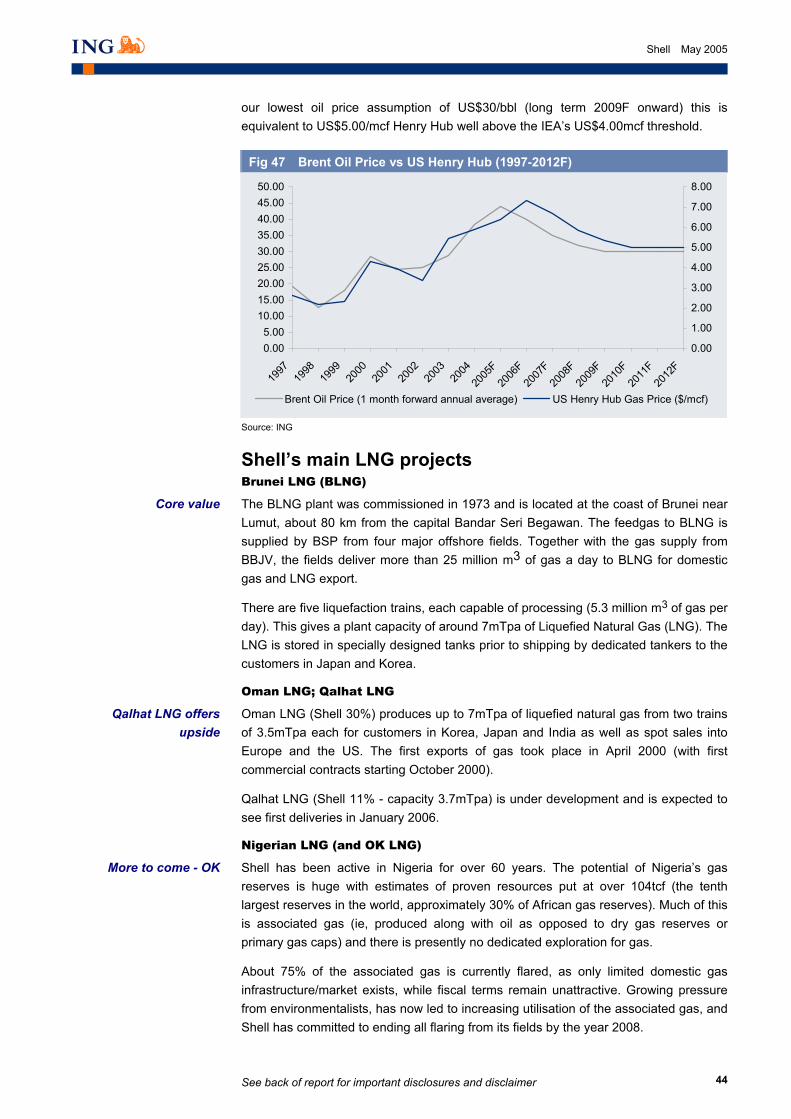
See back of report for important disclosures and disclaimer
44
Shell May 2005
our lowest oil price assumption of US$30/bbl (long term 2009F onward) this is equivalent to US$5.00/mcf Henry Hub well above the IEA’s US$4.00mcf threshold.
Fig 47 Brent Oil Price vs US Henry Hub (1997-2012F)
0.005.00
10.0015.0020.0025.0030.0035.0040.0045.0050.00
1997
1998
1999
2000
2001
2002
2003
2004
2005
F20
06F
2007
F20
08F
2009
F20
10F
2011
F20
12F
0.00
1.00
2.00
3.00
4.00
5.00
6.00
7.00
8.00
Brent Oil Price (1 month forward annual average) US Henry Hub Gas Price ($/mcf)
Source: ING
_
Shell’s main LNG projects Brunei LNG (BLNG)
The BLNG plant was commissioned in 1973 and is located at the coast of Brunei near Lumut, about 80 km from the capital Bandar Seri Begawan. The feedgas to BLNG is supplied by BSP from four major offshore fields. Together with the gas supply from BBJV, the fields deliver more than 25 million m3 of gas a day to BLNG for domestic gas and LNG export.
There are five liquefaction trains, each capable of processing (5.3 million m3 of gas per day). This gives a plant capacity of around 7mTpa of Liquefied Natural Gas (LNG). The LNG is stored in specially designed tanks prior to shipping by dedicated tankers to the customers in Japan and Korea.
Oman LNG; Qalhat LNG
Oman LNG (Shell 30%) produces up to 7mTpa of liquefied natural gas from two trains of 3.5mTpa each for customers in Korea, Japan and India as well as spot sales into Europe and the US. The first exports of gas took place in April 2000 (with first commercial contracts starting October 2000).
Qalhat LNG (Shell 11% - capacity 3.7mTpa) is under development and is expected to see first deliveries in January 2006.
Nigerian LNG (and OK LNG)
Shell has been active in Nigeria for over 60 years. The potential of Nigeria’s gas reserves is huge with estimates of proven resources put at over 104tcf (the tenth largest reserves in the world, approximately 30% of African gas reserves). Much of this is associated gas (ie, produced along with oil as opposed to dry gas reserves or primary gas caps) and there is presently no dedicated exploration for gas.
About 75% of the associated gas is currently flared, as only limited domestic gas infrastructure/market exists, while fiscal terms remain unattractive. Growing pressure from environmentalists, has now led to increasing utilisation of the associated gas, and Shell has committed to ending all flaring from its fields by the year 2008.
Core value
Qalhat LNG offers upside
More to come - OK
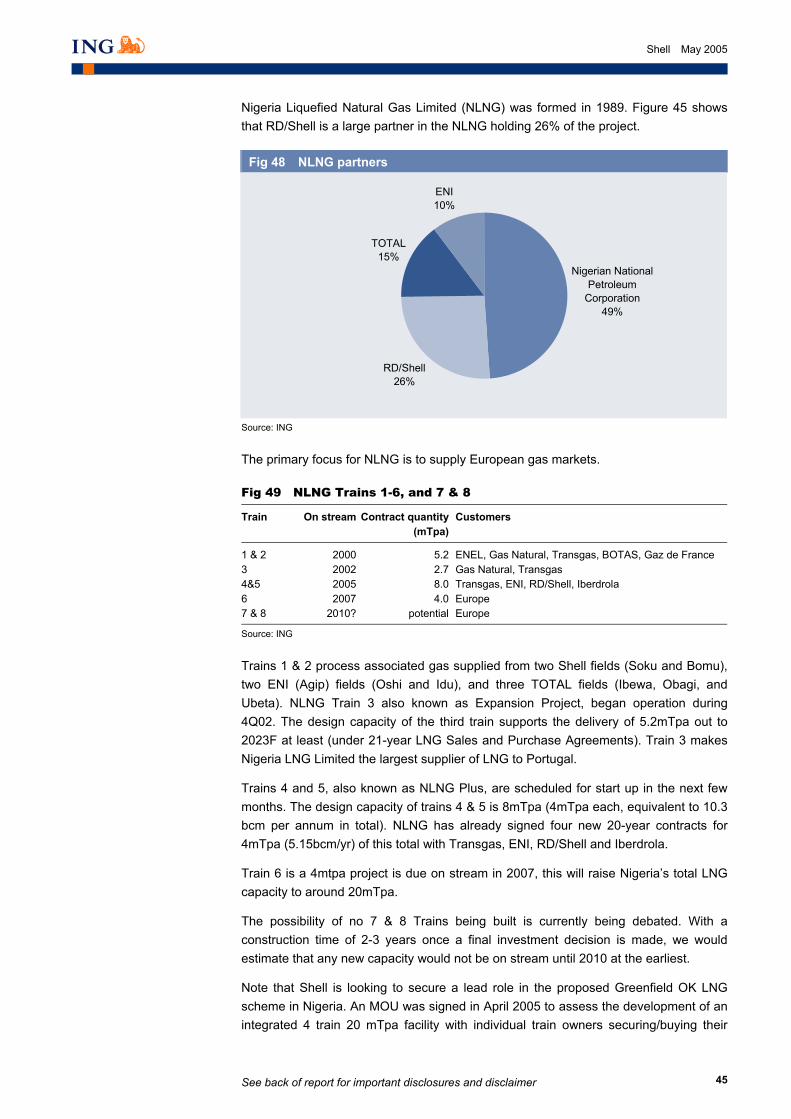
See back of report for important disclosures and disclaimer
45
Shell May 2005
Nigeria Liquefied Natural Gas Limited (NLNG) was formed in 1989. Figure 45 shows that RD/Shell is a large partner in the NLNG holding 26% of the project.
Fig 48 NLNG partners
Nigerian National Petroleum
Corporation49%
RD/Shell26%
TOTAL15%
ENI10%
Source: ING
_
The primary focus for NLNG is to supply European gas markets.
Fig 49 NLNG Trains 1-6, and 7 & 8
Train On stream Contract quantity (mTpa)
Customers
1 & 2 2000 5.2 ENEL, Gas Natural, Transgas, BOTAS, Gaz de France 3 2002 2.7 Gas Natural, Transgas 4&5 2005 8.0 Transgas, ENI, RD/Shell, Iberdrola 6 2007 4.0 Europe 7 & 8 2010? potential Europe
Source: ING
_
Trains 1 & 2 process associated gas supplied from two Shell fields (Soku and Bomu), two ENI (Agip) fields (Oshi and Idu), and three TOTAL fields (Ibewa, Obagi, and Ubeta). NLNG Train 3 also known as Expansion Project, began operation during 4Q02. The design capacity of the third train supports the delivery of 5.2mTpa out to 2023F at least (under 21-year LNG Sales and Purchase Agreements). Train 3 makes Nigeria LNG Limited the largest supplier of LNG to Portugal.
Trains 4 and 5, also known as NLNG Plus, are scheduled for start up in the next few months. The design capacity of trains 4 & 5 is 8mTpa (4mTpa each, equivalent to 10.3 bcm per annum in total). NLNG has already signed four new 20-year contracts for 4mTpa (5.15bcm/yr) of this total with Transgas, ENI, RD/Shell and Iberdrola.
Train 6 is a 4mtpa project is due on stream in 2007, this will raise Nigeria’s total LNG capacity to around 20mTpa.
The possibility of no 7 & 8 Trains being built is currently being debated. With a construction time of 2-3 years once a final investment decision is made, we would estimate that any new capacity would not be on stream until 2010 at the earliest.
Note that Shell is looking to secure a lead role in the proposed Greenfield OK LNG scheme in Nigeria. An MOU was signed in April 2005 to assess the development of an integrated 4 train 20 mTpa facility with individual train owners securing/buying their
See back of report for important disclosures and disclaimer
46
Shell May 2005
own feed gas and selling their own LNG. The other parties include Chevron, NNPC and BG. The project could well be on stream by the end of the decade.
Malaysia LNG
The majority of Shell’s asset value in Malaysia stems from the Bintulu LNG facility and associated gas supply contracts. Significant deepwater exploration success has also provided a major boost for its portfolio too.
Bintulu is the world’s largest LNG site with a capacity of 23mTpa. Three LNG trains (MLNG , Dua, and Tiga – in which Shell retains a 15% stake in the latter two) generate significant profits given the particular low feed gas supply cost. Shell has 50% interest in the feed gas for the MLNG Dua facilities and a 37.5% stake in the feed gas for MLNG Tiga which combined require 840mmcfd net production.
Australia NWS & Gorgon, Sunrise
The Australia North West Shelf project is core value for Shell (operator with 16.67% (albeit Shell also has a 34% stake in ANWS partner Woodside and indirectly therefore has a larger exposure to the assets). Produced gas is piped to the domestic market in Perth or converted to LNG for export. The LNG plant currently has 4 trains with a fifth planned. The 11.7mTpa total capacity is all contracted to Japanese buyers and also with some excess production also sold on the spot markets (Korea).
Contract renewals and extensions are crucial for ANWS, with 2009 expecting to see some 8mTpa of sales contracts expire. While these should be rolled over with existing buyers, margins will undoubtedly be under pressure. From 2005, ANWS will initiate supply to China’s Guangdong province (3.3mTpa) for 25 years. Confirmation of the contract will underpin the development of Train 5 which is expected on stream 2009 (interim supply will come form Trains 1-4).
Note that the recently unitised Greater Gorgon Area (>50 tcf of recoverable gas – Shell 25%) could supply a new twin 5mTpa train plant on Barrow Island with first deliveries 2010F possible. A final investment decision is expected mid-2006. Shell announced in March 2005 that it would take a dedicated 2.5mTpa of LNG from Gorgon for its Costa Azul regas facility at Baja, Mexico (where it owns 50% of a new facility being constructed with partner Sempra Energy). Chevro also has an MoU to take 2mTpa from Gorgon and the Chinese and Korean are keen to take supply too.
In addition, the Greater Sunrise area also offers Australian LNG upside potential for Shell. With gross reserves of >20tcf recoverable gas, a significant project could be developed with first gas by 2015 F. Currently, negotiations are in limbo given disputes over maritime boundaries with East Timor and also the various development options and windows of opportunity for gas contracts.
Qatar LNG
In February 2005, Shell signed a Heads of Agreement to develop a large-scale LNG project called Qatargas 4. The integrated development will use a single 7.8mTpa LNG train (one of the largest in the world) which will require some 1.4bcfd of gas (420mmcfd net Shell). The initial project is for 25 years. Shell has a 30% stake in the project with JV partner Qatar Petroleum holding 70%. LNG deliveries are expected to commence in 2010/2012 targeting the US and European markets.
World’s largest LNG facility
Aussie capacity to increase
Gorgon truly giant
Key new project
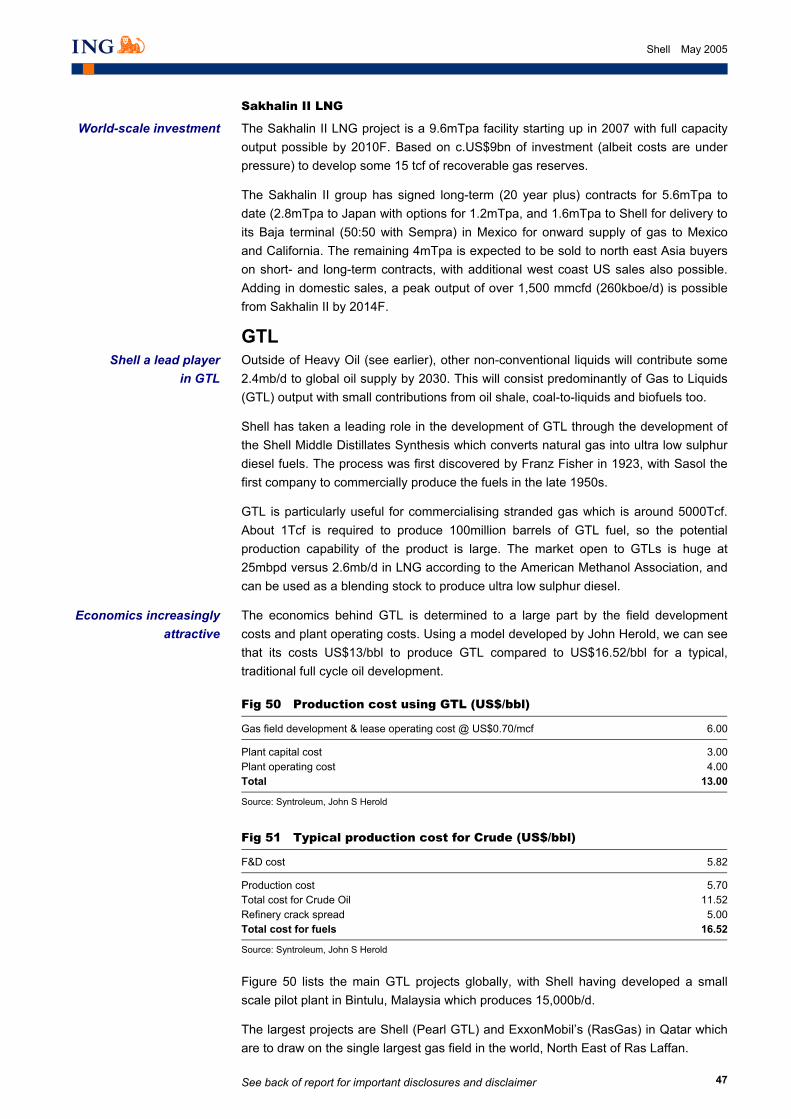
See back of report for important disclosures and disclaimer
47
Shell May 2005
Sakhalin II LNG
The Sakhalin II LNG project is a 9.6mTpa facility starting up in 2007 with full capacity output possible by 2010F. Based on c.US$9bn of investment (albeit costs are under pressure) to develop some 15 tcf of recoverable gas reserves.
The Sakhalin II group has signed long-term (20 year plus) contracts for 5.6mTpa to date (2.8mTpa to Japan with options for 1.2mTpa, and 1.6mTpa to Shell for delivery to its Baja terminal (50:50 with Sempra) in Mexico for onward supply of gas to Mexico and California. The remaining 4mTpa is expected to be sold to north east Asia buyers on short- and long-term contracts, with additional west coast US sales also possible. Adding in domestic sales, a peak output of over 1,500 mmcfd (260kboe/d) is possible from Sakhalin II by 2014F.
GTL Outside of Heavy Oil (see earlier), other non-conventional liquids will contribute some 2.4mb/d to global oil supply by 2030. This will consist predominantly of Gas to Liquids (GTL) output with small contributions from oil shale, coal-to-liquids and biofuels too.
Shell has taken a leading role in the development of GTL through the development of the Shell Middle Distillates Synthesis which converts natural gas into ultra low sulphur diesel fuels. The process was first discovered by Franz Fisher in 1923, with Sasol the first company to commercially produce the fuels in the late 1950s.
GTL is particularly useful for commercialising stranded gas which is around 5000Tcf. About 1Tcf is required to produce 100million barrels of GTL fuel, so the potential production capability of the product is large. The market open to GTLs is huge at 25mbpd versus 2.6mb/d in LNG according to the American Methanol Association, and can be used as a blending stock to produce ultra low sulphur diesel.
The economics behind GTL is determined to a large part by the field development costs and plant operating costs. Using a model developed by John Herold, we can see that its costs US$13/bbl to produce GTL compared to US$16.52/bbl for a typical, traditional full cycle oil development.
Fig 50 Production cost using GTL (US$/bbl)
Gas field development & lease operating cost @ US$0.70/mcf 6.00
Plant capital cost 3.00Plant operating cost 4.00Total 13.00
Source: Syntroleum, John S Herold
_
Fig 51 Typical production cost for Crude (US$/bbl)
F&D cost 5.82
Production cost 5.70Total cost for Crude Oil 11.52Refinery crack spread 5.00Total cost for fuels 16.52
Source: Syntroleum, John S Herold
_
Figure 50 lists the main GTL projects globally, with Shell having developed a small scale pilot plant in Bintulu, Malaysia which produces 15,000b/d.
The largest projects are Shell (Pearl GTL) and ExxonMobil’s (RasGas) in Qatar which are to draw on the single largest gas field in the world, North East of Ras Laffan.
World-scale investment
Shell a lead player in GTL
Economics increasingly attractive
See back of report for important disclosures and disclaimer
48
Shell May 2005
Fig 52 GTL plants globally
Company Project Production (bpd) Start-up
Shell Bintulu, Malaysia 15,000 In productionPetro SA Moss Bay, South Africa 20,000 In productionSasol Chevron Texaco North Australia 30-45,000 2005-06Chevron Texaco (75%), NNPC (25%) Escravos, Nigeria 34,000 4Q06Shell, QP Qatar 140,000 2008-09QP & Sasol Chevron Texaco Oryx GTL, Qatar 100,000 2009ExxonMobil, QP Qatar 100,000 UnknownMarathon, QP Qatar 120,000 UnknownRentech Indonesia 16,000 UnknownSyntroleum & Marathon Qatar 90,000 UnknownSyntroleum & Yakutgazprom Eastern Siberia, Russia 13,500 UnknownSyntroleum & Gazprom 12 proposed sites Unknown UnknownConocoPhillips Qatar 160,000 UnknownBP Nikiski, Alaska 300 UnknownConocoPhillips Ponca City, OK, US 400 Unknown
Source: ING
_
Fig 53 GTL – volumes and earnings
-20,00040,00060,00080,000
100,000120,000140,000160,000180,000
2000
2001
2002
2003
2004
2005
F20
06F
2007
F20
08F
2009
F20
10F
2011
F20
12F
-100200300400500600700800900
Total Volumes (bpd) EBIT US$(m)
Source: ING
_
Other non-pipe gas projects
Shell’s approved investment in China’s third coal gasification project (a 50/50 JV with Sinopec), which aims to introduce Shell gasification technology at Sinopec’s fertiliser plants in the Hunan province of China. The JV aims to build coal gasification plants, which use Shell’s technology to convert coal into synthetic gas. The gas is then used as a feedstock for the fertiliser plant owned by Sinopec, replacing naptha-based feedstocks. This should help to reduce production costs.
Long term, these projects could prove rewarding to both parties, enabling China to exploit its vast coal reserves, with minimal environmental impact and securing employment for the country’s large mining labour force. Total demand for gas in China is set to increase by 21% per annum, some 10 times higher than the rest of the world, with demand for gas-based power generation growing by 6% pa.
Demand for gas in China to increase by 21% per year
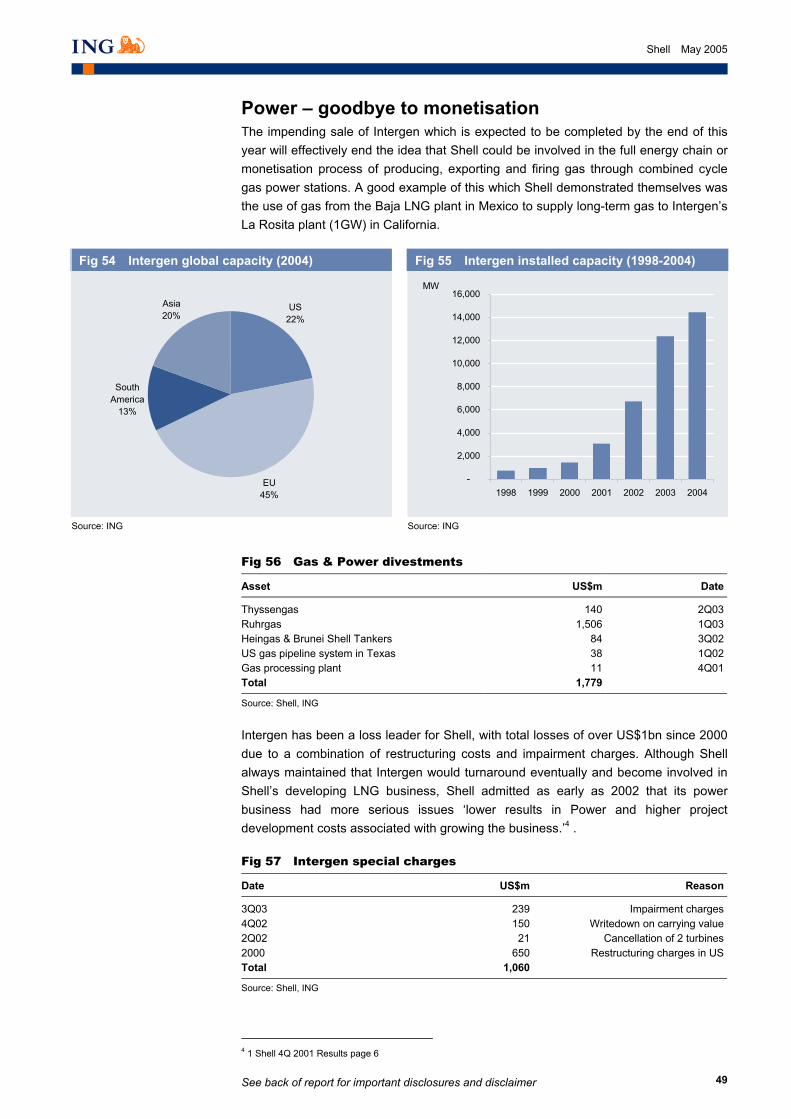
See back of report for important disclosures and disclaimer
49
Shell May 2005
Power – goodbye to monetisation The impending sale of Intergen which is expected to be completed by the end of this year will effectively end the idea that Shell could be involved in the full energy chain or monetisation process of producing, exporting and firing gas through combined cycle gas power stations. A good example of this which Shell demonstrated themselves was the use of gas from the Baja LNG plant in Mexico to supply long-term gas to Intergen’s La Rosita plant (1GW) in California.
Fig 54 Intergen global capacity (2004)
Fig 55 Intergen installed capacity (1998-2004)
US22%
EU45%
South America
13%
Asia20%
-
2,000
4,000
6,000
8,000
10,000
12,000
14,000
16,000
1998 1999 2000 2001 2002 2003 2004
MW
Source: ING Source: ING
_
Fig 56 Gas & Power divestments
Asset US$m Date
Thyssengas 140 2Q03Ruhrgas 1,506 1Q03Heingas & Brunei Shell Tankers 84 3Q02US gas pipeline system in Texas 38 1Q02Gas processing plant 11 4Q01Total 1,779
Source: Shell, ING
_
Intergen has been a loss leader for Shell, with total losses of over US$1bn since 2000 due to a combination of restructuring costs and impairment charges. Although Shell always maintained that Intergen would turnaround eventually and become involved in Shell’s developing LNG business, Shell admitted as early as 2002 that its power business had more serious issues ‘lower results in Power and higher project development costs associated with growing the business.’4 .
Fig 57 Intergen special charges
Date US$m Reason
3Q03 239 Impairment charges4Q02 150 Writedown on carrying value2Q02 21 Cancellation of 2 turbines2000 650 Restructuring charges in USTotal 1,060
Source: Shell, ING
_
4 1 Shell 4Q 2001 Results page 6
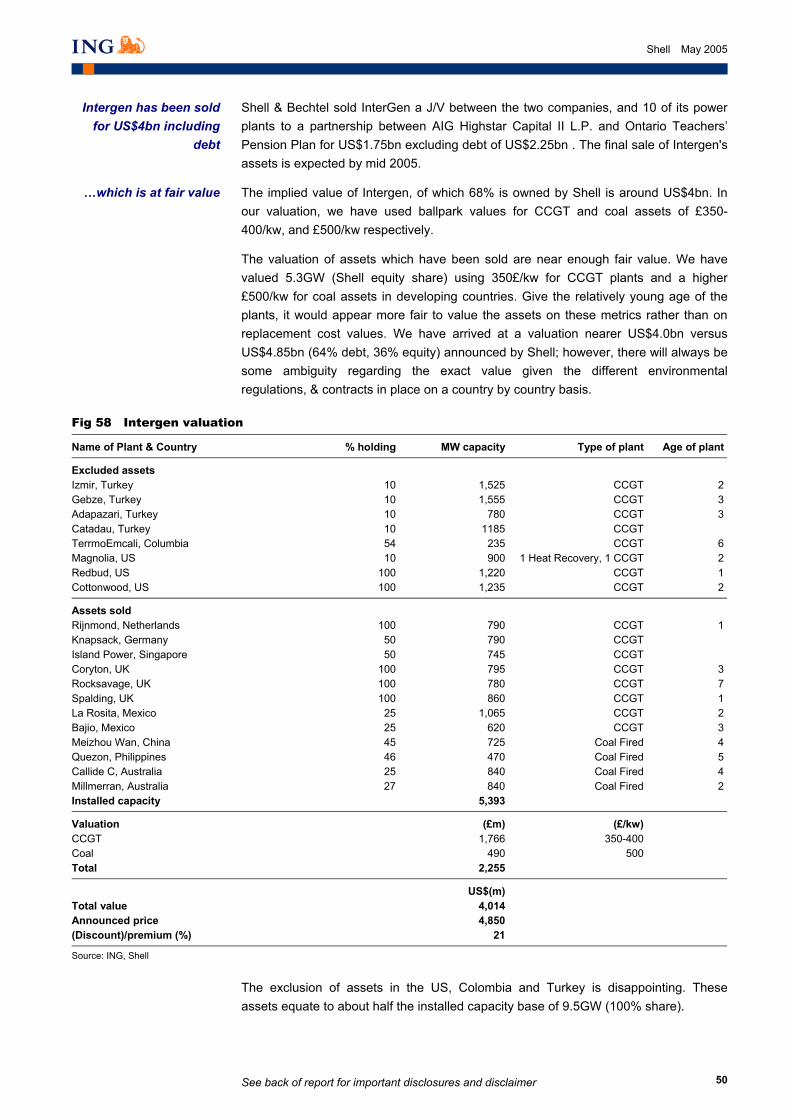
See back of report for important disclosures and disclaimer
50
Shell May 2005
Shell & Bechtel sold InterGen a J/V between the two companies, and 10 of its power plants to a partnership between AIG Highstar Capital II L.P. and Ontario Teachers’ Pension Plan for US$1.75bn excluding debt of US$2.25bn . The final sale of Intergen's assets is expected by mid 2005.
The implied value of Intergen, of which 68% is owned by Shell is around US$4bn. In our valuation, we have used ballpark values for CCGT and coal assets of £350-400/kw, and £500/kw respectively.
The valuation of assets which have been sold are near enough fair value. We have valued 5.3GW (Shell equity share) using 350£/kw for CCGT plants and a higher £500/kw for coal assets in developing countries. Give the relatively young age of the plants, it would appear more fair to value the assets on these metrics rather than on replacement cost values. We have arrived at a valuation nearer US$4.0bn versus US$4.85bn (64% debt, 36% equity) announced by Shell; however, there will always be some ambiguity regarding the exact value given the different environmental regulations, & contracts in place on a country by country basis.
Fig 58 Intergen valuation
Name of Plant & Country % holding MW capacity Type of plant Age of plant
Excluded assets Izmir, Turkey 10 1,525 CCGT 2Gebze, Turkey 10 1,555 CCGT 3Adapazari, Turkey 10 780 CCGT 3Catadau, Turkey 10 1185 CCGT TerrmoEmcali, Columbia 54 235 CCGT 6Magnolia, US 10 900 1 Heat Recovery, 1 CCGT 2Redbud, US 100 1,220 CCGT 1Cottonwood, US 100 1,235 CCGT 2
Assets sold Rijnmond, Netherlands 100 790 CCGT 1Knapsack, Germany 50 790 CCGT Island Power, Singapore 50 745 CCGT Coryton, UK 100 795 CCGT 3Rocksavage, UK 100 780 CCGT 7Spalding, UK 100 860 CCGT 1La Rosita, Mexico 25 1,065 CCGT 2Bajio, Mexico 25 620 CCGT 3Meizhou Wan, China 45 725 Coal Fired 4Quezon, Philippines 46 470 Coal Fired 5Callide C, Australia 25 840 Coal Fired 4Millmerran, Australia 27 840 Coal Fired 2Installed capacity 5,393
Valuation (£m) (£/kw) CCGT 1,766 350-400 Coal 490 500 Total 2,255
US$(m) Total value 4,014 Announced price 4,850 (Discount)/premium (%) 21
Source: ING, Shell
_
The exclusion of assets in the US, Colombia and Turkey is disappointing. These assets equate to about half the installed capacity base of 9.5GW (100% share).
Intergen has been sold for US$4bn including
debt
…which is at fair value
See back of report for important disclosures and disclaimer
51
Shell May 2005
Shell always maintained that low spark spreads in the US were the main reasoning behind the sale of Intergen. With the exclusion of US assets, the market may question the logic of what amounts to an incomplete auction. Shell has claimed that part of the reasoning behind the sale of Intergen is the current poor state of the electricity market in the US where spark spreads have fallen significantly; however, the US only accounts for 22% of Intergen’s capacity, and since Intergen is an independent power producer it is therefore not tied to spark spreads.
We consider the more likely reasoning behind the sale is linked the fact that Shell could utilise the proceeds from any sale to: a) fund its existing share buyback programme; b) plough back into LNG which has faster growth rates versus electricity and higher margins.
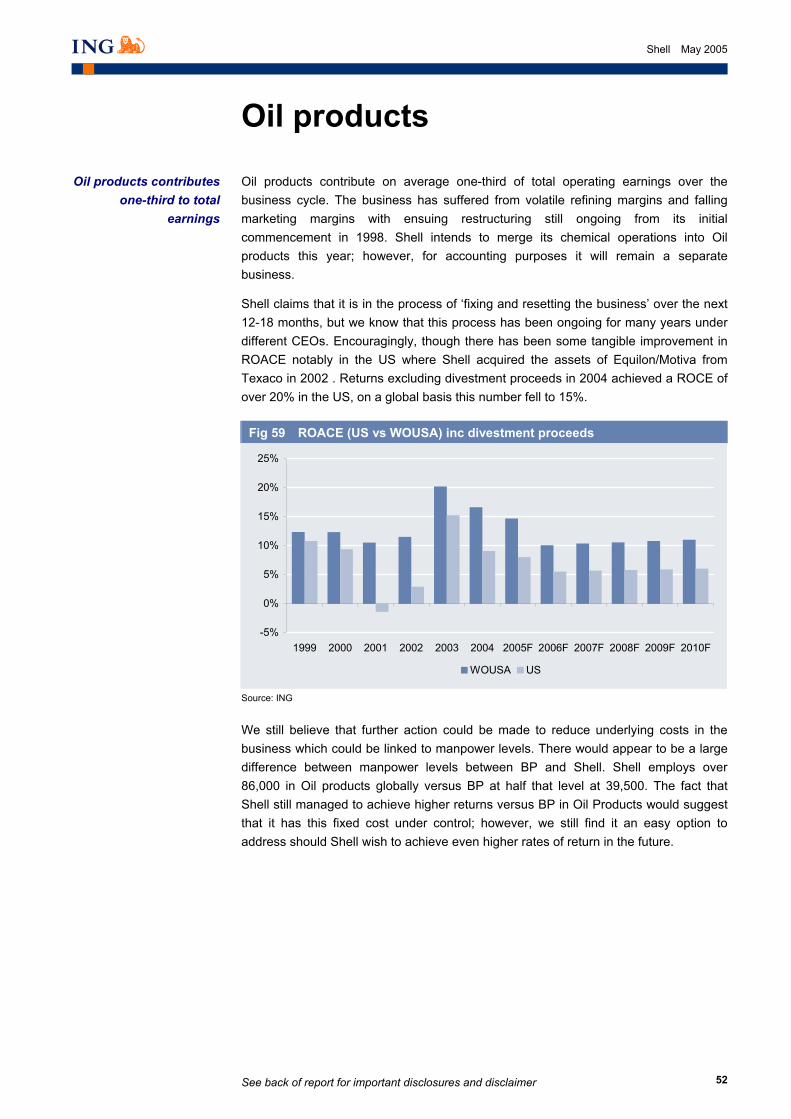
See back of report for important disclosures and disclaimer
52
Shell May 2005
Oil products
Oil products contribute on average one-third of total operating earnings over the business cycle. The business has suffered from volatile refining margins and falling marketing margins with ensuing restructuring still ongoing from its initial commencement in 1998. Shell intends to merge its chemical operations into Oil products this year; however, for accounting purposes it will remain a separate business.
Shell claims that it is in the process of ‘fixing and resetting the business’ over the next 12-18 months, but we know that this process has been ongoing for many years under different CEOs. Encouragingly, though there has been some tangible improvement in ROACE notably in the US where Shell acquired the assets of Equilon/Motiva from Texaco in 2002 . Returns excluding divestment proceeds in 2004 achieved a ROCE of over 20% in the US, on a global basis this number fell to 15%.
Fig 59 ROACE (US vs WOUSA) inc divestment proceeds
-5%
0%
5%
10%
15%
20%
25%
1999 2000 2001 2002 2003 2004 2005F 2006F 2007F 2008F 2009F 2010F
WOUSA US
Source: ING
_
We still believe that further action could be made to reduce underlying costs in the business which could be linked to manpower levels. There would appear to be a large difference between manpower levels between BP and Shell. Shell employs over 86,000 in Oil products globally versus BP at half that level at 39,500. The fact that Shell still managed to achieve higher returns versus BP in Oil Products would suggest that it has this fixed cost under control; however, we still find it an easy option to address should Shell wish to achieve even higher rates of return in the future.
Oil products contributes one-third to total
earnings
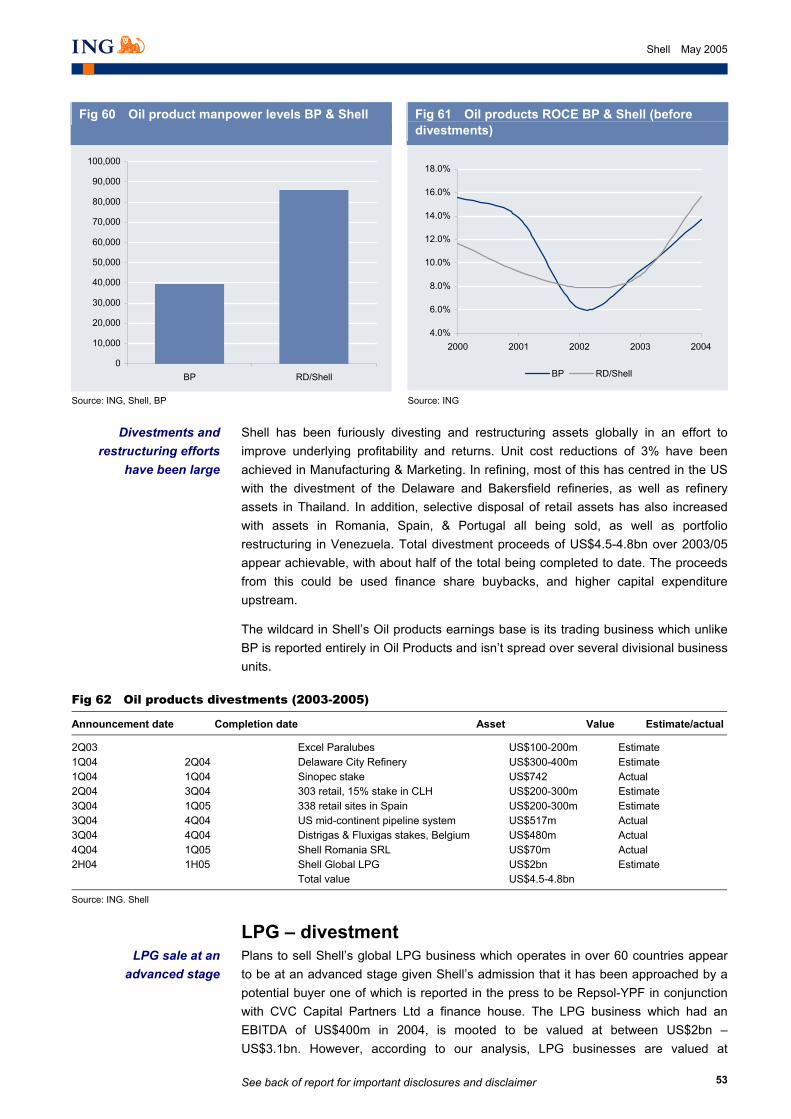
See back of report for important disclosures and disclaimer
53
Shell May 2005
Fig 60 Oil product manpower levels BP & Shell
Fig 61 Oil products ROCE BP & Shell (before divestments)
0
10,000
20,000
30,000
40,000
50,000
60,000
70,000
80,000
90,000
100,000
BP RD/Shell
4.0%
6.0%
8.0%
10.0%
12.0%
14.0%
16.0%
18.0%
2000 2001 2002 2003 2004
BP RD/Shell
Source: ING, Shell, BP Source: ING
_
Shell has been furiously divesting and restructuring assets globally in an effort to improve underlying profitability and returns. Unit cost reductions of 3% have been achieved in Manufacturing & Marketing. In refining, most of this has centred in the US with the divestment of the Delaware and Bakersfield refineries, as well as refinery assets in Thailand. In addition, selective disposal of retail assets has also increased with assets in Romania, Spain, & Portugal all being sold, as well as portfolio restructuring in Venezuela. Total divestment proceeds of US$4.5-4.8bn over 2003/05 appear achievable, with about half of the total being completed to date. The proceeds from this could be used finance share buybacks, and higher capital expenditure upstream.
The wildcard in Shell’s Oil products earnings base is its trading business which unlike BP is reported entirely in Oil Products and isn’t spread over several divisional business units.
Fig 62 Oil products divestments (2003-2005)
Announcement date Completion date Asset Value Estimate/actual
2Q03 Excel Paralubes US$100-200m Estimate 1Q04 2Q04 Delaware City Refinery US$300-400m Estimate 1Q04 1Q04 Sinopec stake US$742 Actual 2Q04 3Q04 303 retail, 15% stake in CLH US$200-300m Estimate 3Q04 1Q05 338 retail sites in Spain US$200-300m Estimate 3Q04 4Q04 US mid-continent pipeline system US$517m Actual 3Q04 4Q04 Distrigas & Fluxigas stakes, Belgium US$480m Actual 4Q04 1Q05 Shell Romania SRL US$70m Actual 2H04 1H05 Shell Global LPG US$2bn Estimate Total value US$4.5-4.8bn
Source: ING. Shell
_
LPG – divestment Plans to sell Shell’s global LPG business which operates in over 60 countries appear to be at an advanced stage given Shell’s admission that it has been approached by a potential buyer one of which is reported in the press to be Repsol-YPF in conjunction with CVC Capital Partners Ltd a finance house. The LPG business which had an EBITDA of US$400m in 2004, is mooted to be valued at between US$2bn – US$3.1bn. However, according to our analysis, LPG businesses are valued at
LPG sale at an advanced stage
Divestments and restructuring efforts
have been large
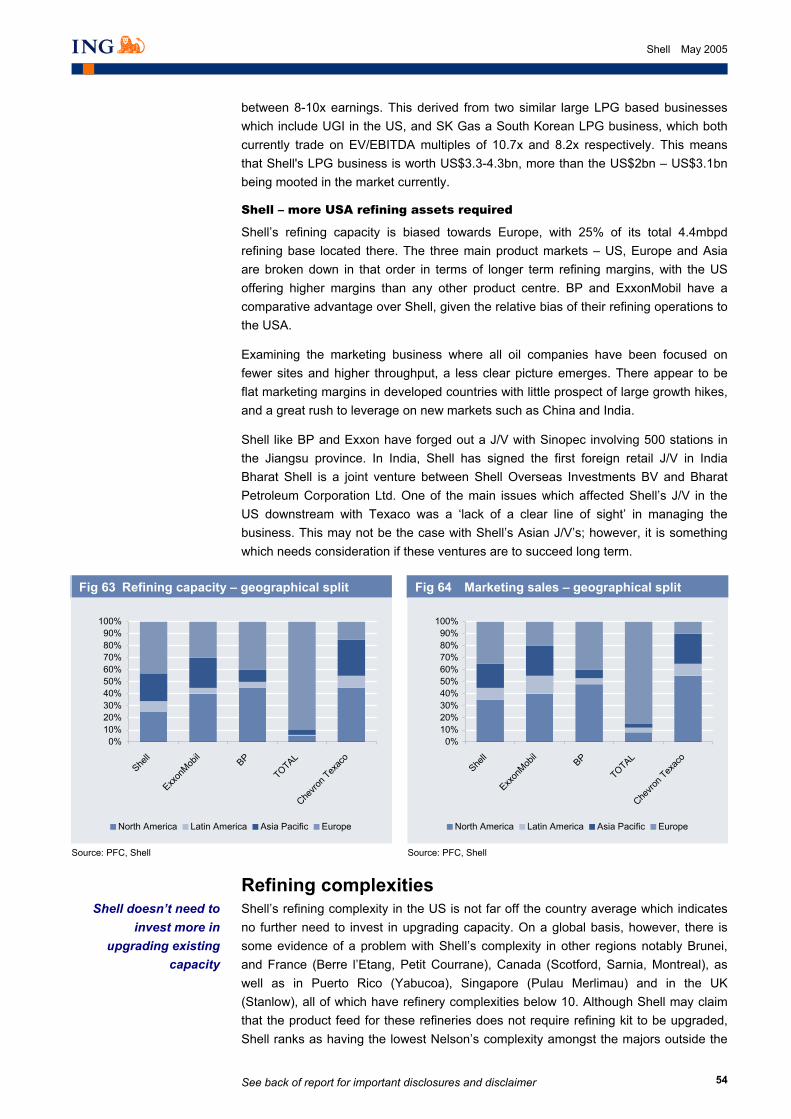
See back of report for important disclosures and disclaimer
54
Shell May 2005
between 8-10x earnings. This derived from two similar large LPG based businesses which include UGI in the US, and SK Gas a South Korean LPG business, which both currently trade on EV/EBITDA multiples of 10.7x and 8.2x respectively. This means that Shell's LPG business is worth US$3.3-4.3bn, more than the US$2bn – US$3.1bn being mooted in the market currently.
Shell – more USA refining assets required
Shell’s refining capacity is biased towards Europe, with 25% of its total 4.4mbpd refining base located there. The three main product markets – US, Europe and Asia are broken down in that order in terms of longer term refining margins, with the US offering higher margins than any other product centre. BP and ExxonMobil have a comparative advantage over Shell, given the relative bias of their refining operations to the USA.
Examining the marketing business where all oil companies have been focused on fewer sites and higher throughput, a less clear picture emerges. There appear to be flat marketing margins in developed countries with little prospect of large growth hikes, and a great rush to leverage on new markets such as China and India.
Shell like BP and Exxon have forged out a J/V with Sinopec involving 500 stations in the Jiangsu province. In India, Shell has signed the first foreign retail J/V in India Bharat Shell is a joint venture between Shell Overseas Investments BV and Bharat Petroleum Corporation Ltd. One of the main issues which affected Shell’s J/V in the US downstream with Texaco was a ‘lack of a clear line of sight’ in managing the business. This may not be the case with Shell’s Asian J/V’s; however, it is something which needs consideration if these ventures are to succeed long term.
Fig 63 Refining capacity – geographical split
Fig 64 Marketing sales – geographical split
0%10%20%30%40%50%60%70%80%90%
100%
Shell
Exxon
Mobil
BP
TOTAL
Chevro
n Tex
aco
North America Latin America Asia Pacific Europe
0%10%20%30%40%50%60%70%80%90%
100%
Shell
Exxon
Mobil
BP
TOTAL
Chevro
n Tex
aco
North America Latin America Asia Pacific Europe
Source: PFC, Shell Source: PFC, Shell
_
Refining complexities Shell’s refining complexity in the US is not far off the country average which indicates no further need to invest in upgrading capacity. On a global basis, however, there is some evidence of a problem with Shell’s complexity in other regions notably Brunei, and France (Berre l’Etang, Petit Courrane), Canada (Scotford, Sarnia, Montreal), as well as in Puerto Rico (Yabucoa), Singapore (Pulau Merlimau) and in the UK (Stanlow), all of which have refinery complexities below 10. Although Shell may claim that the product feed for these refineries does not require refining kit to be upgraded, Shell ranks as having the lowest Nelson’s complexity amongst the majors outside the
Shell doesn’t need to invest more in
upgrading existing capacity
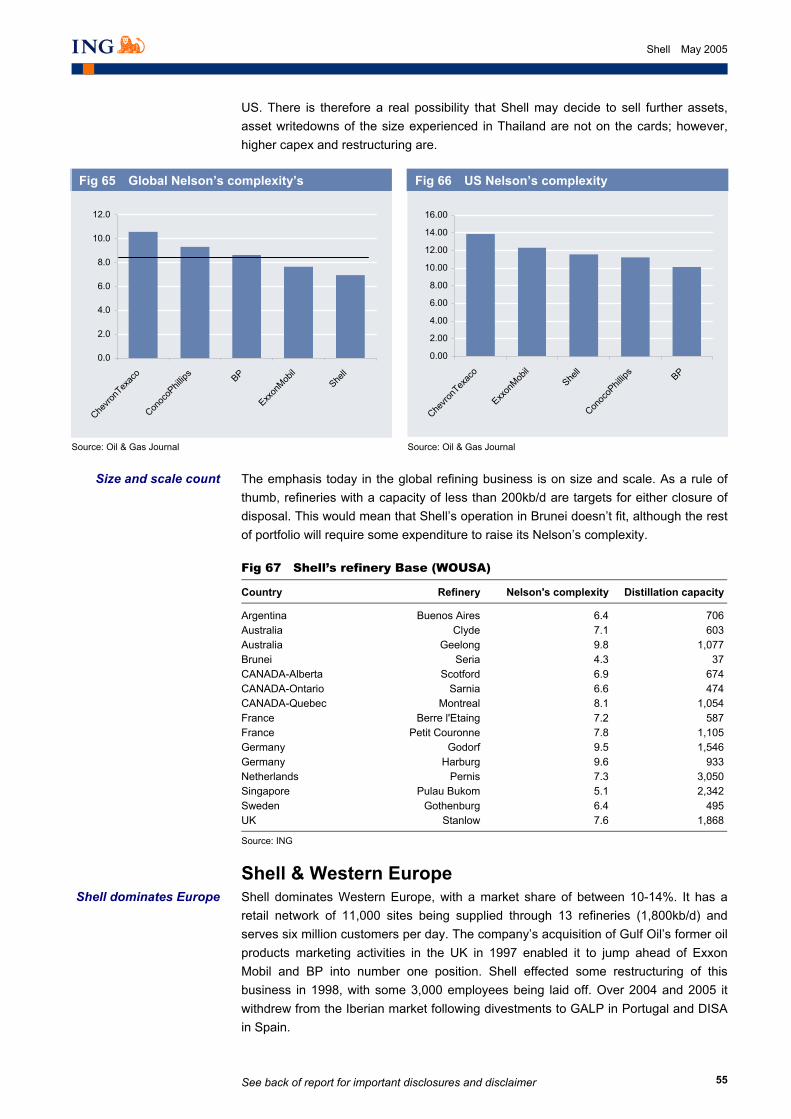
See back of report for important disclosures and disclaimer
55
Shell May 2005
US. There is therefore a real possibility that Shell may decide to sell further assets, asset writedowns of the size experienced in Thailand are not on the cards; however, higher capex and restructuring are.
Fig 65 Global Nelson’s complexity’s
Fig 66 US Nelson’s complexity
0.0
2.0
4.0
6.0
8.0
10.0
12.0
Chevro
nTex
aco
Conoc
oPhil
lips BP
Exxon
Mobil
Shell
0.00
2.00
4.00
6.00
8.00
10.00
12.00
14.00
16.00
Chevro
nTex
aco
Exxon
Mobil
Shell
Conoc
oPhil
lips BP
Source: Oil & Gas Journal Source: Oil & Gas Journal
_
The emphasis today in the global refining business is on size and scale. As a rule of thumb, refineries with a capacity of less than 200kb/d are targets for either closure of disposal. This would mean that Shell’s operation in Brunei doesn’t fit, although the rest of portfolio will require some expenditure to raise its Nelson’s complexity.
Fig 67 Shell’s refinery Base (WOUSA)
Country Refinery Nelson's complexity Distillation capacity
Argentina Buenos Aires 6.4 706 Australia Clyde 7.1 603 Australia Geelong 9.8 1,077 Brunei Seria 4.3 37 CANADA-Alberta Scotford 6.9 674 CANADA-Ontario Sarnia 6.6 474 CANADA-Quebec Montreal 8.1 1,054 France Berre l'Etaing 7.2 587 France Petit Couronne 7.8 1,105 Germany Godorf 9.5 1,546 Germany Harburg 9.6 933 Netherlands Pernis 7.3 3,050 Singapore Pulau Bukom 5.1 2,342 Sweden Gothenburg 6.4 495 UK Stanlow 7.6 1,868
Source: ING
_
Shell & Western Europe Shell dominates Western Europe, with a market share of between 10-14%. It has a retail network of 11,000 sites being supplied through 13 refineries (1,800kb/d) and serves six million customers per day. The company’s acquisition of Gulf Oil’s former oil products marketing activities in the UK in 1997 enabled it to jump ahead of Exxon Mobil and BP into number one position. Shell effected some restructuring of this business in 1998, with some 3,000 employees being laid off. Over 2004 and 2005 it withdrew from the Iberian market following divestments to GALP in Portugal and DISA in Spain.
Shell dominates Europe
Size and scale count
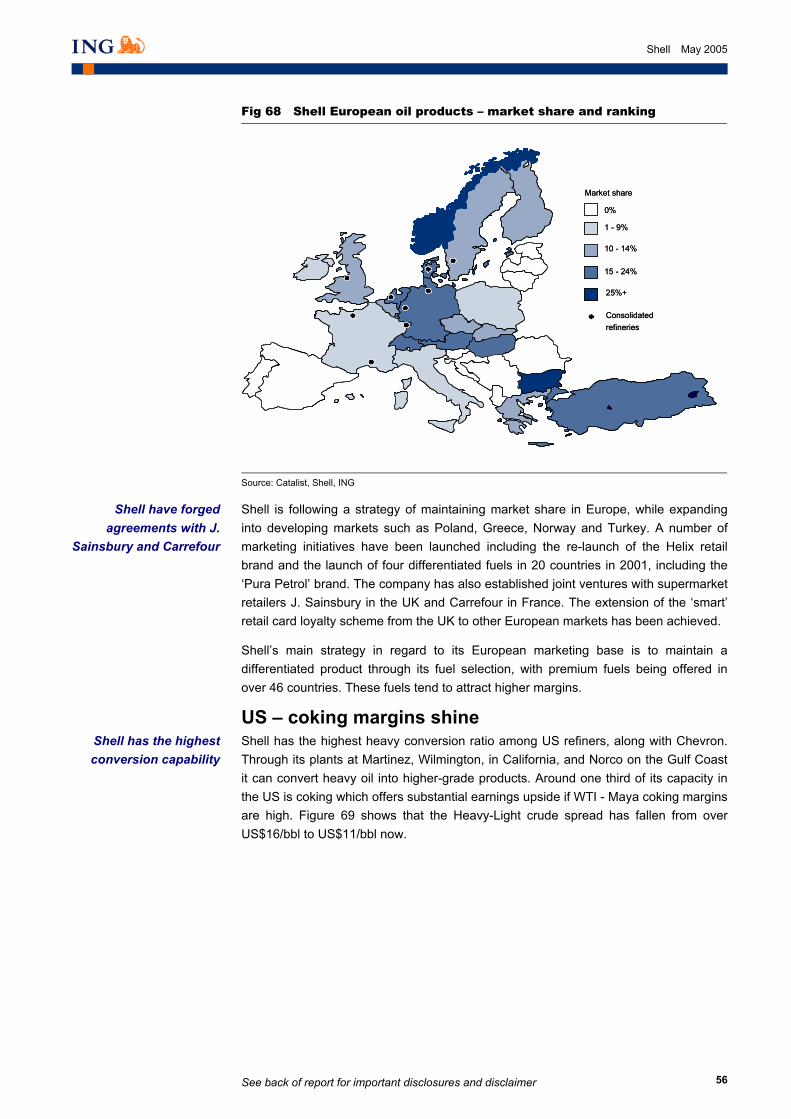
See back of report for important disclosures and disclaimer
56
Shell May 2005
Fig 68 Shell European oil products – market share and ranking
1 - 9%
10 - 14%
15 - 24%
25%+
Consolidatedrefineries
Market share
0%
1 - 9%
10 - 14%
15 - 24%
25%+
Consolidatedrefineries
Market share
0%
Source: Catalist, Shell, ING
Shell is following a strategy of maintaining market share in Europe, while expanding into developing markets such as Poland, Greece, Norway and Turkey. A number of marketing initiatives have been launched including the re-launch of the Helix retail brand and the launch of four differentiated fuels in 20 countries in 2001, including the ‘Pura Petrol’ brand. The company has also established joint ventures with supermarket retailers J. Sainsbury in the UK and Carrefour in France. The extension of the ‘smart’ retail card loyalty scheme from the UK to other European markets has been achieved.
Shell’s main strategy in regard to its European marketing base is to maintain a differentiated product through its fuel selection, with premium fuels being offered in over 46 countries. These fuels tend to attract higher margins.
US – coking margins shine Shell has the highest heavy conversion ratio among US refiners, along with Chevron. Through its plants at Martinez, Wilmington, in California, and Norco on the Gulf Coast it can convert heavy oil into higher-grade products. Around one third of its capacity in the US is coking which offers substantial earnings upside if WTI - Maya coking margins are high. Figure 69 shows that the Heavy-Light crude spread has fallen from over US$16/bbl to US$11/bbl now.
Shell have forged agreements with J.
Sainsbury and Carrefour
Shell has the highest conversion capability
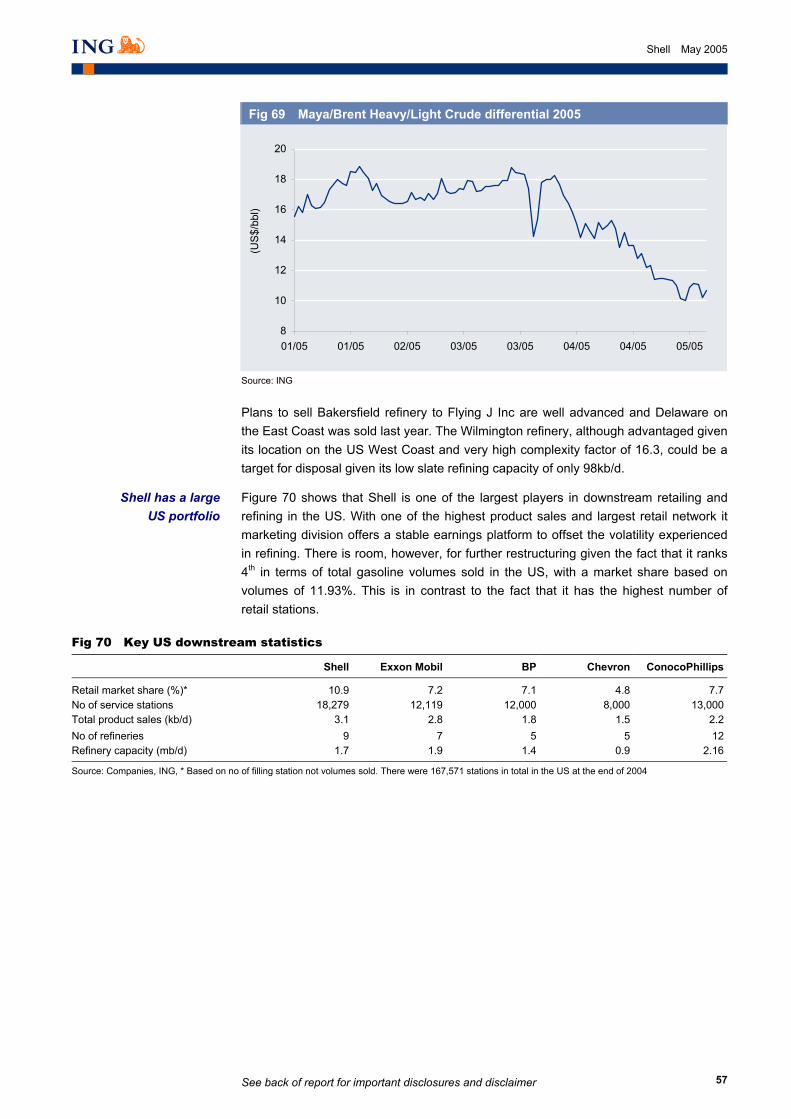
See back of report for important disclosures and disclaimer
57
Shell May 2005
Fig 69 Maya/Brent Heavy/Light Crude differential 2005
8
10
12
14
16
18
20
01/05 01/05 02/05 03/05 03/05 04/05 04/05 05/05
(US
$/bb
l)
Source: ING
_
Plans to sell Bakersfield refinery to Flying J Inc are well advanced and Delaware on the East Coast was sold last year. The Wilmington refinery, although advantaged given its location on the US West Coast and very high complexity factor of 16.3, could be a target for disposal given its low slate refining capacity of only 98kb/d.
Figure 70 shows that Shell is one of the largest players in downstream retailing and refining in the US. With one of the highest product sales and largest retail network it marketing division offers a stable earnings platform to offset the volatility experienced in refining. There is room, however, for further restructuring given the fact that it ranks 4th in terms of total gasoline volumes sold in the US, with a market share based on volumes of 11.93%. This is in contrast to the fact that it has the highest number of retail stations.
Fig 70 Key US downstream statistics
Shell Exxon Mobil BP Chevron ConocoPhillips
Retail market share (%)* 10.9 7.2 7.1 4.8 7.7No of service stations 18,279 12,119 12,000 8,000 13,000Total product sales (kb/d) 3.1 2.8 1.8 1.5 2.2No of refineries 9 7 5 5 12Refinery capacity (mb/d) 1.7 1.9 1.4 0.9 2.16
Source: Companies, ING, * Based on no of filling station not volumes sold. There were 167,571 stations in total in the US at the end of 2004
Shell has a large US portfolio
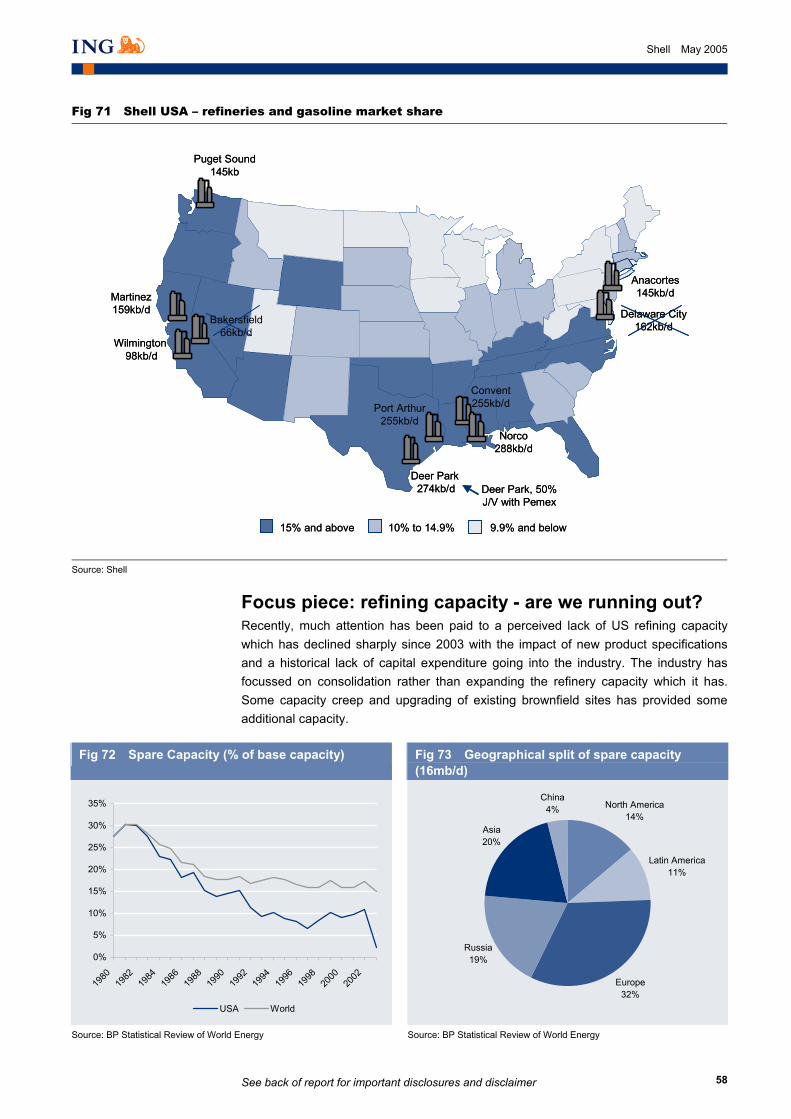
See back of report for important disclosures and disclaimer
58
Shell May 2005
Fig 71 Shell USA – refineries and gasoline market share
15% and above 10% to 14.9% 9.9% and below
Puget Sound145kb
Martinez159kb/d
Wilmington98kb/d
Bakersfield66kb/d
Deer Park 274kb/d
Port Arthur255kb/d
Convent255kb/d
Norco288kb/d
Deer Park, 50% J/V with Pemex
Delaware City162kb/d
Anacortes145kb/d
15% and above 10% to 14.9% 9.9% and below
Puget Sound145kb
Martinez159kb/d
Wilmington98kb/d
Bakersfield66kb/d
Deer Park 274kb/d
Port Arthur255kb/d
Convent255kb/d
Norco288kb/d
Deer Park, 50% J/V with Pemex
Delaware City162kb/d
Anacortes145kb/d
Source: Shell
Focus piece: refining capacity - are we running out? Recently, much attention has been paid to a perceived lack of US refining capacity which has declined sharply since 2003 with the impact of new product specifications and a historical lack of capital expenditure going into the industry. The industry has focussed on consolidation rather than expanding the refinery capacity which it has. Some capacity creep and upgrading of existing brownfield sites has provided some additional capacity.
Fig 72 Spare Capacity (% of base capacity)
Fig 73 Geographical split of spare capacity (16mb/d)
0%
5%
10%
15%
20%
25%
30%
35%
1980
1982
1984
1986
1988
1990
1992
1994
1996
1998
2000
2002
USA World
North America14%
Latin America11%
Europe32%
Russia19%
Asia20%
China4%
Source: BP Statistical Review of World Energy Source: BP Statistical Review of World Energy
_
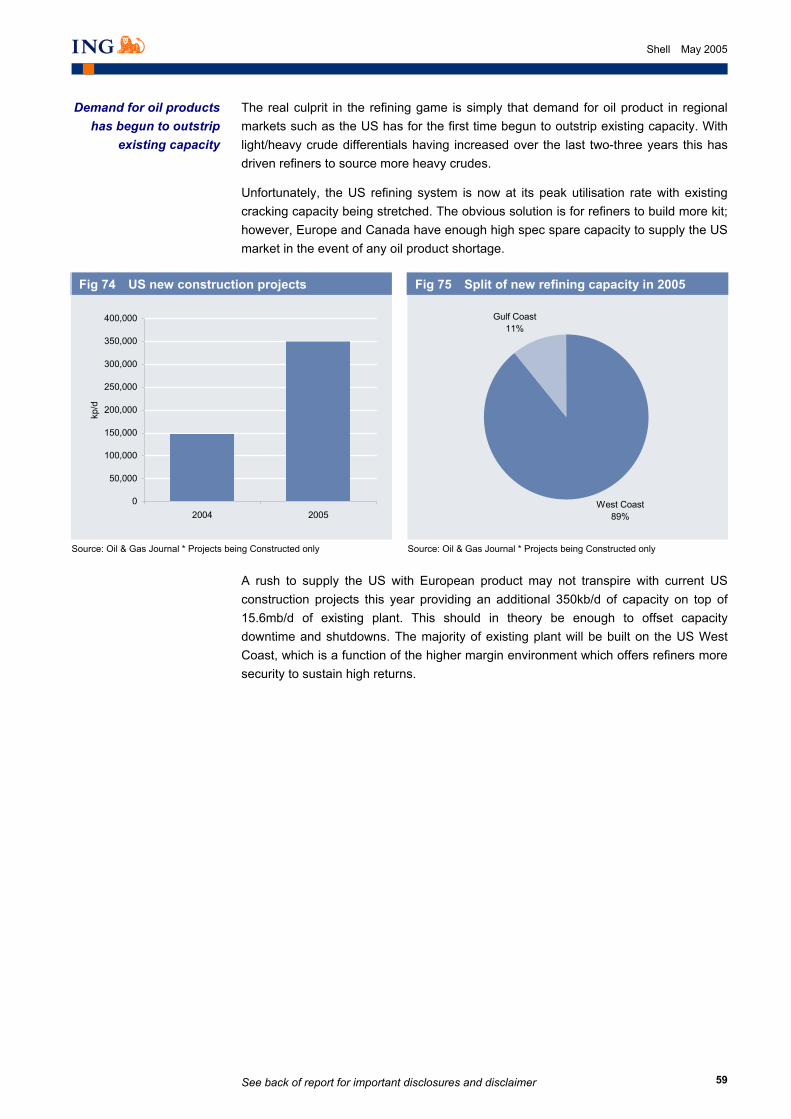
See back of report for important disclosures and disclaimer
59
Shell May 2005
The real culprit in the refining game is simply that demand for oil product in regional markets such as the US has for the first time begun to outstrip existing capacity. With light/heavy crude differentials having increased over the last two-three years this has driven refiners to source more heavy crudes.
Unfortunately, the US refining system is now at its peak utilisation rate with existing cracking capacity being stretched. The obvious solution is for refiners to build more kit; however, Europe and Canada have enough high spec spare capacity to supply the US market in the event of any oil product shortage.
Fig 74 US new construction projects
Fig 75 Split of new refining capacity in 2005
0
50,000
100,000
150,000
200,000
250,000
300,000
350,000
400,000
2004 2005
kp/d
West Coast89%
Gulf Coast11%
Source: Oil & Gas Journal * Projects being Constructed only Source: Oil & Gas Journal * Projects being Constructed only
A rush to supply the US with European product may not transpire with current US construction projects this year providing an additional 350kb/d of capacity on top of 15.6mb/d of existing plant. This should in theory be enough to offset capacity downtime and shutdowns. The majority of existing plant will be built on the US West Coast, which is a function of the higher margin environment which offers refiners more security to sustain high returns.
Demand for oil products has begun to outstrip
existing capacity
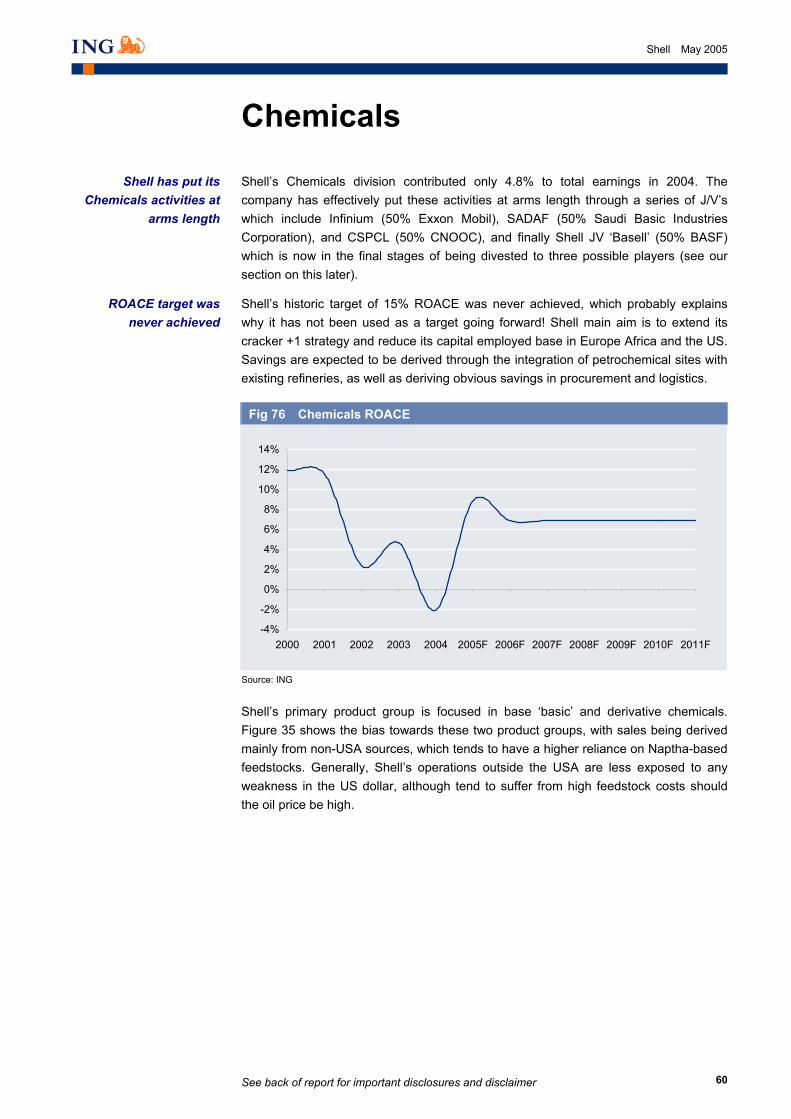
See back of report for important disclosures and disclaimer
60
Shell May 2005
Chemicals
Shell’s Chemicals division contributed only 4.8% to total earnings in 2004. The company has effectively put these activities at arms length through a series of J/V’s which include Infinium (50% Exxon Mobil), SADAF (50% Saudi Basic Industries Corporation), and CSPCL (50% CNOOC), and finally Shell JV ‘Basell’ (50% BASF) which is now in the final stages of being divested to three possible players (see our section on this later).
Shell’s historic target of 15% ROACE was never achieved, which probably explains why it has not been used as a target going forward! Shell main aim is to extend its cracker +1 strategy and reduce its capital employed base in Europe Africa and the US. Savings are expected to be derived through the integration of petrochemical sites with existing refineries, as well as deriving obvious savings in procurement and logistics.
Fig 76 Chemicals ROACE
-4%
-2%
0%
2%
4%
6%
8%
10%
12%
14%
2000 2001 2002 2003 2004 2005F 2006F 2007F 2008F 2009F 2010F 2011F
Source: ING
_
Shell’s primary product group is focused in base ‘basic’ and derivative chemicals. Figure 35 shows the bias towards these two product groups, with sales being derived mainly from non-USA sources, which tends to have a higher reliance on Naptha-based feedstocks. Generally, Shell’s operations outside the USA are less exposed to any weakness in the US dollar, although tend to suffer from high feedstock costs should the oil price be high.
Shell has put its Chemicals activities at
arms length
ROACE target was never achieved
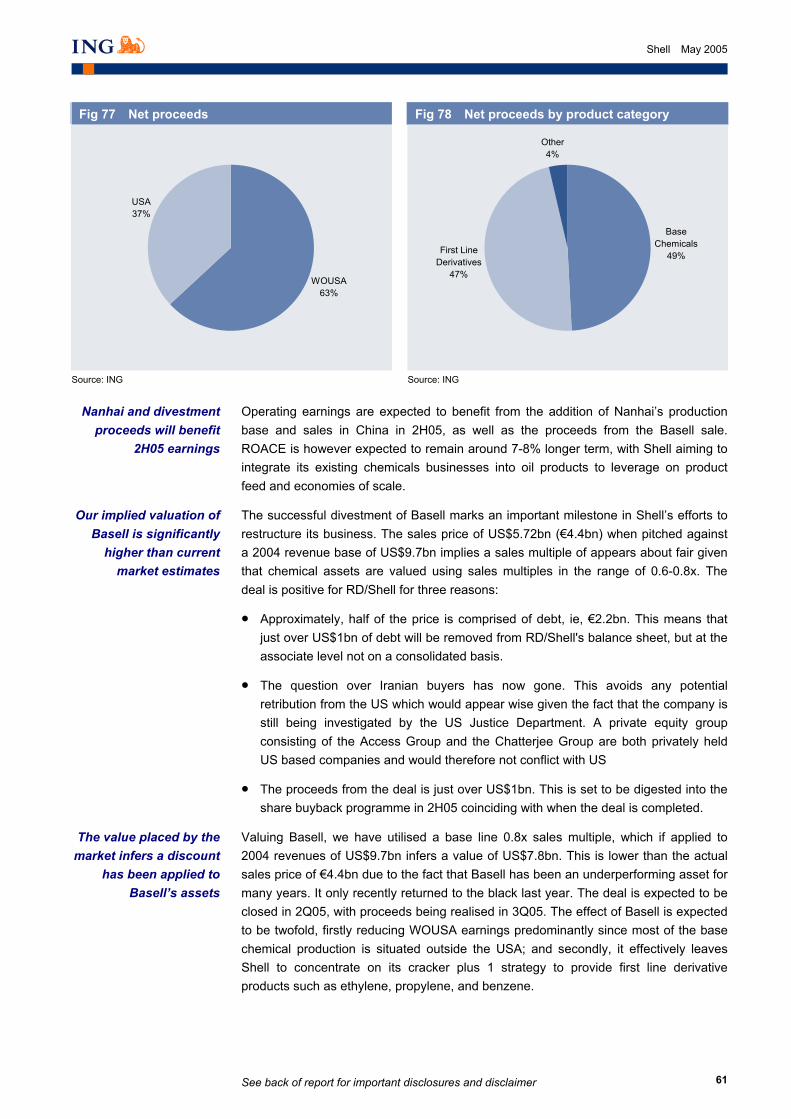
See back of report for important disclosures and disclaimer
61
Shell May 2005
Fig 77 Net proceeds
Fig 78 Net proceeds by product category
WOUSA63%
USA37%
Base Chemicals
49%First Line Derivatives
47%
Other4%
Source: ING Source: ING
_
Operating earnings are expected to benefit from the addition of Nanhai’s production base and sales in China in 2H05, as well as the proceeds from the Basell sale. ROACE is however expected to remain around 7-8% longer term, with Shell aiming to integrate its existing chemicals businesses into oil products to leverage on product feed and economies of scale.
The successful divestment of Basell marks an important milestone in Shell’s efforts to restructure its business. The sales price of US$5.72bn (€4.4bn) when pitched against a 2004 revenue base of US$9.7bn implies a sales multiple of appears about fair given that chemical assets are valued using sales multiples in the range of 0.6-0.8x. The deal is positive for RD/Shell for three reasons:
• Approximately, half of the price is comprised of debt, ie, €2.2bn. This means that just over US$1bn of debt will be removed from RD/Shell's balance sheet, but at the associate level not on a consolidated basis.
• The question over Iranian buyers has now gone. This avoids any potential retribution from the US which would appear wise given the fact that the company is still being investigated by the US Justice Department. A private equity group consisting of the Access Group and the Chatterjee Group are both privately held US based companies and would therefore not conflict with US
• The proceeds from the deal is just over US$1bn. This is set to be digested into the share buyback programme in 2H05 coinciding with when the deal is completed.
Valuing Basell, we have utilised a base line 0.8x sales multiple, which if applied to 2004 revenues of US$9.7bn infers a value of US$7.8bn. This is lower than the actual sales price of €4.4bn due to the fact that Basell has been an underperforming asset for many years. It only recently returned to the black last year. The deal is expected to be closed in 2Q05, with proceeds being realised in 3Q05. The effect of Basell is expected to be twofold, firstly reducing WOUSA earnings predominantly since most of the base chemical production is situated outside the USA; and secondly, it effectively leaves Shell to concentrate on its cracker plus 1 strategy to provide first line derivative products such as ethylene, propylene, and benzene.
Nanhai and divestment proceeds will benefit
2H05 earnings
Our implied valuation of Basell is significantly
higher than current market estimates
The value placed by the market infers a discount
has been applied to Basell’s assets
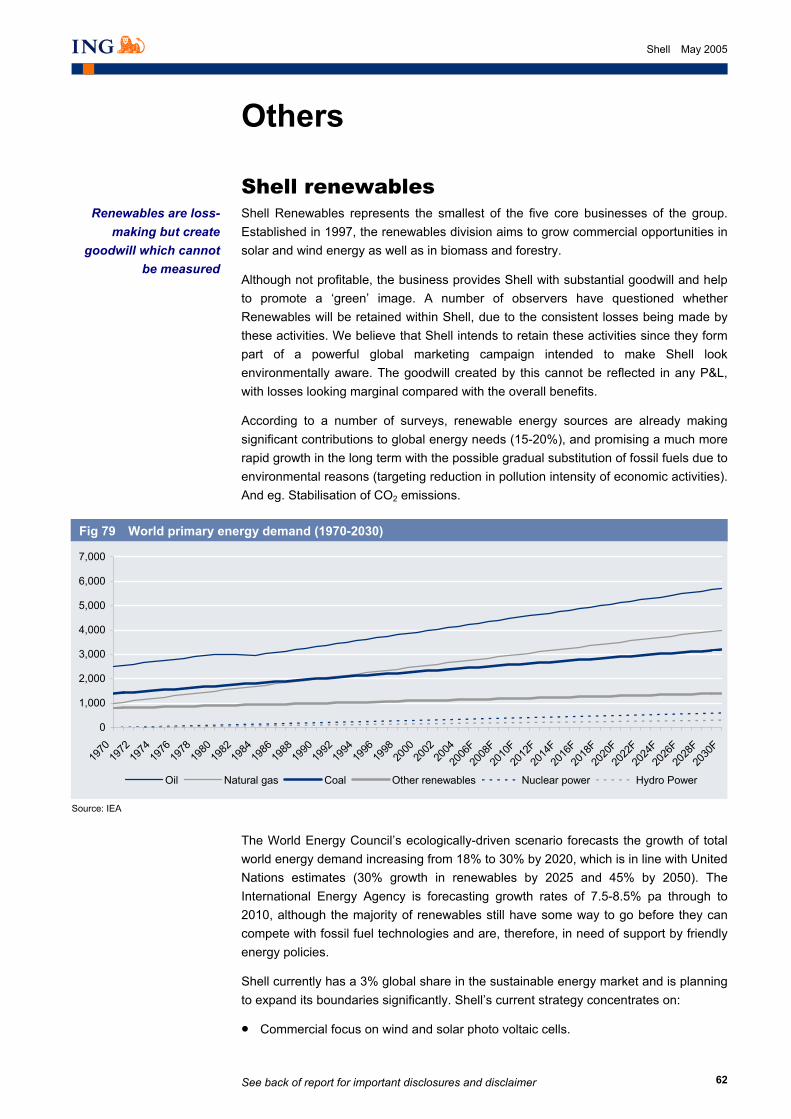
See back of report for important disclosures and disclaimer
62
Shell May 2005
Others
Shell renewables Shell Renewables represents the smallest of the five core businesses of the group. Established in 1997, the renewables division aims to grow commercial opportunities in solar and wind energy as well as in biomass and forestry.
Although not profitable, the business provides Shell with substantial goodwill and help to promote a ‘green’ image. A number of observers have questioned whether Renewables will be retained within Shell, due to the consistent losses being made by these activities. We believe that Shell intends to retain these activities since they form part of a powerful global marketing campaign intended to make Shell look environmentally aware. The goodwill created by this cannot be reflected in any P&L, with losses looking marginal compared with the overall benefits.
According to a number of surveys, renewable energy sources are already making significant contributions to global energy needs (15-20%), and promising a much more rapid growth in the long term with the possible gradual substitution of fossil fuels due to environmental reasons (targeting reduction in pollution intensity of economic activities). And eg. Stabilisation of CO2 emissions.
Fig 79 World primary energy demand (1970-2030)
0
1,000
2,000
3,000
4,000
5,000
6,000
7,000
1970
1972
1974
1976
1978
1980
1982
1984
1986
1988
1990
1992
1994
1996
1998
2000
2002
2004
2006
F20
08F20
10F20
12F20
14F20
16F20
18F20
20F20
22F20
24F20
26F20
28F20
30F
Oil Natural gas Coal Other renewables Nuclear power Hydro Power
Source: IEA
_
The World Energy Council’s ecologically-driven scenario forecasts the growth of total world energy demand increasing from 18% to 30% by 2020, which is in line with United Nations estimates (30% growth in renewables by 2025 and 45% by 2050). The International Energy Agency is forecasting growth rates of 7.5-8.5% pa through to 2010, although the majority of renewables still have some way to go before they can compete with fossil fuel technologies and are, therefore, in need of support by friendly energy policies.
Shell currently has a 3% global share in the sustainable energy market and is planning to expand its boundaries significantly. Shell’s current strategy concentrates on:
• Commercial focus on wind and solar photo voltaic cells.
Renewables are loss-making but create
goodwill which cannot be measured
See back of report for important disclosures and disclaimer
63
Shell May 2005
• Develop biomass, geothermal and hydrogen.
• Selling ‘green’ electricity.
From an investment standpoint, Shell appears to be more focused on wind and solar energy than other renewable energy sources.
Wind power Wind is the fastest-growing area of renewable energy worldwide, with growth in global capacity of 28.5% pa. Ever lower running costs, improved technology and national programmes to comply with the Kyoto agreement are driving the market for wind power. Total installed wind-power global capacity in 2004 has exceeded 47,400 MW, with the USA and Germany being the most important contributors. Leading growth markets include Germany and Spain, followed by Japan, Italy and India.
Shell WindEnergy aims to achieve a portfolio of approximately 1000MW by the end of this year. In the offshore wind power, Shell are developing its NoordZeeWind project off the Dutch coast, which is a joint venture with Nuon for the development of a 100MW wind power plant, 11-18 km off the Dutch coast near Egmond aan Zee. The plant would consist of over 30 large wind turbines and supply some 110,000 homes with power.
From 2006, growth has been assumed in line with the market. Shell is aiming to move away from the investor/ owner/ operator structure and become a developer/ owner/ operator. Its market focus is on the US and Europe, the latter which includes Harburg, Blyth and La Muela, where there are not only excellent wind resources and market-incentives, but also opportunities to develop large wind parks in excess of 50MW.
Solar Solar energy generally comes in four different forms:
• Photovoltaic (electricity).
• Passive solar building design.
• Concentrating solar (utility-scale electricity generation).
• Solar Thermal (hot water).
Shell has concentrated on the first three types of solar energy with limited interest in the fourth one. Solar energy is seen as an alternative solution for the population in the remote areas where there is little chance of getting any grid power. Currently, the group builds on the business’s rural electrification activities in South Africa, the Philippines, Sri Lanka and India. It has also entered the Chinese market to supply solar home systems to 78,000 households over five years in the Xinjiang Autonomous Region.
The development of photovoltaic cells has been commercialised through Shell’s range of PowerMax* products. These offer high performance power for grid-connected applications. Each unit offers up to 175W maximum power. The Shell PowerMax range has been created using advanced crystalline silicon technology and includes two differentiated product types. Shell PowerMax Ultra is based on mono-crystalline silicon, providing premium performance where installation space is limited and Shell PowerMax Plus is based on multi-crystalline silicon and provides a cost effective solution for a broad range of end-uses. A new range of product options are also available within the Shell PowerMax product range, providing tailor made energy
Wind is a growing area
Solar cells are used in remote locations
See back of report for important disclosures and disclaimer
64
Shell May 2005
solutions for applications ranging from multi-Megawatt solar power plants to small private households to remote telecommunication sites.
Recently, Shell Solar installed Asia Pacific's largest rooftop solar photovoltaic system at TESCO-Lotus' latest hypermarket Rama 1, in Bangkok. The 460kWp solar array is a key contribution to the 'green stores' energy conservation design and environmental friendly initiatives.
Shell has also built the world’s largest solar power station, south of Leipzig in Germany with GEOSOL the initiator and project developer while Shell Solar is the prime construction contractor. The solar power station has been built on a former lignite mine ash deposit near Espenhain. The free-standing array comprises some 33,500 solar modules with a total output of 5MW. Power is fed directly into the grid operated and will be sufficient to meet the electricity demand of about 1,800 households.
Hydrogen Shell Hydrogen was established in 1999 to pursue and develop, on a worldwide basis, business opportunities related to hydrogen and fuel cells, which offer a new generation of compact, cost-effective fuel cells designed to replace hydrocarbon-based engines and fossil-fuel-burning power plants. Fuel cells operate without combustion, thus virtually pollution free, which explains a revival of interest in them. The business is currently focusing on two areas: automotive and power generation.
The group’s investment into direct hydrogen fuelling and gasoline reformers represents a commitment, we think, to building a truly sustainable and mature energy infrastructure. Shell also is involved in catalyst technology, process control, process engineering and introduction of new fuels, such as LPG (liquefied petroleum gas). The company has established a network of partners globally, aiming to access proprietary technology without sizeable material commitments.
Shell has joined forces with DaimlerChrysler and leased DaimlerChrysler’s fuel-cell vehicle, known as the “F-Cell” car that will re-fuel mainly at the Shell operated JHFC (Japan Hydrogen and Fuel-cell Demonstration Project) Ariake hydrogen station. In addition, the project will aid Shell and DaimlerChrysler’s technical know-how as well as raise public awareness around the fuel-cell car and hydrogen as an alternative energy and will contribute to both Shell and DaimlerChrysler working closely together to obtain a better understanding of fuel-cell vehicles and hydrogen.
In Norway, Shell is in collaboration with Siemens Westinghouse to provide an essential recovery technology to capture carbon dioxide for long-term storage, or even turn it into a commercial commodity. In the USA, California Shell Hydrogen is a key member of the California Fuel Cell Partnership with a number of partners from the automotive and energy industries, fuel cell developers and government; recently, Shell opened its first Hydrogen station in Washington. Further stations in Luxembourg and Amsterdam have also opened.
Shell is researching Hydrogen fuel
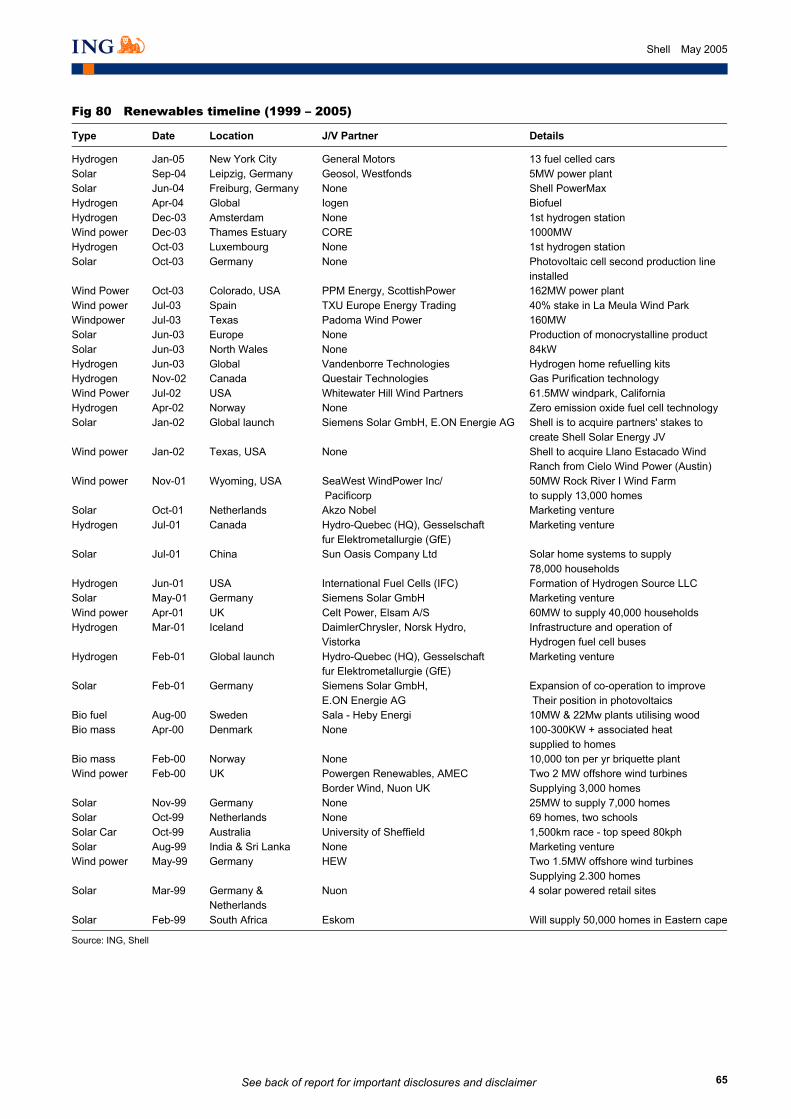
See back of report for important disclosures and disclaimer
65
Shell May 2005
Fig 80 Renewables timeline (1999 – 2005)
Type Date Location J/V Partner Details
Hydrogen Jan-05 New York City General Motors 13 fuel celled cars Solar Sep-04 Leipzig, Germany Geosol, Westfonds 5MW power plant Solar Jun-04 Freiburg, Germany None Shell PowerMax Hydrogen Apr-04 Global Iogen Biofuel Hydrogen Dec-03 Amsterdam None 1st hydrogen station Wind power Dec-03 Thames Estuary CORE 1000MW Hydrogen Oct-03 Luxembourg None 1st hydrogen station Solar Oct-03 Germany None Photovoltaic cell second production line
installed Wind Power Oct-03 Colorado, USA PPM Energy, ScottishPower 162MW power plant Wind power Jul-03 Spain TXU Europe Energy Trading 40% stake in La Meula Wind Park Windpower Jul-03 Texas Padoma Wind Power 160MW Solar Jun-03 Europe None Production of monocrystalline product Solar Jun-03 North Wales None 84kW Hydrogen Jun-03 Global Vandenborre Technologies Hydrogen home refuelling kits Hydrogen Nov-02 Canada Questair Technologies Gas Purification technology Wind Power Jul-02 USA Whitewater Hill Wind Partners 61.5MW windpark, California Hydrogen Apr-02 Norway None Zero emission oxide fuel cell technology Solar Jan-02 Global launch Siemens Solar GmbH, E.ON Energie AG Shell is to acquire partners' stakes to
create Shell Solar Energy JV Wind power Jan-02 Texas, USA None Shell to acquire Llano Estacado Wind
Ranch from Cielo Wind Power (Austin) Wind power Nov-01 Wyoming, USA SeaWest WindPower Inc/ 50MW Rock River I Wind Farm Pacificorp to supply 13,000 homes Solar Oct-01 Netherlands Akzo Nobel Marketing venture Hydrogen Jul-01 Canada Hydro-Quebec (HQ), Gesselschaft Marketing venture fur Elektrometallurgie (GfE) Solar Jul-01 China Sun Oasis Company Ltd Solar home systems to supply 78,000 households Hydrogen Jun-01 USA International Fuel Cells (IFC) Formation of Hydrogen Source LLC Solar May-01 Germany Siemens Solar GmbH Marketing venture Wind power Apr-01 UK Celt Power, Elsam A/S 60MW to supply 40,000 households Hydrogen Mar-01 Iceland DaimlerChrysler, Norsk Hydro, Infrastructure and operation of Vistorka Hydrogen fuel cell buses Hydrogen Feb-01 Global launch Hydro-Quebec (HQ), Gesselschaft Marketing venture fur Elektrometallurgie (GfE) Solar Feb-01 Germany Siemens Solar GmbH, Expansion of co-operation to improve E.ON Energie AG Their position in photovoltaics Bio fuel Aug-00 Sweden Sala - Heby Energi 10MW & 22Mw plants utilising wood Bio mass Apr-00 Denmark None 100-300KW + associated heat supplied to homes Bio mass Feb-00 Norway None 10,000 ton per yr briquette plant Wind power Feb-00 UK Powergen Renewables, AMEC Two 2 MW offshore wind turbines Border Wind, Nuon UK Supplying 3,000 homes Solar Nov-99 Germany None 25MW to supply 7,000 homes Solar Oct-99 Netherlands None 69 homes, two schools Solar Car Oct-99 Australia University of Sheffield 1,500km race - top speed 80kph Solar Aug-99 India & Sri Lanka None Marketing venture Wind power May-99 Germany HEW Two 1.5MW offshore wind turbines Supplying 2.300 homes Solar Mar-99 Germany &
Netherlands Nuon 4 solar powered retail sites
Solar Feb-99 South Africa Eskom Will supply 50,000 homes in Eastern cape
Source: ING, Shell
_
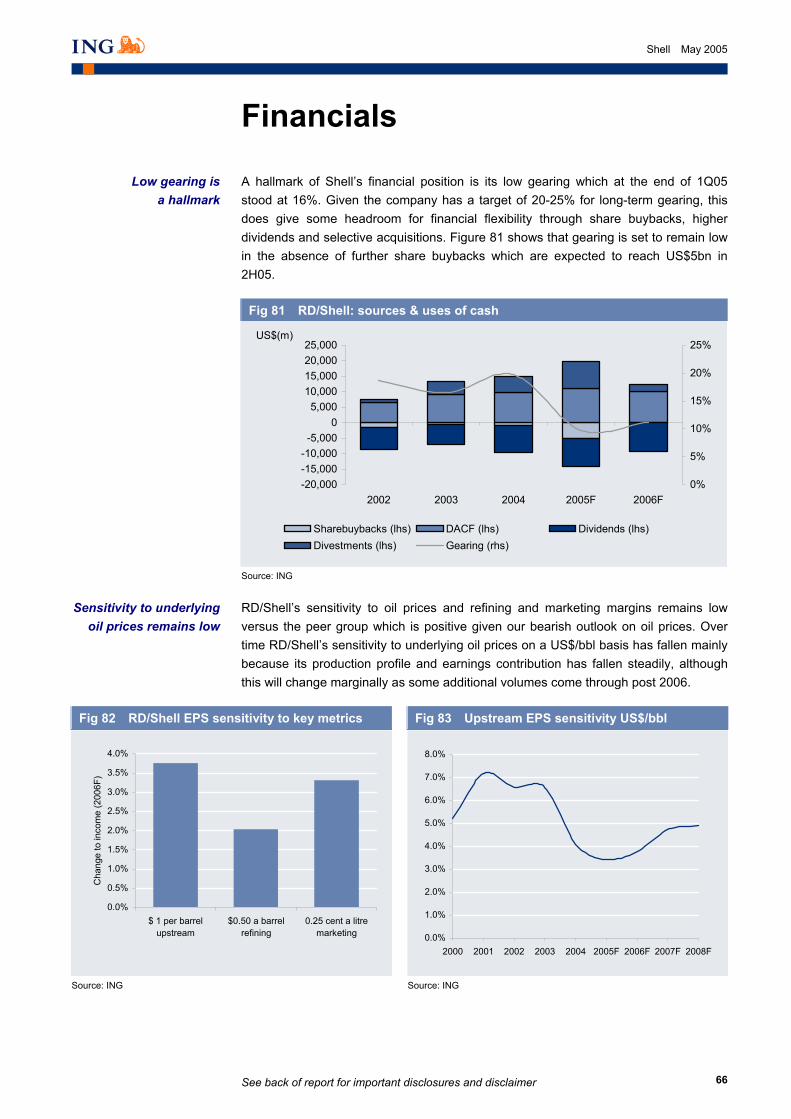
See back of report for important disclosures and disclaimer
66
Shell May 2005
Financials
A hallmark of Shell’s financial position is its low gearing which at the end of 1Q05 stood at 16%. Given the company has a target of 20-25% for long-term gearing, this does give some headroom for financial flexibility through share buybacks, higher dividends and selective acquisitions. Figure 81 shows that gearing is set to remain low in the absence of further share buybacks which are expected to reach US$5bn in 2H05.
Fig 81 RD/Shell: sources & uses of cash
-20,000-15,000-10,000-5,000
05,000
10,00015,00020,00025,000
2002 2003 2004 2005F 2006F
US$(m)
0%
5%
10%
15%
20%
25%
Sharebuybacks (lhs) DACF (lhs) Dividends (lhs)Divestments (lhs) Gearing (rhs)
Source: ING
_
RD/Shell’s sensitivity to oil prices and refining and marketing margins remains low versus the peer group which is positive given our bearish outlook on oil prices. Over time RD/Shell’s sensitivity to underlying oil prices on a US$/bbl basis has fallen mainly because its production profile and earnings contribution has fallen steadily, although this will change marginally as some additional volumes come through post 2006.
Fig 82 RD/Shell EPS sensitivity to key metrics
Fig 83 Upstream EPS sensitivity US$/bbl
0.0%
0.5%
1.0%
1.5%
2.0%
2.5%
3.0%
3.5%
4.0%
$ 1 per barrelupstream
$0.50 a barrelrefining
0.25 cent a litremarketing
Cha
nge
to in
com
e (2
006F
)
0.0%
1.0%
2.0%
3.0%
4.0%
5.0%
6.0%
7.0%
8.0%
2000 2001 2002 2003 2004 2005F 2006F 2007F 2008F
Source: ING Source: ING
_
Low gearing is a hallmark
Sensitivity to underlying oil prices remains low
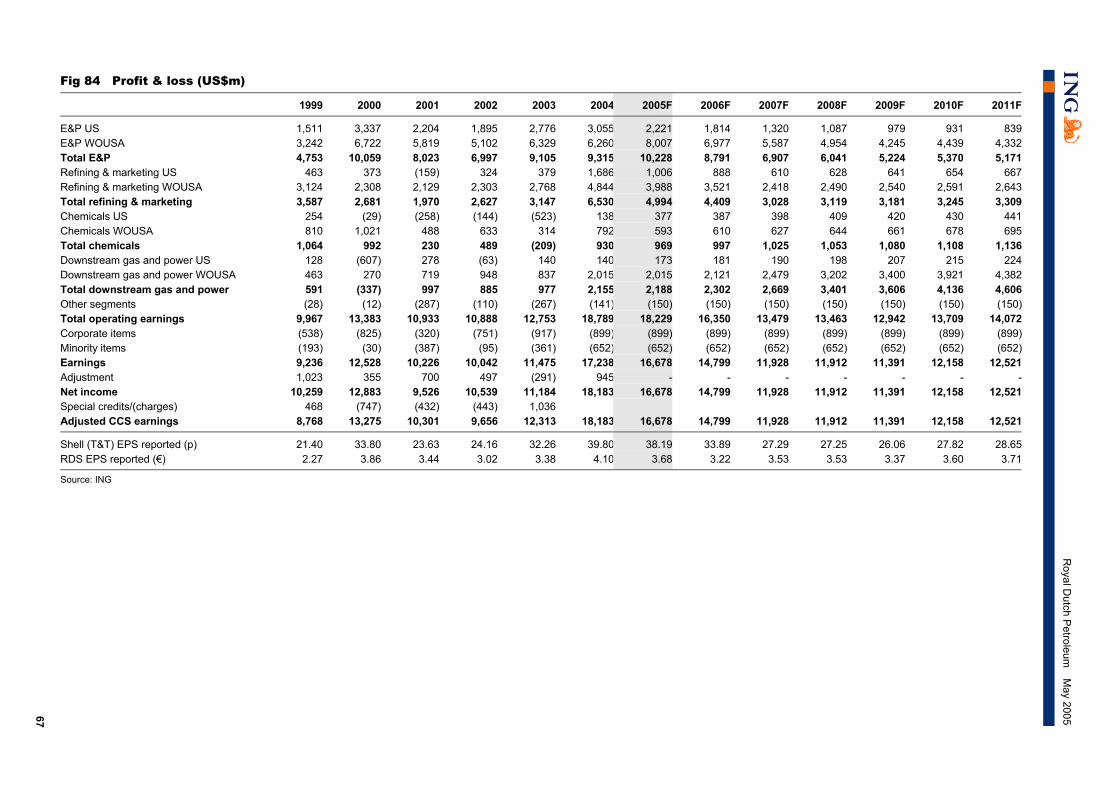
67
Royal D
utch Petroleum
May 2005
Fig 84 Profit & loss (US$m)
1999 2000 2001 2002 2003 2004 2005F 2006F 2007F 2008F 2009F 2010F 2011F
E&P US 1,511 3,337 2,204 1,895 2,776 3,055 2,221 1,814 1,320 1,087 979 931 839 E&P WOUSA 3,242 6,722 5,819 5,102 6,329 6,260 8,007 6,977 5,587 4,954 4,245 4,439 4,332 Total E&P 4,753 10,059 8,023 6,997 9,105 9,315 10,228 8,791 6,907 6,041 5,224 5,370 5,171 Refining & marketing US 463 373 (159) 324 379 1,686 1,006 888 610 628 641 654 667 Refining & marketing WOUSA 3,124 2,308 2,129 2,303 2,768 4,844 3,988 3,521 2,418 2,490 2,540 2,591 2,643 Total refining & marketing 3,587 2,681 1,970 2,627 3,147 6,530 4,994 4,409 3,028 3,119 3,181 3,245 3,309 Chemicals US 254 (29) (258) (144) (523) 138 377 387 398 409 420 430 441 Chemicals WOUSA 810 1,021 488 633 314 792 593 610 627 644 661 678 695 Total chemicals 1,064 992 230 489 (209) 930 969 997 1,025 1,053 1,080 1,108 1,136 Downstream gas and power US 128 (607) 278 (63) 140 140 173 181 190 198 207 215 224 Downstream gas and power WOUSA 463 270 719 948 837 2,015 2,015 2,121 2,479 3,202 3,400 3,921 4,382 Total downstream gas and power 591 (337) 997 885 977 2,155 2,188 2,302 2,669 3,401 3,606 4,136 4,606 Other segments (28) (12) (287) (110) (267) (141) (150) (150) (150) (150) (150) (150) (150)Total operating earnings 9,967 13,383 10,933 10,888 12,753 18,789 18,229 16,350 13,479 13,463 12,942 13,709 14,072 Corporate items (538) (825) (320) (751) (917) (899) (899) (899) (899) (899) (899) (899) (899)Minority items (193) (30) (387) (95) (361) (652) (652) (652) (652) (652) (652) (652) (652)Earnings 9,236 12,528 10,226 10,042 11,475 17,238 16,678 14,799 11,928 11,912 11,391 12,158 12,521 Adjustment 1,023 355 700 497 (291) 945 - - - - - - -Net income 10,259 12,883 9,526 10,539 11,184 18,183 16,678 14,799 11,928 11,912 11,391 12,158 12,521 Special credits/(charges) 468 (747) (432) (443) 1,036 Adjusted CCS earnings 8,768 13,275 10,301 9,656 12,313 18,183 16,678 14,799 11,928 11,912 11,391 12,158 12,521
Shell (T&T) EPS reported (p) 21.40 33.80 23.63 24.16 32.26 39.80 38.19 33.89 27.29 27.25 26.06 27.82 28.65RDS EPS reported (€) 2.27 3.86 3.44 3.02 3.38 4.10 3.68 3.22 3.53 3.53 3.37 3.60 3.71
Source: ING
_
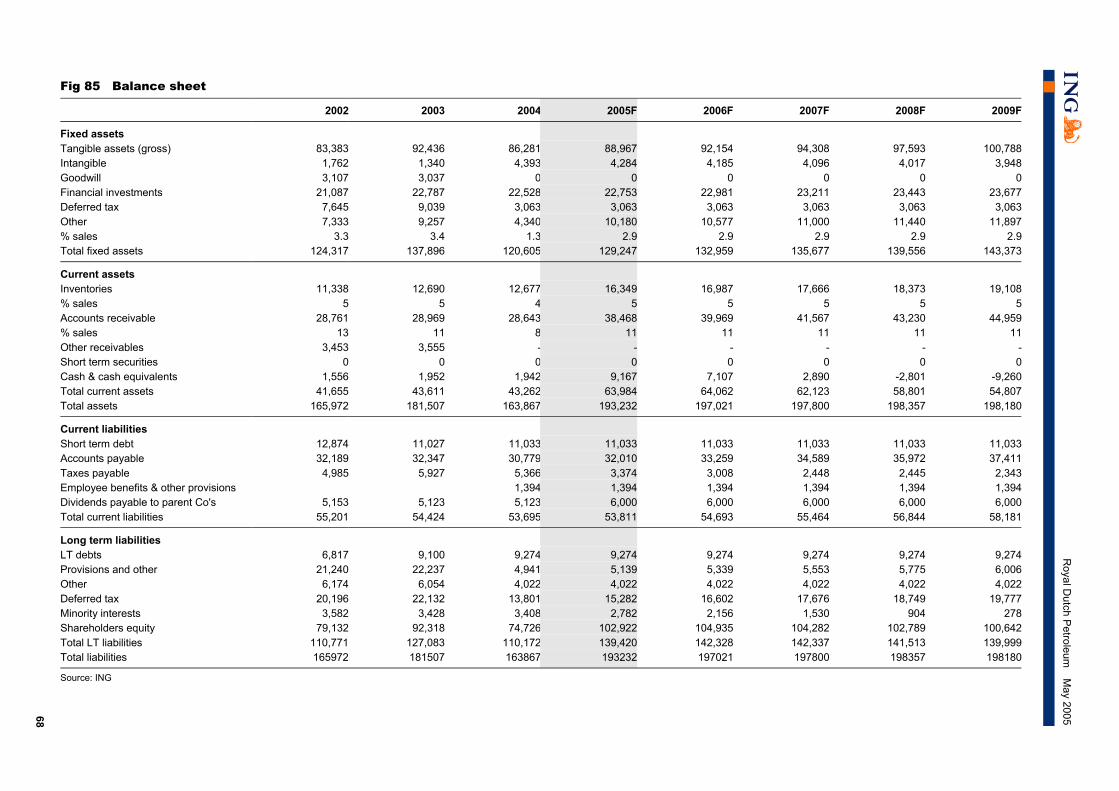
68
Royal D
utch Petroleum
May 2005
Fig 85 Balance sheet
2002 2003 2004 2005F 2006F 2007F 2008F 2009F
Fixed assets Tangible assets (gross) 83,383 92,436 86,281 88,967 92,154 94,308 97,593 100,788Intangible 1,762 1,340 4,393 4,284 4,185 4,096 4,017 3,948Goodwill 3,107 3,037 0 0 0 0 0 0Financial investments 21,087 22,787 22,528 22,753 22,981 23,211 23,443 23,677Deferred tax 7,645 9,039 3,063 3,063 3,063 3,063 3,063 3,063Other 7,333 9,257 4,340 10,180 10,577 11,000 11,440 11,897% sales 3.3 3.4 1.3 2.9 2.9 2.9 2.9 2.9Total fixed assets 124,317 137,896 120,605 129,247 132,959 135,677 139,556 143,373
Current assets Inventories 11,338 12,690 12,677 16,349 16,987 17,666 18,373 19,108% sales 5 5 4 5 5 5 5 5Accounts receivable 28,761 28,969 28,643 38,468 39,969 41,567 43,230 44,959% sales 13 11 8 11 11 11 11 11Other receivables 3,453 3,555 - - - - - -Short term securities 0 0 0 0 0 0 0 0Cash & cash equivalents 1,556 1,952 1,942 9,167 7,107 2,890 -2,801 -9,260Total current assets 41,655 43,611 43,262 63,984 64,062 62,123 58,801 54,807Total assets 165,972 181,507 163,867 193,232 197,021 197,800 198,357 198,180
Current liabilities Short term debt 12,874 11,027 11,033 11,033 11,033 11,033 11,033 11,033Accounts payable 32,189 32,347 30,779 32,010 33,259 34,589 35,972 37,411Taxes payable 4,985 5,927 5,366 3,374 3,008 2,448 2,445 2,343Employee benefits & other provisions 1,394 1,394 1,394 1,394 1,394 1,394Dividends payable to parent Co's 5,153 5,123 5,123 6,000 6,000 6,000 6,000 6,000Total current liabilities 55,201 54,424 53,695 53,811 54,693 55,464 56,844 58,181
Long term liabilities LT debts 6,817 9,100 9,274 9,274 9,274 9,274 9,274 9,274Provisions and other 21,240 22,237 4,941 5,139 5,339 5,553 5,775 6,006Other 6,174 6,054 4,022 4,022 4,022 4,022 4,022 4,022Deferred tax 20,196 22,132 13,801 15,282 16,602 17,676 18,749 19,777Minority interests 3,582 3,428 3,408 2,782 2,156 1,530 904 278Shareholders equity 79,132 92,318 74,726 102,922 104,935 104,282 102,789 100,642Total LT liabilities 110,771 127,083 110,172 139,420 142,328 142,337 141,513 139,999Total liabilities 165972 181507 163867 193232 197021 197800 198357 198180
Source: ING
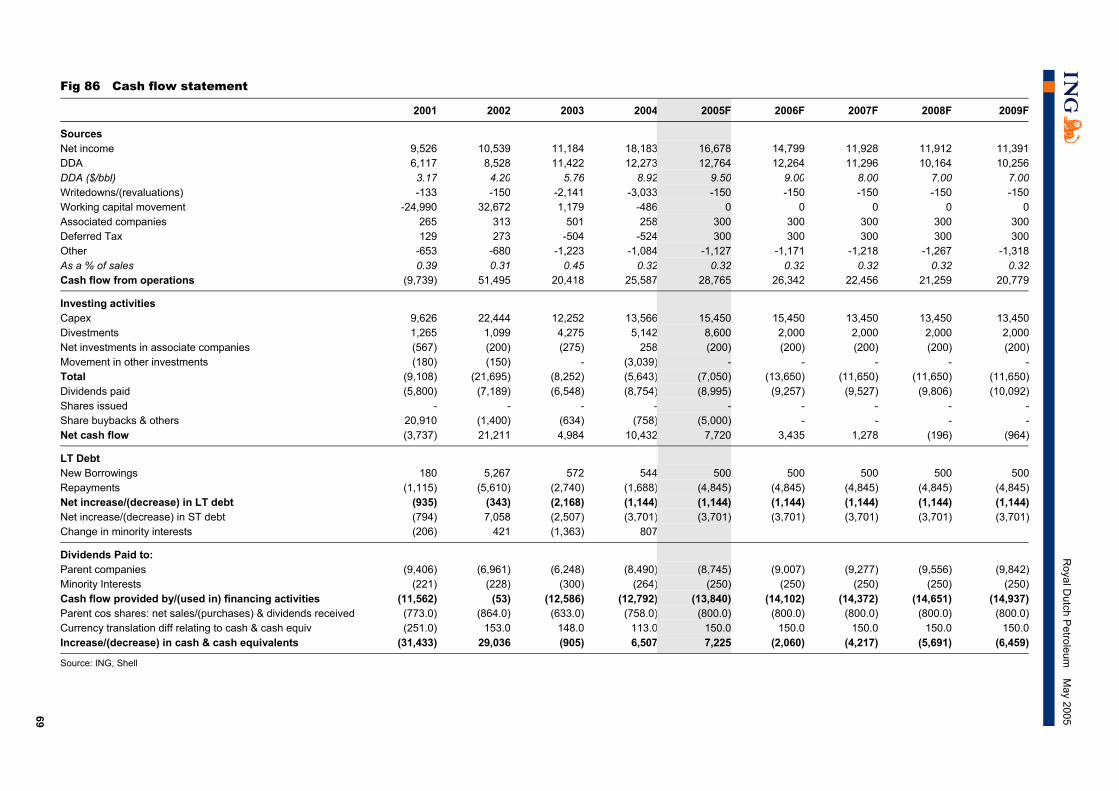
69
Royal D
utch Petroleum
May 2005
_
Fig 86 Cash flow statement
2001 2002 2003 2004 2005F 2006F 2007F 2008F 2009F
Sources Net income 9,526 10,539 11,184 18,183 16,678 14,799 11,928 11,912 11,391DDA 6,117 8,528 11,422 12,273 12,764 12,264 11,296 10,164 10,256DDA ($/bbl) 3.17 4.20 5.76 8.92 9.50 9.00 8.00 7.00 7.00Writedowns/(revaluations) -133 -150 -2,141 -3,033 -150 -150 -150 -150 -150Working capital movement -24,990 32,672 1,179 -486 0 0 0 0 0Associated companies 265 313 501 258 300 300 300 300 300Deferred Tax 129 273 -504 -524 300 300 300 300 300Other -653 -680 -1,223 -1,084 -1,127 -1,171 -1,218 -1,267 -1,318As a % of sales 0.39 0.31 0.45 0.32 0.32 0.32 0.32 0.32 0.32Cash flow from operations (9,739) 51,495 20,418 25,587 28,765 26,342 22,456 21,259 20,779
Investing activities Capex 9,626 22,444 12,252 13,566 15,450 15,450 13,450 13,450 13,450Divestments 1,265 1,099 4,275 5,142 8,600 2,000 2,000 2,000 2,000Net investments in associate companies (567) (200) (275) 258 (200) (200) (200) (200) (200)Movement in other investments (180) (150) - (3,039) - - - - -Total (9,108) (21,695) (8,252) (5,643) (7,050) (13,650) (11,650) (11,650) (11,650)Dividends paid (5,800) (7,189) (6,548) (8,754) (8,995) (9,257) (9,527) (9,806) (10,092)Shares issued - - - - - - - - -Share buybacks & others 20,910 (1,400) (634) (758) (5,000) - - - -Net cash flow (3,737) 21,211 4,984 10,432 7,720 3,435 1,278 (196) (964)
LT Debt New Borrowings 180 5,267 572 544 500 500 500 500 500Repayments (1,115) (5,610) (2,740) (1,688) (4,845) (4,845) (4,845) (4,845) (4,845)Net increase/(decrease) in LT debt (935) (343) (2,168) (1,144) (1,144) (1,144) (1,144) (1,144) (1,144)Net increase/(decrease) in ST debt (794) 7,058 (2,507) (3,701) (3,701) (3,701) (3,701) (3,701) (3,701)Change in minority interests (206) 421 (1,363) 807
Dividends Paid to: Parent companies (9,406) (6,961) (6,248) (8,490) (8,745) (9,007) (9,277) (9,556) (9,842)Minority Interests (221) (228) (300) (264) (250) (250) (250) (250) (250)Cash flow provided by/(used in) financing activities (11,562) (53) (12,586) (12,792) (13,840) (14,102) (14,372) (14,651) (14,937)Parent cos shares: net sales/(purchases) & dividends received (773.0) (864.0) (633.0) (758.0) (800.0) (800.0) (800.0) (800.0) (800.0)Currency translation diff relating to cash & cash equiv (251.0) 153.0 148.0 113.0 150.0 150.0 150.0 150.0 150.0Increase/(decrease) in cash & cash equivalents (31,433) 29,036 (905) 6,507 7,225 (2,060) (4,217) (5,691) (6,459)
Source: ING, Shell
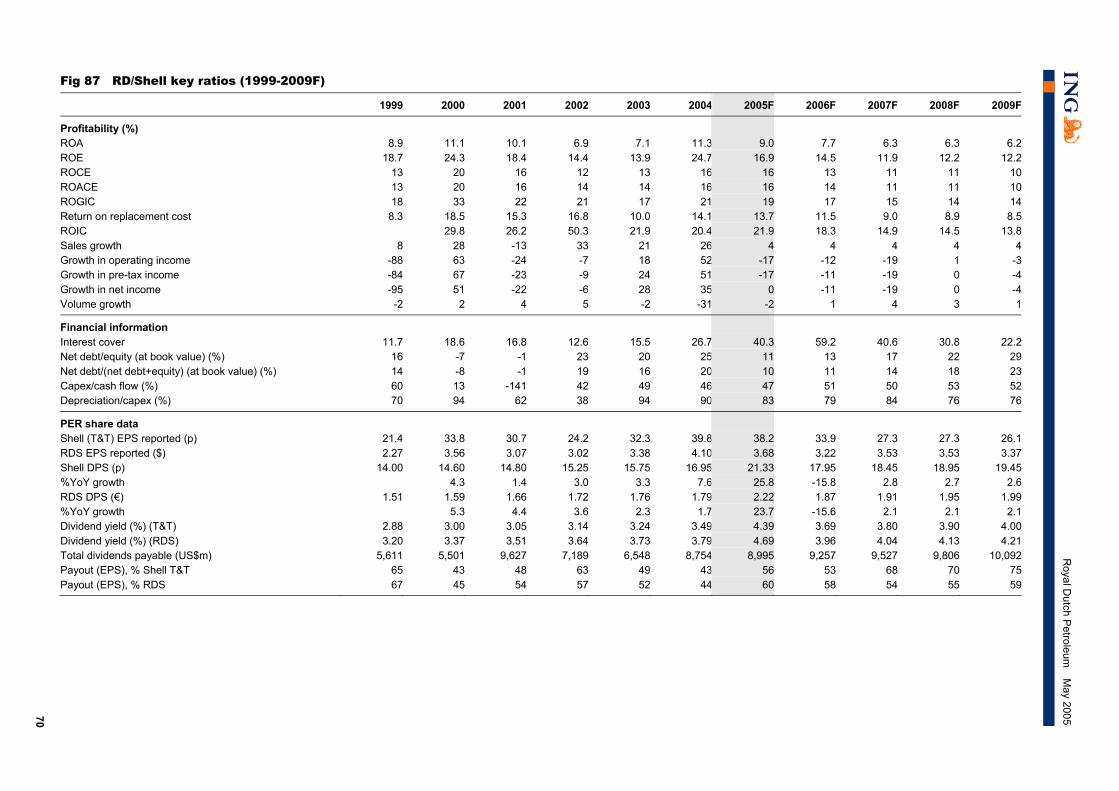
70
Royal D
utch Petroleum
May 2005
Fig 87 RD/Shell key ratios (1999-2009F)
1999 2000 2001 2002 2003 2004 2005F 2006F 2007F 2008F 2009F
Profitability (%) ROA 8.9 11.1 10.1 6.9 7.1 11.3 9.0 7.7 6.3 6.3 6.2ROE 18.7 24.3 18.4 14.4 13.9 24.7 16.9 14.5 11.9 12.2 12.2ROCE 13 20 16 12 13 16 16 13 11 11 10ROACE 13 20 16 14 14 16 16 14 11 11 10ROGIC 18 33 22 21 17 21 19 17 15 14 14Return on replacement cost 8.3 18.5 15.3 16.8 10.0 14.1 13.7 11.5 9.0 8.9 8.5ROIC 29.8 26.2 50.3 21.9 20.4 21.9 18.3 14.9 14.5 13.8Sales growth 8 28 -13 33 21 26 4 4 4 4 4Growth in operating income -88 63 -24 -7 18 52 -17 -12 -19 1 -3Growth in pre-tax income -84 67 -23 -9 24 51 -17 -11 -19 0 -4Growth in net income -95 51 -22 -6 28 35 0 -11 -19 0 -4Volume growth -2 2 4 5 -2 -31 -2 1 4 3 1
Financial information Interest cover 11.7 18.6 16.8 12.6 15.5 26.7 40.3 59.2 40.6 30.8 22.2Net debt/equity (at book value) (%) 16 -7 -1 23 20 25 11 13 17 22 29Net debt/(net debt+equity) (at book value) (%) 14 -8 -1 19 16 20 10 11 14 18 23Capex/cash flow (%) 60 13 -141 42 49 46 47 51 50 53 52Depreciation/capex (%) 70 94 62 38 94 90 83 79 84 76 76
PER share data Shell (T&T) EPS reported (p) 21.4 33.8 30.7 24.2 32.3 39.8 38.2 33.9 27.3 27.3 26.1RDS EPS reported ($) 2.27 3.56 3.07 3.02 3.38 4.10 3.68 3.22 3.53 3.53 3.37Shell DPS (p) 14.00 14.60 14.80 15.25 15.75 16.95 21.33 17.95 18.45 18.95 19.45%YoY growth 4.3 1.4 3.0 3.3 7.6 25.8 -15.8 2.8 2.7 2.6RDS DPS (€) 1.51 1.59 1.66 1.72 1.76 1.79 2.22 1.87 1.91 1.95 1.99%YoY growth 5.3 4.4 3.6 2.3 1.7 23.7 -15.6 2.1 2.1 2.1Dividend yield (%) (T&T) 2.88 3.00 3.05 3.14 3.24 3.49 4.39 3.69 3.80 3.90 4.00Dividend yield (%) (RDS) 3.20 3.37 3.51 3.64 3.73 3.79 4.69 3.96 4.04 4.13 4.21Total dividends payable (US$m) 5,611 5,501 9,627 7,189 6,548 8,754 8,995 9,257 9,527 9,806 10,092Payout (EPS), % Shell T&T 65 43 48 63 49 43 56 53 68 70 75Payout (EPS), % RDS 67 45 54 57 52 44 60 58 54 55 59
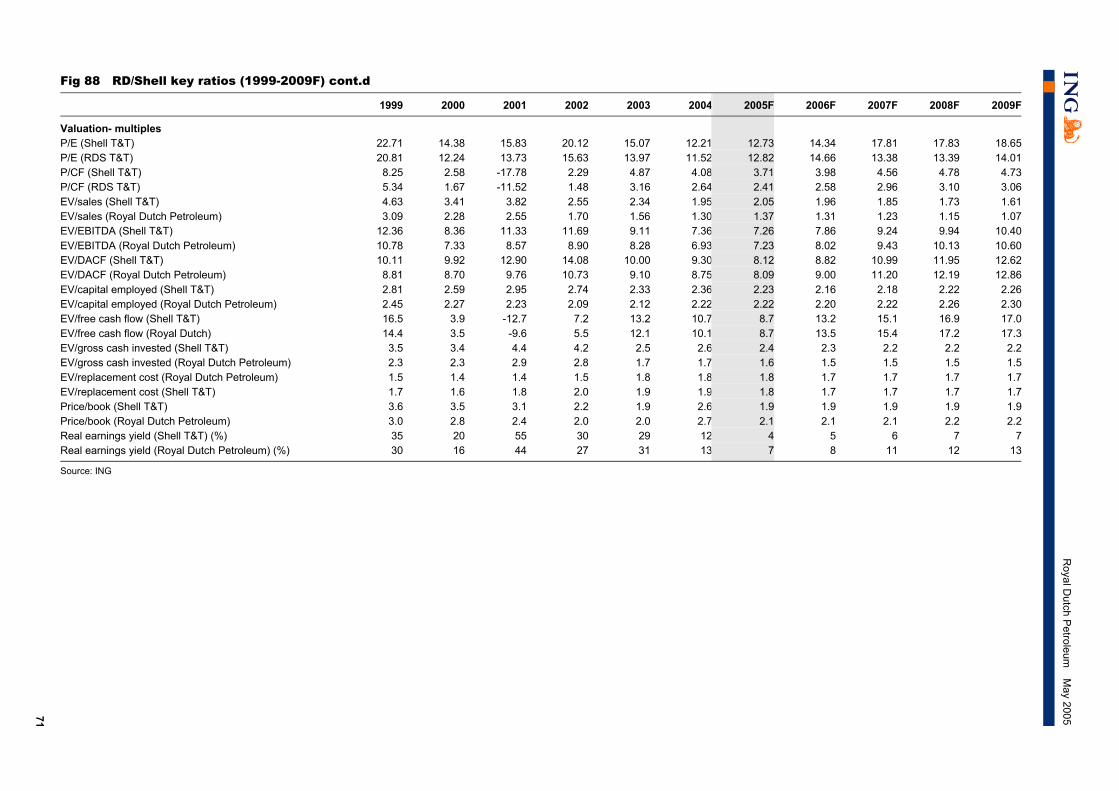
71
Royal D
utch Petroleum
May 2005
Fig 88 RD/Shell key ratios (1999-2009F) cont.d
1999 2000 2001 2002 2003 2004 2005F 2006F 2007F 2008F 2009F
Valuation- multiples P/E (Shell T&T) 22.71 14.38 15.83 20.12 15.07 12.21 12.73 14.34 17.81 17.83 18.65P/E (RDS T&T) 20.81 12.24 13.73 15.63 13.97 11.52 12.82 14.66 13.38 13.39 14.01P/CF (Shell T&T) 8.25 2.58 -17.78 2.29 4.87 4.08 3.71 3.98 4.56 4.78 4.73P/CF (RDS T&T) 5.34 1.67 -11.52 1.48 3.16 2.64 2.41 2.58 2.96 3.10 3.06EV/sales (Shell T&T) 4.63 3.41 3.82 2.55 2.34 1.95 2.05 1.96 1.85 1.73 1.61EV/sales (Royal Dutch Petroleum) 3.09 2.28 2.55 1.70 1.56 1.30 1.37 1.31 1.23 1.15 1.07EV/EBITDA (Shell T&T) 12.36 8.36 11.33 11.69 9.11 7.36 7.26 7.86 9.24 9.94 10.40EV/EBITDA (Royal Dutch Petroleum) 10.78 7.33 8.57 8.90 8.28 6.93 7.23 8.02 9.43 10.13 10.60EV/DACF (Shell T&T) 10.11 9.92 12.90 14.08 10.00 9.30 8.12 8.82 10.99 11.95 12.62EV/DACF (Royal Dutch Petroleum) 8.81 8.70 9.76 10.73 9.10 8.75 8.09 9.00 11.20 12.19 12.86EV/capital employed (Shell T&T) 2.81 2.59 2.95 2.74 2.33 2.36 2.23 2.16 2.18 2.22 2.26EV/capital employed (Royal Dutch Petroleum) 2.45 2.27 2.23 2.09 2.12 2.22 2.22 2.20 2.22 2.26 2.30EV/free cash flow (Shell T&T) 16.5 3.9 -12.7 7.2 13.2 10.7 8.7 13.2 15.1 16.9 17.0EV/free cash flow (Royal Dutch) 14.4 3.5 -9.6 5.5 12.1 10.1 8.7 13.5 15.4 17.2 17.3EV/gross cash invested (Shell T&T) 3.5 3.4 4.4 4.2 2.5 2.6 2.4 2.3 2.2 2.2 2.2EV/gross cash invested (Royal Dutch Petroleum) 2.3 2.3 2.9 2.8 1.7 1.7 1.6 1.5 1.5 1.5 1.5EV/replacement cost (Royal Dutch Petroleum) 1.5 1.4 1.4 1.5 1.8 1.8 1.8 1.7 1.7 1.7 1.7EV/replacement cost (Shell T&T) 1.7 1.6 1.8 2.0 1.9 1.9 1.8 1.7 1.7 1.7 1.7Price/book (Shell T&T) 3.6 3.5 3.1 2.2 1.9 2.6 1.9 1.9 1.9 1.9 1.9Price/book (Royal Dutch Petroleum) 3.0 2.8 2.4 2.0 2.0 2.7 2.1 2.1 2.1 2.2 2.2Real earnings yield (Shell T&T) (%) 35 20 55 30 29 12 4 5 6 7 7Real earnings yield (Royal Dutch Petroleum) (%) 30 16 44 27 31 13 7 8 11 12 13
Source: ING
_
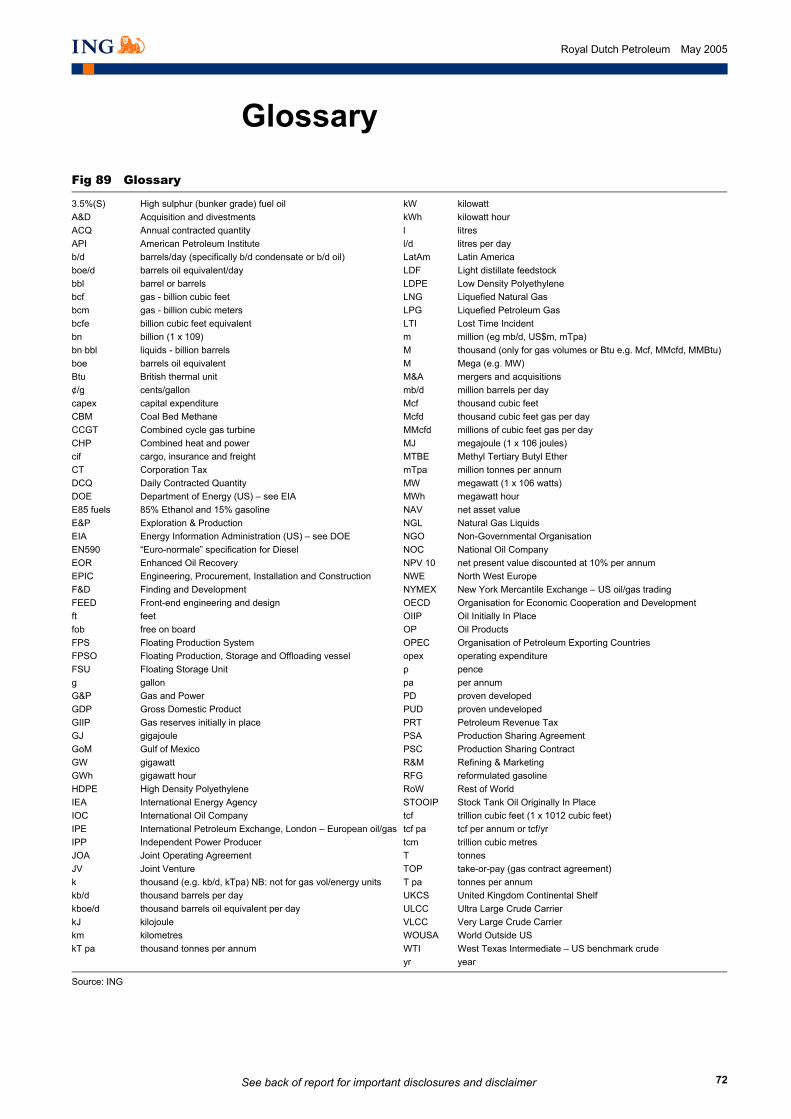
See back of report for important disclosures and disclaimer
72
Royal Dutch Petroleum May 2005
Glossary
Fig 89 Glossary
3.5%(S) High sulphur (bunker grade) fuel oil kW kilowatt A&D Acquisition and divestments kWh kilowatt hour ACQ Annual contracted quantity l litres API American Petroleum Institute l/d litres per day b/d barrels/day (specifically b/d condensate or b/d oil) LatAm Latin America boe/d barrels oil equivalent/day LDF Light distillate feedstock bbl barrel or barrels LDPE Low Density Polyethylene bcf gas - billion cubic feet LNG Liquefied Natural Gas bcm gas - billion cubic meters LPG Liquefied Petroleum Gas bcfe billion cubic feet equivalent LTI Lost Time Incident bn billion (1 x 10⁹) m million (eg mb/d, US$m, mTpa) bn bbl liquids - billion barrels M thousand (only for gas volumes or Btu e.g. Mcf, MMcfd, MMBtu) boe barrels oil equivalent M Mega (e.g. MW) Btu British thermal unit M&A mergers and acquisitions ¢/g cents/gallon mb/d million barrels per day capex capital expenditure Mcf thousand cubic feet CBM Coal Bed Methane Mcfd thousand cubic feet gas per day CCGT Combined cycle gas turbine MMcfd millions of cubic feet gas per day CHP Combined heat and power MJ megajoule (1 x 10⁶ joules) cif cargo, insurance and freight MTBE Methyl Tertiary Butyl Ether CT Corporation Tax mTpa million tonnes per annum DCQ Daily Contracted Quantity MW megawatt (1 x 10⁶ watts) DOE Department of Energy (US) – see EIA MWh megawatt hour E85 fuels 85% Ethanol and 15% gasoline NAV net asset value E&P Exploration & Production NGL Natural Gas Liquids EIA Energy Information Administration (US) – see DOE NGO Non-Governmental Organisation EN590 “Euro-normale” specification for Diesel NOC National Oil Company EOR Enhanced Oil Recovery NPV 10 net present value discounted at 10% per annum EPIC Engineering, Procurement, Installation and Construction NWE North West Europe F&D Finding and Development NYMEX New York Mercantile Exchange – US oil/gas trading FEED Front-end engineering and design OECD Organisation for Economic Cooperation and Development ft feet OIIP Oil Initially In Place fob free on board OP Oil Products FPS Floating Production System OPEC Organisation of Petroleum Exporting Countries FPSO Floating Production, Storage and Offloading vessel opex operating expenditure FSU Floating Storage Unit p pence g gallon pa per annum G&P Gas and Power PD proven developed GDP Gross Domestic Product PUD proven undeveloped GIIP Gas reserves initially in place PRT Petroleum Revenue Tax GJ gigajoule PSA Production Sharing Agreement GoM Gulf of Mexico PSC Production Sharing Contract GW gigawatt R&M Refining & Marketing GWh gigawatt hour RFG reformulated gasoline HDPE High Density Polyethylene RoW Rest of World IEA International Energy Agency STOOIP Stock Tank Oil Originally In Place IOC International Oil Company tcf trillion cubic feet (1 x 10¹² cubic feet) IPE International Petroleum Exchange, London – European oil/gas tcf pa tcf per annum or tcf/yr IPP Independent Power Producer tcm trillion cubic metres JOA Joint Operating Agreement T tonnes JV Joint Venture TOP take-or-pay (gas contract agreement) k thousand (e.g. kb/d, kTpa) NB: not for gas vol/energy units T pa tonnes per annum kb/d thousand barrels per day UKCS United Kingdom Continental Shelf kboe/d thousand barrels oil equivalent per day ULCC Ultra Large Crude Carrier kJ kilojoule VLCC Very Large Crude Carrier km kilometres WOUSA World Outside US kT pa thousand tonnes per annum WTI West Texas Intermediate – US benchmark crude yr year
Source: ING
_
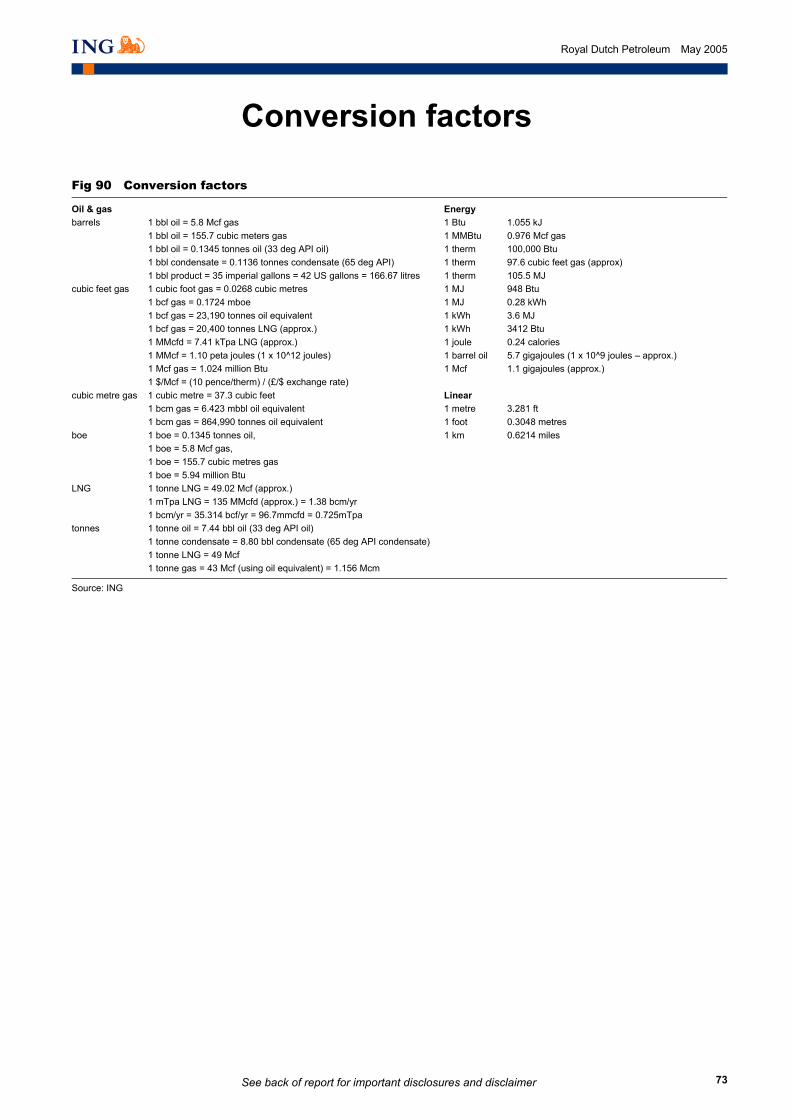
See back of report for important disclosures and disclaimer
73
Royal Dutch Petroleum May 2005
Conversion factors
Fig 90 Conversion factors
Oil & gas Energy barrels 1 bbl oil = 5.8 Mcf gas 1 Btu 1.055 kJ 1 bbl oil = 155.7 cubic meters gas 1 MMBtu 0.976 Mcf gas 1 bbl oil = 0.1345 tonnes oil (33 deg API oil) 1 therm 100,000 Btu 1 bbl condensate = 0.1136 tonnes condensate (65 deg API) 1 therm 97.6 cubic feet gas (approx) 1 bbl product = 35 imperial gallons = 42 US gallons = 166.67 litres 1 therm 105.5 MJ cubic feet gas 1 cubic foot gas = 0.0268 cubic metres 1 MJ 948 Btu 1 bcf gas = 0.1724 mboe 1 MJ 0.28 kWh 1 bcf gas = 23,190 tonnes oil equivalent 1 kWh 3.6 MJ 1 bcf gas = 20,400 tonnes LNG (approx.) 1 kWh 3412 Btu 1 MMcfd = 7.41 kTpa LNG (approx.) 1 joule 0.24 calories 1 MMcf = 1.10 peta joules (1 x 10^12 joules) 1 barrel oil 5.7 gigajoules (1 x 10^9 joules – approx.) 1 Mcf gas = 1.024 million Btu 1 Mcf 1.1 gigajoules (approx.) 1 $/Mcf = (10 pence/therm) / (£/$ exchange rate) cubic metre gas 1 cubic metre = 37.3 cubic feet Linear 1 bcm gas = 6.423 mbbl oil equivalent 1 metre 3.281 ft 1 bcm gas = 864,990 tonnes oil equivalent 1 foot 0.3048 metres boe 1 boe = 0.1345 tonnes oil, 1 km 0.6214 miles 1 boe = 5.8 Mcf gas, 1 boe = 155.7 cubic metres gas 1 boe = 5.94 million Btu LNG 1 tonne LNG = 49.02 Mcf (approx.) 1 mTpa LNG = 135 MMcfd (approx.) = 1.38 bcm/yr 1 bcm/yr = 35.314 bcf/yr = 96.7mmcfd = 0.725mTpa tonnes 1 tonne oil = 7.44 bbl oil (33 deg API oil) 1 tonne condensate = 8.80 bbl condensate (65 deg API condensate) 1 tonne LNG = 49 Mcf 1 tonne gas = 43 Mcf (using oil equivalent) = 1.156 Mcm
Source: ING
_
_
See back of report for important disclosures and disclaimer
74
Royal Dutch Petroleum May 2005
Disclosures Appendix ANALYST CERTIFICATION The analyst(s) who prepared this report hereby certifies that the views expressed in this report accurately reflect his/her personal views about the subject securities or issuers and no part of his/her compensation was, is, or will be directly or indirectly related to the inclusion of specific recommendations or views in this report.
IMPORTANT DISCLOSURES For disclosures on companies other than the subject companies of this report visit our disclosures page at http://research.ing.com or write to The Compliance Department, ING Financial Markets LLC, 1325 Avenue of the Americas, New York, USA, 10019.
US regulatory disclosures Valuation and risks: For details of the valuation methodologies used to determine our price targets and risks related to the achievement of these targets refer to the main body of this report and/or the most recent company report available at http://research.ing.com.
Additional European regulatory disclosures ING Group trades in the shares of the company/ies covered in this publication.
RATING DISTRIBUTION RATING DEFINITIONS: WESTERN EUROPE
Equity coverage Investment Banking clients*
Buy 37% 20%Hold 53% 20%Sell 10% 22% 100% * Percentage of companies in each rating category that are Investment Banking clients of ING Financial Markets LLC or an affiliate.
In line with NYSE/NASD disclosure requirements, the Strong Buy recommendation used in the Western European universe has been included in the Buy category for the purposes of this breakdown.
Strong Buy: Stocks with a forecast 12-month local currency absolute return to target price of greater than +25%.
Buy: Stocks with a forecast 12-month local currency absolute return to target price of greater than +10%.
Hold: Stocks with a forecast 12-month local currency absolute return to target price of between +10% and -10%.
Sell: Stocks with a forecast 12-month local currency absolute return to target price of lower than -10%.
.
_
See back of report for important disclosures and disclaimer
75
Royal Dutch Petroleum May 2005
Oil & gas team
Research
Jason Kenney 44 131 527 3024 [email protected] Edinburgh Harold Hutchinson 44 20 7767 6055 [email protected] London Angus McPhail 44 131 527 3029 [email protected] Edinburgh
Specialist sales Robert Klijn 31 20 563 80 86 [email protected] Amsterdam Bassem Daher 33 1 56 39 45 39 [email protected] Paris
Sales desks
Amsterdam 31 20 563 80 80 Brussels 32 2 547 13 70 Edinburgh 44 131 527 3000 Geneva 41 22 593 80 50 London 44 20 7767 8954 Madrid 34 91 789 8888 Milan 39 02 89629 3660 Paris 33 1 55 68 45 00
iiiiil EQUITY MARKETS
Oil & Gas Western Europe
Reserves no longer an issue but volumes modest ◆
Return to fundamental valuation expected post unification ◆
No real catalysts for growth until 2007/2008 ◆
Angus McPhail(44 131) 527 [email protected]
Jason Kenney(44 131) 527 [email protected]
ShellThe long journey
May 2005
Sh
ell
May 2005
SEE THE DISCLOSURES APPENDIX FOR IMPORTANT DISCLOSURES AND ANALYST CERTIFICATION
AMSTERDAM BRUSSELS LONDON NEW YORK SINGAPORE Foppingadreef 7 Amsterdam Netherlands 1102BD
Avenue Marnix 24 Brussels Belgium B-1000
60 London Wall London United Kingdom EC2M 5TQ
1325 Avenue of the Americas New York USA 10019
19/F Republic Plaza, 9 Raffles Place, #19-02, Singapore 048619
Tel: 31 20 563 87 98 Tel: 32 2 557 10 26 Tel: 44 20 7767 1000 Tel: 1 646 424 6000 Tel: 65 6535 3688
BRATISLAVA
Tel: 421 2 5934 61 11
BUCHAREST
Tel: 40 21 222 1600
BUDAPEST
Tel: 36 1 268 0140
BUENOS AIRES
Tel: 54 11 4310 4700
DUBLIN
Tel: 353 1 638 4000
EDINBURGH
Tel: 44 131 527 3000
GENEVA
Tel: 41 22 593 8050
HONG KONG
Tel: 852 2848 8488
ISTANBUL
Tel: 90 212 258 8770
KIEV
Tel: 380 44 230 3030
MADRID
Tel: 34 91 789 8880
MANILA
Tel: 632 840 8888
MEXICO CITY
Tel: 52 55 5258 2000
MILAN
Tel: 39 02 89629 3660
MOSCOW
Tel: 7095 755 5400
PARIS
Tel: 33 1 56 39 31 41
PRAGUE
Tel: 420 2 5747 1111
SANTIAGO
Tel: 562 452 2700
SAO PAULO
Tel: 55 11 4504 6000
SEOUL
Tel: 822 317 1500
SHANGHAI
Tel: 86 21 6841 3355
SOFIA
Tel: 359 2 917 6400
TAIPEI
Tel: 886 2 2734 7500
TOKYO
Tel: 813 5210 1500
WARSAW
Tel: 48 22 820 5018
Disclaimer This publication has been prepared on behalf of ING (being for this purpose the wholesale and investment banking business of ING Bank NV and certain of its subsidiary companies) solely for the information of its clients. ING forms part of ING Group (being for this purpose ING Groep NV and its subsidiary and affiliated companies). It is not investment advice or an offer or solicitation for the purchase or sale of any financial instrument. While reasonable care has been taken to ensure that the information contained herein is not untrue or misleading at the time of publication, ING makes no representation that it is accurate or complete. The information contained herein is subject to change without notice. ING Group and any of its officers, employees, related and discretionary accounts may, to the extent not disclosed above and to the extent permitted by law, have long or short positions or may otherwise be interested in any transactions or investments (including derivatives) referred to in this publication. In addition, ING Group may provide banking, insurance or asset management services for, or solicit such business from, any company referred to in this publication. Neither ING nor any of its officers or employees accepts any liability for any direct or consequential loss arising from any use of this publication or its contents. Copyright and database rights protection exists in this publication and it may not be reproduced, distributed or published by any person for any purpose without the prior express consent of ING. All rights are reserved.
Any investments referred to herein may involve significant risk, are not necessarily available in all jurisdictions, may be illiquid and may not be suitable for all investors. The value of, or income from, any investments referred to herein may fluctuate and/or be affected by changes in exchange rates. Past performance is not indicative of future results. Investors should make their own investment decisions without relying on this publication. Only investors with sufficient knowledge and experience in financial matters to evaluate the merits and risks should consider an investment in any issuer or market discussed herein and other persons should not take any action on the basis of this publication. This publication is issued:1) in the United Kingdom only to persons described in Articles 19, 47 and 49 of the Financial Services and Markets Act 2000 (Financial Promotion) Order 2001 and is not intended to be distributed, directly or indirectly, to any other class of persons (including private investors); 2) in Italy only to persons described in Article No. 31 of Consob Regulation No. 11522/98.Clients should contact analysts at, and execute transactions through, an ING entity in their home jurisdiction unless governing law permits otherwise.
ING Bank N.V., London branch is authorised by the Dutch Central Bank and regulated by the Financial Services Authority for the conduct of UK business. It is incorporated in the Netherlands and its London branch is registered in the UK (number BR000341) at 60 London Wall, London EC2M 5TQ. ING Financial Markets LLC, which is a member of the NYSE, NASD and SIPC and part of ING, has accepted responsibility for the distribution of this report in the United States under applicable requirements.
This document is classified as UK Independent Research as defined in the ING Bank London Branch Research policy drawn up in accordance with FSA Rule COB 7.16.5R (2).
EQ_UK IND Additional information is available on request