shifting attention: modeling follower 7 relationship...
TRANSCRIPT

93Social Network Analysis of Disaster Response, Recovery, and Adaptation. http://dx.doi.org/10.1016/B978-0-12-805196-2.00007-8Copyright © 2017 Elsevier Inc. All rights reserved.
CHAPTER
SHIFTING ATTENTION: MODELING FOLLOWER RELATIONSHIP DYNAMICS AMONG US EMERGENCY MANAGEMENT-RELATED ORGANIZATIONS DURING A COLORADO WILDFIRE
Zack W. Almquist1,2, Emma S. Spiro2, Carter T. Butts3
1University of Minnesota, Minneapolis, MN, United States; 2University of Washington, Seattle, WA, United States; 3University of California, Irvine, CA, United States
7
CHAPTER OUTLINE
Introduction ............................................................................................................................................ 94Literature Review .................................................................................................................................... 95Mechanisms of Attentional Interaction During a Disaster ........................................................................... 97Data ....................................................................................................................................................... 98
The Dynamic Network ............................................................................................................ 98Disaster Case Study: Colorado Duckett Fire ............................................................................ 102
Methods ...............................................................................................................................................103Notation ............................................................................................................................. 103Dynamic Network Regression ................................................................................................ 105Mechanisms of Attentional Dynamics .................................................................................... 105
Base Rate of Attending ...............................................................................................................106Inertia ........................................................................................................................................106Homophily ..................................................................................................................................106Shared Partners .........................................................................................................................106Transitivity ..................................................................................................................................106Popularity and Activity ................................................................................................................106Reciprocity .................................................................................................................................106Seasonality .................................................................................................................................107Hazard Event Effects ..................................................................................................................107

CHAPTER 7 MODELING FOLLOWER RELATIONSHIP DYNAMICS94
Results .................................................................................................................................................107Interpretation ...................................................................................................................... 107
Discussion ............................................................................................................................................109Summary ..............................................................................................................................................111Acknowledgments .................................................................................................................................112
INTRODUCTIONEmergency management organizations rarely act in a vacuum: both governmental and nongovern-mental organizations look to one another for topical information and practical guidance in both routine and nonroutine settings (Comfort et al., 2004; Drabek & McEntire, 2002). The most basic manifestation of this interaction is attention; that is, a systematic effort on the part of one organiza-tion to observe the actions of and/or to receive information from another. Attentional relationships may be particularly important as conduits for information diffusion during crisis events, and for the diffusion of organizational routines, practices, and standards during periods of routine operations (DiMaggio & Powell, 1983; Reeder et al., 2014). When visible to third parties, attentional relationships may also have a signaling function, indicating a form of affiliation between attender and attendee to third parties (Kwak et al., 2010). For example, if a federal agency begins to follow a local agency, then it may be perceived by the populace that the local agency has federal support or affiliation.
In contrast to realized communication relationships, attentional relationships reflect the potential for information transmission and hence are potentially useful for probing the structure of opportunities for interorganizational information flow net of sender behavior; likewise, they can indicate pathways through which information may flow to a receiving organization without a deliberate effort on the part of the sending organization to target it (e.g., by the attender observing actions taken or generalized announcements made by the attendee).
Despite their importance, attentional relationships have been historically difficult to study. This has been due in large part to the difficulty of measuring who is attending to whom, as retrospective surveys of organizational informants and archival materials can provide only limited evidence regarding attentional relationships. The expansion of organizational activities into the online domain provides a remarkable opportunity to study these otherwise elusive networks, due to the fact that certain computer-mediated communication systems record attentional relationships as a side effect of their operation. Records of relationships derived from these sources provide a unique window into the process by which organizations form and dissolve attentional relationships over time, at least within particular settings.
One such setting in which organizations directly and publicly articulate attentional relationships is Twitter, a popular microblogging service that has seen increasing emergency management pres-ence and utilization during both routine conditions and crisis events. Prior work exploring the use of social media, specifically Twitter, during emergency contexts has primarily focused on its facilitation of rapid information dissemination and transmission, as well as its capacity to support collective sense-making processes and rumoring (e.g., Spiro et al., 2012; Sutton, 2010; Sutton et al., 2014). Other work has also looked at its affordances for digital volunteerism and situational awareness enhancement (e.g., Starbird & Palen, 2011; Vieweg et al., 2010). However, little of this work has

95 LITERATURE REVIEW
investigated the activities of emergency response organizations themselves in this context (some exceptions being Hughes et al., 2014; Reeder et al., 2014). Even less research has sought to under-stand the evolving landscape of attentional relationships among organizations as they seek to access and provide information to each other and to the public at large (an early example being Sutton et al., 2012). To date, no work exists that examines online attentional relationships and resulting informa-tion flow among emergency management organizations over an extended period of time, and that systematically probes the mechanisms governing tie formation and dissolution.
We address this gap by employing a dynamic network logistic regression (DNR) modeling approach to uncover the mechanisms that govern the evolving follower (i.e., subscription) relationships among a set of United States (US) emergency management-related organizations (federal and state levels) on Twitter over an extended period. DNR allows us the ability to directly model the temporal relationship of historical interactions—e.g., preferential attachment—to understand and predict future interactions; for complete details see Almquist and Butts (2013, 2014b). Here, we relate features of organizations’ temporally evolving structural positions within a social network to their public information exchange patterns and directly estimate the effect of disaster events on regional Twitter feeds. Our analysis pro-vides a first look at the factors that drive the allocation of attention among emergency management organizations in the online domain.
Below, we review past work on the use of Twitter during crisis situations. We then discuss the data and methods employed in our analysis, followed by a summary of our empirical findings. Finally, we conclude with a discussion of the implications of this work for disaster management.
LITERATURE REVIEWDisasters serve as extreme and dangerous disruptions of commonplace life. These disruptions can, among other things, inhibit the functioning of existing support networks, communication networks, and other infrastructures. This has led to a large and growing literature on the importance of social network theory and methods to the application of disaster research. This work includes the study of communica-tion networks during disaster (e.g., Butts, 2008a; Smith & Simpson, 2009; Sutton et al., 2012, 2014); research into the effects and importance of social support during and after disasters (e.g., Jones et al., 2013; Mathbor, 2007); and this research area has further explored the importance and multifaceted effects of social networks on disaster relief and management (e.g., Hamra et al., 2012; Marcum et al., 2012). In this chapter we focus on the importance of attentional dynamics in a disaster setting by response organizations and explore how modern technology can enhance the current state of the art in research in this area of study.
Social media and the online environment have radically changed the ways in which public offi-cials, organizations, and individuals engage in conveying warnings, alerts, and other information, and in coordinating task performance during both routine periods and disaster events (Kavanaugh et al., 2011; Palen, Vieweg, & Sutton, 2007). While it is true that traditional communications methods such as television and radio remain essential for engaging the public at large, these channels restrict communication to be largely broadcast in nature and are controlled by a small number of major private media outlets. Online communications methods, on the other hand, allow for more flexible dissemination strategies; these channels often allow for two-way communication in addition to rela-tively low-cost broadcast dissemination, give the sending organization direct control over message

CHAPTER 7 MODELING FOLLOWER RELATIONSHIP DYNAMICS96
timing and content, and can be updated in near real time (Bruns et al., 2011). Moreover, in the case of social media, retransmission mechanisms are typically built directly into the communication infrastructure. These encourage individuals to repost content to other users, facilitating information diffusion via the underlying social network (Sutton et al., 2014, 2015a,b). As a result, social media and other Internet-based communication channels offer an increasingly attractive option for reaching at-risk populations before, during, and after emergencies or disaster related events (Sutton et al., 2012).
Emergency management organizations have recognized the potential of these new communication platforms and now actively use these tools during crisis events (Hughes et al., 2014, e.g., the Federal Emergency Management Agency (FEMA) follows or retweets a hazard event and then local agencies notice the signal and begin following or retweeting current messages). Despite this recognition, how-ever, governmental emergency management organizations are still learning how to best make use of these new channels for crisis communication and disaster response. Research on the use of social media platforms during crisis has argued that most organizational engagement with social media to date can be viewed as falling into two broad categories: first, these platforms can be used to disseminate infor-mation; and second, online communication infrastructure can be used as a management tool itself (e.g., to receive victim requests for assistance) (Lindsay, 2011). This division omits a third role of social media platforms as tools for information collection and improved situational awareness (Mehrotra et al., 2004). The attentional side of social media use also extends to organizations employing feedback from users to alter their own communication patterns. In recent work documenting the 2012 Hurricane Sandy response online, for instance, researchers found that some emergency responders adapted their social media protocols over the course of the event—altering their behavior from a purely broadcast paradigm to acknowledging requests for help, while simultaneously trying to reinforce the use of offi-cial channels for aid requests (Hughes et al., 2014). As the Sandy case indicates, prior work suggests a mismatch between use of social media platforms by public officials and the expectations for their use held by the general public. Government command-and-control protocols rarely integrate seamlessly with social media, leading to legal barriers, insufficient use of resources, and lack of training by com-municators—all of which can prevent emergency responders from effectively engaging with those in need via social media (Hughes et al., 2014).
Use of the microblogging platform Twitter exemplifies many of the advantages and limitations of using social media during disaster preparedness, response, and recovery. These tools can help facili-tate information sharing at a scale and speed previously unattainable, enhancing dissemination of emergency information, early warning systems, and coordination of relief efforts (Kryvasheyeu et al., 2016). Eyewitness reports from disaster survivors are readily available, increasing situational aware-ness. However, such platforms also have important drawbacks. Misinformation and disinformation are prevalent; indeed, emergency responders are quick to point to this as one of the primary factors contributing to their reluctance to use social media as an information source (Hiltz et al., 2014). It can also be difficult to identify credible or relevant disaster-related content within the larger stream of posts.
Twitter has become a widely utilized platform by the general public as well as emergency responders during crisis contexts (Vieweg et al., 2010). As such, it has attracted the attention of schol-ars from a variety of disciplines interested in better understanding informal communication during crisis situations, as well as in the distributed coordination tasks that take place in these new venues. Sutton (2010), for example, demonstrated that the public utilizes social media to fill gaps that occur when official sources are slow or nonexistent. Others have similarly looked at these collective

97 MECHANISMS OF ATTENTIONAL INTERACTION DURING A DISASTER
sense-making processes and the proliferation of rumors as individuals attempt to understand uncertain events as they unfold (Spiro et al., 2012; Sutton et al., 2013; Arif et al., 2016; Starbird et al., 2016). This research has provided good evidence that Twitter provides access to rapid exchange of up-to-date information about a given situation (Sutton et al., 2014); however, it is less clear on the role of emer-gency responders within the online information ecosystem.
There is a notable lack of empirical evidence about how and why government agencies use social media to communicate emergency-related information and whether this information is effective in reaching vulnerable, diverse populations (Hughes et al., 2014; Reeder et al., 2014). Even less work has studied how complex social relationship patterns evolve in varying disaster contexts within Twitter communities, especially in the context of US emergency management-related organizations. To fill this gap, and to further our understanding of the importance of communication and social relations (in this case governmental interaction) for information passing and gathering, we explore the dynamic social interactions of US emergency management-related organizations over a more than 100-day period. The rest of this chapter presents the data, social mechanisms, and analysis necessary to explore such phenomena.
MECHANISMS OF ATTENTIONAL INTERACTION DURING A DISASTERWe propose a series of basic social mechanisms for determining whether a given Twitter account is likely to follow another account. We consider a broad array of potential inertial terms and social inertial effects. An inertial model is particularly appealing in this context because following relationships on Twitter, like many social media platforms, have a relatively low initial cost—ties can typically be formed at the click of a button. Ties can become costly if social contacts post frequently, leading to subscriptions with high volume. In one sense, following relationships are more costly to remove because they require the user to go through the additional step of finding and deleting the subscription relationship. These properties suggest that ties will have strong inertial effects.
We propose that there will be some baseline probability of any two accounts having a relationship, and also a general tendency for a tie to persist over a given k days; we expect the former effect to be very small; that is, we expect ties to form at random at very low rates. Next, we propose a series of homophily driven mechanisms based on location (e.g., same state) and FEMA designation (e.g., whether they are a FEMA affiliate or not) to account for similarity between organizations on such fea-tures, allowing us to explore the extent to which similar organizations are more likely to be tied. Fur-ther, we expected that these networks would be governed by dependence mechanisms associated with key network features.
In this chapter, we propose nine core network-based hypotheses, focusing on the mechanisms of an attentional nature that we parameterize in our model. First, we posit that organizations’ attentional relationships do not change instantaneously but are instead subject to “inertia” (Almquist & Butts, 2013, 2014b). Next, we hypothesize that organizations will be more likely to attend to others that are similarly situated institutionally (McPherson, et al., 2001). Specifically, we focus on the “homophily” effects of node match on same state, and node match for being a FEMA subunit. Organizations that follow “shared partners” are posited to come to follow one another. This mechanism is captured by an effect that, for focal pair (i,j), counts the number of organizations k such that (i,k), (j,k) at the specified time lag (see Butts, 2008a). In addition to the shared partner effect, we posit that attentional networks

CHAPTER 7 MODELING FOLLOWER RELATIONSHIP DYNAMICS98
will be driven toward transitive closure (Wasserman & Faust, 1994); if, during a given time point, orga-nization i follows organization j and organization j follows organization k, then i will be more likely to initiate or persist following k at a future time point. Organizations that are “active”—by following many others—or that are “popular”—by being followed by many others—are likely to become especially salient targets for attention. This has been previously found to be important for dynamic networks in the online context by Almquist and Butts (2013). Since following is to some extent a public statement of importance—and since one’s own followers are especially salient targets for attention—we expect organizations’ follower ties to be biased in the direction of past reciprocity (Almquist & Butts, 2013; Wasserman & Faust, 1994). Last, we hypothesize that disasters in a given region result in increased saliency of local Twitter accounts (motivated by Sutton et al., 2008).
DATAThe data used here consists of a large, dynamic network of following (i.e., subscription) relationships among a set of US government emergency management-related organizations (federal and state levels) obtained from Twitter. Network data were collected daily from June 24, 2010 to February 27, 2012 by the Hazards, Emergency Response, and Online Informal Communication (HEROIC) Project (Butts et al., 2011).1
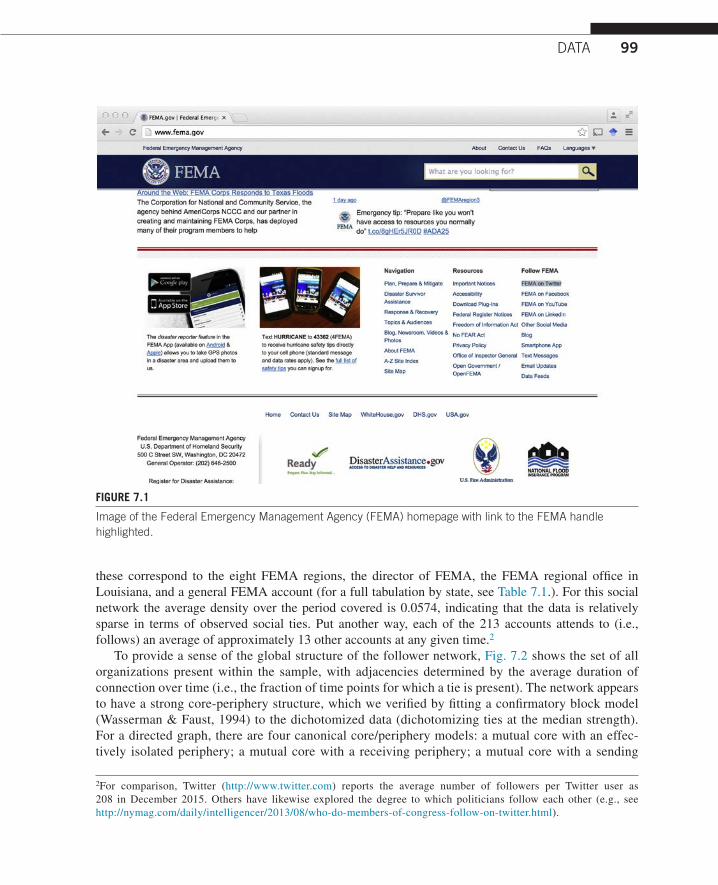
Building a complete set of all government, emergency-related Twitter accounts is a difficult task. Twitter is an ever-changing environment and, further, lacks a centralized database of such organizational accounts. Project HEROIC researchers (Butts et al., 2011) identified and enumerated a set of 213 actors over this time period by searching all known state and federal emergency management Web pages and checking to see if the page contained a link to a Twitter account. These targeted accounts were identified because they represent the population of public officials at the state and federal levels who were serving in a public-safety capacity and who were actively advertising their Twitter account. To find these accounts required a researcher to review all known Websites and check for a link to a given Twitter account (for example, see Fig. 7.1).
Once Twitter handles (or user names) were identified, the Twitter REST application programming interface (API) was used to collect information about which organizations were “following” each other on the platform. Following relationships on Twitter indicate that one actor subscribes to another’s messages; messages (i.e., tweets) are automatically delivered to an actor’s followers. Following thus represents a directly measurable and publicly visible attentional relationship. These social ties were sampled daily over the observation period; however, due to restrictions in data access there are missing links over some of the period. Here, we utilize a 125-day period from April 28, 2011 to August 30, 2011, where data is complete for the collection of the network.
THE DYNAMIC NETWORKThis interorganizational network is comprised of 213 nodes, each representing one Twitter account. The nodes are comprised of Twitter accounts for organizations based in all 50 states, Washington DC, and Puerto Rico. Many accounts represent state entities, but regional and federal-level organizations are also present. For example, there are 13 accounts that are part of the federal organizational entity;
1http://heroicproject.org/.
99 DATA
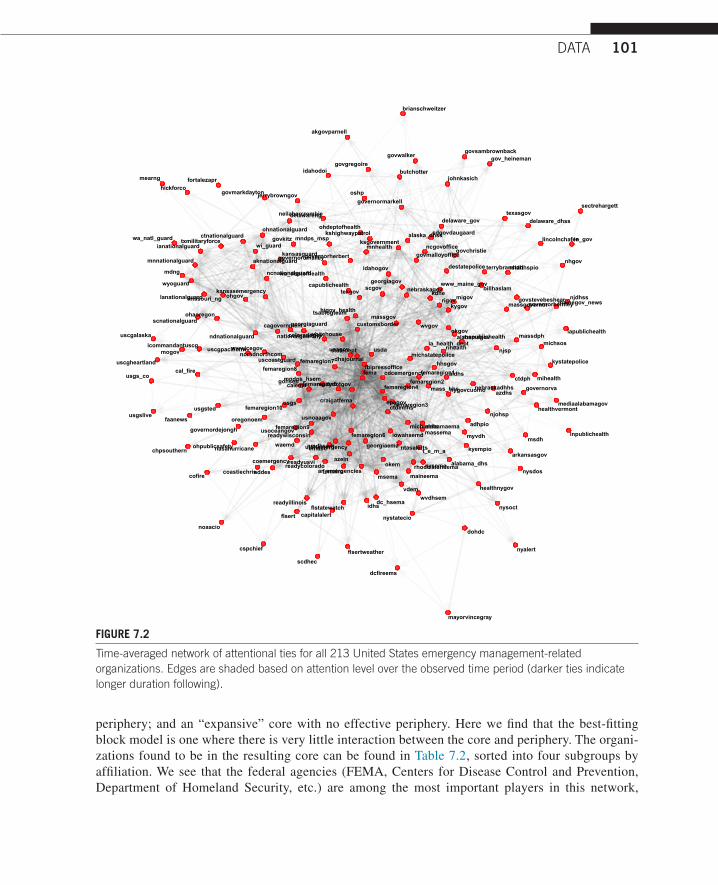
these correspond to the eight FEMA regions, the director of FEMA, the FEMA regional office in Louisiana, and a general FEMA account (for a full tabulation by state, see Table 7.1.). For this social network the average density over the period covered is 0.0574, indicating that the data is relatively sparse in terms of observed social ties. Put another way, each of the 213 accounts attends to (i.e., follows) an average of approximately 13 other accounts at any given time.2
To provide a sense of the global structure of the follower network, Fig. 7.2 shows the set of all organizations present within the sample, with adjacencies determined by the average duration of connection over time (i.e., the fraction of time points for which a tie is present). The network appears to have a strong core-periphery structure, which we verified by fitting a confirmatory block model (Wasserman & Faust, 1994) to the dichotomized data (dichotomizing ties at the median strength). For a directed graph, there are four canonical core/periphery models: a mutual core with an effec-tively isolated periphery; a mutual core with a receiving periphery; a mutual core with a sending
2For comparison, Twitter (http://www.twitter.com) reports the average number of followers per Twitter user as 208 in December 2015. Others have likewise explored the degree to which politicians follow each other (e.g., see http://nymag.com/daily/intelligencer/2013/08/who-do-members-of-congress-follow-on-twitter.html).
FIGURE 7.1
Image of the Federal Emergency Management Agency (FEMA) homepage with link to the FEMA handle highlighted.

Table 7.1 Number of Twitter Accounts by State or Federal Affiliation
State Freq State Freq State Freq State Freq State Freq State Freq
AK 4 FL 4 MA 6 NE 3 RI 4 WI 3AL 6 GA 5 MD 4 NH 2 SC 4 WV 2AR 3 HI 2 ME 5 NJ 4 SD 1 WY 1AZ 2 IA 4 MI 5 NM 1 TN 3CA 7 ID 3 MN 5 NY 9 TX 4CO 10 IL 2 MO 3 OH 6 UT 2CT 4 IN 3 MS 2 OK 3 VA 6DC 3 KS 6 MT 2 OR 3 VI 3DE 5 KY 4 NC 2 PA 1 VT 1Federal 22 LA 5 ND 2 PR 1 WA 6
101 DATA
periphery; and an “expansive” core with no effective periphery. Here we find that the best-fitting block model is one where there is very little interaction between the core and periphery. The organi-zations found to be in the resulting core can be found in Table 7.2, sorted into four subgroups by affiliation. We see that the federal agencies (FEMA, Centers for Disease Control and Prevention, Department of Homeland Security, etc.) are among the most important players in this network,
epagovusgs
usnoaagov
usoceangov
texasgov
iapublichealth
gohsep
wa_deptofhealth
t_e_m_a
billhaslam
usgs_co
nhdhhspio
kansasemergencygeorgiagov
noradnorthcom
femaregion2
higov_health
delaware_dhss
uscoastguard
la_health_dept
usgslive
cofire
readydotgov
readyusvi
icommandantuscg
azein
mass_hhs
lincolnchafee
ntasalerts
scdhec
femaregion8
vdem
butchotter
alabama_dhs
readyillinois
ncnationalguard
kansasguard
gov_heineman
sectrehargett
wwwicegov
mnnationalguard
dhsjournal
capitalalert
readycoloradofemalro
michsos
femaregion6
usgsted
dc_hsema
idahogov
ctnationalguard
nasahurricane emdsc
mepublichealth
nebraskadhhs
uscgpacificnw
terrybranstad
ohnationalguard
ohgovnebraskagov
michstatepolice
georgiaguard
govwalker
craigatfema
ksgovernment
noaacio
whitehouse
coemergency
jerrybrowngov
governoromalley
nystatecio
govsambrownback
govkitz
massgov
femaregion7
cagovernment
alabamaema
chpsouthern
iowahsemd
governorherbert
govgregoire
capublichealth
massdph
michemhs
flstatewatch
kyempio
mearng
nhgov
missouri_ng
healthnygov
txmilitaryforce
cdcemergency
flsert
lanationalguard
femaregion5
mediaalabamagov
wvdhsem
delawareng
www_maine_gov
govchristie
rhodeislandema
governorbentley
statedept
waemd
nygovcuomo
ndnationalguard
nmdhsem
ctdph
wyoguard
kystatepolice
alaska_dhsskshighwaypatrol
ctdemhs
migov
georgiaema
dohdc
ar_emergencies
mihealth
sdgovdaugaard
rihealthusda
mndps_msp
scgov
wa_natl_guard
aldhs
destatepolice
calema
mayorvincegray
mogov
femaregion1
delaware_gov
wvgov
utahemergency
fortalezapridahodoi
njsp
adhpio
texgov
governorva
fbipressoffice
kdhe
brianschweitzer
cal_fire
ianationalguard
scnationalguard
femaregion4
femaregion10
uscgalaska
uscgheartland
msdh
hickforco
governordejongh
govmalloyoffice
govmarkdayton
nddes maineema
govstevebeshear
nationalguardny
nysemo
idhs
dcfireems
faanews
ohaoregon
arkansasgov
nyalert
customsborder
mainegov_news
ohpublicsafety
kygov
femaregion9
hhsgov
healthvermont
inpublichealth
in_gov
mndps_hsem
mnhealth
fema
myvdh
akgovparnell
oshp
cspchief
tsablogteam
usagov
aknationalguard
njohsp
massema
coloradogov
mdng
msema
rigov
coastiechris
wi_guard
femaregion3
governormarkell
okem
ohdeptofhealth
alabamagovokgov
ncgovoffice
neilabercrombie
nysoct
azdhs
flsertweather
oregonoem
johnkasich
massgovernor
readywisconsin
njdhss
nysdos
FIGURE 7.2
Time-averaged network of attentional ties for all 213 United States emergency management-related organizations. Edges are shaded based on attention level over the observed time period (darker ties indicate longer duration following).

CHAPTER 7 MODELING FOLLOWER RELATIONSHIP DYNAMICS102
although we do see a number of very active state accounts (e.g., readycolorado). We further note that there are a few organizations that are very active in general; for example, fema has the highest degree across all time points.
This broad core-periphery structure reflects the long-term average behavior of a complex dynamic process within which organizations make decisions to start or cease following other organizations within their field. To better understand the mechanisms governing such attentional dynamics in a disaster setting, we model the time evolution of the Twitter follower network during the period of a major event—the Colorado Duckett fire. In addition to allowing us to capture general factors affecting attentional dynamics, this case also allows us to contrast effects associated with Colorado-based Twitter accounts, as compared to all other accounts in the network.
DISASTER CASE STUDY: COLORADO DUCKETT FIREWildfires are of major concern to many regions within the United States. Major forest fires can cause more than a billion dollars in damage and burn more than 100,000 acres of land during any one event (Fischetti, 2011). These fires occur most often during the summer months, as a result of dry weather conditions, and often require federal assistance for management and recovery. In June 2011, a fire broke out in southern Colorado in the San Isabel National Forest. FEMA declared this fire a “disaster”
Table 7.2 The Core Members of the Twitter Follower Network, Categorized by Organizational Affiliation (FEMA, National Guard, State and Federal Agencies)
FEMA National Guard State Federal
craigatfema georgiaguard alabamaema cdcemergencyfema ndnationalguard ar_emergencies customsborderfemaregion1 uscoastguard azein dhsjournalfemaregion2 calema fbipressofficefemaregion3 emdsc readydotgovfemaregion4 georgiaema statedeptfemaregion5 gohsep tsablogteamfemaregion6 Mass_hhs usagovfemaregion7 massema usgsfemaregion8 massgov usnoaagovfemaregion9 michemhs usoceangovfemaregion10 mndps_hsem whitehouse
msemanmdhsemnysemookemreadycoloradot_e_m_autahemergency
103 METHODS
from June 15, 2011, to June 24, 2011, and allocated federal funds to the recovery effort.3 During the event, an estimated 650 individuals were required to help fight the fire. Approximately 130 homes in Custer and Fremont counties were evacuated (a photograph from the fire can be seen in Fig. 7.4). Over-all damages incurred as a result of this fire are estimated to cost at least 4 million dollars (Associated Press, 2011). The Colorado Duckett fire was a significant regional event, one we explore in our analysis of interorganizational interaction. In Fig. 7.3, we show the location of Colorado-based emergency management Twitter accounts in relation to the location of this event.
METHODSTo analyze the evolving nature of attentional relationships among US emergency management organizations on Twitter, we employ DNR (for complete details, see Almquist & Butts, 2013, 2014b). DNR is a simple, scalable special case of the family of temporal exponential family random graph models and is a useful and robust starting point for dynamic network modeling. We employ standard network notation and structural definitions in describing our modeling framework, to clar-ify the connection between the formal techniques employed and the substantive phenomena they represent. This section begins first with this basic notation and then reviews some important details of DNR, ending with a discussion of the computational methods employed to apply DNR to the Twitter data set.
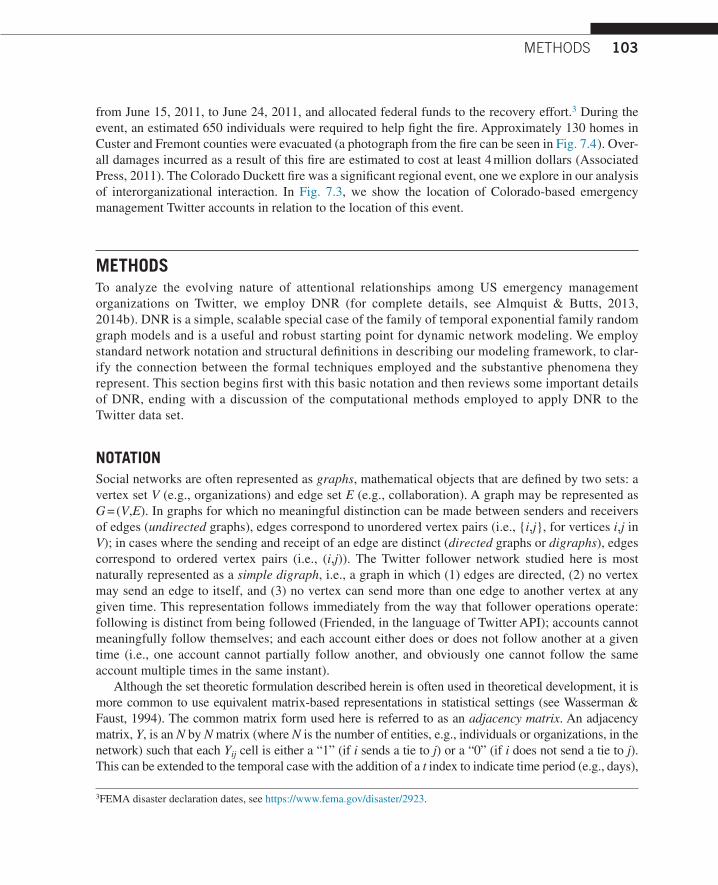
NOTATIONSocial networks are often represented as graphs, mathematical objects that are defined by two sets: a vertex set V (e.g., organizations) and edge set E (e.g., collaboration). A graph may be represented as G = (V,E). In graphs for which no meaningful distinction can be made between senders and receivers of edges (undirected graphs), edges correspond to unordered vertex pairs (i.e., {i,j}, for vertices i,j in V); in cases where the sending and receipt of an edge are distinct (directed graphs or digraphs), edges correspond to ordered vertex pairs (i.e., (i,j)). The Twitter follower network studied here is most naturally represented as a simple digraph, i.e., a graph in which (1) edges are directed, (2) no vertex may send an edge to itself, and (3) no vertex can send more than one edge to another vertex at any given time. This representation follows immediately from the way that follower operations operate: following is distinct from being followed (Friended, in the language of Twitter API); accounts cannot meaningfully follow themselves; and each account either does or does not follow another at a given time (i.e., one account cannot partially follow another, and obviously one cannot follow the same account multiple times in the same instant).
Although the set theoretic formulation described herein is often used in theoretical development, it is more common to use equivalent matrix-based representations in statistical settings (see Wasserman & Faust, 1994). The common matrix form used here is referred to as an adjacency matrix. An adjacency matrix, Y, is an N by N matrix (where N is the number of entities, e.g., individuals or organizations, in the network) such that each Yij cell is either a “1” (if i sends a tie to j) or a “0” (if i does not send a tie to j). This can be extended to the temporal case with the addition of a t index to indicate time period (e.g., days),
3FEMA disaster declaration dates, see https://www.fema.gov/disaster/2923.

FIGURE 7.4
Type 1 helicopter flying over Duckett fire captured by the US Forest Service and posted on June 15, 2011 10:38 p.m. (http://inciweb.nwcg.gov/incident/photograph/2306/17/18449/).
FIGURE 7.3
Colorado state with county borders projected in latitude/longitude space. Blue dots represent Twitter handle geocodes and the red dot represents San Isabel National Forest location, which was the start location of the Duckett Fire. The affected counties (Fremont and Custer) are labeled in blue, and the national forest boundaries are shaded in red.

105 METHODS
i.e., Yt encodes the state of the network at time t, with Ytij = 1 if i sends a tie to j at time t (otherwise Ytij = 0). To make this concrete, consider a collaborative tie between two organizations existing on day 1 and dis-solving on day 2, this would correspond to Y112 = 1 (on day 1) and Y212 = 0 (on day 2).
DYNAMIC NETWORK REGRESSIONWe begin with a series of cross-sectional temporal networks (…,Yy−1,Yt,Yt+1,… with , , where Nt is the number of nodes at time t) and look to model Yt conditioned on the past,
, , (Almquist & Butts, 2014b). The most general form of these models is the so-called temporal exponential random graph model family (Hanneke et al., 2010). Although the general temporal exponential family random graph models—as they are referred to in the literature—are extremely flexible, this flexibility comes at a cost; if not careful, the analyst can easily create models with very unrealistic behavior (for a recent review in the exponential family random graph models context, see Schweinberger, 2011). However, much work has demonstrated that while these challenges exist in the general temporal exponential family random graph models case, one can under certain regu-larity conditions stabilize the models through the temporal structure (see Cranmer & Desmarais, 2011; Hanneke & Xing, 2007; Hanneke et al., 2010). The best known of these frameworks is DNR. Almquist and Butts (2013, 2014b) have shown that this framework is predictively powerful and provides intuitive and interpretable results as either a logistic choice process or as a behavioral model. DNR is so named because it can be rewritten as a logistic regression, with edge states at each point in time as the depen-dent variables; it therefore inherits the usual inferential and computational properties of logistic regres-sion, and DNR model coefficients can be interpreted in a manner analogous to logistic regression parameters. Formally, the DNR likelihood for a given time slice is
Pr Yt Yt − kt − 1 Xt =i j Vt × Vt
B Yijt log it − 1 θTu i j Yi − ki − 1 ,Xt , (7.1)
where B is the Bernoulli pmf, X is a covariate set, u are sufficient statistics for the edge set, and θ an edge parameter vector. Due to the (temporal) causal structure of the model, the joint likelihood of an entire time series is just the product of likelihoods for each time slice (Eq. (7.1)) conditional on the ones before it. As noted before, the DNR model family is equivalent to a logistic regression with lagged predictors, allowing for a conditional odds interpretation of the results. Because the DNR family is also a special case of the temporal exponential family random graph models, any general result or technique usable on the latter is applicable to the former. Bayesian extensions of this model have been explored by Almquist and Butts (2014a) and are generally advised.4
MECHANISMS OF ATTENTIONAL DYNAMICSWe operationalize each of the mechanisms in section “Mechanisms of Attentional Interaction During a Disaster” by translating them into lagged graph statistics for the DNR model. Further, we engage in model selection as suggested by Almquist and Butts (2014b), where we will build a series of models from simplest to most complex and use this method as an initial stage of hypothesis testing—if a parameter is not included in the criterion-selected model, then we take this as evidence that the
4All models used here were computed in the R statistical computing environment (R Core Team, 2015) based on the original code used in Almquist and Butts (2013, 2014b) and updated in Yang and Almquist (2015) using custom code that builds on sna (Butts, 2008b), ergm (Hunter et al., 2008), and arm (Gelman et al., 2009) packages.

CHAPTER 7 MODELING FOLLOWER RELATIONSHIP DYNAMICS106
associated mechanism does not demonstrably contribute to explaining interaction dynamics (net of other effects). We employ the Bayesian information criterion (BIC), a popular model selection metric for exponential family models (Kass & Wasserman, 1995), for model selection. Each mechanism is discussed substantively in the section “Mechanisms of Attentional Interaction During a Disaster,” and a description for how each mechanism is parameterized and necessary baseline parameters included in the model follows in the next section.
Base Rate of AttendingWe parameterize the model with an intercept or edge effect that captures the baseline proclivity of accounts to follow others (Wasserman & Faust, 1994); this baseline is then modified by other factors to determine the actualized rate at which organizations attend to one another.
InertiaTo evaluate inertia in follower behavior, we parameterize the model with 1–7 (daily) lag terms to incor-porate differential hazards of tie dissolution over a week-long period (Almquist & Butts, 2013, 2014b).
HomophilyWe parameterize the model with two homophily effects: (1) node match on same state, and (2) node match for being a FEMA subunit.
Shared PartnersShared partners are captured by an effect that, for focal pair (i,j), counts the number of organizations k such that (i,k), ( j,k) at the specified time lag. Where the associated parameter is positive, organizations following the same third-party organizations have an enhanced probability of initiating or sustaining following relations with each other.
TransitivityWe parameterize transitivity by employing, for each (i, j) pair, the number of (i,k), (k, j) two-paths at the specified lag as a predictor for the i,j edge variable.
Popularity and ActivityWe capture popularity and activity effects by respectively adding model terms for lagged indegree (followers) and outdegree (others followed). Specifically, the popularity effect takes the lagged indegree of j as a predictor for the (i,j) edge variable, while the activity effect takes the lagged outdegree of j as the analogous predictor.
ReciprocityWe parameterize reciprocity as lagged mutuality term, i.e., a single statistic for the number of times an organization i is in a mutual relation with an organization j for a given lag. We expect the number of past reciprocal relations to increase the likelihood of a tie in the future with a given organization. Further, we expect this to be magnified if the organization has been in mutual relationship over multiple lag periods.

107 RESULTS
SeasonalityOrganizations are not expected to be equally active at all times of the week; past network studies have found strong seasonal components in online activity and turnover rate in tie formation (Almquist & Butts, 2013; Butts & Cross, 2009), and we expect that here as well. We parameterize seasonality via a simple indicator for weekend versus weekday and observe the change in relationship to lag terms under consideration.
Hazard Event EffectsTo test the hypothesis that disasters in a given region result in an increased degree of saliency of local Twitter accounts, we parameterize the model with an indicator for Colorado Twitter accounts and the Duckett fire period as defined by FEMA.
RESULTSTo test the hypotheses outlined in section “Mechanisms of Attentional Interaction During a Disaster”, we begin with a parsimonious model with fundamental controls: a term for density; two terms for homophily; a seasonality effect; and an inertial term for a single lag. We then steadily add inertial effects up to an entire week. Our decision theoretic framework (Bayesian information criterion)5 selected the 7-lag model, we begin with this case and then follow up by adding in the next set of net-work features. We then add Mutuality, Popularity (indegree) and Outdegree, Shared Partner, and finally Transitivity effects. At this stage we add an effect for Duckett fire (CO Fire; the period effect for Colo-rado Twitter accounts). Here again we employ, as discussed earlier, the Bayesian information criterion method for selecting whether to include a parameter in the model or not. This procedure can also be considered as a first stage of hypothesis testing, allowing us to directly test whether each proposed mechanism adds sufficient explanatory power to justify inclusion. Based on the Bayesian information criterion metric, we find that all the hypothesized mechanisms for interaction appear to be present. The final model can be seen in Table 7.3. As a point of reference, we also designate coefficients as “signifi-cant” in a Bayesian sense if the central 95% posterior interval about the estimate does not include 0—all estimates are posterior modes under independent standard Cauchy parameter priors.
INTERPRETATIONOur analysis focuses on the complete model, since it has the lowest Bayesian information criterion value, and thus was chosen under our criterion as the best fitting model (see Table 7.3). We find that at baseline there is very low probability of interaction, as we would expect in the dynamic network regres-sion setting (see Almquist & Butts, 2014b, for details). There is very strong evidence of the effect of inertia in this system, as this term was strong in all models (i.e., large and significant). In particular, in the model under consideration, the lag term is quite important. Consider an i, j dyad with no lag effect, i.e., organization i did not interact with organization j in the past seven days, then we would expect the log-odds of a tie (when considering only the intercept and lag effects) to be large and negative. However,
5The Bayesian information criterion avoids overfitting by introducing a penalty term for the number of parameters in the model, such that if the model is not sufficiently improved, we reject the addition of the parameter.

CHAPTER 7 MODELING FOLLOWER RELATIONSHIP DYNAMICS108
Table 7.3 Dynamic Network Logistic Regression Table of Bayesian Posterior Mode Estimates and Parameter Standard Deviations (Under a Cauchy Prior) for the Best Fit Model Under Bayesian Information Criterion Decision Criterion for Modeling the Attentional Network
Parameters SD Parameters SD
δ −6.6860* 0.0548 – – –FEMA −0.0201 0.0382 – – –STATE 0.0623 0.0772 – – –I{Weekend} 0.7646* 0.0356 – – –I{COFire} 1.4819* 0.1042 – – –Trans(Yt−1) −0.0237* 0.0041 SP(Yt−1) −0.1237* 0.0156Trans(Yt−2) 0.0010 0.0016 SP(Yt−2) −0.1195* 0.0153Trans(Yt−3) 0.0569* 0.0106 SP(Yt−3) 0.1159 0.1707Trans(Yt−4) 0.0696* 0.0104 SP(Yt−4) 0.0207* 0.0064Trans(Yt−5) 0.0897 0.1190 SP(Yt−5) −0.0036 0.0025Trans(Yt−6) 0.0241* 0.0060 SP(Yt−6) −0.0047 0.0166Trans(Yt−7) −0.0002 0.0023 SP(Yt−7) −0.0072 0.0160InDeg(Yt−1) −0.3907* 0.1837 OutDeg(Yt−1) −0.0018 0.0023InDeg(Yt−2) −0.0406* 0.0055 OutDeg(Yt−2) −0.1985* 0.0159InDeg(Yt−3) 0.0034 0.0021 OutDeg(Yt−3) −0.1924* 0.0152InDeg(Yt−4) 0.1087* 0.0139 OutDeg(Yt−4) −0.4868* 0.1728InDeg(Yt−5) 0.0967* 0.0135 OutDeg(Yt−5) 0.0363* 0.0058InDeg(Yt−6) 0.3616* 0.1557 OutDeg(Yt−6) −0.0044 0.0023InDeg(Yt−7) 0.0606* 0.0060 OutDeg(Yt−7) −0.1297* 0.0154Mut(Yt−1) −0.0897* 0.0145 Yt−1 2.8834* 0.0589Mut(Yt−2) −0.0595 0.1654 Yt−2 −1.0183* 0.1187Mut(Yt−3) −0.0338* 0.0038 Yt−3 1.5953* 0.1174Mut(Yt−4) −0.0028 0.0016 Yt−4 3.5918* 0.0761Mut(Yt−5) 0.1021* 0.0107 Yt−5 −2.6662* 0.0926Mut(Yt−6) 0.0677* 0.0102 Yt−6 3.2747* 0.0771Mut(Yt−7) 0.2947* 0.1168 Yt−7 6.0267* 0.0475BIC 71,312.96
A Bayesian analog of “significance” at p < .05 based on 95% central posterior intervals is denoted with ’*’.
if the organization i interacted with organization j for the entire time period, we would have a log-odds of forming an attentional relationship, which is large and positive (a massive increase). Note that if organization i interacted with organization j only in the immediate past (e.g., the first lag), it would still increase the likelihood of interaction on a log-odds scale substantially—in this case a nearly twentyfold increase in terms of the odds of a tie.
We find little evidence of a strong state-based or FEMA-based homophily effect, neither being significant. There is some evidence of a moderate lagged effect of transitivity, with 2-paths at 3–6 days having a positive effect on following and recent 2-paths (e.g., lag 1) having a negative effect; taken

109 DISCUSSION
together, the net impact of these terms is for long-running 2-paths to engender transitive closure while ephemeral ones inhibit it, suggesting a substantive difference between enduring and transient targets of attention. Shared partners show a similar qualitative pattern, though the negative short-term effects are dominant; thus, organizations tend to avoid following others that are attending to the same third parties, all other things being equal. Mutuality behaves like 2-path embeddedness, with long-running mutual relationships tending to enhance following and ephemeral mutuality tending to promote relationship decay. We also see a similar pattern for indegree, with negative effects at short lags and positive effects at longer lags whose total magnitude is larger than the negative short-lag effects. In this case, the interpretation is that organizations that are transiently popular (e.g., for less than approximately one week) tend to lose followers, while those with enduring popularity tend to gain them. Outdegree tends to be more consistently negative, suggesting that, ceteris paribus, organizations that follow many others tend to receive fewer followers themselves. (It should be noted that this effect, integrated across lags, is stronger than mutuality, so following many others appears to be a losing proposition overall.)
We note that while many of these coefficients appear to be small in magnitude, their net effects can become large for organizations that are embedded in dense groups. The seasonality term for weekend days (versus weekdays) is large and positive, disconfirming our hypothesis that these Twitter accounts would be largely focused on the standard work week. On the contrary, it would seem that substantially more attentional activity occurs on weekends (perhaps suggesting that account maintenance is being offloaded to nonstandard work hours during this period).
Finally, there is clear and strong evidence that these Twitter accounts become highly active in attending to others when a disaster occurs in their local region. Specifically, the COFire effect is very large, positive, and significant. We can see this effect visually by looking at the induced egocentric network (Almquist, 2012; Wasserman & Faust, 1994) for just the Colorado-based Twitter accounts on the day FEMA “Fire Management Assistance Declaration” was declared.6 This occurs on June 16, 2011, where the Colorado subgraph is composed entirely of isolates, and on June 17, 2011, it is almost a completely connected graph (Fig. 7.5). These Twitter accounts, furthermore, are active with a number of other accounts in the network during this period. We visualize the strength of this effect with Fig. 7.6, which traces the incoming and outgoing ties for the CO Twitter accounts and the rest of the network compared to the mean degree within the CO Twitter account group.
DISCUSSIONThe shifting attentional relationships among US emergency management–related organizations in the context of Twitter demonstrates a number of basic social mechanisms and activities that individuals and organizations employ to improve both information flow and situational awareness. We see that as emergent activities occur, the attentional dynamics of the system shift so that the organizations in the immediate impact area become more focal and engaged both internally and externally. These attentional shifts take place against a background of dynamics that overall favors switching ties away from more active organizations, and those with whom one has shared partners; that is, we often see that local organizations step into the spotlight during crisis events, while large, national organizations do not.
6https://www.fema.gov/disaster/2923/designated-areas.

CHAPTER 7 MODELING FOLLOWER RELATIONSHIP DYNAMICS110
usgs_co
noradnort
cofire
femaregion8
readycoloradousgsted
coemergency
hickforco
cspchief
coloradogov
06/16/11
usgs_co
noradnort
cofire
femaregion8
readycoloradousgsted
coemergency
hickforco
cspchief
coloradogov
06/17/11
FIGURE 7.5
Induced attentional network of Colorado-based US emergency management–related organizations over June 16 and June 17, 2011. Note the clear surge in attentional relationships associated with the onset of the disaster.
0HDQ�,Q'HJUHH�WR�&2�$FFRXQWV0HDQ�2XW'HJUHH�WR�1RQ�&2�$FFRXQWV0HDQ�'HJUHH�&2�&2�$FFRXQWV�
��
��
��������
��������
��������
��������
��������
��������
��������
��������
��������
��������
��������
��������
7LPH��'D\V�
0HDQ�'HJUHH
FIGURE 7.6
Mean degree within CO Twitter accounts and mean in- and outdegree of the CO Twitter account groups. Federal Emergency Management Agency (FEMA) disaster declaration dates for the CO fire period is highlighted in light red.

111 SUMMARY
This behavior is rather different from what has been found in other contexts, where social dynam-ics tend to preserve existing group and positional characteristics. We do see an overall tendency toward inertia within particular attentional relationships, however, as well as toward reciprocity for relationships that have been in place for an extended period. Indeed, there is a clear asymmetry (manifesting via several distinct mechanisms) between long-lasting and ephemeral structures, with dyadic embeddedness in the former being more conducive of tie formation and the latter being inhibitory. The organizations in this population thus appear to treat ongoing attentional relationships differently from short-duration relationships, with the former being inertial and the latter being actively cycled. We conjecture that in the case of the Colorado Duckett fire, organizations were employing these tactics to maximize their situational awareness under constraints of time and focus of a given organization.
Our findings suggest that having a large number of followers over an extended period increases the likelihood of being the object of attention, while attending to many others makes one appear unimportant and decreases the attention paid to that account. This result could mean that followers represent a strong signal of being worthy of attention, and following a large number of other organi-zations sends a strong signal of being “out of the loop.” However, it appears that a major disruption to the system (e.g., a disaster) can alter these relations significantly, leading to a rapid reorganization of the attentional network.
Incorporating attentional dynamics into models of informal communication online is vital for understanding social processes that occur via these social pathways. Processes such as collective sense-making and organizational learning all occur in these online platforms and can be impacted by attentional dynamics. The results presented here build on prior studies of rumoring behavior— natural social processes likely to occur in disaster contexts—and demonstrate how attentional dynamics can structure the transmission of information in these settings. For example, our analysis reveals strong inertia within the system—inertia that can be overcome but at the cost of highly dis-ruptive shocks (i.e., major disaster events). If attentional relationships become “stuck” in preevent states, they may be unable to adapt to the highly dynamic response environment; as a result, emer-gency responders may lose critical opportunities to send and receive event-related information, increase situational awareness, and clearly communicate event-related information to the general public. In extreme cases, this may imply that attentional relationships are determined at the time the account was created and rarely adapt to changing circumstances. In both cases, response and man-agement of the event could be impacted.
SUMMARYThis chapter has provided a first look at the shifting attentional network of US emergency management–related organizations in the context of Twitter. Using statistical network models, we have been able to test for the interaction of multiple distinct mechanisms driving social interaction. Our findings show a fairly complex pattern of historical dependence in attentional ties, with effects that vary substantially over a 7-day lag period. In addition to an unusual tendency toward switching away from especially active nodes, we find a moderate tendency for triadic closure between organizations and a modest hierarchy effect. Ties that endure over a 5–7 day period have different effects than those that are

CHAPTER 7 MODELING FOLLOWER RELATIONSHIP DYNAMICS112
ephemeral, the former generally being inertia and closure enhancing and the latter being inhibitory. Further, we find that Twitter activity and engagement are increased dramatically for the organizations directly affected by disaster, at least in the case of the Colorado Duckett fire. The ability to probe these complex mechanisms while also controlling for the influence of external events highlights the potential of tools like DNR for understanding network dynamics during unfolding events. We believe that there is considerable potential for further development in this area, both for attentional networks and for other sorts of interorganizational interactions.
ACKNOWLEDGMENTSThis work was supported in part by Army Research Office awards #W911NF-14-1-0577 (YIP), #W911NF-15-1-0270 (YIP), and #W911NF-14-1-0552, and by National Science Foundation awards CMMI-1031853, CMMI-1031779, and CMMI-1536319.