shifting focus produces rapid reading improvement the
TRANSCRIPT
1 F
READING BETWEEN THE LINES
Shifting Focus Produces Rapid Reading Improvement—
The Opportunity to Learn from Top PISA Performers
Rhonda Stone Graduate Students, 2017 Masters in Public Administration
The Evergreen State College June 10, 2017
In grateful appreciation to Jeanne Rynne and Ty Somerville, October 2016 – March 2017
MPA Project Research Partners
In process of submission for blind peer review

Reading Between the Lines: Shifting Focus Produces Rapid Reading Improvement June 2017 2
READING BETWEEN THE LINES
Shifting Focus Produces Rapid Reading Improvement—
The Opportunity to Learn from Top PISA Performers
ABSTRACT Investigators conclude U.S. policies promoting the skills-based view of reading are not supported by learning priorities of top PISA performers. Investigators used literature on five nations performing best on the international “PISA” reading assessment to identify shared values, policies, and instructional practices. Shared characteristics were identified and applied to an experimental student-to-student reading improvement approach to test validity. With an average 9.2 hours of work, college students improved oral reading fluency 75 percent. Comprehension improved 7.5 percent for all eight participants and 13 percent for six students in greatest need. With probability at p=.008, investigators conclude further study is warranted. INTRODUCTION: U.S. Education Policy and Stagnant Achievement in Reading
Throughout the world, the ability to read is directly linked to socio-economic status, as well as the
need for social welfare (Mickelson 1999, Jensen 2002, Hartas 2011, Polidano & et al. 2013). In the United
States, the wide academic disparity between rich and poor students and white and non-white students is
commonly known as the “achievement gap” and it remains an important focus for social justice for K-12
students (Reardon 2011, Miksic 2014).
Federal and state education policies in the United States have driven literacy-related curriculum
decisions at the local level since the early 1990s with a goal of improving student outcomes and closing a
gap between white and non-white students (Allington 2015, Vanneman et al. 2009). Yet, in the critical
area of reading ability, American 15-year-olds in 2015 ranked 24th out of more than 60 nations on the tri-
annual Programme for International Student Assessment (PISA) reading test, falling from 16th six years
before and 23rd three years before (OECD 2012, 2014, 2016). The mediocre performance is consistent
with 14 years of stagnant findings on America’s 4th and 8th grade National Assessment of Educational
Progress reading assessment (IES 2013, NAEP 2017), an enigmatic circumstance considering that, from
2002 to present, the U.S. and most if not all 50 state governments invested untold billions to improve the

3 F
literacy levels of students.
Allington (2015) clarifies the problem for the U.S. using nationally-reported NAEP data: only 30
percent of all Grade 8 students read at or above a proficient level and 70 percent read at a basic level or
below. The basic level is defined as: “May be capable of reading grade‑level texts but with only the ability
to perform the lowest level cognitive tasks (recall).” Allington continues: the “achievement gap” means
significantly more low-income and minority students read at or below a basic level. NAEP scores indicate
children from low-income families on average score 26 points lower; black students 27 points lower; and
Latinos 24 points lower. For all students, he states, there has been little change in the Grade 8 student
data over the past 15 years (NAEP 2017).
Two critical policy questions loom: Why isn’t America improving? Are public policies potentially
contributing to the problem?
This project used secondary and primary research to explore both questions and found a possible
answer: American students are not improving in the foundational skill of literacy because public policies
for at least 20 years have supported one—and only one—theory of how reading ability must develop. This
conclusion was reached after an investigating team explored a central question: Can nations performing
well on the tri-annual PISA assessment for 15-year-olds show college students how to improve in reading
ability?
The investigation involved two initial phases: (1) literature review to identify common
characteristics of top PISA performers and (2) local research using a survey of college students and teacher
interviews as a means of confirming or rejecting the findings of the literature review. Because this
project’s findings address areas not yet fully investigated by domestic or international research, the policy-
oriented team determined the work must include a culminating experiment that would apply the findings
to test validity. This meant one of the policy students would conduct what is, essentially, reading
improvement research with college students. For that experiment, the team recruited assistance from a
reading expert working nationally and internationally in the areas of learning theory and reading

Reading Between the Lines: Shifting Focus Produces Rapid Reading Improvement June 2017 4
improvement. Dee Tadlock, Ph.D., donated her time to assist the investigating team. In 2010, a system of
reading intervention Tadlock developed was scientifically tested with rigor with more than 400 middle and
high school students and found highly effective (Scott et al. 2010). Tadlock’s methods are not widely
known in part because they contradict the preferred view popularized in the U.S. by the Committee for
the Prevention of Reading Difficulties in Young Children (Snow 1998) and the National Reading Panel (NRP
2000). More than a decade ago, Tadlock’s methods were dismissed by those shaping state and U.S.
education policy because they emphasize student-driven constructivist methods instead of teacher-led
behaviorist methods for reading improvement, to the extent that a Seattle Post-Intelligencer headline
suggested Tadlock was “Championing a Heresy in Education” (Bach 2004). As late as 2007, Louisa Moats,
highly regarded by the U.S. reading field, condemned constructivist methods as ineffective because of an
apparent assumption that, where reading is concerned, they are related to “whole language,” the
prevailing philosophy for reading development 1970s through 1990s.
The condemnation of Tadlock’s work is note-worthy because, as described later, her methods
appear to align well with fundamental aspects of the education values, policies, and instructional practices
of the top PISA performers discussed in the forth-coming literature review.
LITERATURE REVIEW: Insights from Top PISA Performers
The work began in October 2016, two months before the international release of 2015 PISA results
in reading, math, and science. Canada, Finland, Japan, Shanghai/China and South Korea were selected
from the 2012 assessment to establish balance between eastern and western nations and because
information was readily available for all five. Until 2016, OECD reported Shanghai’s results separate from
China’s other mainland mega-cities. That changed after one researcher called out Shanghai for excluding
migrant students from school enrollment (Strauss 2013). Shanghai’s results are now reported with Beijing,
Jiangsu, and Guangdong and, combined, the four mega-cities performed three points below the U.S. in

5 F
reading on the 2015 PISA assessment. However, Shanghai students are still known to perform well, so
they were not excluded for this study.
From the literature reviewed, two factors not identified in other studies were found: (1) respect
among the nations for individual effort and excellence as they may be applied through student-driven
constructivist learning theory (articulated uniquely in each nation) and (2) the freedom allotted to
teachers in top performing nations to choose how and when they apply teacher-led declarative instruction
(behaviorism) and student-driven procedural learning (constructivism) to classroom learning. From this,
the team sought references to education values, policies, and instructional practices associated with the
two commonly discussed and debated theories of learning for clues as to what might give top-performing
nations the edge (Stevenson 1993, NCES 2003, Thurlow et al. 2003, Tadlock & Stone 2005, Tucker 2011,
OECD 2012 & 2014, The Guardian 2012, NCES 2013 & NCES 2015, CIEB 2016, Crehan 2016, UNESCO 2016).
The five nations selected for comparison to the U.S. have been well-studied with documentation
provided by multiple sources, including multiple assessments by the Center on International Education
Benchmarking (CIEB), the National Center on Education and the Economy (NCEE), and assessment
presented in two books, Surpassing Shanghai: An Agenda for American Education Built on the World’s
Leading Systems (Tucker 2011) and CleverLands: The secrets behind the success of the world’s education
superpowers (Crehan 2016). In addition to these sources, published peer reviewed and general trade
articles on each of the five nations were examined. The collected information was compared with
documentation on the evolution of reading theory and early reading instruction in the U.S., 1970 to
present.
In support of the primary research question, the following supporting questions were explored:
1. How do education accessibility factors compare among the top PISA nations and the U.S.? To
narrow the focus to the impact of different types of reading instruction on reading ability in the U.S., the
team examined the common reasons given for low achievement. One common reason is the claim that
too little money is spent on American public education (Biddle & Berliner 2002, Roser & Ortiz-Orspina

Reading Between the Lines: Shifting Focus Produces Rapid Reading Improvement June 2017 6
2016). However, when the team compared the five top performing PISA nations to the U.S., they found
the higher the percentage of a nation’s gross domestic product (GDP) spent on education, the lower its
PISA rank. In other words: national wealth does not explain moderate or low PISA performance. This has
been verified in formal research assessments (Tucker 2011, OECD 2012 & 2014).
Figure 2: PISA rank data: https://static.guim.co.uk/sys-images/Guardian/Pix/pictures/2013/12/5/1386241291926/ PISAFULLLITERACYWEB.png GDP data: https://ourworldindata.org/financing-education#historical-perspective
The team also looked at the impact of income distribution on achievement (see Figure 2). Local
teachers interviewed noted that poverty is an obstacle to high academic achievement in all subjects. To
examine the impact of poverty in the selected nations, the team looked at the distribution of income via
the Gini coefficient and the resiliency percentages (World Literacy Foundation 2015). Resiliency is the
ability of a population to overcome difficult life circumstances (e.g., lower socio-economic status). PISA
measures resiliency by taking the bottom quartile of a country’s students, based on socio-economic
status, and comparing that to the top quartile of performers from all countries after accounting for socio-

7 F
economic status (see Figure 3). The data from the team’s inquiry shows that the U.S. has the lowest
resiliency rate of the selected and studied nations. The team found this to be an interesting dichotomy:
within the U.S. it is statistically correct that poverty negatively impacts academic achievement. However, it
does not hold true for the top performing PISA nations. This is demonstrated by the fact that Shanghai,
China, has a Gini coefficient that exceeds that of the U.S., but Shanghai has in the past ranked high in
reading achievement on the PISA exam.
Figure 3
PISA rank data available at: https://static.guim.co.uk/sys-images/Guardian/Pix/pictures/2013/12/5/ 1386241291926/PISAFULLLITERACYWEB.png Gini coefficient data: https://en.wikipedia.org/wiki/List_of_countries_by_income_ equality. Resiliency data: OECD (2012).
The team also looked at incarceration rates as a measure of education success. America’s rate of
incarceration, 693 inmates per 100,000 of the population, contrasts sharply to the average of the nations
studied: only 88 inmates per 100,000. Even when looking at the top 25 PISA nations from 2012 (average:
123 per 100,000), the U.S. is an outlier (World Prison Brief).
2.

Reading Between the Lines: Shifting Focus Produces Rapid Reading Improvement June 2017 8
2. What values, policies, and instructional practices do the five PISA nations have in common
that may have contributed to their success in reading? Beginning with the U.S., the following
information represents a “mini-case” for each nation, compiled from various literary sources.
The United States – Instructional practices for reading in the U.S. have been the subject of much
debate for 40 years. From the mid-1970s through mid-1990s, a philosophy of reading development
known as “whole language” was in vogue. It fell out of favor with parents, teachers, and school
administrators in part because it offered no solutions for children who did not become successful
readers by Grade 3 (Chall 2000). The reading approach is the subject of what is well known as “The
Reading Wars” (Coles 2000, Reyhner 2008, Krashen 2010, Cothran 2014).
Whole language is grounded in the view that successful reading ability develops naturally as the
result of frequent exposure to whole texts, or stories and books (Goodman 1968 & 2006, Smith 1978).
Teachers were taught how to positively engage children with stories, but whole language offered no
concrete structure for how reading should be taught (Tadlock & Stone 2005). Alphabetics
(sound/symbol associations) were explicitly taught, but decoding and individual word identification
were either ignored or discouraged. Whole language was considered a “constructivist” approach to
reading development because children were expected to become readers on their own.
In the late 1990s, a behaviorist teacher-led view of reading development began to be promoted
as the result of findings of two nationally recognized research groups conducting literature and research
reviews (Snow 1998, NRP 2000). Findings from both groups supported an “explicit, systematic
approach” to K-3 reading instruction involving five skills, taught separately and in order: (1) phonemic
awareness, (2) phonics and decoding, (3) fluency, (4) vocabulary, and (5) comprehension.
Eager to improve student achievement, in 2002 the U.S. Department of Education used federal
funding distributed to states to intentionally move classroom teachers away from whole language and
autonomous instructional practices to national implementation of the skills-based view of reading. The

9 F
effort was the cornerstone of the No Child Left Behind initiative’s Reading First program (Abt Associates
2009). The teacher-led approach has dominated reading instruction in the U.S. since.
Canada - America’s neighbor to the north is similar to the U.S. in the diversity of its population.
There is no national education department in Canada, nor is there a national curriculum. Instead, each
province and territory has a Ministry of Education that determines how education will be delivered. In
Canada, like other top PISA performers, teachers are highly respected and, as such, Canadian teachers
are trusted to know best how to serve the individual needs of students. Also, the instructional focus in
Canada is on the individual needs of each student, rather than group performance (NCEE 2009a, Tucker
2011, OECD 2012, CMEC 2017, NCEE 2017a).
To gauge how reading is taught in Canada, the investigating team examined early reading
instruction in two diverse provinces: British Columbia (the world’s top performer in reading on the 2015
international assessment) and New Brunswick (among the lowest PISA performers of Canada’s provinces,
but still much higher than the U.S.) (OECD 2016). Significantly, neither province emphasizes separately
taught skills for reading instruction at Grade 1. Both emphasize that Grade 1 students must read with
comprehension, proper pace, and expression (BCME 2017, NBME 2008). This is significant, as the
comparable focus in the U.S. for Grades 1 and 2 is on decoding, word attack, and the speed at which
students identify individual words. The education literature reviewed suggests that Canadian ministries
frequently share approaches, so the focus on comprehension may exist in other provinces. Also,
Canadian teachers are known to share effective strategies across provinces.
Finland – While a comparatively homogenous nation, Finland’s educational success has been a
concerted effort since World War II, when Finland experienced the end of its agricultural economy and
transitioned to technology. Rather than a specific policy or program leading to Finland’s educational
success, a continuous dedication to gradually improving the educational system is credited (CIEB 2016, p.
16). Finland provides extensive services to every child beginning at age 1 (preschool education), with

Reading Between the Lines: Shifting Focus Produces Rapid Reading Improvement June 2017 10
meals, medical, dental, social, and psychological services provided in primary school. In Finland, teaching
is considered as prestigious a profession as medicine and law and, as a result, attracts the nation’s best
and brightest students. A national curriculum exists, but, supported by a societal value of “intrinsic
motivation,” teachers in local schools are trusted to decide how that curriculum should be taught to
address the individual needs of every child (Choi 2014). Finland is regarded as one of the best primary
and secondary education systems in the world, even though it has one of the shortest school years
(Hancock 2011, NCEE 2011a, Freeman 2012, Hendrickson 2012, OECD 2012, Sinko 2012, Phillips 2013,
CIEB 2016, NCEE 2017b). From Surpassing Shanghai (Tucker 2011, p60): “...A major focus in Finnish
classrooms is helping students learn how to assess their own learning. ...Students are expected to take an
active role in designing their own learning activities. Students are expected to work collaboratively in
teams on projects, and there is a substantial focus on projects that cut across traditional subjects or
disciplinary lines.” This begins as early as Grade 1. Finland is known to embrace constructivism to the
extent its ministry has examined how to design school facilities to support constructivist learning
(Kuuskorpi 2014). Policies in place in Finland also ensure children attend equitably funded schools
supported by administrators and teachers that have autonomy to make decisions about instruction.
Japan - This homogenous and geographically small nation has a long history in educating the
masses. It has been a high priority for hundreds of years, largely owing to Japan’s historically
meritocracy-based society. In a meritocracy, anyone can improve their station in life if they score the
highest on government tests (typically essays), thereby earning government jobs. Individuals raised in
poverty have the potential to climb the ranks if they apply effort and achieve excellence in their
studies. For this reason, families for generations have gone to great lengths to communicate the value
of effort and excellent performance as the foundation of learning. From an institutional point of view,
Crehan (2016) describes this as “character development,” which students more clearly describe as
learning to be “strict on ourselves.” Like Canada and Finland, teaching is a highly-revered profession in

11 F
Japan. Japanese teachers are, therefore, trusted to know what is best for their students. Japan has a
national curriculum, but how that curriculum is delivered is at the discretion of teachers. In Japan,
classrooms can be noisy, as class sizes are larger than the U.S. Larger classes are seen by some as an
advantage because they require frequent small group work, with individual students helping each
other excel. The principle that students help each other achieve excellence is an absolute value in
Japan (Wu 1999, NCEE 2011b, NCEE 2016a, Tucker 2011, CIEB 2016). The student-to-student nature of
this is constructivist and referred to as “social constructivism” (Richardson 2003, GSI 2017).
Shanghai/China – A relevant aspect of Shanghai’s culture is the inherent acceptance of self-
evaluation. Over the past 100 years, China has endured culture-shaking political movements, ranging
from Marxism to Leninism, Maoism, and more. At times, freedom has been entirely taken away from the
Chinese people to the extent that the government disallowed religion and dictated how the Chinese
must work and live. At times, the government preferred a poorly educated populace trained only to
perform vocational jobs. Yet, Confucian values and virtues endured in Shanghai society. Two of those are
the constant drive for excellent character (including hard work) and to be loyal to your true self. This
drive is exemplified in a belief found in Shanghai: “courage in self-criticism.” Shanghai’s students are
constantly self-critiquing to achieve excellence in the work they perform. To accomplish this, they are
open to criticism and make adjustments to performance as a part of the process of learning. This is a
group goal, not just an individual goal. Due to extraordinarily large class sizes (35 to 50 at the elementary
level and 75 to 100 at the secondary level) students are frequently broken into small groups and work
together to improve their individual and group performance. Advanced students help less advanced
students, as teachers guide and direct the whole group’s productivity (Corcoran 2010: Tucker 2011, NCEE
2011c, CIEB 2016, NCEE 2017c). This is constructivist in nature and, perhaps, an overlooked component
in Shanghai’s long-term success.
South Korea - The South Korean system of education is significantly different as compared to

Reading Between the Lines: Shifting Focus Produces Rapid Reading Improvement June 2017 12
Canada, Finland, Japan, and Shanghai. It shares many of the characteristics common to Asian nations (a
high value on work ethic and effort); however, the nation has been criticized sharply for pushing
students too hard. South Korean K-12 students attend school significantly longer than other nations (220
days a year, compared to 180 in the US), with South Korean students spending an average three hours a
week longer on homework, plus up to six days a week in after-school “cram” schools. It is assumed that
cram schools are the reason South Korea succeeds academically. Conversely, Finland succeeds with
Finnish children attending school 30 to 40 fewer days per year and significantly less participation in after-
school cram schools (Tucker 2011, NCEE 2009b, Nam-soo 2013, Koo 2014, Lim et al. 2015, CIEB 2016,
NCEE 2016b). South Korean students do spend a significant amount of time in after-school programs, but
students do work individually and in groups with activities focused on individual effort and producing
excellent work—both constructivist activities.
3. How do the six nations studied compare where constructivism and behaviorism are
concerned? Education in the U.S. has evolved in significantly different directions for reading
development as compared to the top PISA performers. Whereas the U.S. focuses on teacher-led
individual skill development for Grades 1 - 3 (phonemic awareness, phonics, fluency, vocabulary, and
comprehension), the top PISA performers may have more focus on excellence with the activity of oral
reading, using both declarative (teacher-led/behaviorist) and procedural (student-driven/constructivist)
instructional methods to achieve it.
Behaviorism and Constructivism Defined: One of the clearest resources the investigating team
found for differentiating between behaviorism and constructivism is offered by Michelle Khatib, B.Ed.,
M.Ed., a mentor teacher in the province of Alberta, Canada. Khatib manages an informational website for
Canadian teachers and freely offers a concise presentation entitled Behaviourism vs. Constructivism:
What is the Difference? The presentation appears consistent with how Tadlock (2005) defines the two.

13 F
“Behaviourism,” Khatib explains, “is defined as a teacher directed approach.” Teachers deliver
instruction to students and that instruction tends to be set or fixed. Alternately, she states,
“Constructivism is when you build, or interact with real life experiences to build learning.” Examples
provided include project-based, challenge-based, and self-directed learning. Constructivism, she
proposes, is student-directed learning (teacher is the “guide on the side”). Khatib’s suggests that
behaviorism and constructivism both have a time and place in classroom learning.
Compare Khatib’s view with a University of Kansas blog entry by a post-doctorate special education
researcher (Hicks 2016): “A colleague of mine was once in a conversation with two veteran special
education professors. One was a radical behaviorist and the other…a constructivist. He wanted to
impress them…when one of the professors turned to him and asked point-blank, ‘Are you a behaviorist
or a constructivist?’ Unsure how to respond, he replied limply, ‘Well, I’m actually both.’ ...With a ‘pat on
the back,’ they assured him his position was impossible.”
Hicks’s post alludes to an ongoing debate occurring within both the education and education
research communities (Mitchell 2011). According to definitions offered by Tadlock and Khatib, not only is
it possible to be both behaviorist and constructivist, both have important roles to play in learning. This
apparently common misunderstanding of behaviorism and constructivism has the potential to explain
why federal funding in the U.S. and education research have not yet invested in the identification of
when and how both theories of learning are used effectively by classroom teachers for reading.
To understand behaviorism and constructivism, it is helpful to understand the two forms of
memory acknowledged by the field of cognitive psychology, which has historically informed education’s
work (Schacter & Graf 1986). A clear and concise explanation comes from human-memory.net (2017):
Declarative memory is associated with “what we know;” think facts and events that humans can
consciously recall and declare. Procedural memory is associated with “how we do” things, such as how
to type on a keyboard, how to swim, how to ride a bike, and even how to read. Each of these requires

Reading Between the Lines: Shifting Focus Produces Rapid Reading Improvement June 2017 14
complex cognitive processing and the integration of neural activity and memory stored in and/or by
multiple brain systems. Notably, Tadlock included all this in her theory of reading development, first
articulated in a white paper (2004) which she submitted for peer-review but was rejected, and later
explained in a book published by McGraw-Hill (2005). In 2013, Afflerbach et al. note that reading ability
demands complex cognitive processing. Few would argue that “how to do” any complex task requires
hands-on “procedural learning,” which must involve student experimentation (Johnson 1992, LeDoux
2002, Tadlock & Stone 2005, Fazel 2013). Procedural learning is, therefore, principally constructivist.
The likelihood that the appropriate use of student-driven experimentation (constructivist/procedural
learning) is underemphasized in the U.S. is supported through foundational core values expressed
differently by each of the top PISA performers. Consider these, presented briefly for comparison:
• Finland’s students have been noted to possess “intrinsic motivation” to perform well in learning
(Choi 2014).
• Japan’s schools focus on “character development” or, as students describe it, being “strict on
yourself (Crehan 2016),” an underlying quality essential for effort that is focused on excellence.
• In Shanghai, China, students are well known for “courage in self-criticism” in the pursuit of
excellence (Tucker 2011).
• And, in South Korea, students are known for “grit and hard, hard, hard work” (Choi 2014).
British Columbia and New Brunswick’s goal that children read with fluency at Grade 1 is defined by the
British Columbia Ministry of Education as reading that is fully comprehended with proper “phrasing and
attention to punctuation” (BCME 2017, NBME 2008). This is significantly different from the U.S. where,
since 2002, Grade 1 – 2 reading assessments commonly focus on decoding, word attack, and the speed at
which children can identify individual words. Evidence of this comes from the 1977 Revised Code of
Washington (RCW) in Washington state, which defined a basic education as knowing how to comprehend
text and compute. However, Washington’s focus for reading shifted in 1998 to phonics, decoding, and the

15 F
speed of individual word identification with mandatory Grade 2 state testing (RCW 1998). As a retired
superintendent from Washington state observed, the shift caused schools and classroom teachers to focus
Grade 1 – 2 reading instruction away from comprehension and to individual word identification
(McLaughlin 2016).
LITERATURE REVIEW: Conclusion
If Canadian children can make the leap from a phonics focus to comprehension and excellence in
oral reading as early as Grade 1, why can’t students in the U.S.? It is proposed that Canadian education
policies support student reading achievement by keeping the focus of instructional activities on
comprehension and fluent reading as a cohesive activity with fiction and non-fiction text, whereas U.S.
education policies support teaching reading in parts and pieces. It is further proposed that Finland, Japan,
Shangai/China, and South Korea excel in reading because of the values-driven focus on excellent
performance.
Through the years, a few reading experts have suggested that comprehension and fluency must in
some way be significantly connected. Timothy Rasinski is one of the most prominent (Rasinski 1988 &
2013, Rasinski et al. 2006). Tadlock offers a concise answer: For excellent readers, comprehension and
fluency are interdependent. Tadlock’s methods of keeping comprehension and fluency together suggest
that, by creating a learning environment where readers are compelled to produce authentically fluent
oral reading (always comprehended and as natural as conversational speech, free of awkward pauses
and characterized by appropriate pace and expression), the brain is compelled to use procedural learning
to figure out passage reading’s complex integrated process.
Tucker’s observations from Shanghai, China, support this. He states: “Reading is regarded as the
only effective means of learning and memorization -- ‘All are low but reading.’ Hence, the tradition of
rote [repetitive] learning.” (Tucker 2011, p24). Combine this with Shanghai’s cultural and individual

Reading Between the Lines: Shifting Focus Produces Rapid Reading Improvement June 2017 16
willingness to acknowledge flawed performance and correct it (“courage in self-criticism”), and student-
driven excellence appears to play a significant role in Shanghai’s reading success.
America’s struggle for “courage in self-criticism” was noted by one of this project’s investigators
while visiting a high-minority, high-poverty school system where Tadlock’s standard reading improvement
approach is used. The economy in Lancaster County, South Carolina, was left with few jobs and a poorly
educated populace when the textile industry left the region in the late 1990s (Lancaster Promise
Neighborhood 2015). In recent years, some of the district’s schools have earned an “F” rating placing them
at risk of government intervention. According to school officials, this began to change in 2014, when
Lancaster County started introducing Tadlock’s methods to two of the district’s poorest performing
schools (a high school and an elementary) and its adult education program. Within months of
implementation, district officials noticed immediate improvement in reading skills (Stone 2017).
In separate interviews, three Lancaster County para-educators working at separate program sites
said, at first, they didn’t like Tadlock’s methods. The methods require tutors to tell students very directly
when they don’t read orally with excellence. All three tutors stated they resisted because they didn’t want
to discourage students. However, what they discovered was that students quickly adapted to the methods
and, as they did, they improved in reading ability. Today, all three tutors like the approach.
In the schools where these tutors work, 75 percent of the population or more are minority students
and up to 98 percent of students qualify for free or reduced-price school lunch. A primary purpose of the
Reading First initiative had been to close the achievement gap, well documented to adversely affect low
income and minority students. To this day, many American states, school systems, and individual teachers
are unaware that, from the billions spent on the Reading First initiative, a reliable three-year study
released in 2009 involving hundreds of classrooms found no positive effect on reading’s core skill
(comprehension) at any grade level (Grade 1 - 3) or for any of the three years studied (Manzo 2008, Abt
Associates 2009). Perhaps more significantly, the study found no improvement in phonics knowledge at
any grade level in any year except one grade (Grade 1) and that occurred in only one of three years.

17 F
PRIMARY RESEARCH: Local Survey and Interviews
Primary research was used to provide first-hand information intended to confirm or reject
literature review findings. This was necessary to ensure that the ultimate test of the findings—the
culminating experiment—would not replicate reading practices common to U.S. college students when
they were in Grades 1 - 3.
Definitions and Methods: “Students” referenced in the primary research are college students from
the liberal arts and sciences college where the research was conducted. Students participating in
interviews and the culminating experiment were required to be enrolled in the college’s undergraduate or
graduate programs. For “teacher” interviews and the focus group, participants were required to be
current or former teachers residing in the local area. All participants were solicited from flyers and
electronic media. In addition to the interviews, a survey was designed to collect information from local
students on how they learned to read and their current feelings and/or perceptions about reading.
Survey Data Collection: With 102 surveys completed and available for analysis, the survey
produced nominal and ordinal data related to demographics and the practices underlying reading
development. Figures 4 and 5 report age ranges, education type, nation of origin, family income, and
parent education.
AGE K-12 EDUCATION TYPE 18-24 25-35 36-45 46-55 56+ PUBLIC PRIVATE Home School 29% 39% 15% 10% 7% 89% 7% 3%
Figure 4 – Combined, 68% of survey participants were between the ages of 18 and 35 and the majority attended public schools.
ORIGIN INCOME PARENT EDUCATION Born in
U.S. Low Middle Upper
Middle High No HS
Diploma HS
Diploma Some
College Bachelor Degree
Graduate Degree
95% 28% 58% 14% 0% 11% 31% 18% 17% 24%
Figure 5 – Most survey participants (58%) come from middle-income homes; 59% of their parents have some college education.
Of the 102 participants, 65% were white and 23% represented minority groups (mixed race being the largest). Another 11% declined to answer the question. The complete breakdown appears in Figure 6.

Reading Between the Lines: Shifting Focus Produces Rapid Reading Improvement June 2017 18
Data Analysis: To analyze the survey data, the team looked at three categories of questions on the
survey: (1) neutral questions (strategies recommended by most reading experts for reading instruction—
e.g., adults reading to children, explicit instruction of the alphabet, and encouraging children to read
whole text; (2) teacher-driven explicit, systematic instruction in phonics and decoding (declarative/
behaviorist), recommended by the National Reading Panel; and (3) oral reading focused on absolute
excellence, an implicit student-driven strategy (procedural/constructivist), recommended by Tadlock. The
team weighted responses by assigning numerical values referred to as “scale scores” to each of the five
options: “never” scored a (0), “I don’t know” (1), “seldom” (2), “occasional” (3), “frequent” (4), and “all the
time-daily” (5).
Two interesting patterns emerged. First, a significantly smaller percentage of local students were
asked to read aloud with oral excellence as a part of their pre-Grade 1 reading development (procedural/
constructivist). In very young children, this is typically accomplished when children memorize simple text.
Second, the mode of instruction survey participants recalled with greatest frequency at home with parents
was phonics and decoding (declarative/behaviorist) (see Figure 7).
Ethnicity of Participants
Latino8%
MixedRace12%
White 65%
Did Not Answer
11%
Native American 1%
Asian 1%Mid-Eastern 1%
Figure 6

19 F
Compare this to participants’ recollections of reading development in Grade 1. Emphasis on oral
reading excellence is still significantly less than the focus on other activities and skills (see Figure 8).
0 20 40 60 80 100 120 140 160
155
155
138
91
Strategies for Early Reading Development (Scale Scores: Grade 1 Recollections)
0 20 40 60 80 100 120 140 160
140
131
145
127
75
Strategies for Early Reading Development (Scale Scores: PreK-Kindergarten Recollections)
FIGURE 7
5. Oral excellence
4. Read stories
3. Phonics/decoding
2. Alphabetics (sound/symbol association)
1. Read to
4. Oral excellence
3. Phonics/decoding
2. Alphabetics (sound/symbol association)
1. Read to
FIGURE 8

20
The data is provocative when average scale scores are examined for four categories of participant self-
identification: Those who avoid reading because they don’t like it; those who frequently must re-read text to
understand it; those who like to read but would rather do other things; and those who love to read and read
for pleasure daily. In Figure 9, those who avoid reading because they don’t like it recalled significantly higher
levels of focus on decoding before Grade 1 (average scale scores of 3.8 and 4.1) than the three other groups
(a range of 2.2 to 3.6), and those who avoid reading recalled having the least amount of encouragement to
read aloud with excellence by a significantly larger margin (0.5 compared to a range of 1.3 to 2.2). In Grade
1, those with the least encouragement to read for excellence also reported a significantly lower recollection
of being able to read when they started Grade 1 (1.9 compared to 2.5 to 2.6). Combining the data, a single
factor ANOVA analysis found the data to be reliable, with a probability value of p=.039. Although the
sample’s percentage of individuals who do not like to read is proportionately small (8 percent), the 24
percent who must re-read often also had significantly less encouragement to read for excellence. Combined,
Tadlock’s theory that over-emphasis on phonics and under-emphasis on learning to read with a goal of
reading for excellence appears to be supported.
FIGURE 9
TYPE OF READER
@College
READ TO Pre-Gr1
LETTERS Pre-Gr1
DECODE Pre-Gr1
READ ALOUD Pre-Gr1
READ FOR EXCELLENCE
Pre-Gr1
READ TO Gr1
LETTERS Gr1
DECODE Gr1
ALREADY READING
Gr1
READ FOR EXCELLENCE
Gr1
Avoid reading n=8
3.8 3.8 4.1 3.0 0.5 4.3 4.4 3.8 1.9 1.5
Re-read often n=24
2.8 2.2 2.6 2.3 1.3 3.9 3.8 3.4 2.5 2.2
Like to read n=25
3.5 3.3 3.6 3.3 2.2 4.0 4.2 3.9 2.6 2.8
Love to read n=45
3.7 3.0 3.5 3.2 1.7 3.2 3.9 3.6 2.6 2.4
Interviews and focus groups: A total of 17 teachers participated in interviews and focus groups, which
used a mix of standard questions with customized follow-up. The purpose of the interviews was to learn
what teaching methods participants felt worked best for teaching students how to read, which were less
21
successful, common characteristics of students who either struggled with reading or picked it up easily, and
the level of flexibility teachers had to try different approaches in the classroom.
Summary Findings/Project Investigator #1: The investigator interviewed teachers actively working with
low-income and minority students. Three teachers from a K-12 public district, one from a private college,
and one special education teacher communicated that current reading models taught in elementary schools
are not meeting the needs of students, especially minority students. Every teacher expressed concern about
the current approach to reading in their respective school systems and all stated they wished reading was an
individualized concept focused on individual improvement as opposed to a collective endeavor. All the
teachers expressed a desire to see significant changes in the current model because of the insurmountable
struggles which occur once students display any form of learning challenge and/or if they fall behind. Dr.
Patricia Lott, a college instructor who was at the time grading culminating projects at a private university,
stated that she sees at an alarming rate college students who struggle with reading and who subsequently
struggle with college-level writing required for graduation. She notes: “I feel that, if children were taught to
read, my job would be easier. Currently…I have three students who are going to fail because they cannot
read.”
Summary Findings/Project Investigator #2: The second investigator conducted individual interviews
with six current teachers, one retired teacher, and a focus group with five retired teachers living in a
retirement community. A recurring theme in the interviews and focus group was that, if teachers can
foster an interest in reading, the student is much more likely to improve in reading ability. This is
supported by studies of top PISA performers. The view is also consistent with methods used by Tadlock,
which begin with identification of the optimum oral reading level of students (pre-kindergarten through
Grade 12) and the selection of stories of interest to the students. Lee (2014, p. 364) says that the two most
reliable indicators for predicting high reading achievement are either enjoyment of reading or the ability to
use reading strategies to quickly summarize text. Again, the focus is connected text and story meaning,
rather than decoding and word attack.

22
Another recurring theme that emerged with the focus groups and individual interviews is that, in the
U.S., learning is more challenging for children who come from poverty. Specifically, children with
inadequate nutrition and/or sleep struggle to learn. All participating teachers said that children who come
from homes with books and where children are read to frequently learn to read more easily than children
without these resources.
PRIMARY RESEARCH: The Culminating Experiment
Throughout this project, expert guidance on learning theory and reading improvement methods was
provided by Tadlock. The investigating team pursued Tadlock’s approach because (1) a pre-existing
professional relationship existed with her on the part of one of the team members, (2) evidence exists to
support Tadlock’s methods as valid, and (3) the methods are ignored or rejected by U.S. reading experts,
suggesting they are significantly different from those supported since 1998 by U.S. education policy.
Tadlock agreed to modify the delivery structure of her methods to reflect the values, policies, and
instructional practices identified by the investigating team in the literature review. The methods and
delivery structure subsequently were required to include:
1) Focus on excellence: Tadlock’s highly structured approach is already designed to train students to
be “strict with themselves,” have “courage in self-criticism,” and employ “intrinsic motivation”
with “grit and hard, hard, hard work.” The approach regards oral reading ability as a window into
what the brain is doing when it reads. The methods focus simultaneously on comprehension and
oral reading excellence to produce improvement.
2) Delivery structure: Tadlock’s standard delivery approach is one adult tutor working with up to five
students. As requested by this project team, she created a new student-to-student delivery
model implementing her methods. The student-driven pairs replicate the “social constructivism”
frequently found among top PISA performers and ensure that the approach remains student-

23
driven rather than teacher or facilitator-led. The student-to-student approach also has the
potential to be managed by one trained facilitator working with a full class (24 students).
3) Reflect both declarative and procedural learning: For the modified methods, the facilitator would
be trained to provide direct instruction to students in the approach’s methods, with coaching
provided to the student pairs as needed as the work progressed.
The culminating experiment’s facilitator is a member of the investigating team who is not a
certificated teacher, but who has a prior professional relationship with Tadlock. The team member
received hands-on training in Tadlock’s methods for the first time in July 2016 and apprenticed as a tutor of
the methods from August through October. In December, the facilitator was trained in Tadlock’s modified
“dyad model,” referred to as “Readers’ Club” for college students. In January 2017, four students were
recruited for the initial Winter Quarter pilot. The four were matched into pairs, composed of two students
of similar reading ability who would work together over the six-week reading improvement phase (three
days a week, 45 minutes each session). On Day 1 of Readers’ Club, students received 60-minutes of explicit
instruction in the peer-reviewed brain science underlying the Readers’ Club methodology and the
approach’s modified methods, plus 30-minutes of student-to-student constructivist experimentation with
their assigned partners. On Day 2, students began to use the strategies with assigned partners. Throughout
the rest of the pilot, students worked together to improve oral reading ability, moving up in text complexity
as excellence became progressively easier for each student to achieve. Student teams received coaching
from the facilitator as needed and the facilitator made ongoing judgements as to individual student and
dyad needs. This format was replicated in Spring 2017 with eight volunteering students paired in four
dyads. The two pairs starting Winter Quarter included two students who started the experiment at a
functional oral reading level of Grades 4 – 5 (henceforth referred to as low/mid-range readers) and two

24
who started at Grades 6 – 7 (mid-range readers). The four pairs starting Spring Quarter included two
students returning from Winter Quarter (the low/mid-range readers who had progressed to mid-range),
four new mid-range readers, and two high-range readers (starting the experiment at Grades 8-9).
Readers’ Club Data Collection: Winter and Spring Quarters, all Readers’ Club students were pre-
tested for optimum oral reading level and the specific number of oral reading errors made as they read
progressively more difficult text. Spring Quarter, students also were pre- and post-tested with the Gates-
MacGinitie Grade 10-12 comprehension sub-test. Student attendance was noted daily and student
perceptions were gathered via a post-program focus group activity.
Summary Findings: To put the results in context, additional information is presented on the
students who volunteered for the experiment. First, none of the students were known to any of the
project’s investigators before the experiment began. All contacted the project investigators and
volunteered after reading electronic and/or paper information distributed through college channels. The
volunteers included:
Winter Quarter/Participants - One English language learner (ELL) who moved to the U.S. at age 9 and
one ELL student with low-vision who is legally blind and uses a guide dog for mobility entered the project at
the end of January at a Grade 4 – 5 functional oral reading level, even though both had been successful high
school students. The ELL student had previously been accepted to a prominent state college to study pre-
med, but had failed to keep up with the extensive reading required, even though she graduated from high
school with a 3.5 grade point average. She was on her third college when she joined the project and eager
to understand why college was so difficult for her. During pre-testing, the low-vision ELL student was invited
to make test conditions for her as favorable as possible. Lighting was adjusted with tinted lenses, minimizing
glare, and she chose not to use her magnifier, which she said made it harder for her to read. She held the
test pages within a few inches of her face for further accommodation. The two other students included one
mid-range reader and one high-range reader without known barriers to learning and reading.

25
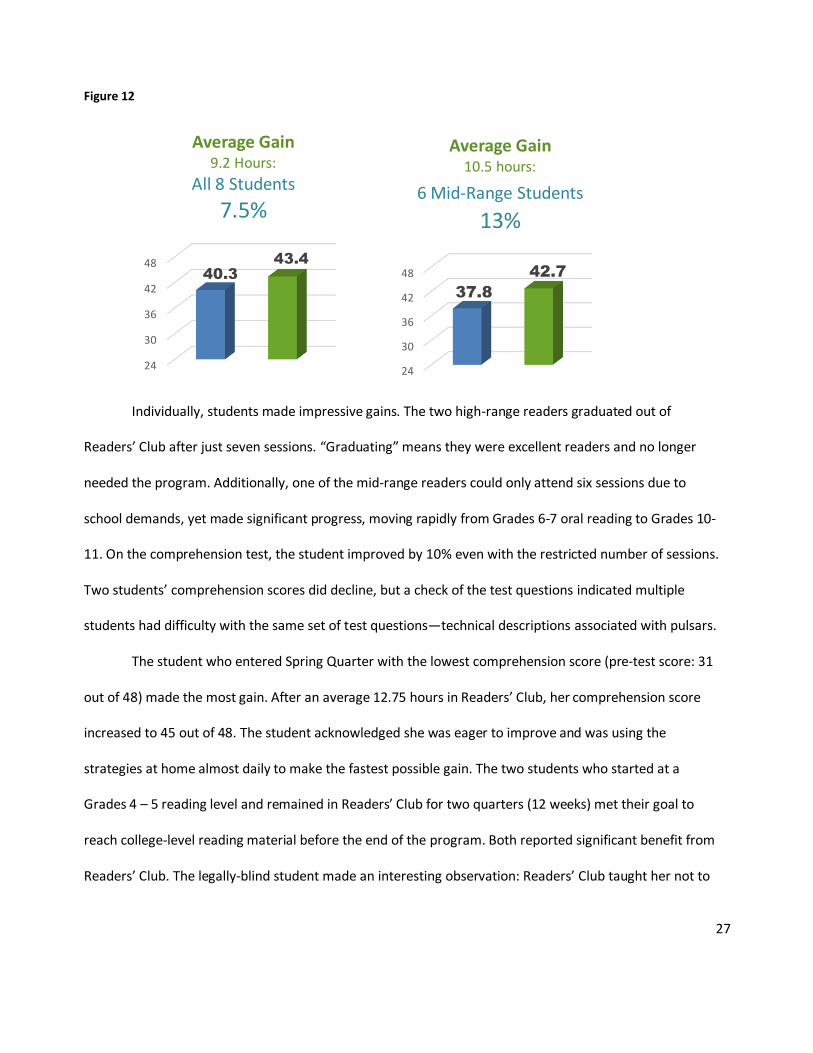
Winter Quarter/Findings - The average number of oral reading errors at pre-test for the four students
was 87.5 (range: 156 to 21). At post-test, the average dropped to 17.25 (range: 41 to 0). This represents an
80 percent reduction in oral reading errors. Although the sample was small, a single factor ANOVA analysis
found the data on the edge of reliable, with a p-value of .051. See Figure 10.
Figure 10
In addition to quantitative results, qualitative data collected in the pilot focus group suggests the
approach is significantly different from what students experienced as developing readers. It also suggests a
high level of satisfaction with the approach. In a “silent graffiti wall” activity, students were asked to use
Post-It notes to report (1) what was different and the same about the activity as compared to how they
originally learned to read, (2) how they felt it did and didn’t help their college-level reading ability, and (3)
what they did and didn’t like about the approach. Once the Post-It notes were up, students were asked to
place a sticker on all Post-Its placed by colleagues with which they agreed. This is referred to as “cases of
agreement”. The four students expressed 16 cases of agreement that Readers’ Club was helpful, with
students expressing 17 cases of liking the approach. One Readers’ Club volunteer expressed the fear that
her assigned partner would find it frustrating to work with her. To the contrary, both pairs and all four
students appeared to develop an appreciation and respect for one another as they worked through the
process. The concerned student concluded that working with a partner was positive and helpful.
Spring Quarter/Participants - After significant progress Winter Quarter (growing from a Grade 4-5
functional oral reading level to Grade 8-9), the ELL and ELL/low vision students both asked to return
Spring Quarter. Six new students joined them: Two additional ELL students raised in monolingual Spanish
0 20 40 60 80 100
Post-Test 17.2587.5
Average Oral Reading Errors – Winter Pilot/4 StudentsPre-Test
26
speaking homes before attending school and/or who moved to the United States around age 7, and four
students born in the U.S. whose first language is English. Pre- and post-test oral reading levels and gains in
comprehension are presented in Figures 11 and 12. ANOVA analysis was used to collapse and assess three
types of data: oral errors and comprehension, plus increase in reading range. The combined data yielded a
p=value of .008, suggesting the data is reliable.
Figure 11
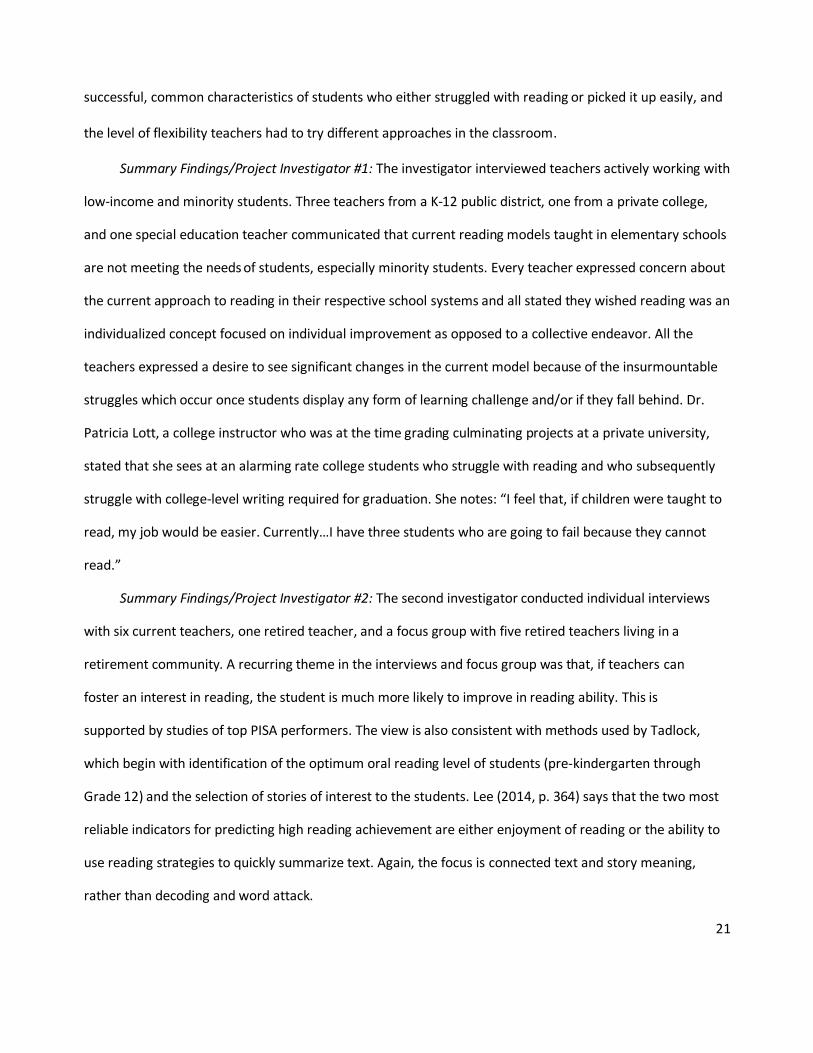
Spring Quarter/Findings - The average number of oral reading errors at pre-test for the eight
students was 69.5 (range: 11 to 158). At post-test, the average reduced to 17.5 (range: 0 to 38). This
represents a 75 percent reduction in oral reading errors. See Figure 11. Comprehension also improved.
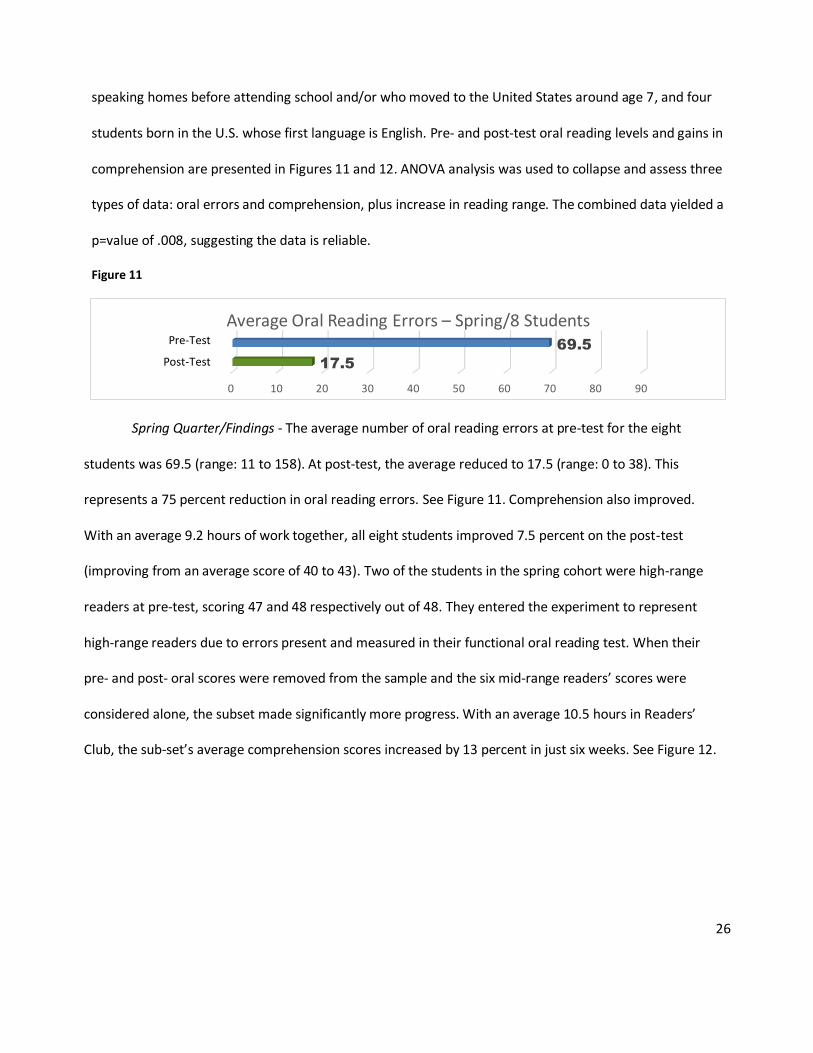
With an average 9.2 hours of work together, all eight students improved 7.5 percent on the post-test
(improving from an average score of 40 to 43). Two of the students in the spring cohort were high-range
readers at pre-test, scoring 47 and 48 respectively out of 48. They entered the experiment to represent
high-range readers due to errors present and measured in their functional oral reading test. When their
pre- and post- oral scores were removed from the sample and the six mid-range readers’ scores were
considered alone, the subset made significantly more progress. With an average 10.5 hours in Readers’
Club, the sub-set’s average comprehension scores increased by 13 percent in just six weeks. See Figure 12.
0 10 20 30 40 50 60 70 80 90
17.5
69.5
Average Oral Reading Errors – Spring/8 StudentsPre-Test
Post-Test
27
Figure 12
Individually, students made impressive gains. The two high-range readers graduated out of
Readers’ Club after just seven sessions. “Graduating” means they were excellent readers and no longer
needed the program. Additionally, one of the mid-range readers could only attend six sessions due to
school demands, yet made significant progress, moving rapidly from Grades 6-7 oral reading to Grades 10-
11. On the comprehension test, the student improved by 10% even with the restricted number of sessions.
Two students’ comprehension scores did decline, but a check of the test questions indicated multiple
students had difficulty with the same set of test questions—technical descriptions associated with pulsars.
The student who entered Spring Quarter with the lowest comprehension score (pre-test score: 31
out of 48) made the most gain. After an average 12.75 hours in Readers’ Club, her comprehension score
increased to 45 out of 48. The student acknowledged she was eager to improve and was using the
strategies at home almost daily to make the fastest possible gain. The two students who started at a
Grades 4 – 5 reading level and remained in Readers’ Club for two quarters (12 weeks) met their goal to
reach college-level reading material before the end of the program. Both reported significant benefit from
Readers’ Club. The legally-blind student made an interesting observation: Readers’ Club taught her not to
24
30
36
42
4840.3
43.4
Average Gain9.2 Hours:
All 8 Students
7.5%
24
30
36
42
48
37.8
42.7
Average Gain10.5 hours:
6 Mid-Range Students
13%

28
focus on word-by-word reading (identifying one word at a time). She observed that, as she adapted to the
methods, it was useful to her to move text further away from her face despite her low vision. She related
this to her intuitively negative feelings about using the magnifier, which she noted causes individuals with
low vision to see only one to three words at a time.
Results of the Spring Quarter focus group also were positive. Once again, a “silent focus group” was
used. This time, the investigator was not in the room to ensure students would not feel pressured or
otherwise inhibited to provide authentic responses. Out of 29 cases of students communicating Readers’
Club did or did not help their reading ability, only three said it did not help and all three of these were
related to reading speed. Whereas these students indicated Readers’ Club did not make them faster
readers, other students shared their speed had increased. The 26 cases of agreement supporting Readers’
Club as helpful included the following: Students liked working with a partner. They also liked discovering
from the approach’s methods that it is a strength for the brain to make word substitutions with text (as
long as the substitutions do not change the meaning). Readers’ Club taught students to “cycle” as a process
of improving reading ability and students found doing so simultaneously improved their oral reading ability
and comprehension. They also said they learned new strategies to be better readers, including text analysis
and anticipating the meaning of text while they read. While they now read familiar text “quicker and with
fewer mistakes,” they also learned to “handle new words and vocabulary better” by slowing down when
they need to, until they “get things right.”
Two hundred miles away, simultaneous to this project, Tadlock directed another student-to-student
model, but with elementary school third graders. For this model, top readers in the class as determined by
all parts of the Woodcock-Johnson Tests of Reading Mastery worked one-on-one with under-performing
peers using methods similar to the college-level Readers’ Club. In four months (February through May
2017) with 25 students at a school where 93 percent are eligible from free and reduced-price school lunch
29
and 92 percent are minority, students helped each other improve in comprehension by an average two-
thirds of one full grade level (0.7). Individually, some students made two years gain in four months.
(McLaughlin 2017)
DISCUSSION
Many variables associated with this study have the potential to negate the findings. A few include:
(1) incorrectly “reading between the lines” and misinterpreting activities of the five top PISA performers
identified to be actively using constructivist approaches; (2) relying upon the memory of local interview
subjects to recall how they learned to read (students) and the practices that best supported reading
development (teachers); and (3) the general and often debated assumption that behaviorist and
constructivist approaches, properly identified and used, are both important and relevant for reading
development.
The investigating team did approach the inquiry with a unique lens: one of the team members, off
and on for 14 years, had worked extensively with Tadlock. The disadvantage of that connection for this
study is clear: the significant potential for bias. However, the advantage was that it provided one
investigating team member with knowledge associated with behaviorism and constructivism, creating the
potential for the team member to identify whether those approaches may have been present in the
nations studied, as communicated through literary sources.
Dismissal of this paper’s findings could be easily justified if the findings had not been applied to an
experimental reading improvement method. That step was taken with evidence of significant growth
found (see Figures 9 - 12), providing evidence that the culminating experiment’s reading improvement
methods are worthy of far more rigorous study. For this to occur in the U.S., education policy must shift to
allow research institutions to investigate more than the skills-based view of reading development.
30
CONCLUSIONS
Literacy and reading achievement are paramount concerns for federal, state, and/or provincial
governments. In the U.S., reading achievement has been stagnant for decades. The results of this
investigation suggest early reading instruction in the U.S is on the wrong track, largely owing to a shift in
education policy occurring in 1998. In that year, policy shifted the focus of early reading instruction almost
exclusively to teacher-led, behaviorist (declarative) instructional activities, de-emphasizing and even
rejecting student-driven, constructivist (procedural) learning. This conclusion is supported by the education
values, policies, and instructional practices observed in nations performing best on the international PISA
assessment for 15-year-olds, as compared to the U.S.
In the five nations studied, the student-driven concepts of “intrinsic motivation” (Finland), be “strict
on yourself” (Japan), “courage in self-criticism” (Shanghai/China), and “grit and hard, hard, hard work”
(South Korea) create intrinsic focus on excellence, which can only be student-driven (constructivist). In
British Columbia, Canada, the province performing best in the world in the PISA reading assessment,
excellence in comprehension and fluent oral reading are simultaneously the focus of reading instruction as
early as Grade 1. This stands in sharp contrast to the U.S.’s focus on five skills taught separately.
The policy-oriented team conducting this inquiry felt it was essential to apply the findings of the
literature review to a culminating experiment to test validity. Pre- and post-testing Winter and Spring
quarters produced data suggesting rapid reading improvement is possible when improvement methods
include student-driven procedural learning that applies effort to an absolute standard of excellence to oral
reading ability. While the sample size was small owing to the voluntary nature of the project, the eight
college students on average improved in both oral reading and comprehension Spring Quarter, with three
types of assessment combined yielding a favorable probability value (p=.008).
This investigation found sufficient evidence for further study of these questions: (1) Do classroom
teachers understand the significant differences between behaviorist declarative instructional activities and
constructivist procedural learning activities? (2) Is an accurate understanding and application of effective

31
procedural learning missing in early reading instruction? And (3) can American students be taught to
embrace “courage in self-criticism” and, as a result, rapidly improve in reading ability? These questions
may be especially relevant since researchers have found a relationship between dyslexia and what they call
procedural learning dysfunction (Nicholson & Fawcett 2007, Nicholson et al. 2010).
A provocative question for the U.S. remains: if public policy has prevented procedural learning from
being an intentional part of early reading instruction, might the omission contribute to nation-wide low
reading achievement? With 70 percent of all American students possibly reading at a basic level or below,
clearly the policy question is worth further exploration.
References Abt Associates (2009). Reading First Impact Study Final Report, November 2008, funded by the U.S.
Department of Education, Institute of Education Sciences. Afflerbach, Peter; Cho, Byeong-Young; Kim, Jong-Yun; Crassas, Maria Elliker; Doyle, Brie (2013, March).
Reading: What Else Matters besides Strategies and Skills? Reading Teacher, 66(6): 440-448. Allington, Richard L. (2015). What Really Matters for Middle School Readers: From Research to Practice,
New York: Pearson Professional Development. Bach, Deborah (2004, June 4). Championing a Heresy in Education—Learn-to-read method claims amazing
results, Seattle Post-Intelligencer. Retrieved online at: http://www.seattlepi.com/ .local/article/Championing-a-heresy-in-education-1146517.php.
BCME - British Columbia Ministry of Education (2017, May 11). Retrieved online from BC’s New Curriculum: https://curriculum.gov.bc.ca/curriculum/english-language-arts/1 .
Biddle, Bruce; Berliner, David (2002, May). A Research Synthesis / Unequal School Funding in the United States, Beyond Instructional Leadership, 59(8): 48-59.
Chall, J, S. (2000). The academic achievement challenge: What really works in the classroom? New York: Guilford Press.
Choi, Amy (2014, Sept. 4) What the Best Education Systems are Doing Right, Ideas.Ted.Com, retrieved online at http://ideas.ted.com/what-the-best-education-systems-are-doing-right/.
CIEB (2016). Center on International Education Benchmarking website: Learning from the World’s High Performing Education Systems, Finland—Instructional Systems. Retrieved online at: http://www.ncee.org/programs-affiliates/center-on-international-education- benchmarking/ top- performing-countries/finland-overview/finland-instructional-systems/.
CMEC - Canada’s Conference of Ministers Education and Culture (2017). List of provincial plans for education. Retrieved online at: http://www.cmec.ca/3 40/Programs-and- Initiatives/Literacy/O verview/index.html
Coles, Gerald (2000). Misreading Reading: The Bad Science that Hurts Children, Portsmouth, NH: Heinemann.

32
Corcoran, Charles (2010). Chinese learning styles: Blending Confucian and Western theories, Journal of Instructional Pedagogies. Retrieved online at: www.aabri.com/manuscripts/131685.pdf
Cothran, Martin (2014, June 1). The History of Phonics, Memoria Press. Retrieved online at: https://www.memoriapress.com/articles/history-phonics/ .
Fazel, P. (2013). Learning Theories within Coaching Process, World Academy of Science, Engineering and Technology, International Journal of Social, Behavioral, Educational, Economic, Business, and Industrial Engineering, 7(8): 2343-2349.
Freeman (2012, Aug. 14). Finland’s Education System: 10 Surprising Facts That America Shouldn’t Ignore in Takepart. Available online at: http://www.takepart.com/photos/ten-surprising-facts-finlands-education-system-americans-should-not-ignore/finland-knows-what-s-best
Goodman, Kenneth, ed. (1968). The Psycholinguistic Nature of the Reading Process. Detroit, MI: Wayne State University Press.
Goodman, Kenneth (2006). The Truth About DIBELS: What it is—What it does, Portsmouth, NH: Heinemann.
GSI (2017, May 23). Overview of Learning Theories, Graduate Student Instructor: Teaching & Resource Center (GSI), Berkeley Graduate Division, retrieved online at: http://gsi.berkeley.edu/gsi-guide-contents/learning-theory-research/learning-overview/ .
Hancock, LynNel (2011, September). Special Report-Educating Americans for the 21st Century—Why Are Finland’s Schools Successful? Smithsonian. Available online at: http://www.smithsonian mag.com/innovation/why-are-finlands-schools-successful-49859555/?no-ist .
Hartas, Dimitra (2011). Families’ Social Backgrounds Matter: Socio-Economic Factors, Home Learning and Young Children’s Language, Literacy and Social Outcomes, British Educational Research Journal, 37 (6): 893-914.
Hendrickson, Katie (2012). Assessment in Finland: A Scholarly Reflection on One Country’s Use of Formative, Summative, and Evaluative Practices, Mid-Western Educational Researcher, 25(1/2).
Hicks, Tyler (2016, Aug. 10) Behaviorism v. Constructivism: Bridging an “Ism” Schism – What Should Special Education Researchers Be? a post on the University of Kansas’ hawkhopesblog. Available online at: https://hawkhopesblog.wordpress.com/2016/08/10/behaviorism-v-constructivism-bridging-an-ism-schism-what-should-special-education-researchers-be/.
Human-Memory.Net (2017, May 12). Retrieved online at: http://www.human-memory.net/types_declarative.html .
IES - Institute of Education Sciences (2013). A First Look—2013 Mathematics and Reading, National Assessment of Educational Progress at Grades 4 and 8. Washington D.C.: National Center for Education Statistics.
Jensen, Eric (2009). Teaching With Poverty in Mind: What Being Poor Does to Kids’ Brains and What Schools Can Do About It. Alexandria, VA: ASCD.
Johnson, G. (1992). In the Palaces of Memory, New York: Vintage Books. Khatib, Michelle (2017, May 11). Retrieved online from Khatib Edit 302, available at
http://mkhatibedit302.weebly.com/uploads/1/0/6/1/10618919/3_behavorism_vs_constructivism.pdf .
Koo, SeWoong (2014, Aug. 1). South Korea’s Education System Hurts Children, New York Times Sunday Review.
Krashen, Stephen (2010). The Goodman/Smith Hypothesis, the Input Hypothesis, the Comprehension Hypothesis, and the (Even Stronger) Case for Free Voluntary Reading in Defying Convention, Inventing the Future in Literacy Research and Practice: Essays in Tribute to Ken and Yetta

33
Goodman. Anders, P. (ed.), pp. 46-60. New York: Routledge. Kuuskorpi, Marko (ed.) (2014). Perspectives from Finland – Towards New Learning Environments,
Finnish Board of Education. Available online at: http://www.oph.fi/download/154594_perspectives_from_finland.pdf
Lancaster Promise Neighborhood (2015). An 84-page community assessment and action plan developed in collaboration with 40 public, private, and civic organizations in Lancaster County, South Carolina.
LeDoux, J. (2002). Synaptic Self: How Our Brains Become Who We Are. New York: Penguin Books.
Lee, J. (2014). Universal Factors of Student Achievement in High-Performing Eastern and Western Countries, Journal of Educational Psychology, 106(2): 364-374.
Lim, Hyo Jin; Bong, Mimi; Woo, Yeonkyung (2015). Reading Attitude as a Mediator Between Contextual Factors and Reading Behavior - Role of Attitude - Executive Summary, Teachers College Record, 117 (1), 1-36. Available online at: http://www.tcrecord.org/Content.asp?ContentId=17715
Manzo, Kathleen (2008, May 1). Reading First Doesn’t Help Students “Get It,” Education Week. Available online at: http://www.edweek.org/ew/articles/2008/05/07/36read_ep.h27.html?tmp= 2126515972 .
McLaughlin, Robert (2016). A Crisis in American Education – A Love Story. Centralia, WA: Gorham. Mickelson, Roslyn A., ed. (1999). Children on the Streets of the Americas—Globalization, Homelessness, and
Education in the United States, Brazil and Cuba, p. 29. New York: Routledge. Miksic, Mai (2014, May 20). The Persistent Achievement Gaps in American Education, Policy Briefings:
IDEALAB, CUNY Institute for Education Policy. Available online at: http://ciep.hunter.cuny.edu/the-persistent-achievement-gaps-in-american-education/.
Mitchell, Baker A. (2011, May 20). The Great Pedagogical Debate: Behaviorism vs. Constructivism, a blog post. Retrieved online from http://bakeramitchell.com/2011/05/20/behaviorism-vs-constructivism/ .
Moats, Louisa (2007). Whole-Language High Jinks: How to Tell When "Scientifically Based Reading Instruction" Isn't. Washington D.C.: The Thomas B. Fordham Institute.
Nam-soo, Seo (2013, Oct. 23). Education in South Korea – Class Struggle, a translated Q&A interview with Seo Nam-soo, South Korea’s Minister of Education, in The Economist.
NAEP - National Assessment of Educational Progress (2015) School Composition and the Black-White Achievement Gap available online at: file:///C:/Users/Ty%20Somerville/Desktop/ TESC%20GRAD/Research%20Work/Achievement%20Gap/NCES%20REPORT%20school_composition_and_the_bw_achievement_gap_2015.pdf
NAEP (2017, May 23). Fast Facts, Reading, National Center for Education Statistics website, retrieved online at https://nces.ed.gov/fastfacts/display.asp?id=147 .
NBME - New Brunswick Ministry of Education (2008). New Brunswick Reading and Writing Standards. Retrieved online at: file:///C:/Users/Rhonda%20Stone/AppData/Local/Microsoft/Windows/ INetCache/IE/8A4MZ955/ReadingAndWritingAchievementStandards-Grade1.pdf
NCEE - National Center on Education and the Economy (2009a). Canada: Instructional Systems. Retrieved online at: http://ncee.org/what-we-do/center-on-international-education-benchmarking/top-performing-countries/canada-overview/canada-instructional-systems/
NCEE (2009b). South Korea: Instructional Systems available online at: http://ncee.org/what-we-do/center-on-international-education-benchmarking/top-performing-countries/south-korea-overview/south-korea-instructional-systems/

34
NCEE (2011a). Finland: Instructional Systems available online at: http://ncee.org/what-we-do/center-on-international-education-benchmarking/top-performing-countries/finland-overview/finland-instructional-systems/
NCEE (2011b). Japan: Instructional Systems available online at: http://ncee.org/what-we-do/center-on-international-education-benchmarking/top-performing-countries/japan-overview/japan-instructional-systems/
NCEE (2011c). Shanghai-China: Instructional Systems available online at: http://ncee.org/what-we-do/center-on-international-education-benchmarking/top-performing-countries/shanghai-china/shanghai-china-instructional-systems/
NCEE (2016a) Japan Overview, 2016, http://ncee.org/what-we-do/center-on-international-education-benchmarking/top-performing-countries/japan-overview/
NCEE (2016b) South Korea Overview, 2016, http://ncee.org/what-we-do/center-on-international-education-benchmarking/top-performing-countries/south-korea-overview/
NCEE (2017a, Jan. 9) Canada Overview, available online at: http://ncee.org/what-we-do/center-on-international-education-benchmarking/top-performing-countries/canada-overview/
NCEE (2017b, Jan. 18) Finland Overview, htNCtp://ncee.org/what-we-do/center-on-international-education-benchmarking/top-performing-countries/finland-overview/
NCEE (2017c, Jan. 9) Shanghai-China Overview, http://ncee.org/what-we-do/center-on-international-education-benchmarking/top-performing-countries/shanghai-china/
NCES - National Center for Education Statistics (2003). The Nation’s Report Card: Reading 2002, June 2003, available online at: https://nces.ed.gov/nationsreportcard/pdf/ main2002/2003521.pdf.
NCES (2013, June). The Nation’s Report Card: Trends in Academic Progress 2012, available online at: http://www.nationsreportcard.gov/ ltt_2012/.
NCES (2015). The Nation’s Report Card 2015 Mathematics & Reading Assessments, available online at: http://www.nationsreportcard.gov/ reading_math_2015/ #reading?grade=4 .
Nicholson, Roderick, and Fawcett, Angela J. (2007, May). Procedural learning difficulties: Reuniting the developmental disorders? in Trends in Neurosciences, 30(4):135-41.
Nicholson, R; Fawcett, A.J.; Brookes, R.L.; Needle, J. (2010). Procedural learning and dyslexia, Dyslexia, 16 (3): 194-212.
NRP - National Reading Panel (2000). Report of the National Reading Panel: Teaching Children to Read. Washington D.C.: National Institute of Child Health and Human Development.
OECD – Organization for Economic Co-operation and Development (2012 April). Education indicators in focus: How pronounced is income inequality around the world – and how can education help reduce it? Available online at www.oecd.org/edu/50204168.pdf .
OECD (2014). Results in Focus: What 15-year-olds know and what they can do with what they know, PISA 2012 report. Available online at: http://www.oecd.org/pisa/keyfindings/pisa-2012-results-overview.pdf .
OECD (2016). 2015 PISA Results: Excellence and Equity in Education, Vol. 1. Retrieved online at: http://www.keepeek.com/Digital-Asset-Management/oecd/education/pisa-2015-results-volume-i_9789264266490-en#.WSWUtOQ2xy0#page3 .
Phillips, Tom (2013). PISA education tests: Why Shanghai pupils are so special, The Telegraph, Dec. 4, 2013. Available online at: http://www.telegraph.co.uk/news/worldnews/ asia/china/10494678/PISA-education-tests-Why-Shanghai-pupils-are-so-special.html.
Polidano, Cain; Hanel, Barbara; Buddelmeyer, Hielke (2013). Explaining the School Economic Status School Completion, Education Economics, 21(3): 230-247.
Rasinski, Timothy (1988). Fluency is for everyone: Principles for Incorporating Fluency Instruction in the

35
Classroom. Kent, OH: Kent State University. Available online at: http://files.eric.ed.gov/fulltext/ED304670.pdf .
Rasinski, Timothy (ed.); Blachowicz, Camille (ed.); Lems, Kristin (2006). Fluency Instruction— Research- Based Best Practices. New York: Guilford Publications.
Rasinkski, Timothy (2013, Aug. 20). Why We Can’t Neglect Reading Fluency—A Personal Journey, The Science of Learning Blog, Scientific Learning. Available online at: http://www.scilearn.com/blog/why-we-cant-neglect-reading-fluency .
RCW - Revised Code of Washington (1977). Basic education—Goals of school districts, 28A.150.210. RCW - Revised Code of Washington (1998). Second grade reading assessment—Selection of reading
passages—Costs, 28A.300.310 Reardon, Sean (2011). The widening academic achievement gap between rich and poor: New evidence and
possible explanations in Whither Opportunity: Rising Inequality and Uncertain Life Chances of Low-Income Children, R. Murnane and G. Duncan, eds. New York: Russell Sage Foundation Press.
Reyhner, Jon (2008). The Reading Wars: Phonics versus Whole Language, online at http://jan.ucc.nau.edu/~jar/Reading_Wars.html.
Richardson, Virginia (2003). Constructivist Pedagogy, Teachers College Record, Vol. 5 (9), 1623-1640, December 2003, Columbia University.
Roser, M. and Ortiz-Orspina, E. (2016). ‘Financing Education’. Published online at OurWorldInData.org. Retrieved from: https://ourworldindata.org/financing-education.
Schacter, D., and Graf, P. (1986). Effects of Ellaborative Processing on Implicit and Explicit Memory for New Associations, Journal of Experimental Psychology: Learning, Memory, and Cognition, 12 (3): 432-44.
Scott, C.; Nelsestuen, K; Autio, E; Deussen, T; and Hanita, M (2010). Evaluation of Read Right in Omaha Middle and High Schools. Portland, OR: Education Northwest.
Sinko, Pirjo (2012). Main factors behind the good PISA reading results in Finland, Finnish National Board of Education Aug. 14, 2012, PowerPoint presentation.
Smith, Frank (1978). Understanding Reading: A Psycholinguistic Analysis of Reading and Learning to Read,
2nd ed. New York: Holt, Rinehart & Winston. Snow, Catherine E; Burns, Susan M.; Griffin, Peg; eds. (1998). The Report of the Committee on the
Prevention of Reading Difficulties in Young Children. Washington D.C.: National Research Council.
Stevenson, Harold (1993, February). Why Asian Students Still Out-distance Americans, Educational Leadership, 50(5): 63-65.
Stone, Rhonda (2017). Nomination of the Lancaster County School District, Lancaster County, South Carolina, for the 2017 Library of Congress American Prize. Nomination composed for the Lee Gilles Literacy Alliance, nominating organization: www.lgliteracyalliance.org .
Strauss, Valerie (2013, Dec. 15). Did Shanghai Cheat on PISA? The Washington Post. Retrieved online at: https://www.washingtonpost.com/news/answer-sheet/wp/2013/12/15/did-shanghai-cheat-on-pisa/?utm_term=.e9416384c793 .
Tadlock, Dee (2004). Interactive Constructivism and Reading: The Nature of Neural Networks Challenges the Phonological Processing Hypothesis. Request copies available from [email protected].
Tadlock, Dee, and Stone, Rhonda (2005). Read Right! Coaching Your Child to Excellence in Reading. New York: McGraw-Hill.
The Guardian (2012). PISA 2012 results: Which country does best at reading, maths, and science? Retrieved from: https://www.theguardian.com/news/datablog/2013/dec/03/pisa-results- country-best-reading-maths-science.
Thurlow, Martha; Liu, Kristin; Albus, Debra; Shyyan, Vitaliy (2003, Oct. 21). Literature on Early

36
Literacy Instruction on Four Languages, a report prepared for the National Center on Educational Outcomes, University of Minnesota, Minneapolis. Available online at: https://nceo.umn.edu/docs/OnlinePubs/4LangLiteracy.pdf .
Tucker, Marc S (2011). Surpassing Shanghai: An Agenda for American Education Built on the World’s Leading Systems. Cambridge, MA: Harvard University Press.
UNESCO - United Nations Educational, Scientific and Cultural Organization (2016). Introducing UNESCO, UNESCO website. Online at: http://en.unesco.org/about-us/introducing-unesco.
Vanneman, A., Hamilton, L., Baldwin Anderson, J., and Rahman, T. (2009). Achievement Gaps: How Black and White Students in Public Schools Perform in Mathematics and Reading on the National Assessment of Educational Progress, (NCES 2009-455). National Center for Education Statistics. Washington D.C.: Institute of Education Sciences, U.S. Department of Education.
World Literacy Foundation (2015, Aug. 24). The Economic & Social Cost of Illiteracy—A snapshot of illiteracy in a global context, Final Report from the World Literacy Foundation.
World Prison Brief. Available at: http://www.prisonstudies.org/highest-to- lowest/prison_population_ rate?field_region_taxonomy_tid=16 .
Wu, Angela (1999, January). The Japanese Education System: A Case Study Summary and Analysis, Research Today International Studies. Available online at: https://eric.ed.gov/?id=ED426958 .