shimon sarraf center for postsecondary research, indiana university bloomington using nsse to answer...
Post on 22-Dec-2015
218 views
TRANSCRIPT
Shimon Sarraf
Center for Postsecondary Research, Indiana University
Bloomington
Using NSSE to Answer Assessment Questions
Regional User’s WorkshopOctober 2005

Overview
Why should “engagement” be assessed
Assessment Techniques with NSSE data
Group Exercise and Discussion
“NESSIE”
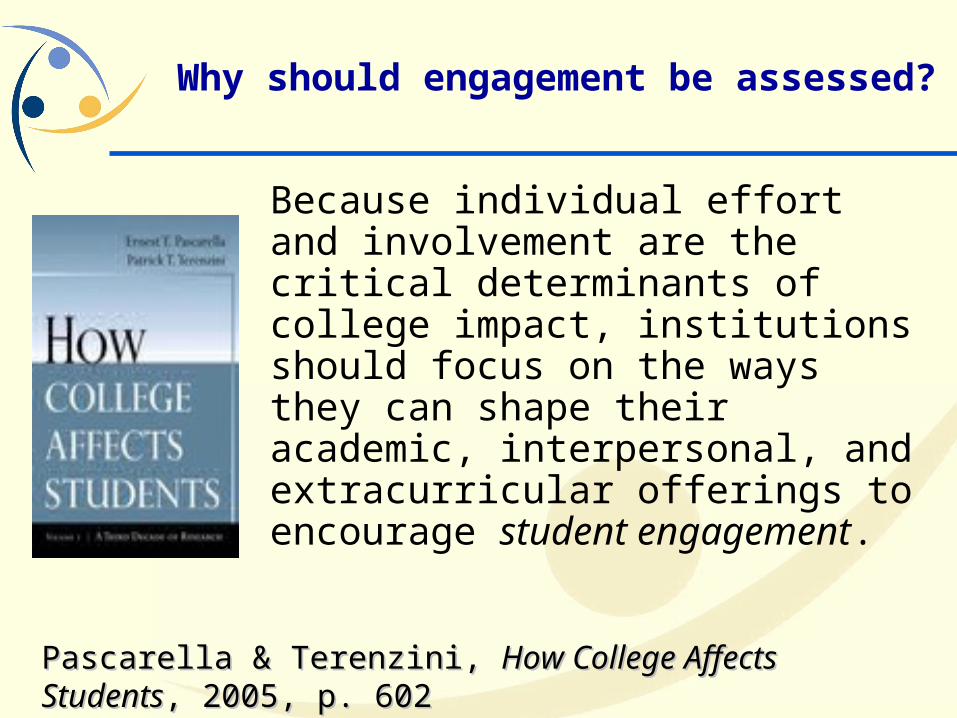
Why should engagement be assessed?
Because individual effort and involvement are the critical determinants of college impact, institutions should focus on the ways they can shape their academic, interpersonal, and extracurricular offerings to encourage student engagement.
Pascarella & Terenzini, Pascarella & Terenzini, How College Affects StudentsHow College Affects Students, , 2005, p. 6022005, p. 602
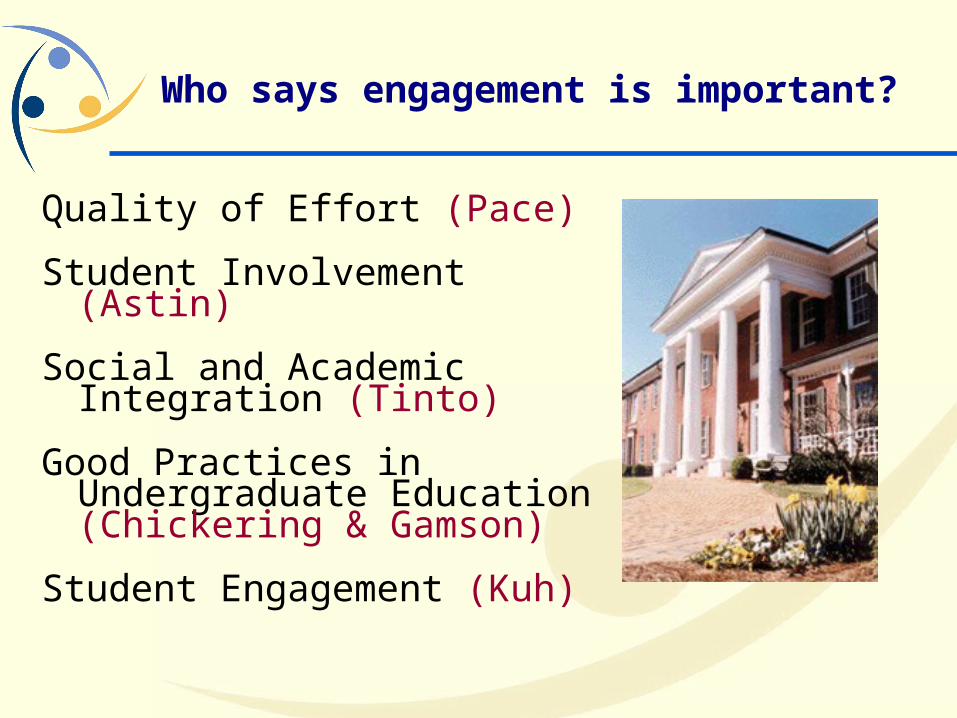
Who says engagement is important?
Quality of Effort (Pace)
Student Involvement (Astin)
Social and Academic Integration (Tinto)
Good Practices in Undergraduate Education (Chickering & Gamson)
Student Engagement (Kuh)

Assessment Approaches
Normative - compares your students’ responses to those of students at other colleges and universities.
Criterion - compares against a predetermined value or level appropriate for your students, given your institutional mission, size, curricular offerings, funding, etc.
Longitudinal – compare your average scores over time

Assessment with NSSE Data
Descriptive displays of engagement patterns by any number of student characteristics
Use individual items and/or scales
Year-to-year tracking of student engagement
Multivariate models for retention, degree attainment, grades, other outcomes
Special peer comparisons with aspirational, regional, and mission-related institutions

Descriptive Analysis
Comparisons by Student Background Minority Students First Generation College Student
Comparisons by Enrollment Characteristics Greek Athletes College and/or Department

Approaches to Descriptive Analysis
Most valued activities
What is most valued at your institution, in departments, what does the data show?
Investigate “Nevers”
Work on reducing or eliminating reports by students of never doing specific engagement activities.
How much variation?
Box & Whiskers

"Frequently" Asked Questions in Class
80 8073
83
69
7870 70 72
0
20
40
60
80
100
Arts Bio Bus Educ Eng PhysSci
Prof Soc Sci Other
Descriptive Analysis
Responses of Seniors by Major

"Frequently" Made a Class Presentation
54
10
86
69
54
11
4245
57
0
20
40
60
80
100
Arts Bio Bus Educ Eng PhysSci
Prof Soc Sci Other
Descriptive Analysis
Responses of Seniors by Major

0
10
20
30
40
50
60
%
Prepare MultipleDrafts
Fac ActivitiesOut-of-Class
Tutored Others ServiceLearning
Faculty CareerPlans
Fac Ideas Out-of-Class
Seniors Never Participating

4843
0
20
40
60
80
100
Started Here
Transfer
95th Percentile
75th Percentile
Median
25th Percentile
5th Percentile
4843
0
20
40
60
80
100
Started Here
Transfer
95th Percentile
75th Percentile
Median
25th Percentile
5th Percentile
Descriptive Analysis

T-test: p<.000; Effect Size: -.29
Active/Collaborative Learning
4843
0
20
40
60
80
100
Started Here
Transfer
Descriptive Analysis
Seniors Scale Scores by Transfer Status

30
35
40
45
50
55
60
Lowest Major
Average
Highest Major
Business Engineering Other Education Profes-sional
Arts &Humanities
SocialSciences
BiologicalSciences
Math &PhysicalSciences
Management
ChemicalEngineering
MechanicalEngineering
CriminalJustice
Kinesiology
PhysicalEducation
Elem./MiddleEducation
Pharmacy
Pre-Med
Theater orDrama
Speech
PoliticalScience
Sociology
Biochemistry
EnvironmentalScience
Chemistry
Math
InternationalBusiness
Variations in Student-Faculty Interaction by Discipline

Data Consideration: Disaggregating Results
Experience indicates that survey results are most likely to be used when the results are disaggregated by specific program or unit (e.g., college or department).
Targeted oversamples of specific units may be warranted.
Sampling error statistics may not be a good indicator of data quality with smaller units.

Percent "Frequently" on Student-Faculty Interaction Items Across Years: First-Year Students
0
10
20
30
40
2001 2002 2003 2004
facgrade
facplans
facideas
facfeed
facother
Comparisons Across Years
FY Student Responses to Stu-Fac Items by Year

Student-Faculty InteractionMeans across Four Years
3736 3532
394039 37
0
20
40
60
80
100
2001 2002 2003 2004
First-year
Senior
Comparisons Across Years
FY and Senior Stu-Fac Scale Scores by Year

Benchmark Comparison Across Years: First-Year Students
20
40
60
80
2001 2002 2003 2004
Acad Chall
Act-Coll Lrng
Stu-Fac Int
Supp Camp Envt
Comparisons Across Years
FY Scores on Four Scales by Year

FY Student t-test Comparisons 2003 and 2004 at Nesseville State
Independent Samples t-tests of FY Students between 2003 and 2004
Student-Level "Benchmark" Score 2003 2004 SD sig.Effect Size
Academic Challenge 55 54 13 .23 .08
Active and Collaborative Learning 41 41 15 .65 .00
Student-Faculty Interaction 41 38 19 .00 .16
Supportive Campus Environment 61 60 17 .35 .06

Regression on Student-Faculty Interaction with Year
B Std. Error Beta t Sig.(Constant) 39.6 9.6 4.1 0.000international 3.6 3.1 0.0 1.1 0.255enrollment -2.5 4.2 0.0 -0.6 0.551sex -1.1 1.3 0.0 -0.8 0.397major: art 1.5 2.5 0.0 0.6 0.553major: bio 0.1 2.8 0.0 0.0 0.983major: bus 3.5 2.4 0.1 1.4 0.156major: phys -4.3 4.4 0.0 -1.0 0.325major: sos -0.1 2.7 0.0 0.0 0.975major: und -5.0 4.6 0.0 -1.1 0.279major: oth 1.9 2.6 0.0 0.7 0.473major: pro 2.5 2.9 0.0 0.9 0.391YEAR 3.6 1.2 0.1 2.9 0.004

Multivariate Modeling
Regression model predicting grades at the end of the first year.
0.03
0.11
0.34
0.14
0.09
0.10
0.06
0.00 0.10 0.20 0.30 0.40
Institution provides support for academicsuccess
Overall Satisfaction
SAT Total Score
Sex
Hours per week spent preparing for class
Active and Collaborative Learning
Student-Faculty Interaction
Standardized Beta

Multi-equation Modeling
A structural equation model explaining longitudinal relationships that lead to FY grades.
End of First-Year
GPA
SAT Score
HS Rank
Gender
Race
Financial Status
Level of Academic Challenge
Student-Faculty
Interaction
Integrative Learning
Pre-college
Engagement
Outcome

Special Peer Comparisons
Selecting a peer group
By mission
By size
By department
By Race
By Locale
Current or Aspirant Peers

Special Peer Comparisons
Standard Frequency Report with Selected Peer Group
Variable Response Options Count Col % Count Col % Count Col % Count Col %
CLQUEST Never 46 3% 183 6% 520 3% 1,250 3%Sometimes 563 42% 1435 48% 7,300 37% 16,897 35%Often 452 34% 925 31% 7,061 35% 16,784 35%Very often 268 20% 461 15% 5,074 25% 12,815 27%
Total 1,329 100% 3004 100% 19,955 100% 47,746 100%
First-Year Students
NSSEville Selected Peers Master's NSSE 2005

Special Peer Comparisons
Variable Class Mean
Master's Mean Sig a
Effect
Size bNSSE 2003
Mean Sig a
Effect
Size b
FY 2.95 2.81 2.84
SR 3.19 3.13 3.12 CLQUEST
In your experience at your institution during the current school year, about how often have you done each of the following? 1=never, 2=sometimes, 3=often, 4=very often
Master's NSSE 2003Nesseville
Nesseville compared with:
Carnegie Group
Living on-campus
Variable Class Mean
Residential Master's Mean Sig a
Effect
Size bNSSE 2003
Mean Sig a
Effect
Size b
FY 3.04 2.81 2.85
SR 3.54 3.19 3.20 CLQUEST
In your experience at your institution during the current school year, about how often have you done each of the following? 1=never, 2=sometimes, 3=often, 4=very often
Master's Residential NSSE 2003 ResidentialNesseville
ResidentialNesseville Residential compared with:
Commuters
Variable Class Mean
Commuter Master's Mean Sig a
Effect
Size bNSSE 2003
Mean Sig a
Effect
Size b
FY 3.11 2.80 ** .21 2.81 ** .22
SR 3.16 3.12 3.10 CLQUEST
In your experience at your institution during the current school year, about how often have you done each of the following? 1=never, 2=sometimes, 3=often, 4=very often
Master's Commuters NSSE 2003 CommutersNesseville
CommutersNesseville Commuters compared with:

Special Peer Comparisons
Student Level Benchmark Report

Special Peer Comparisons: Student Distributions
49
4239
28
58 58
76
92
6670
0
20
40
60
80
100
School A School B
Bench
mark
Sco
re
First-year academic challenge scores
Are these two schools the same?
• Same median benchmark score
• Different range of scores

Data Considerations
Standard error of mean (precision of estimate)
Non-response bias
Weighting your sample to look like the population
Comparability of survey items year-to-year
Use other assessment techniques (i.e., focus groups, other surveys) to validate your findings—NSSE is but one source of assessment information

NSSE Consortium
6 or more institutions sharing comparative data
Great way to add value to participation
Often times mission specific
Ability to ask additional questions
Select Consortia
Urban Institutions
Women’s Colleges
Private Liberal Arts
Research Universities
HBCUs
Christian Colleges
Jesuit Institutions
State Systems

Sample Consortium questions

Assessment Exercise : Department-Level Analysis
Scenario
Nesseville State University is preparing for an upcoming accreditation related to its engineering program
The college was encouraged to incorporate more “student voice” into their educational outcomes assessment
The University Provost and College Dean have worked to increase buy-in for using NSSE to collect information

Assessment Exercise : Department-Level Analysis
Concerns to Address
Faculty are concerned that the Engineering College places too little emphasis on challenging and engaging pedagogical practice
The Dean is concerned that some of the departments are not preparing their students for life after graduation as well as others
The Provost would like to know how NSU engineering students compare to Engineering students nationwide
In previous Campus Surveys Engineering students have voiced dissatisfaction with their undergraduate experience

Assessment Exercise : Department-Level Analysis
Building the Analysis
In submitting their population file, Nesseville State University included an extra variable to identify Engineering students and their departments within the College
Nesseville State indicated that they wished to oversample all Engineering seniors not identified for the random institutional sample
NSU constructed several NSSE student-level scales to use as a basis for their analysis, as well as requested a special analysis from NSSE to get normative data
Assessment Exercise : Department-Level Analysis
What are some patterns that are evident in these results?
Were the expressed stakeholder concerns confirmed?
What differences are notable among departments?
What are some other sources of data that would be ideal to shed light on these results?
What additional analyses would you want to conduct?

Using NSSE to Answer Assessment Questions
Shimon SarrafResearch Analyst
Indiana University Center for Postsecondary Research1900 East 10th Street
Eigenmann Hall, Suite 419Bloomington, IN 47406
Ph: 812-856-2169
www.nsse.iub.edu