shock accelerated cylindrical gas inhomogeneities … accelerated cylindrical gas inhomogeneities...
TRANSCRIPT

Shock accelerated cylindrical gas inhomogeneities
Part 2. A heavy gas cylinder
By J.W. Jacobst
California institute of Tecbnology. Pasadena, CA 91125
Experiments have been carried out in which a cylindrical volume of a heavy gas is impulsively
accelerated by a weak shock wave. A laminar jet of sulphur hexafluoride (SF6) is used to produce
the heavy gas cylinder. Planar laser induced fluorescence (PLIF) is used to visualize the flow. In
viewing the PLIF images it is discovered that the vorticity that early on resides on the boundary
between the two gasses, separates from the cylinder to form a pair of vortices. Subsequently these
vortices wrap the heavy gas around them. This process is quite different from what is observed
when the cylinder is lighter than its surroundings. Similar experiments with helium (part 1 of this
series) showed that a small amount light gas stays with the vorticity, eventually becoming part of
the vortex cores. A simple model capable of explaining these differences is presented. In addition,
the displacement of the jet cross section is measured and agrees reasonably well with previous
experimental and computational results.
1. Introduction
Flows produced by the interaction of pressure and density gradients encompass a large
class of problems in fluid mechanics. It is well known that the misalignment of pressure and
density gradients produces vorticity, and thus motion, in an otherwise quiescent fluid. Generally,
the magnitudes of the pressure gradients involved in these situations are small. Thus, for the most
part these are relatively slow moving flows. For example in natural convection, motion is
t Present address: Department of Aerospace and Mechanical Engineering. University of Arizona. Tucson, AZ 85721

produced by the interaction of a density gradient caused by a nonuniform temperature distribution
and a hydrostatic pressure gradient. Most often the temperature gradients are not large enough to
produce a high degree of stratification. Even in cases where large density differences exist. the
velocity of motion is often limited by a pressure gradient that results from gravity. On the other
hand. even weak shock waves contain substantial pressure gradients. Thus, the interaction of a
moderate density gradient with a weak shock wave produces a flow having considerable velocity.
This class of flows was first studied in the configuration of a nearly plane interface,
separating gases of different density, by Richtmyer (1960) and Meshkov (1969). It was found that
a small disturbance on the nearly flat interface will grow with time, when acted on by a passing
shock wave. Rudinger & Somers (1960) later studied the interaction of plane shock waves with
three-dimensional light and heavy gas inhomogeneities produced using either spark discharges or
small jets of H2, He or SF6. This work was carried to more fundamental level by Haas &
Sturtevant (1987) with experiments which studied the interaction of shock waves with light and
heavy gas inhomogeneities having either cylindrical or spherical geometry. Since then Picone &
Boris (1988) and others have worked to computationally reproduce the results of Haas &
Sturtevant.
Part 1 of this series examined the flow produced by the interaction of a weak shock wave
with a cylindrical region of gas that is lighter than its surroundings. This work improved on
shortcomings in the earlier experimental investigations of Rudinger & Somers (1960) and Haas &
Sturtevant (1987) by utilizing two new techniques. First, a technique was developed to produce
light gas cylinders. A laminar jet was used to produce cylinders that were free from the membrane
needed by Haas & Sturtevant to contain the light gas. Second, planar laser induced fluorescence
(PLIF) was implemented to visualize the flow. The Helium flow was seeded with a small amount
of the biacetyl (Epstein 1977), and then made to fluoresce with a sheet if laser light.
The experiments in this part of the series utilize the same techniques used in Part 1. Thus
these experiments benefit from the improvements of Part 1 over previous experiments. Sulphur
hexafluoride (SF6) is used instead of helium to produce cylinders that are roughly five times the
-2-
density of the surrounding air. Except for modifications that were needed to accommodate a heavy
gas jet, the experimental set-up is unchanged from Part 1. The most important of these
modifications is that the heavy gas jet is directed vertically downward, instead of upward, in the
shock tube. A brief description of the experimental apparatus is given in the following section.
For a more complete description see Part 1 of this series (Jacobs 1990).
2. Experimental Apparatus
Experiments were carried out in a 26.67 cm square test section mounted to the Galcit 17
inch shock tube. A 152.4 cm long "cookie cutter" was used to provide a transition from round
shock tube to square test section. Visual access to the test section was provided by a pair of 15.24
cm diameter round windows. 0.152 mm thick aluminum diaphragms were used to produce a
shock Mach number of approximately 1.095. A laminar SF6 jet was introduced into the test
section with the same rig used in Part 1. SF6 is heavier than air, so the rig had to be turned upside
down to produce a stable jet The jet issued from a 0.794 cm diameter opening oriented vertically
downward, directly on top of the lower window. Similarly, a larger 1.9 cm opening, was situated
8.9 cm directly below the jet exit, to collect the heavy gas and remove it from the shock tube. The
SF6 supply was split into two streams with one stream passing through a pool of liquid biacetyl
seeding it with nearly saturated vapor. A ratio of 6 parts pure SF6 to 1 part biacetylladen SF6 was
used with a total flow rate of 11.6 cc/s.
Planar laser induced fluorescence utilized a flashlamp pumped dye laser providing 100 mJ
0.7 Ils pulses of 430 run laser light The resulting 18 mm beam was focused using a set of lenses
to provide a sheet of laser light that bisected the biacetyl seeded SF6 jet, illuminating a 1 mm thick
cross section. The jet/laser sheet orientation is illustrated in figure 1. The resulting fluorescent
image was captured using an intensified solid state video camera that was positioned so that it
viewed upward through a window in the bottom of the test section. The camera output was sent to
a frame grabber housed in a laboratory microcomputer. A shadowgraph system consisting of a
spark source, two concave mirrors, two flat mirrors, a video camera and a frame grabber was also
-3-
used to visualize the flow. This system was oriented horizontally, so that a view of the full length
of the jet could be obtained. Timing was accomplished using digital delay generators, triggered by
signals from pressure transducers mounted flush in the test section walls.
In these experiments, biacetyl is used as a tracer for the gas initially contained in a laminar
jet The effectiveness of a tracer, whenever diffusion is occurring, is governed by how closely
matched the diffusion of the tracer is to that of the tagged species. In the light gas experiments of
Part 1, biacetyl was used as a tracer for helium. It was found that biacetyl and helium have largely
different diffusion coefficients. Because of this fact, care had to be taken in interpreting the PLIF
results, especially when mixing was an issue. In the present experiments, the diffusivities of SF6
and biacetyl are much more closely matched. Thus, biacetyl a much better tracer for SF6, and
measured PLIF intensities more closely correspond to SF6 concentration.
3. Results and Discussion
Shadowgraph was primarily used in these experiments to provide full-length views of the
evolving heavy gas cylinder. However, the system was also useful in monitoring the SF6 jets, to
determine what flow rates provided jets of sufficient uniformity. In doing so it was discovered that
much lower flow velocities were needed to produce jets free from instabilities, in these
experiments, than were required in the previous experiments using helium jets. This is because
SF6 has a much lower kinematic viscosity than helium (0.025 cm2/s as opposed to 1.22 cm2/s for
helium). Thus, an SF6 jet with the same velocity as a helium jet has a much higher Reynolds
number. A flow rate of 11.6 eels was chosen as providing the best results; though, even at this
flow rate, instability waves were still present. This gave a jet Reynolds number of 730,. based on
the mean velocity. Figure 2a is a shadowgraph photograph of a typical jet As was found with the
helium jets, the magnitude of suction applied to remove the SF6 stream had no effect on the
stability of the jet
Runs were made utilizing the shadowgraph system to determine whether the flow resulting
from a nearly two-dimensional jet remains nearly two-dimensional. All runs in this study were
-4-
made at an incident shock Mach number of approximately 1.095. Figures 2b, c and d are
photographs taken 0.112, 0.510 and 0.927 ms after the passage of the shock wave. Figure 2b
shows the shock wave shortly after having passed through the SF6 jet. The sequence shows that
jet segment is chopped off of its support by the flow behind the shock. Except for small regions
confmed to the ends of the jet segment, the jet remains remarkably straight.. The jet segment
becomes slightly skewed as it is pushed down the shock tube. This effect is a result of a variation
in density along the length of the jet caused by the outward diffusion of SF6. Portions of the jet
farther from the jet exit (and thus of slightly lower density) are pushed faster (and thus farther
downstream) than sections closer to the exit.
Confident that the flow was very nearly two dimensional, runs were made utilizing laser
induced fluorescence to obtain a cross-sectional view of the flow. This cross section was taken
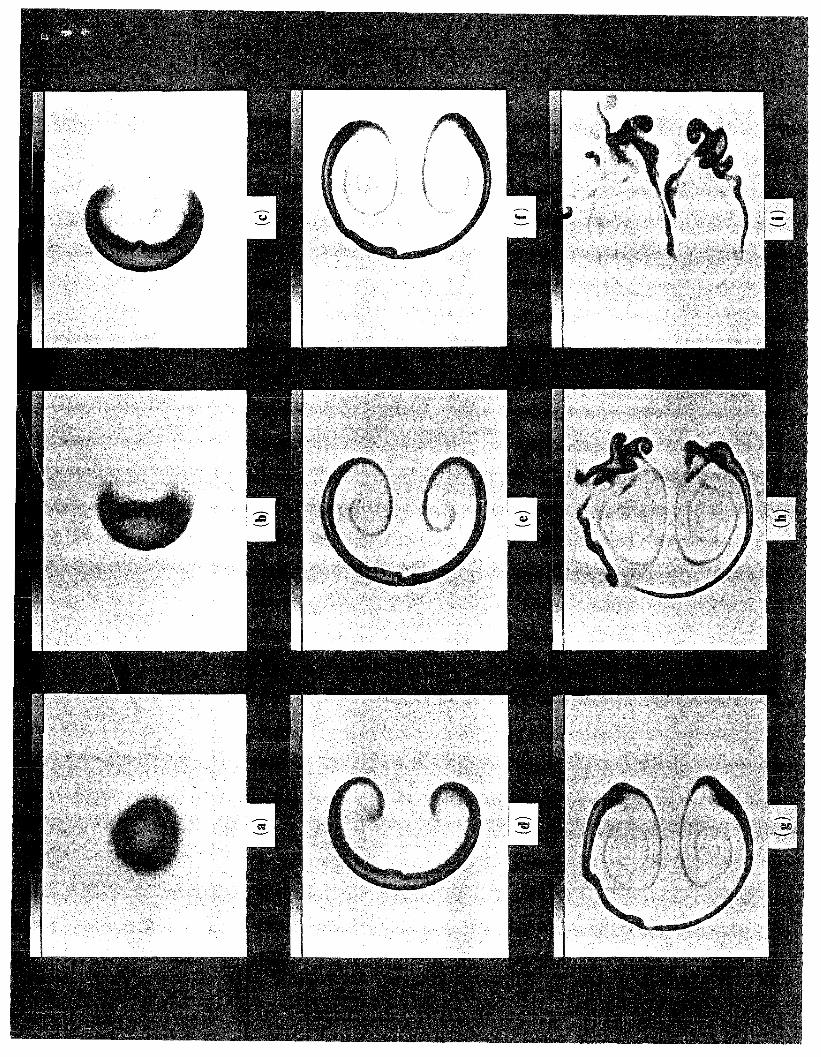
3.81 cm from the jet exit (4.8 jet exit diameters). Figure 3 is a sequence of PLIF images taken
from these runs. The pictures are displayed in false color with white representing the lowest
fluorescent intensity and yellow the highest Figure 3 contains images from 8 separate runs, all
with nearly identical conditions and taken at different times after the passage shock wave. Also
shown is a view of a typical quiescent jet cross section (figure 3a). Note that initial jet cross
section is not perfectly circular. This lack of symmetry is most likely caused by an instability of
the laminar jet that is too small to be visible in the shadowgraph images. In experimenting with the
SF6 flow rate, it was found that the degree of asymmetry could be decreased (or increased), by
decreasing (or increasing) the flow. However, when the flow rate was reduced below 11.6 ccls, a
more disruptive instability developed. Thus, perfectly symmetrical jets could not be obtained. The
degree of asymmetry changed daily, even though great care was taken to insure that the test
conditions were identical. It is for this reason that it is believed that the asymmetry is a result of an
instability.
Figure 3b, taken 0.217 ms after the passage of the shock, shows an initial flattening of the
cylinder, caused by the compression of the shock wave, and the beginning of the formation of a
crescent shape. The protrusion near the center of the downstream edge of the cylinder in figure 3b
-5-

and c is caused by a jet of fluid that is produced by the focusing of the transmitted shock wave.
Figure 3c, taken at t = 0.374 ms, shows further spreading of the crescent shape. In figures 3d and
e, vorticity that initially resides on the boundary of the cylinder appears to be shed from the heavy
gas and collect in the wake of the cylinder to form a vortex pair. The heavy gas strip is then
wrapped around these vortices by their induced velocity. Figure 3f shows the beginning of the
formation of waves on the heavy gas strip. In figure 3g these waves continue to grow as the gas
is swept to the rear of the vortices. In figure 3h, similar waves can be observed in the thin
filaments of heavy gas that spiral into the vortex cores. Finally, as the heavy gas builds up at the
rearward stagnation point, the waves have grown to a point where they dominate the flow and
further help dissipate the gas.
In these experiments, vorticity is produced by the interaction of a plane shock wave with
the density gradient at the jet boundary. The magnitude of this vorticity is proportional to the
product of the density and pressure gradients as well as to the degree of their misalignment. Thus,
the vorticity is localized at the jet boundary, and is distributed such that it is maximum at the cross
stream edges of the jet and zero at the front and back edges. This gives the vorticity the form of
two semicircular vortex sheets of opposite sign. The vortex strength distribution in these sheets is
maximum at the center of the sheets, and decays to zero at the ends. From this viewpoint, the
difference between an accelerated light gas cylinder and a heavy one is in the sign of the vorticity.
And to first approximation, one would expect the evolution processes for these two cases to be
similar, but having opposite sign. However, the pictures of figure 3 reveal a completely different
process than what was observed in the light gas experiments of Part 1. In the light gas
experiments, the later stages of development were characterized by a small amount of helium
becoming incorporated with the vorticity, and eventually becoming part of the vortex cores. Where
as, in the heavy gas experiments shown in figure 3, the bulk of the vorticity separates form the
heavy gas to form line vortices that are free from SF&
The qualitative differences between these two cases can be explained with the aid of the
simple model. In the experiments, circular regions of either a light or heavy gas have vorticity that
-6-

is distributed on the boundary. This vorticity is distributed such that it is concentrated on opposite
sides of the cylinder. This configuration can be reasonably approximated by the simpler model of
a vortex located at the vertex of a wedge shaped region of a gas that is either lighter or heavier than
its surroundings. This model is illustrated in figure 4a for a heavy gas wedge and in figure 4c for
a light gas wedge. In this configuration the vortex will induce a circular motion around its center,
causing the wedge to wrap around its vertex. The resulting centripetal acceleration, caused by the
circular motion of the fluid, will produce a radial pressure gradient given by
However, the gases inside and outside the the wedge have different densities, so the gradient will
have different values in the two fluids. If the density is larger inside the wedge, the pressure
gradient will be larger inside the wedge as well. The pressure is assumed to be uniform at infinity
(where there is no motion). Thus, the pressure will be lower inside the wedge near the vortex, and
there will be a pressure difference across the interface separating the two gasses. This pressure
difference will produce a secondary motion causing the interface to move inward, pinching off the
vertex of the wedge as shown in figure 4b. Now if the wedge shaped region contains gas that is
lighter than its surroundings, the process is reversed. The pressure gradient would be smaller
inside the wedge, resulting in higher pressure inside than out. This would produce a secondary
flow causing the interface to move outward, and the wedge would swell as shown in figure 4d.
Thus with a heavy gas wedge, the vortex is pinched off from the heavy gas, promoting separation.
With a light gas, the wedge swells, encompassing the vortex. These results can be viewed in
another way. The circular motion induced by the vortex produces centrifugal forces. These forces
operate on the surrounding fluid by forcing the heavier of the two gases away from the vortex. At
the same time, continuity ensures that the lighter of the two gases moves toward the vortex. Thus,
lighter gases are attracted toward vorticity, and heavier gases are repelled.
-7-

This process is further enhanced by the differences in the rates of the diffusion of vorticity
in the two gases. Suppose a unifonn distribution of vorticity were deposited on the boundary
separating two quiescent gases having different kinematic viscosities. Since the rate at which
vorticity diffuses in a fluid is governed by its kinematic viscosity, the vorticity will diffuse much
more readily into the more viscous gas. Mter a period of time, more of the original vorticity would
reside in the more viscous gas than in the less viscous one. The kinematic viscosity of a gas is
closely linked to its density. Heavy gases almost always have lower kinematic viscosities than
lighter ones. Thus, in cases with largely different density, vorticity will tend to diffuse into the
lighter gas and away from the heavier one. This process together with the dynamic mechanism
described above explains why the vorticity, originally deposited on the cylinder boundary,
eventually ends up in the lighter of the two gases.
The latter half of the evolution process shown in figure 3 is dominated by the growth of a
disturbance on the deforming heavy gas cylinder. The disturbance is initially of small amplitude,
however it soon grows to a point where it drowns out the original features of the flow. This type
of behavior indicative of an instability. At the point of first appearance, waves arise on a strip of a
heavy gas that is being wrapped around a vortex pair. This wrapping cannot be accomplished
without a sizeable centripetal acceleration. Thus the heavy gas strip resides in a very strong
acceleration field. In this configuration the strip is susceptible to Rayleigh-Taylor instability. A
second cause for instability may result from shear. Most of the vorticity that was initially deposited
on the heavy gas cylinder by the passing shock wave is shed by the heavy gas. However, it is
very likely that a small amount of vorticity still resides at the edge of the heavy gas at the point
where the waves begin to fonn. Thus, the heavy gas strip is in a shear flow and is likely to
experience Kelvin-Helmholtz instability. The growth of the disturbances observed in the PLIF
images is probably a result of both mechanisms described above. At the point when the
disturbance first appears the instability is in an accelerated shear flow. Thus, the instability results
from a combination of Rayleigh-Taylor and Kelvin-Helmholtz instabilities.
-8-
A remarkable result of the light gas experiments in Part 1 was the symmetry of the cross
sectional views of the defonning helium cylinder. In viewing the sequence of figure 3 it is clear
that this degree symmetry is not shared with the current experiments. Even though the images in
figure 3 g-i appear to be chaotic, the general features of the flow observed in figure 3 were very
repeatable. Slight daily variations did exist in these experiments. However, these differences were
mainly in the degree and time of appearance of the instability. For instance, the time that the
instability waves first appeared on the heavy gas strip differed from day to day. However, the
instabilities always appeared first (and grew to a greater degree) on the side of the cylinder
corresponding to the top of photographs in figure 3. It is believed that these instabilities were a
direct result of the nonunifonnity present in the initial laminar jet. The size and time of appearance
of these disturbances were dependent on the degree of initial nonunifonnity. Thus, the
asymmetrical flow pattern observed in figure 3 was a direct result of asymmetries in the initial
state.
3.1 Displacement
A shock wave traveling down the shock tube will accelerate a fluid particle that it travels
through, from rest to a constant velocity V where
V= 2ao (Ms __ 1_) 'Y +1 Ms
Here y is the ratio of specific heats and ao is the speed of sound preceding the shock. The shock
wave will similarly accelerate a fluid particle residing in the jet, but because SF6 is heavier than air,
the heavier gas will be accelerated to a velocity less than V. Thus the cylinder travels downstream
more slowly than the surrounding gas. For a very short period of time the SF6 cylinder translates
through the air as though it were solid. However. the cylinder very rapidly is forced to deform,
and eventually becomes wrapped around a vortex pair. Figure 5 is a plot of the downstream
-9-

displacement of the cylinder (X) relative to the displacement of an air particle behind the shock
wave (Vt), scaled by the jet exit diameter (D). The location of the cylinder was found by taking the
center of area of all pixels that were brighter than one half the maximum pixel brightness in each
image. Time is scaled in this plot by the length of time it takes a free stream particle to travel one
jet exit diameter (DIY). The data of figure 5 indicate that the cylinder initially travels at its greatest
(negative) velocity and that this velocity continuously decays with time. Note that this velocity is
relative to the free stream, so that a negative velocity simply means that the cylinder is traveling
downstream at a rate less than the surrounding gas. Thus, in the laboratory frame of reference, the
cylinder initially travels at its slowest velocity and is continually accelerating as time progresses.
Also note that, early on, the data fall nicely on a single trajectory with very little scatter. However,
halfway in the evolution process, the scatter increases dramatically. The point where the scatter
suddenly increases corresponds with the point where instability waves appear on the heavy gas
strip. The appearance of waves on the heavy gas strip would very likely increase the drag of the
distorted cylinder, and thus cause a sharp reduction in the relative velocity. It was mentioned
earlier that the time of appearance of the waves varied from run to run. This variation coupled with
the increased drag caused by the instability waves would account for the inconsistencies or scatter
in the trajectory of figure 5
Rudinger & Somers (1960) gave a simple analysis to describe the displacement of a shock
accelerated gas volumes, and found two asymptotic values of translational velocity. In the fIrSt,
they assumed that the inhomogeneity initially behaved like a solid cylinder accelerated by a passing
shock wave. In the second they assumed that, after a sufficient period of time, the motion was that
of a vortex pair with the hydrodynamic impulse and circulation of an infinite lamina accelerated
from rest. The first velocity (here computed relative to the surrounding gas) is given by
I-a Ui=-V, (1)
1M
and is asymptotically valid for small times. The second velocity is given by
-10-
2 Uf=-U' 2 h
1t (2)
and is asymptotically valid for large times. Here (J is the ratio of cylinder to surrounding gas
density, which for a SF6Iair system equals 5. Substituting this value into equations 1 and 2 gives
Ui = -0.67V and Uc= -0. 14V. Note that this analysis is appropriate for small flow Mach numbers
(V lao), and large Reynolds numbers.
Figure 6 is a plot similar to figure 5 showing the displacement of the cylinder center of area
along with the displacement of the vortex cores. Also drawn on this plot are two lines with slopes
equal to the velocities that are obtained using equations 1 and 2. The agreement between the initial
velocity (equation 1) and the data is reasonably good; although the theory slightly underpredicts the
data. When the final velocity (equation 2) is compared with the vortex pair displacement, it is
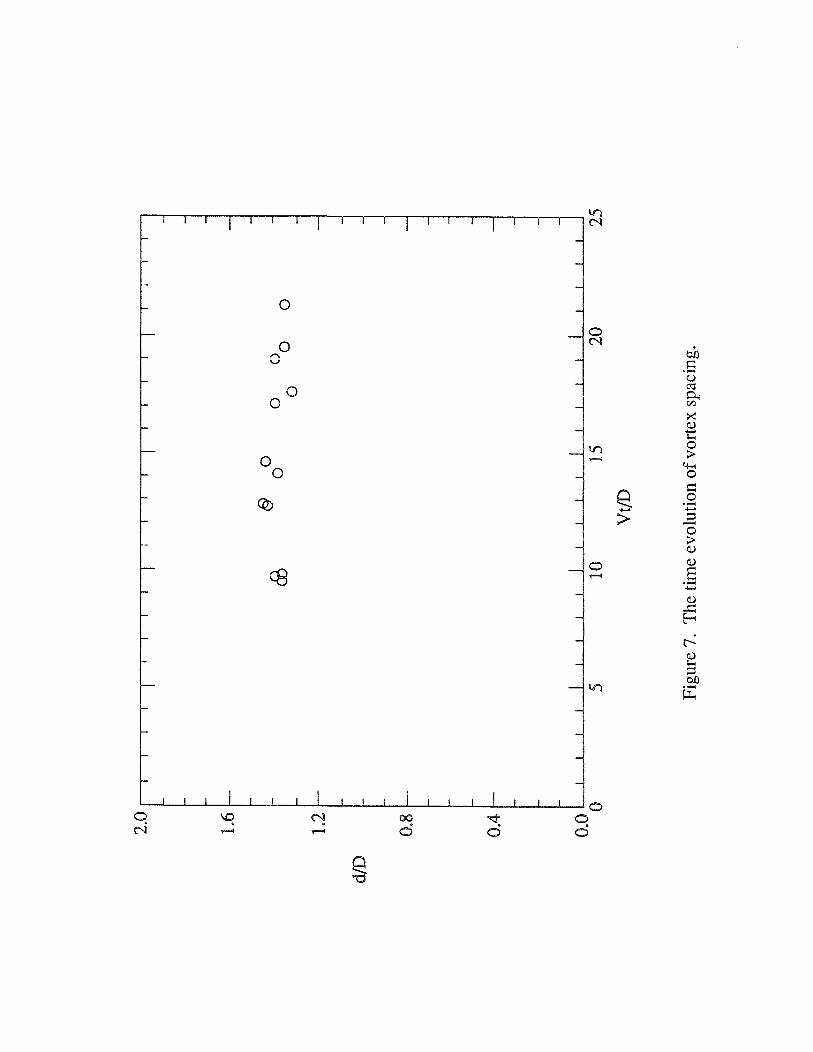
found that the theory significantly underpredicts the vortex pair velocity. Figure 7 is a plot of the
vortex spacing (d) shown scaled with jet exit diameter (D). The plot shows that the spacing
remains remarkably constant throughout the evolution process, and that the spacing ratio is
approximately equal to 1.4. This ratio is significantly greater than that given by the theory of
Rudinger & Somers (1960) (dID = 1t/4).
The velocities from the theory of Rudinger & Somers (1960) were calculated assuming the
jet core contained pure SF& the experiments, the heavy gas is steadily diffusing out of the jet as
it crosses the test section. Thus, the actual jet density is slightly lower than that of pure SF6.
However, a lower density ratio in equations 1 and 2 would give smaller values for both the initial
and [mal velocities. Thus, this effect cannot explain the discrepancy between equation 2 and the
measured vortex displacements. The discrepancies between experiment and theory are more likely
caused by the limited ability of the simple model used by Rudinger & Somers to describe the flow
that is observed in figure 3. For instance, the model assumes that after sufficient time, the flow is
described by a vortex pair with strength given by the initial. flow field. However, the final. flow
-11-

field is computed assuming unifonn density. The presence of a gas strip that is five times the
density of air, wrapped around this vortex pair, certainly has some effect on the flow field. This
effect, however, is not accounted for in the model.
Haas & Sturtevant (1987) measured the downstream velocities of several notable points on
the interface separating the two gases. These included the upstream and downstream edges of the
part of the deforming cylinder that intersects the symmetry plane, and the downstream edge of the
vortex. The downstream displacements of these particular points were measured in the present
experiments and are shown plotted in figure 8. Also shown in figure 8 are the downstream
displacements of the center of area, and of the vortex cores. The initial and final velocities of these
points were measured by fitting appropriate portions of the data using linear regression. These
curve fits are shown on figure 8 plotted as solid lines. The measured velocities obtained from
these fits (which are relative to the velocity of a fluid particle at infinity, V) are listed in table 1. In
addition to velocities measured in the present experiments, table 1 contains values obtained under
similar conditions by Haas & Sturtevant (1987) and by Picone & Boris (1988), as well as results
from the theory of Rudinger & Somers (1960). Note that the results of Haas & Sturtevant and
Picone & Boris were obtained using a gas having a smaller density ratio (a) than the one used
here. Thus, the present measurements are noticeably larger (i.e. more negative). Considering this
difference, the agreement between the present experiments and the earlier work is reasonable. Also
note that the velocity of the vortex downstream edge reported by previous authors differs
considerably from the present measurements. These unusual values were caused by wall effects
which influenced the previous work and are absent here.
32 Mixing
In Part 1 of this series, the decrease in cross-sectional area of the deforming helium
cylinder was used as a gauge of the rate of mixing. In the current experiments, these cross
sectional areas were similarly measured. Figure 9 is a plot of these areas, scaled with the initial jet
area. This data was computed by finding the area of the portion of the deformed cylinder that is
-12-
brighter than one half the brightest point in that particular image. The data of figure 9 show a
gradual decline in the cross-sectional area during time spanned by these experiments. It is apparent
that this decrease occurs not nearly as rapidly as was measured in the light gas experiments of Part
1. The decrease of cross-sectional area was thought to be a reasonable diagnostic in Part 1.
primarily because it was found that the the maximum concentration did not significantly change in
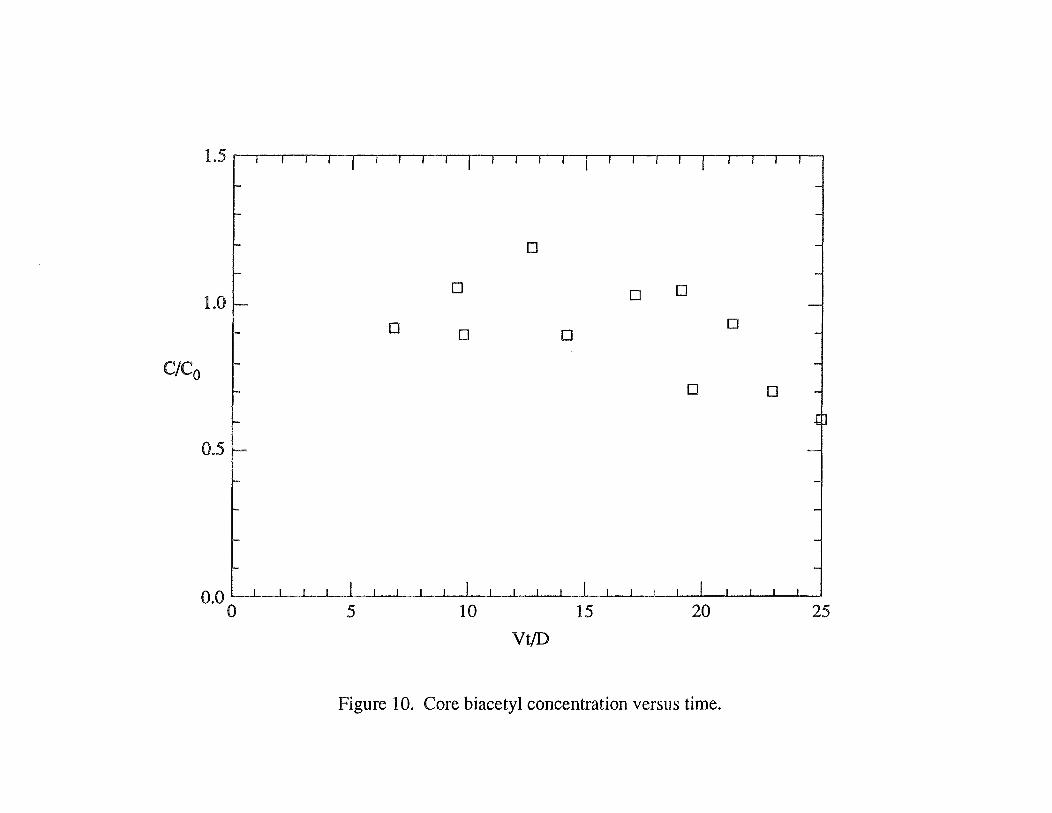
the process. Figure 10 is a plot of the maximum biacetyl concentration for the current experiments.
This data is noisy and sparse. however it clearly shows a decrease in the maximum concentration
with time. Since the maximum concentration is not constant in the current experiments. the
decrease of cross-sectional area is not a good diagnostic for mixing. Since the concentration
decreases with time, a combination of cross-sectional area and concentration must be used.
Figure 10 shows that the decrease in concentration occurs slowly at first, increasing toward
the end of a run. This fact in combination with the data of figure 9 implies that the heavy gas
cylinder mixes more slowly at first. then increases later on. In viewing the PLIF images. it was
observed that the heavy gas separates from the vorticity. early in the evolution process. Vorticity
is the source of the high strain rates that promote mixing in this flow. Furthermore, the magnitude
of this strain rate diminishes with distance from the source. Thus. the farther a region is from the
vorticity. the more slowly it is mixed. One would then expect the mixing of a heavy gas cylinder
to (at least initially) proceed at a slower rate than for a lighter gas one. Figure 10 shows that the
concentration decreases markedly toward the end of the plot. This corresponds to the stage where
the heavy gas has collected at the rear of the vortex pair. At this point the mixing proceeds at a
much faster rate. However, it is difficult to say whether this rate is greater than that of the light gas
case.
4. Conclusions
Experiments were carried out in which a cylindrical volume of a heavy gas was impulsively
accelerated by weak shock waves. A laminar jet of SF6 was used to produce the heavy gas
cylinders. Planar laser induced fluorescence and shadowgraph were used to visualize the flow. It
-13-

was found that, unlike the light gas case, vorticity separates from the heavy gas early in the
evolution process. A simple model which explains these differences was presented. The model
shows that centripetal acceleration is the cause of these differences. Centrifugal forces cause light
gasses to be attracted to the vorticity, while at the same time these forces cause heavy gasses to be
repelled. This process is enhanced by the different rates of the diffusion of vorticity in the two
gases, caused by large differences in kinematic viscosity. It was also found that the latter stages of
the evolution process were dominated by the growth of an apparent instability. This instability fIrst
emerges as waves on the heavy gas strip that gets wrapped around the vortex pair. These waves
soon grow to a point where they dominate the flow. It is believed that this instability is a result of
a combination of Rayleigh-Taylor and Kelvin-Helmholtz instabilities.
The downstream displacement of the evolving heavy gas cylinder was measured and
compared with the theory of Rudinger & Somers (1960). The agreement between experiment and
theory was found to be good, initially. However, the theory significantly underpredicts the fInal
vortex pair velocity. The spacing of the vortex cores in these experiments was also measured. It
was found that this spacing remains remarkably constant, and is signfficantly larger than that
indicated by theory. The cause for this differences may be the effect of viscosity (or Reynolds
number). However, the simple model used in the theory cannot account for the effects of
nonuniform density on the flow. Finally, the downstream velocities of several notable points on
the SF6Iair interface were measured and compared to the experimental values of Haas & Sturtevant
(1987), as well as to the computational values of Picone & Boris (1988). The present
measurements agree reasonably well with the others, considering that the previous results were
obtained using a gas-with a slightly lower density.
Cross-sectional areas of the SF6 cylinders were computed as it was done in Part 1. It was
found that these areas decrease at a rate significantly less than that of the helium cylinders.
However, it was also found that the maximum biacetyl concentration decreases at the same time.
Thus, the decrease of cross-sectional area is not a valid diagnostic for mixing in this case. It
appears that mixing occurs initially more slowly for the heavy gas cylinder. This is a logical
-14-

outcome since it was found that most of the vorticity separates from the heavy gas, thus decreasing
its ability to mix. It also appears that the mixing rate increases late in the run, probably as a result
of the growth of instability waves. However, it is not clear whether this fmal rate is greater than
that of the helium cylinders.
Acknowledgments
The author wishes to thank Professors EE. Marble, E.E. Zukoski and B. Sturtevant for
their help and support with this research. Credit is due to Dr. R. Miake-Lye for his help with laser
induced fluorescence system. Professor C.H.K. Williamson also deserves credit for his helpful
comments and suggestions during the preparation of this paper. This work was supported by the
Air Force Office of Scientific Research contract F49620-C-OI13.
-15-

References
Epstein, A.H. 1977 Quantitative density visualization on a transonic compressor rotor. J. Engineering for Power, Trans. ASME 99, 460-475.
Haas, J.-F. & Sturtevant, B. 1987 Interaction of weak shock waves with cylindrical and spherical gas inhomogeneities. J. Fluid Mech. 181,41-76.
Jacobs, J.W. 1990 Shock accelerated cylindrical gas inhomogeneities Part 1. Shock induced mixing of a light gas cylinder. submitted to J. Fluid Mech.
Meshkov, Y.Y. 1969 Instability of the interface of two gases accelerated by a shock wave. Izv. Akad. Nauk. SSSR Mekh. Zhidk. Gaza. 4, 151-157.
Picone, J.M. & Boris, J.P. 1988 Vorticity generation by shock propagation through bubbles in a gas. J. Fluid Mech. 189,23-51.
Richtmyer, R.D. 1960 Taylor instability in shock acceleration of compressible fluids. Commun. Pure Appl Maths 23,297-319.
Rudinger, G. & Somers, L.M. 1960 Behavior of small regions of different gases carried in accelerated gas flows. J. Fluid Mech. 7, 161-176.

Table A . f d d d I' d I' I' d I' . dX/dt - V comapanson 0 some measure an compute norma Ize re ahve cy m er ve oClhes, V
Present (0'=5.0)
Ms=1.095
Upstream edge Initial -0.54
Final -0.31
Downstream edge Initial -0.65
Final -0.37
Vortex downstream edge -0.13
Center of area Initial -0.58
Vortex center -0.26 -'" These values are caused by wall effects
Upstream edge
~
Haas & Sturtevant (0'=3.6) Picone & Boris (0'=3.6)
Ms=1.085 Ms=1.22 Ms=1.22
-0.10 -0.37 -0.41
-0.25 -0.22 -0.21
-0.25 -0.32 -0.43
-0.25 -0.32 --
0.15* 0.13* 0.13*
-- -- --
-- -- -0.15
~ Vortex downstream edge ~ ,~
... Downstream edge
Vortex center
Rudinger & Somers
(0'=5.0)
--
--
--
--
--
-0.67
-0.14

I SFsl
shock
laser sheet ~
~ )wI_IE 0 v -----...
Jet x == Lx fO
Ms== Vs fa ~
Figure 1. Drawing of the jet/PLIF configuration.

(a)
(b)
(c)
(d)
Figure 2. A sequence of spark shadowgraph images giving a side view of the evolving SF6 cylinder. a) The initial jet, b) t = 0.112 ms after the passage of the shock wave, c) t = 0.510 ms, d) t = 927 ffiS. The Ms = 1.095 shock wave has passed from left to right and is shown in the second photograph after having passed over the heavy gas jet.

Figure 3. A sequence of PLIF images giving a cross-sectional view of the evolving SF6 cylinder. a) The initial jet, b) t = 0.217 ms after the passage of the shock, c) t = 0.374 ms, d) t = 0.588 ms, e) t = 0.803 ms, f) t = 0.998 ms, g) t = 1.201 ms, h) t = 1.403 ms, i) t = 1.803 ms. The Ms = 1.095 shock wave has passed from left to right. The images are from 8 separate runs and were taken at a cross section 3.81 cm from the jet exit.
(Attached)

Heavy
(a) (b)
Light
(c) (d)
Figure 4. A simple model roughly approximating one side of a shock accelerated light or heavy gas cylinder. a) The heavy gas configuration and b) the resulting motion. c) The light gas configuration and d) the resulting motion.

G -2
§ -3 > I r ~ 0 ~ "'-' L.. - ........
0 r ""- lJ
-4
0 0
0 ~ ....
-------5
-6~1 -L~~~~~~~~-L~~~~~~~~~-L~~ __ ~~~~~
o 5 10 15 20 25 Vt/D
Figure 5. The displacement of the center of cross-sectional area of the SF6 cylinder relative to the free stream.

o center of area
J1 vortex pair
-2
-l \ ad) ~
a § ~ i A a ~ -4
0 C$- o ~
/ j. a A a c9 -51- \ ~
Theory of Rudinger & A
-6 l- Somers (1960) J1
_7~!-L~~~~~-L-L~~~~~~-L-L~~L-~~~-L~~~L-~~
o 5 10 15 20 25 VtlD
Figure 6. The displacement of the center of cross-sectional area and of the vortex cores relative to the free stream. The solid lines represent velocities obtained using equations 1 and 2.
0
0 0 C"l
0
0 0
V)
0 .........
0
<0
0 .........
L-~-L~--L-~~~ __ L-~-L~ __ L-~~-L~ __ L-~-L~O
00 o o o
~ $:I .-u ro 0.. tZl
K v t:: 0 ;>
4-< 0
g $:I 0 .-.....
> ;:::l ....... 0 ;> V V
8 .-..... v
~ t-V l-< ;:::l ~ .-~

0.5 t\
0 Upstream edge
-0.5 r:-\\ I:::. Downstream edge
0 Vortex downstream edge
-1.5 t- ~ ~()- I • Center of area
A Vortex pair
-2.5 I ~, 0
Q ~
~ r ,,~ A"", 0
~ -3.5 r- i""'t""1\... ""'-. A.'-' 0 0
0
-4.5 I-A "'" A 0 <e:>
-5.5
4. -6.5 1-' -.I---I...--I...-I..---L.---L.---L.--L--L--L-l.-l.--!.--!.----L----L---I---I'--l..--J....--..L..-...l--...l--...!--...I
o 5 10 15 20 25 Vt/D
Figure 8. The displacement of various points on the surface of the evolving SF6 cylinder.

1.2 r-r-r-r-r-(T--r-'-~IT-r-r-II--r-r-""--'.---r-...----r--.----.-
1.0 r- 0 0
0 0 00 0
0
0.8 t- O <0 0 0
0 0 0 0 0 0 0
~ NAo 0.6
0
0.4
0.2
o.o'~~~~·~~~~~~~~~~~~~~~--~~~~~~
o 5 10 15 20 25
Vt/D
Figure 9. The time evolution of cross-sectional area.
CICo
1.5
1.0
0.5
o
o
o
o
o o
o o
o 0
o.o~! ~~~~~~~~~~~~~~~~~~~~~~~~~~
o 5 10 15 20 25
vt/D
Figure 10. Core biacetyl concentration versus time.