static field inhomogeneities in magnetic resonance
TRANSCRIPT

Static Field Inhomogeneities inMagnetic Resonance Encephalography:
Effects and Mitigation
Dissertationzur Erlangung des Doktorgrades
der Fakultät für Mathematik und Physikder Albert-Ludwigs-Universität
Freiburg im Breisgau
vorgelegt von
Jakob Assländergeboren am 18. März 1985 in Würzburg
Juli 2014

Dekan: Prof. Dr. M. RužickaLeiter der Arbeit: Prof. Dr. J. HennigReferent: Prof. Dr. J. HennigKoreferent: Prof. Dr. G. Reiter
Tag der mündlichen Prüfung: 19. September 2014

There is nothing that nuclear spins will not do for you,as long as you treat them as human beings.
Erwin Louis Hahn


C O N T E N T S
1 introduction 1
2 physical background of magnetic resonance 32.1 Quantum Mechanical Description of Spins 3
2.1.1 Description of Spin-½ Particles 42.1.2 Free Precession and the Rotating Frame of Reference 5
2.2 Quantum Statistical Description of Spin-½ Ensembles 62.2.1 The Density Matrix at Thermal Equilibrium 62.2.2 The Density Matrix in the Rotating Frame 72.2.3 Radio Frequency Pulses: Quantum Statistical Description 8
2.3 Macroscopic Magnetization and the Bloch Equation 102.3.1 The Laboratory Frame of Reference 102.3.2 The Rotating Frame of Reference 112.3.3 Radio Frequency Pulses: Classical Description 12
2.4 Relaxation 122.4.1 T1-Relaxation 132.4.2 T2-Relaxation 142.4.3 Field Inhomogeneities and T∗2 -Decay 142.4.4 The Bloch Equation including Relaxation 15
3 mr signal and basic mr experiments 173.1 MR Signal 173.2 Signal Demodulation 183.3 Free Induction Decay 193.4 Hahn Echoes 19
3.4.1 Hahn Echoes with a π-Refocusing Pulse 203.4.2 Hahn Echoes with Arbitrary Flip Angles: The Regime of
Strong Dephasing 22
4 magnetic resonance imaging 254.1 Gradient Encoding 25
4.1.1 Slice Selective Excitation 264.1.2 Fourier Encoding 264.1.3 Navigating Through k-Space: Hardware Limitations 294.1.4 Cartesian k-Space Sampling and Basic Pulse Sequences 304.1.5 Non-Cartesian k-Space Trajectories 33
4.2 Iterative Image Reconstruction 344.2.1 The Forward Problem 364.2.2 The Inverse Problem 38
4.3 Signal to Noise Ratio 404.4 Functional MRI 40
4.4.1 Physical and Physiological Background 404.4.2 General Linear Model 424.4.3 Physiological "Noise" 43
i

Contents
5 state of the art and own contributions 455.1 Related Work 45
5.1.1 Accelerated fMRI 455.1.2 RF-Pulse Design for Spin Echo fMRI 46
5.2 Summary of Own Contributions 46
6 off-resonance effects in fmri 496.1 Classification of Frequency Variations 49
6.1.1 Constant Term - Off-Resonance Correction 506.1.2 Linear Terms - Local k-Space 516.1.3 Higher Orders - T′2-Decay 51
6.2 Origin of Frequency Variations 52
7 spherical stack of spirals trajectories 537.1 Methods 53
7.1.1 Experimental Setup 537.1.2 Coil Sensitivities and Off-Resonance Maps 537.1.3 Trajectory Design 557.1.4 Image Reconstruction 587.1.5 Simulated Point Spread Functions 597.1.6 BOLD Experiments 607.1.7 Spin Echo Experiments 61
7.2 Results 617.2.1 Constant Term - Off-Resonance Correction 617.2.2 Linear Terms - Local k-Space 637.2.3 Higher Orders - T∗2 -Decay and BOLD-Sensitivity 687.2.4 BOLD Experiments 697.2.5 Spin Echo MREG 75
7.3 Discussion 78
8 delayed-focus pulses 838.1 Theory 84
8.1.1 Hahn’s Pulse Sequence in the Regime of Weak Dephasing 848.1.2 The Maximal Echo Time as a Function of the Flip Angle 86
8.2 Methods 888.2.1 RF-Pulse Design 888.2.2 Experiments 90
8.3 Results 918.3.1 RF-Pulses 918.3.2 Experiments 97
8.4 Discussion 99
9 summary and outlook 1039.1 Summary 1039.2 Outlook 104
ii

Contents
a appendix 107a.1 Table of Symbols 107a.2 Abbreviations 111
Publications 113
Bibliography 115
Acknowledgements 125
iii


1I N T R O D U C T I O N
Since the first magnetic resonance images were acquired by the Nobel Prize laureateLauterbur (1973), the field of magnetic resonance imaging (MRI) developed rapidly.The possibility of manipulating the contrast between different kinds of tissue makesMRI a flexible technique and is indispensable in today’s radiology.
The basis of MRI is formed by Lauterbur’s ingenious idea of gradient encoding.However, this sequential approach is inherently slow. Costs and patient comfortdemand fast imaging techniques. Also, more fundamental limits like the durationof a breath-hold promote this field of research, as well as the goal of tracking signalchanges dynamically. Therefore, speed has always been a research topic in MRI.In the 1980s, the foundation of clinically feasible imaging methods was laid byfast techniques like RARE1 (Hennig et al., 1986) and FLASH (Haase et al., 1986).MRI was further accelerated by parallel imaging (Sodickson and Manning, 1997;Pruessmann et al., 1999; Griswold et al., 2002), allowing the development of timedemanding clinical protocols. The latest "hot topic" of accelerated MRI is non-linearimage reconstruction, which took off after the publication of Lustig et al. (2007). Itpromises further speedup, but has not made its way into clinical routine yet.
Beyond anatomical imaging, the sensitivity of the MR signal to the functionalityof different organs has attracted the interest of researchers over the last decades.Most prominent is the blood oxygenation level dependent (BOLD) contrast (Ogawaet al., 1990). As demonstrated by Logothetis et al. (2001), brain activity leads to achange in the concentration of deoxyhemoglobin, which has a different magneticsusceptibility compared to the surrounding tissue. This influences the MR signaland allows to track brain functionality. Over the years, so called functional MRI(fMRI) has become one of the most important imaging modalities in brain research.Even though it is still a considerably young technique, clinicians have started to usefMRI, e.g. for presurgical planning in order to identify important brain regions.
The BOLD signal is inherently slow and is mostly mapped with the echo planarimaging (EPI) technique (Mansfield, 1977), which has a temporal resolution of 2-3 sfor whole brain coverage. However, it has recently been shown that an increasedtemporal resolution provides additional information. Hennig et al. (2007) andPosse et al. (2012) demonstrated that high temporal resolution fMRI data containsrespiratory and cardiac signal changes unaliased with the BOLD signal in thefrequency domain. Therefore, the data can be separated in order to improve theBOLD sensitivity. The phrase "magnetic resonance encephalography" (MREG) wasestablished for the fast fMRI methods developed in the Medical Physics researchgroup in Freiburg. MREG combines the previously mentioned accelerating tech-niques. Jacobs et al. (2014) and Proulx et al. (2014) found an improved statisticalpower in event related activations using MREG compared to EPI. Furthermore, Leeet al. (2013) showed that functional connectivity data contains information at hightemporal frequencies, which are not accessible with standard EPI.
1 A description of all abbreviations and mathematical symbols can be found in the appendix.
1

introduction
The structure and subject of this dissertation is outlined by the fundamentalequation of spin motion
ddt
~M(~r, t) = ~ω(~r, t)× ~M(~r, t)
(Bloch, 1946). It describes the macroscopic magnetization ~M as a function of thetime t. The magnetization usually depends also an the position in space~r. Since theso-called Bloch equation forms the physical basis of this dissertation, it is derivedfrom quantum mechanics in Chapter 2, followed by further MR basics in Chapter 3and 4. Even though the equation of spin motion looks simple, it still holds secretsthat are by and by revealed, even after seventy years of its first formulation. Thekey aspect is its non-linearity with respect to the frequency vector ~ω, which iscomposed of the Larmor frequency and fast oscillating magnetic fields, so calledradio frequency (RF) pulses. The individual components of the frequency vectorcan be accessed in different ways during MRI experiments.
The Larmor frequency is given by the main magnetic field and can be manipulatedby gradient fields for spatial encoding. However, the Larmor frequency is alsoaffected by the susceptibility of the surrounding tissue. Such caused frequencyvariations lead to a dephasing of the magnetization, causing artifacts and signalattenuation in MR images. This dissertation addresses susceptibility artifacts witha focus on MREG.
Employing a Taylor expansion, the spatial dependency of the Larmor frequencyis separated into different terms (Chapter 6). Chapter 7 addresses the linear com-ponent by optimizing the k-space trajectory, which reflects the temporal sequenceof the imaging gradients. Higher-order components of the frequency variationsare only accessible by so called shim coils, which provide only a very limitedcompensation for field variations.
As shown by Hahn (1950), the other components of ~ω, i.e. the RF-pulses, can beused to manipulate the phase of the magnetization such that the spin isochromatsrefocus at some predefined point in time. These so called spin echoes can beused to mitigate susceptibility artifacts. However, large flip angles are essentialin Hahn’s pulse sequence. In combination with slow relaxation, this makes longrepetition times necessary. Therefore, Hahn’s pulse sequence is incompatible withthe fast fMRI applications envisioned with MREG. Chapter 8 addresses the question,whether spin echo imaging is possible at low flip angles and long echo times beyondHahn’s theory.
2

2P H Y S I C A L B A C K G R O U N D O F M A G N E T I C R E S O N A N C E
In the Encyclopedia Britannica one reads that resonance is a "relatively large se-lective response of an object or a system that vibrates in step or phase, with anexternally applied oscillatory force". In terms of magnetic resonance this corre-sponds to spins (object/system) being manipulated by an oscillating magnetic field(oscillatory force), which is tuned to the oscillation frequency of the spins, theso-called Larmor frequency. The oscillation of spins, which create a macroscopicmagnetic moment, is measured with receive coils that are also tuned to the Larmorfrequency. The first MR experiment with nuclei was performed by Rabi et al.(1938) with a beam of atoms. Bloch (1946) and Purcell et al. (1946) independentlyperformed nuclear magnetic resonance (NMR) experiments with fluids and solids,respectively. Their work are major milestones towards MR experiments performednowadays and was honored with the Nobel Prize in 1952.
In this chapter a short introduction to spin physics is provided. The phenomenaof spins can only be understood within the theory of quantum mechanics. Therefore,Section 2.1 gives a quantum mechanical description of the physics of spins in thepresence of magnetic fields. Section 2.2 contains a quantum statistical descriptionof spins in the presence of static magnetic fields. Furthermore, the spin excitationwith RF-pulses is discussed in Section 2.2.3. It is shown that a population inversionof a two state system can be achieved with MR. Section 2.3 bridges the gap betweenquantum mechanics and the classical Bloch equation, which is mostly used todescribe the dynamics of an ensemble of spins in MRI. With the tools of quantumstatistical mechanics, the classical law of spin precession is correctly derived forlarge ensembles of non-interacting spins. However, the effect of relaxation cannotbe explained withing this framework. Interactions of spins with their magneticenvironment explain relaxation effects, leading to the complete Bloch equation, asshown in Section 2.4.
This chapter follows loosely the argumentation of Levitt (2001) and Abragam(1961) in some parts. Please refer to these books for a more detailed description.
2.1 quantum mechanical description of spins
Otto Stern and Walther Gerlach (1922) discovered that silver atoms split up intotwo discrete lines when traveling through an inhomogeneous magnetic field. Thebasic quantum mechanical properties of angular momenta state that particles withthe total angular momentum j split up in 2j + 1 lines (Pauli, 1927; Dirac, 1928a,b).Therefore, the angular momentum of silver atoms must be ½ . Quantum mechanicsfurther postulates the orbital angular momentum to be integral in general and tobe zero in the particular case of silver atoms. In order to resolve this dilemma,Uhlenbeck and Goudsmit (1926) postulated an intrinsic angular momentum ofparticles called spin.
3

physical background of magnetic resonance
Following the Dirac notation, one can define the vectorial spin operator ~S =(Sx, Sy, Sz
)T. Throughout this dissertation, bold symbols denote operators, x, y andz denote the dimensions in space and AT the transpose operation of A. The spinoperator maps Hs → Hs within the spin Hilbert space, which is independent ofthe spatial Hilbert space. Therefore, the spin operator commutes with the position,momentum and orbital angular momentum operator. As an angular momentum,the spin fulfills the algebra relation
[Sj, Sk
]= ih ∑
lεjklSl , (2.1)
where [·, ·] denotes the commutator, h the reduced Planck constant and εjkl the Levi-Civita symbol with the indices j, k, l ∈ 1, 2, 3 representing the spatial dimensionsx, y, z. Given the spin state |ψ〉 ∈ Hs in bra-ket notation, the spin operatorfurthermore fulfills the eigenvalue equations
~S2|ψ〉 = h2s(s + 1)|ψ〉 (2.2)
Sz|ψ〉 = hms|ψ〉 . (2.3)
The spin eigenvalue is s = n/2, with n ∈ N0 and the magnetic quantum numberis given by ms ∈−s,−s + 1, . . . , s− 1, s, which is a set of 2s + 1 different values.Given the field of complex numbers C, the spin Hilbert space Hs is C2s+1 associatedwith the complex scalar product < u|v >= u∗1v1 + u∗2v2 + . . . + u∗nvn, where a∗
denotes the complex conjugate of a.Given the angular momentum algebra (2.1), one can derive
[~S2, Sk
]= 0, (2.4)
with k ∈ x, y, z. Therefore, the absolute value of the spin quantum number sand the magnetic moment quantum number ms in one direction can be measuredsimultaneously. On the contrary, the magnetic moment in two different directionscannot be determined at the same time. This follows directly from two componentsof the vectorial spin operator not commuting in Equation (2.1).
2.1.1 Description of Spin-½ Particles
In clinical MRI the nucleus of hydrogen 1H, which is a single proton, is the mostrelevant particle. Therefore, this thesis will discuss only the spin physics of protons,which have spin-½ , i.e. ms takes the values ±1/2. The Pauli matrices and theidentity matrix span together the vector space of 2×2 Hermitian matrices. Scaledwith h/2 they obey the angular momentum algebra (2.1) and are therefore used todescribe the spin-½ operators:
Sx =h2
(0 11 0
), Sy =
h2
(0 −ii 0
), Sz =
h2
(1 00 −1
). (2.5)
The magnetic quantum states of spin-½ particles are often denoted in the Zeemanbasis - which is an orthonormal basis of Hs - as spin up
|↑〉 =(
10
)and spin down |↓〉 =
(01
), (2.6)
4

2.1 quantum mechanical description of spins
respectively. Furthermore, protons have an electric charge which relates the spin tothe magnetic moment
~µ = γ~S, (2.7)
justifying the phrase "magnetic quantum number" for ms. The gyromagnetic ratioof the proton is approximately γ ≈ 2.675222 · 108 rad/(Ts). Since the spins possessa magnetic moment, they interact with the present magnetic field1 ~B = (Bx, By, Bz)T.Thus we can define the Hamilton operator
H = −~µ · ~B. (2.8)
Inserting this Hamilton operator into the time independent Schrödinger Equation
H|ψ〉 = E|ψ〉, (2.9)
one can see that in the absence of a magnetic field the energy levels are degenerate.In the presence of a magnetic field the energy levels of |↑〉 and |↓〉 split up, creatingan energy gap of
∆E = hγ∣∣∣~B∣∣∣ . (2.10)
This effect - first discovered by Zeeman (1897) - is the fundament of any MRexperiment. The gap energy can be rewritten in units of frequency
~ω = −γ~B, (2.10’)
where ~ω is the so-called Larmor frequency. The negative sign of the Larmor fre-quency converts the Larmor precession into the right-handed trihedron. Assumingthat the static magnetic field B0 is aligned along the z-axis, the Larmor frequency is
ωz = −γB0. (2.10’’)
2.1.2 Free Precession and the Rotating Frame of Reference
Free Precession
The temporal evolution of a quantum mechanical state is described by the time-dependent Schrödinger Equation:
ih∂
∂t|ψ(t)〉 = H|ψ(t)〉. (2.11)
The time is denoted by t. If there is only a static magnetic field ~B0 = (0, 0, B0)T
present, the Hamilton operator (2.8) is given by H = ωzSz. The solution of thedifferential Equation (2.11) is given by
|ψ(t)〉 = exp(− iωztSz
h
)|ψ(0)〉 . (2.12)
1 The phrase magnetic field has been used in literature for B (defined by the Lorentz force) as well asfor H = B/(µ0µr) with the permeability µ0µr. Following the establish nomenclature in NMR, thephrase magnetic field is used for B throughout this thesis.
5

physical background of magnetic resonance
Since the spin is an angular momentum, Sz is the generator of a rotation of the spinstate around the z-axis:
Rz(ωzt) = exp(− iωztSz
h
). (2.13)
Please note that the spin operator generates a rotation in the spin Hilbert space onlyand does not affect the wave function in position space. Using the Taylor expansionof the exponential function,
Rz(ωzt) = cos(
ωzt2
)1− 2i
hsin(
ωzt2
)Sz (2.13’)
is derived. The identity matrix is thereby denoted by 1. Surprisingly Rz(2π) = −1
is not an identical transformation and the rotation symmetry of spins is 4π, i.e.Rz(4π) = 1. This illustrates that the spin phenomena is incompatible with classicalphysics.
In conclusion, spins precess about the axis of a static magnetic field:
|ψ(t)〉 = Rz(ωzt)|ψ(0)〉 . (2.14)
The Rotating Frame of Reference
For many descriptions it is convenient to leave the laboratory frame of referenceand switch to a frame that rotates about the z-axis with the frequency Ω. The statevector |ψ〉 in the rotating frame is defined by
|ψ〉 ≡ Rz(−Ωt)|ψ〉, (2.15)
where |ψ〉 is the state in the laboratory frame. Throughout this thesis, a tildeindicates variables denoted in the rotating frame. Differentiating this definitionwith respect to time and employing the time-dependent Schrödinger Equation (2.11),one can define the Hamilton operator in the rotating frame:
ih∂
∂t|ψ(t)〉 =(Rz(−Ωt)HRz(Ωt)−ΩSz)|ψ(t)〉 ≡ H|ψ(t)〉. (2.16)
A more detailed derivation of this formula can be found in (Levitt, 2001, Chapter10.6).
2.2 quantum statistical description of spin-½ ensembles
2.2.1 The Density Matrix at Thermal Equilibrium
At thermal equilibrium, the quotient of the probabilities p|↑〉,|↓〉 of finding a spin inthe particular state can be described by the Boltzmann distribution
p|↑〉p|↓〉
= exp(− hγB0
kBT
). (2.17)
The Boltzmann constant is here denoted by kB and the absolute temperature by T.The difference between the two states at 3 T and room temperature is of the order
6

2.2 quantum statistical description of spin-½ ensembles
of 10−5. Considering 1 mm3 of water, which corresponds to a standard voxel2 sizein MRI, the number of spins contributing to the signal is of the order of 1020.
Neglecting spin interactions, the dynamics of such a spin ensemble can bedescribed using the tools of quantum statistical mechanics. Given a spin at the timepoint t, which is found in state |ψk(t)〉 with the probability pk(t), one can define thedensity matrix
ρ(t) ≡∑k
pk(t)|ψk(t)〉〈ψk(t)| . (2.18)
The summation is thereby done over all possible quantum states. The expectedvalue of any observable A is given by
〈A〉 = ∑k
pk〈ψk(t)|A|ψk(t)〉 = ∑k〈ψk(t)|ρA|ψk(t)〉 = Trρ ·A , (2.19)
where TrA denotes the trace of A. Describing the quantum states in theZeeman basis (2.6), the density matrix at thermal equilibrium is
ρeq =
(p|↑〉 00 p|↓〉
). (2.20)
The diagonal elements of the density matrix describe the population probabilityof the particular state. Therefore, Trρ = 1 is given for any density matrix. Theoff-diagonal elements are the so-called coherence elements. It will be outlined inSection 2.4.2 that there is no coherence at thermal equilibrium.
The exponential argument in Equation (2.17), called the Boltzmann factor B =
hγB0/(kBT) is at 3 T and room temperature of the order of 10−5. Therefore, theexponential function in (2.17) can be approximated by a first-order Taylor expansion,yielding the density matrix at thermal equilibrium
ρeq ≈(
1/2 + 1/4B 00 1/2− 1/4B
). (2.20’)
For fixed conditions, the approximation error can be absorbed by B and for read-ability Equation (2.20’) is assumed to be exact in the following. Employing thedefinition of the spin operators (2.5), the density matrix at thermal equilibrium canalso be written as
ρeq =12
1 +B
2hSz. (2.21)
2.2.2 The Density Matrix in the Rotating Frame
The density matrix in the rotating frame is given by
ρ = Rz(−Ωt) ρRz(Ωt) . (2.22)
With the definition of the rotation matrix (2.13) and the density matrix (2.21), onecan transform the density matrix at thermal equilibrium to
ρeq = exp(
iΩtSz
h
)(12
1 +B
2hSz
)exp
(− iΩtSz
h
). (2.23)
Thus, Rz and ρeq commute and it follows
ρeq = ρeq. (2.23’)
2 voxel , "volume pixel"
7

physical background of magnetic resonance
2.2.3 Radio Frequency Pulses: Quantum Statistical Description
Besides the static magnetic field, fast varying magnetic fields are used in MR. Theyusually oscillate with the Larmor frequency and are applied only for a finite amountof time. Therefore, they are often referred to as radio frequency (RF) pulses.
Consider a varying magnetic field of the form
~B1(t) = |B1(t)|(cos(ωRFt + ϕRF(t)), sin(ωRFt + ϕRF(t)), 0)T , (2.24)
where the amplitude |B1(t)| and the phase ϕRF(t) vary slowly compared to thefrequency of the RF-pulse ωRF. Using complex notation, the magnetic field in arotating frame with Ω = ωRF can be expressed by
B1(t) = B1,x + iB1,y = |B1(t)| exp(iϕRF(t)). (2.25)
This corresponds to the rotation ωx,y = −γB1 in units of frequency.Assuming B1(t) to be real valued, the magnetization precesses about the x-axis.
Adopting Equation (2.14), the spin state is given by
|ψ(t)〉 = Rx(ωxt)|ψ(0)〉 . (2.26)
An RF-pulse of constant amplitude over the duration TP flips the magnetizationby the angle
αx =∫ TP
0ωx(t)dt. (2.27)
This corresponds to the rotation∣∣ f⟩= Rx(αx)
∣∣i⟩
(2.28)
of the initial state∣∣i⟩
about the x-axis to the final state∣∣ f⟩. Please note that this
description is only valid if the pulse is fast enough so that all dynamics besides theexcitation become negligible in the rotating frame of reference. The final densitymatrix is given by
ρ f = ∑k
pk∣∣ fk⟩⟨
fk∣∣ = ∑
kpkRx(αx)
∣∣ik⟩⟨
ik∣∣Rx(−αx) = Rx(αx) ρiRx(−αx) . (2.29)
Thereby the unitary property of the rotation matrix was exploited.
π/2-Pulse
In this section the density matrix after an excitation with a π/2-pulse from thermalequilibrium is calculated as an example. After a pulse that creates a rotation ofαx = π/2 about the x-axis (in the rotating frame), the density matrix is transformedfrom thermal equilibrium (2.21) to
ρ f = Rx
(π
2
)ρeqRx
(−π
2
)
=12
Rx
(π
2
)1Rx
(−π
2
)+
B
2hRx
(π
2
)SzRx
(−π
2
).
(2.30)
As shown by Levitt (2001, Appendix 2),
exp(− iαSj
h
)Sk exp
(iαSj
h
)= Sk cos α + ∑
lεjklSl sin α (2.31)
8

2.2 quantum statistical description of spin-½ ensembles
is valid for any set of operators Sjkl fulfilling the angular momentum algebra (2.1).Exploiting the distributive property of matrices, it can be shown that the angu-lar momentum algebra is valid in the rotating frame. Combining Equation (2.31)with Sz = Sz, which results from Rz commuting with its own generator Sz, Equa-tion (2.30) can be simplified to
ρ f =12
1 +B
2hSy. (2.32)
Using the Pauli matrices (2.5) to represent the spin operators in the rotating frame,the final density matrix is
ρ f =
(1/2 −iB/4
iB/4 1/2
). (2.33)
After applying a π/2-pulse to a spin-½ ensemble at thermal equilibrium, the statesare equally occupied. The population difference at thermal equilibrium is convertedinto coherence.
Furthermore, the expected values
〈Sx〉 = Tr
ρ f Sx
=
12
TrSx −iB4
TrSz = 0
⟨Sy⟩= Tr
ρ f Sy
=
12
Tr
Sy+
hB
8Tr1 = hB
4
〈Sz〉 = Tr
ρ f Sz
=
12
TrSz+iB4
TrSx = 0
(2.34)
are aligned with the y-axis.
π-Pulse
The application of a π-pulse to the density matrix at thermal equilibrium (2.21)results in
ρ f = Rx(π) ρeqRx(−π)
=12
1− B
2hSz
(2.35)
with the same argumentation as in the previous example. Using the matrix repre-sentation of the spin operators (2.5), the final density matrix in the rotating frameis
ρ f =
(1/2−B/4 0
0 1/2 + B/4
). (2.36)
Comparing this result to the density matrix at thermal equilibrium (2.20’), a popu-lation inversion can be noticed. This result is quite astonishing, since the Einsteincoefficients for absorption and stimulated emission, which describe the likelihoodof a photon being absorbed and stimulating an emission, respectively, are the same.Therefore, radiation can create at most an equal occupation of the states in a twostate system. In MR this limitation is overcome by coherent RF-pulses.
Like at thermal equilibrium, Equation (2.36) shows no coherence between thestates, since the off-diagonal elements are zero.
9

physical background of magnetic resonance
2.3 macroscopic magnetization and the bloch equation
In the following the classical Bloch equation is derived from quantum statisticalmechanics. This can be done in the laboratory as well as in the rotating frameof reference. The rotating frame is mostly used in MR, since the dynamics of themagnetization is more clearly described and less discretization problems occur innumerical Bloch simulations. The possibility to derive the Bloch equation in therotating frame from quantum statistical mechanics reveals that laws of quantummechanics are not violated by this description.
2.3.1 The Laboratory Frame of Reference
The time evolution of the density matrix (2.18) is described by the von Neumannequation
∂ρ
∂t= − i
h[H, ρ] , (2.37)
which follows directly from the time dependent Schrödinger equation. UsingEquation (2.19), the vector components of the macroscopic magnetization ~M aredefined by
Mj(t) ≡ N ·⟨
µj(t)⟩= N · Tr
ρ(t) · µj
, (2.38)
where N is the number of spins contributing to the signal and j ∈ x, y, z. Differ-entiating Equation (2.38) with respect to time and employing the von NeumannEquation (2.37), one derives
Mj = N · Tr
ρ · µj
= − iN
hTr[H, ρ] · µj
. (2.39)
The dot above a variable denotes its element-wise first temporal derivative. For thesake of readability the time dependencies are omitted. Exploiting the invariance ofthe trace to cyclic permutation, i.e. TrABC = TrCAB, and the definitions (2.7,2.8), Equation (2.39) can be reformulated to
Mj = −iNh
Tr
ρ ·[µj, H
]=
iγ2Nh ∑
k∈x,y,zBkTr
ρ ·[Sj, Sk
]. (2.39’)
Employing the angular momentum algebra (2.1) and the definition of the macro-scopic magnetization (2.38), Equation (2.39’) is transformed to
Mj = −Nγ ∑k,l∈x,y,z
εjkl BkTrρ · µl = ∑k,l∈x,y,z
εjklωk Ml =(~ω× ~M
)j. (2.39’’)
In vector notation this is the famous Bloch equation without relaxation:
ddt
~M = ~ω× ~M. (2.40)
Derived from quantum statistical mechanics, this classical equation describes thedynamics of the macroscopic magnetization. It is valid for large ensembles ofnon-interacting spin-½ particles and is sufficient to describe most MRI experiments.Relaxation effects, which arise from interactions of the spins with their magneticneighborhood, complete the Bloch equation and will be discussed in Section 2.4.
10

2.3 macroscopic magnetization and the bloch equation
Please note that throughout this dissertation, the Larmor frequency has a negativesign as defined in (2.10’). This changes the order of the cross product compared tothe Bloch equation as a function of ~B.
2.3.2 The Rotating Frame of Reference
In order to calculate the Bloch equation in the rotating frame, the macroscopicmagnetic field (2.38) is transformed into the rotating frame of reference:
Mj = N ·∑k
pk
⟨ψk(t)
∣∣∣RzµjR†z
∣∣∣ψk(t)⟩
, (2.41)
where R†z = Rz(−Ωt) denotes the complex conjugate transpose of Rz = Rz(Ωt).
The frequency of the rotating frame is given by Ω. Since the rotation matrices can beapplied to the state vectors, the operator µj is time independent. This formulationis known as the Schrödinger picture. It would also be possible to apply the rotationto µj, resulting in a picture, where time dependencies are distributed to both, statevectors and operators. Since in the next step Equation (2.41) is differentiated withrespect to time, the Schrödinger picture is most convenient. The density matrix inthe rotating frame is given by Equation (2.22). Using Equation (2.38) and (2.39), thefirst derivative of the magnetization with respect to time is given by
˙Mj = N · Tr
˙ρ · µj
= − iN
hTr
ρ ·[µj, H
]. (2.42)
Using the definition of the Hamilton operator in the rotating frame (2.16), thisequation transforms to
˙Mj = −iNγ
hTr
ρ
∑
k∈x,y,zωk
[Sj, R†
z SkRz
]−Ω
[Sj, Sz
] . (2.42’)
The Taylor expansion of the exponential function gives the following expression ofthe rotation sandwich:
R†z SkRz = exp
(iΩtSz
h
)Sk exp
(−iΩtSz
h
)=
∞
∑m=0
(iΩt/h)m
m![Sz, Sk]m , (2.43)
with [Sz, Sk]m =[Sz,[Sz, Sk]m−1
]and [Sz, Sk]0 = Sk. Using the angular momentum
algebra (2.1), one can deduce
[Sz, Sk]m =(1− δzk) h2[Sz, Sk]m−2 ∀m > 1, (2.44)
where δzk denotes the Kronecker delta, i.e. δzk =1 ∀ z= k and δzk =0 ∀ z 6= k. Thisresults in
R†z SkRz = δzkSk +(1− δzk)
∞
∑m=0
(iΩt)2m
(2m)!Sk +
1h
∞
∑m=0
(iΩt)2m+1
(2m + 1)![Sz, Sk]
= δzkSk +(1− δzk) cos(Ωt) Sk +ih
sin(Ωt)[Sz, Sk] .
(2.43’)
Please note that R†z SkRz has a rotation symmetry of 2π, while Rz exhibits a 4π
symmetry (Equation 2.13’). Therefore, the abnormal 4π rotation symmetry is
11

physical background of magnetic resonance
not inherent to macroscopic magnetization and is not observed in standard MRexperiments.
Inserting Equation (2.43’) in Equation (2.42’) and defining the frequency vectorin the rotating frame
~ω =
ωx cos(Ωt) + ωy sin(Ωt)ωy cos(Ωt)−ωx sin(Ωt)
ωz −Ω
, (2.45)
one can follow the argumentation of Section 2.3.1 in order to get the Bloch equationin the rotating frame:
ddt
~M = ~ω× ~M. (2.46)
Thus, in a static magnetic field along the z-axis, a rotating frame of reference withΩ = ωz describes the spin precession as a constant magnetization vector. Pleasenote that the Bloch equation in the rotating frame has the same form as in thelaboratory frame (2.40) with a redefined frequency vector (2.45). Therefore, most ofthe following descriptions are valid for both frames of reference.
2.3.3 Radio Frequency Pulses: Classical Description
If the rotating frame has the same frequency as the RF-pulse (Ω=ωRF), the totalmagnetic field, which is composed of the static part defined in (2.10’’) and thedynamic part defined in (2.25), can be expressed by the frequency vector
~ω(t) =
Re
ωx,y(t)
Im
ωx,y(t)
ωz −Ω
. (2.47)
Thereby Rea and Ima denote the real and the imaginary part of a, respectively.If the considered magnetization fulfills ωz =Ω, the Bloch equation in the rotatingframe (2.40) describes e.g. for a real valued ωx,y a rotation about the x-axis. Moregenerally, a constant ωx,y creates a rotation about an axis in the x-y-plane, while avarying ωx,y(t) and/or ωz 6= Ω create rather complex rotation pattern.
2.4 relaxation
For an ensemble of non-interacting spins, a law for the dynamics of the macroscopicmagnetization (2.40, 2.46) was derived. By this law, an excited spin ensemble wouldstay in precession forever. However, relaxation effects are observed in experimentsand cannot be explained within that picture. Relaxation is essential in MR, sincethermal equilibrium is reached by relaxation. Furthermore, different relaxationtimes are exploited in order to create a variety of contrasts, making MRI such apowerful tool for diagnostics.
Commonly, the relaxations of the longitudinal magnetization Mz and the transver-sal magnetization M⊥ = Mx + iMy are described separately. The longitudinalcomponent corresponds to the diagonal entries of the density matrix (2.18), i.e.the probabilities. Its relaxation is often referred to as spin-lattice relaxation and is
12

2.4 relaxation
described by the characteristic time T1. The relaxation of the transversal magneti-zation is called spin-spin relaxation. The transversal component corresponds theoff-diagonal elements of the density matrix, i.e. the coherence. Its characteristictime is T2.
2.4.1 T1-Relaxation
Spontaneous emission plays an important role in the visible part of the electro-magnetic spectrum, which is of the order of 1015 rad/s. Fluorescence lifetimes atthose frequencies are typically of the order of 10−9 s. The ratio of the Einsteincoefficients for spontaneous and stimulated emission is a function of ω3 (Einstein,1917). Assuming a constant Einstein coefficient for stimulated emission, the lifetimeof 10−9 s translates to approximately 107 years at a Larmor frequency of 107 rad/s.Thus, spontaneous emission can be neglected in MR and the relaxation process inMR is dominated by stimulated emission. The underlying mechanisms of relaxationare outlined in the following.
The spin ensemble is immersed in a heat reservoir called lattice, which describesall degrees of freedom except those of the considered nuclear spin itself. Sincethe Zeeman states of spin-½ particles are not degenerate, the Einstein coefficientsfor absorption and stimulated emission are equal. From those considerations, onecould conclude that the spin system relaxes into equal occupation of the two states,which is obviously wrong. Nevertheless, it is the result of many simple relaxationmodels and is often overcome by heuristically redefining the transition probabilities,inducing relaxation of the spin ensemble into the Boltzmann distribution. Theproblem arises from the assumption of the lattice being independent of the state ofthe spin under consideration. A conclusive theory can be formulated within thequantum mechanical framework (Abragam, 1961, Chapter VIII).
Bloembergen et al. (1948) developed a theory that accurately predicts relaxationtimes of pure substances by describing the random field changes generated by thetumbling motion of the molecules. Describing the autocorrelation of the magneticfield changes, a lower boundary for T1 is determined as function of the viscosity ofthe substance. It is in accordance with experimental findings (Levitt, 2001, Chapter20). However, this theory fails in more complicated environments like humantissue.
Conclusive theories of relaxation are quite elaborate. Since it is not the focus ofthis thesis, only the macroscopic results are stated here without any microscopicjustification. For a detailed description of relaxation mechanisms, please consultAbragam (1961, Chapter VIII). The heuristic finding of Bloch (1946) was that therelaxation of the longitudinal magnetization into thermal equilibrium is describedby
Mz(t) = −(
Mz(t)−Meq)
/T1, (2.48)
where Meq denotes the equilibrium magnetization. This exponential decay isgenerally assumed and can be justified by theory in certain cases (Abragam, 1961,Chapter VIII).
The T1-relaxation times of most biological tissue are of the order of hundreds ofmicroseconds to seconds.
13

physical background of magnetic resonance
2.4.2 T2-Relaxation
The relaxation of the transversal magnetization is mainly driven by the intramolec-ular dipole-dipole coupling (Levitt, 2001, Chapter 20). No energy is exchanged inspin-spin relaxation, but coherences between the spins (off-diagonal elements ofthe density matrix) are lost. Thereby, the entropy increases, making this processirreversible. The decay of the transversal magnetization is described by
d|M⊥(t)|dt
= −|M⊥(t)|T2
(2.49)
(Bloch, 1946). Please note that in certain cases a single exponential function is notsufficient to describe the relaxation of spin coherence (Levitt, 2001, Chapter 11.9,note 10).
For the model of random fluctuating fields, one can derive the theoretical limit
T2 ≤ 2 · T1 (2.50)
(Levitt, 2001, Chapter 11.9 and 20). However, in most cases the transversal magneti-zation relaxes faster than the longitudinal magnetization. Usually, T2 is of the sameorder of magnitude as T1, i.e. of the order of hundreds of microseconds to seconds.
2.4.3 Field Inhomogeneities and T∗2 -Decay
In this section, the signal composition of a sample is analyzed. Sample is hereused as generic term and refers to an ensemble of spins which cannot be told apartin the particular experiment. In NMR spectroscopy the entire sample contributesto the signal, while in MRI sample refers to a voxel. In any experimental setup,the magnetic field is inhomogeneous due to various reasons: built quality of themagnet, susceptibility effects at boundaries between different tissues, the chemicalenvironment of the nucleus etc. These inhomogeneities are assumed to be constantover time.
In Equation (2.38), the macroscopic magnetization was introduced. In the pres-ence of inhomogeneities of the static magnetic field, it is helpful to define thespectral magnetization density ~m(ωor, t) by
~M(t) =∫ ∞
−∞~m(ωor, t)dωor, (2.51)
where ωor = ωz −Ω denotes the off-resonance frequency when Ω is the resonancefrequency. The off-resonance frequency is assumed to constant over time and doesnot take imaging gradients into account (see Chapter 4).
The equilibrium magnetization density is aligned along the z-axis and its ab-solute value is given by meq(ωor). Applying a π/2-pulse to it at t = 0, the Blochequation (2.46) is solved by the transversal magnetization
M⊥(t) =∫ ∞
−∞exp(iωort)meq(ωor) dωor (2.52)
for t > 0. T2-relaxation is neglected for simplicity. Please note that this formulais valid in both, the laboratory and the rotating frame of reference. In order tosimplify further discussions, the rotating frame of reference is chosen here.
14

2.4 relaxation
Assuming for example a Gaussian distribution of magnetization density meq(ωor) ∝exp
(−(ωor/σ)2) with the standard deviation σ, the transversal magnetization
M⊥(t) ∝ exp(−t2) (2.53)
is a Gaussian function of time.Given a, b ∈ R+ and the delta distribution δ(ωor), the magnetization density
meq(ωor) ∝ a · δ(ωor) + b · δ(ωor − ωcs) is an idealized model of e.g. water protonsoscillating at ωor =0 and fat oscillating at ωor = ωcs, where ωcs denotes the chemicalshift. This results in the oscillating magnetization
M⊥(t) ∝ a + b · exp(iωcst) . (2.54)
These two examples illustrate how the signal behavior in an inhomogeneousmagnetic field hugely depends on the magnetization density as a function of theLarmor frequency. Nevertheless, a Cauchy distributed magnetization density isoften assumed:
meq(ωor) ∝2π/T′2
(2π/T′2)2 + ω2
or. (2.55)
This leads to an exponential signal decay generally captured by
d|M⊥(t)|dt
= −|M⊥(t)|T′2
(2.56)
for t>0. The decay of the transversal magnetization due to field inhomogeneitiesin the particular sample is described by the characteristic time T′2. The fieldinhomogeneities under consideration are static. Therefore, this process is reversibleand strictly speaking no relaxation.
Combining the effect of static field inhomogeneities and spin-spin relaxation, thedecay time T∗2 is defined:
1T∗2
=1T2
+1T′2
. (2.57)
Under the assumptions made, T∗2 fulfills an equation of the form of (2.49).
2.4.4 The Bloch Equation including Relaxation
With the description of the relaxation processes (2.48) and (2.49) and the equationof motion (2.40), the complete Bloch equation is given by
~M = ~ω× ~M−
Mx/T2
My/T2(Mz −Meq
)/T1
. (2.58)
Of course, the Bloch equation with relaxation could be derived in the rotating frameof reference in the same way and has the same form. Please note that magneticfield inhomogeneities are described by solving the equation for each ~ω present inthe sample. Therefore, only the irreversible T2-decay is taken into account for thedescription of the relaxation process. One could also choose the central Larmorfrequency for ~ω and describe the off-resonance effects by T∗2 .
15


3M R S I G N A L A N D B A S I C M R E X P E R I M E N T S
Based on the derived Bloch equation, the concept of signal reception and two basicMR experiments are described briefly: The free induction decay (FID) and the Hahnecho. They form the basis of two basic groups of imaging methods: the gradientecho (GE) and the spin echo (SE) pulse sequences.
3.1 mr signal
As shown by Michael Faraday, the voltage induced in a coil by a varying magneticfield is given by
U(t) ∝∮
∂A~E d~s = −
∫
A
∂~B∂t
d~A, (3.1)
where the first integration is performed along the wire which defines the border~sof the area ~A of the coil. The area of the coil is assumed to be constant over timein the laboratory frame of reference, which is therefore used in the following. Theelectric field is denoted by ~E and ~B is the total magnetic field penetrating the coil.
In practice, receive coils are resonators tuned to the Larmor frequency. Therefore,their sensitivity to magnetic field changes due to switching gradient coils, as wellas T1- and T2-relaxation of the magnetization can be neglected. Hence, ∂~B/∂tis considered in the following to be generated by the Larmor precession of themagnetization only. With this abstraction of Faraday’s law, U(t) is used as a genericphrase for the signal intensity measured by the coil.
With the spins being distributed over space, the spatial magnetization density~m(~r, t) can be defined analogous to Equation (2.51):
~M(t) =∫
sample~m(~r, t) d3r, (3.2)
where~r denotes the position in space. As demonstrated by Haacke (1999, Chapter 7),Faraday’s law (3.1) can be rewritten as
U(t) ∝∫
sample~Bc(~r) · ~m(~r, t)d3r, (3.3)
where ~Bc(~r) denotes the magnetic field produced by a unity current flowing throughthe receive coil. The dimension of ~Bc is magnetic field strength divided by a current.
Given the transversal magnetization density m⊥(~r, 0) = mx(~r, 0) + imy(~r, 0),
m⊥(~r, t) = m⊥(~r, 0) · exp(iωz(~r)t− t/T2) (3.4)
17

mr signal and basic mr experiments
solves the Bloch equation (2.58), if only a static magnetic field in the z-directionis present. Assuming ωz 2π/T2 and neglecting the T1-decay, the signal isapproximated by
U(t) ∝ exp(− t
T2
) ∫
sampleωz(~r) · ImBc(~r) ·m⊥(~r, 0) · exp(iωz(~r)t) d3r
= exp(− t
T2
) ∫
sampleωz(~r) ·
(ReBc(~r) ·m⊥(~r, 0) · sin(ωz(~r)t)
+ ImBc(~r) ·m⊥(~r, 0) · cos(ωz(~r)t))
d3r,
(3.5)
where Bc(~r) = Bc,x(~r) + iBc,y(~r) is the coil sensitivity, which will be subject offurther discussion in terms of sensitivity encoding (Section 4.2).
The measured signal in Equation (3.5) is real and a linear combination of decayingsine and cosine functions with respect to time. Doubling the main magnetic fielddoubles ω and in a first approximation also the initial magnetization m⊥(~r, 0).Therefore, the signal intensity is proportional to the square of the main magneticfield. However, more detailed analysis showed the increase of signal to noise ratio(SNR) to scale approximately linear with the main magnetic field (Ladd, 2007).
So far the Larmor frequency ωz(~r) was assumed to be constant over time. Due toscanner instabilities, varying imaging gradients, respiration etc. this is not strictlycorrect. However, one can assume that the changes of the magnetization inducedby the variations of the Larmor frequency are small compared to the oscillationsthemselves. Therefore, Equation (3.5) and the following discussion are also validfor ωz(~r, t).
3.2 signal demodulation
In the previous section U(t) was used to describe the signal induced in the receivecoil, which oscillates with the Larmor frequency ωz. Since this fast oscillation ishard to digitize, it is transformed into a rotating frame of reference which oscillateswith the frequency Ω about the z-axis. For that purpose the signal is split intotwo channels and multiplied by sin(Ωt) and cos(Ωt), respectively. The result isexpressed as the complex signal
Sun f iltered(t) = U(t)(sin(Ωt) + i · cos(Ωt)). (3.6)
The trigonometric identities
cos(ωt) · cos(Ωt) =cos((ω−Ω) t) + cos((ω + Ω) t)
2
sin(ωt) · sin(Ωt) =cos((ω−Ω) t)− cos((ω + Ω) t)
2
sin(ωt) · cos(Ωt) =sin((ω−Ω) t) + sin((ω + Ω) t)
2
(3.7)
show a split of the signal into two frequency bands. Assuming the variations ofωz(~r) to be small compared to its mean value and choosing the reference frequencyto be Ω ≈ ωz, the bands are very well separated and a low pass filter can be applied.
18

3.3 free induction decay
The demodulated and filtered signal is given by
S(t) ∝ exp(− t
T2
) ∫
sampleωz(~r) ·m⊥(~r, 0) · Bc(~r) · exp(i(ωz(~r)−Ω)t) d3r. (3.8)
U(t) denotes the fast oscillating, real valued signal in the laboratory frame of refer-ence, whereas the complex signal S(t) describes the dynamics of the magnetizationin a rotating frame of reference. Describing the variables in the rotating frame ofreference, the signal is given by
S(t) ∝ exp(− t
T2
) ∫
samplem⊥(~r, 0) · B⊥(~r) · exp(iωz(~r)t) d3r, (3.8’)
where ωz Ω is assumed.The Siemens (Erlangen, Germany) hardware used for the preparation of this
thesis performs demodulation partly digitally. However, this does not change thederived formulation of signal generation.
3.3 free induction decay
In a simple gedankenexperiment the magnetization is rotated instantaneously fromthermal equilibrium onto the x-axis at t = 0 and is in free precession thereafter.Assuming that no imaging gradients are present, i.e. ωz = ωor and that the coilsensitivity is constant over space, the spatial dependency in Equation (3.8’) can bedropped, revealing the signal
S(t) ∝ exp(− t
T2
) ∫ ∞
−∞meq(ωor) · exp(iωort) dωor (3.8’’)
in the rotating frame of reference. Assuming a Cauchy distribution of the spectralmagnetization density (2.55) with the central frequency ω0 = Ω or ω0 = 0, thesignal as a function of time is given by
S(t) ∝ exp(− t
T2
)· exp
(− t
T′2
)= exp
(− t
T∗2
). (3.9)
The signal decays exponentially with the characteristic time constant T∗2 (Equa-tion 2.57). Since Faraday’s law of induction forms the basis of signal reception, thesignal behavior described by Equation (3.9) is called Free Induction Decay (FID).
3.4 hahn echoes
The concept of spin echo generation described by Erwin Hahn (1950) is the founda-tion of a wide range of pulse sequences used in MR. The basic ideas are outlinedin the following. First, the special case of π-refocusing pulses is reviewed, whichcreate spin echoes without further assumptions. Thereafter, arbitrary refocusingflip angles are discussed, which require a strongly dephased spin ensemble at thetime of the refocusing pulse in order to generate spin echoes.
Throughout this section hard pulses, i.e. instantaneous rotations are assumed.Hard pulses approximate short symmetric pulses sufficiently for most MRI pulsesequences.
19

mr signal and basic mr experiments
3.4.1 Hahn Echoes with a π-Refocusing Pulse
Signal after a π-Refocusing Pulse
In order to create a Hahn echo at the echo time THE, one applies a refocusing pulseat THE/2. The transversal magnetization density
m⊥(ωor, THE/2) = m⊥(ωor, 0) · exp(iωor · THE/2) (3.10)
is assumed, which is a solution of the Bloch equation (2.46). Applying an instanta-neous π-pulse along the x-axis at t = THE/2, the y-component is inverted, whichcorresponds to a complex conjugation of the transversal magnetization. Assumingfree precession thereafter, the signal for t > THE/2 is described by
S(t) ∝ exp(− t
T2
) ∫ ∞
−∞m∗⊥(ωor, 0) · exp(iωor(t− THE)) dωor. (3.11)
Disregarding the T2-decay, the magnetization at t=THE and t=0 are the complexconjugate (indicated by the star) of each other, as is the signal at these particularpoints in time.
The (π − α)-π-Pulse Sequence
The previous section outlined the effect of a π-refocusing pulse onto an arbitrarytransversal magnetization m⊥. In this section, the equilibrium magnetization is theinitial point and the created transversal magnetization is expressed as a function ofmeq(ωor).
After rotating meq(ωor) from thermal equilibrium at t=0 by π − αexc about they-axis, the spin ensemble dephases (see Section 3.3). Flipping the dephased mag-netization at the time THE/2 by π about the x-axis, the transversal magnetizationis complex conjugated and the inverted phase slope leads to a refocusing of themagnetization, as illustrated by Figure 1.
Given Equation (3.11), the signal for t > THE/2 is described by
S(t) ∝ exp(− t
T2
) ∫ ∞
−∞meq(ωor) · sin(αexc) · exp(iωor · (t− THE)) dωor. (3.12)
Assuming a Cauchy distribution with ω0=0 (Equation 2.55), the signal intensity isgiven by
S(t) ∝ exp(− t
T∗2
), 0 < t < THE/2
S(t) ∝ exp(
tT′2− t
T2
), THE/2 < t < THE (3.13)
S(t) ∝ exp(− t
T∗2
), THE < t.
The signal as a function of time is shown in Figure 2. It reaches a maximum atthe echo time THE. This signal behavior, first discovered by Hahn (1950) is called aspin echo or Hahn echo. Using a π-refocusing pulse, this description is valid forany magnetization density, echo time and αexc. The most prominent version is the(π/2)-π-pulse sequence, since it creates the highest echo.
20

3.4 hahn echoes
x
y
z
x
y
z
x
y
z
x
y
z
x
y
z
x
y
z
x
y
z
x
y
z
∣∣ωx,y∣∣|S|
0 THE/2 THE t
π − αexc
π
Figure 1.: The first and second row display the spin evolution of a (3π/4)-π- anda (π/2)-π-pulse sequence, respectively. The magnetization of differentisochromats are shown as normalized vectors on the so-called Bloch-sphere. The color coding corresponds to the frequencies of the spinisochromats: red and blue represent low and high Larmor frequencies,respectively. At the bottom, the pulse sequence and the echo is sketchedin order to provide a time axis for reference. After excitation at t = 0,the spins start to dephase. At the time of the refocusing pulse, thespins are maximally dephased. After the refocusing pulse the transversalmagnetization shows a complex conjugate symmetry to the magnetizationbefore the pulse. The last column shows the magnetization shortly beforeit is refocused at THE. Please note that the degree of dephasing waschosen for good visualization. This pulse sequence works for any amountof dephasing.
21

mr signal and basic mr experiments
|S(t)|
|S(0)|
THE/2 THE t
T2
T∗2T∗2
Figure 2.: The signal created by a (π − αexc)-π-pulse sequence is shown. As de-scribed by Equation (3.13), the signal decays with T∗2 after excitation. Therefocusing pulse at t = THE/2 creates an echo at t = THE. Thereafter thesignal decays again with T∗2 .
3.4.2 Hahn Echoes with Arbitrary Flip Angles: The Regime of Strong Dephasing
In his original paper, Erwin Hahn (1950) actually used a (π/2)-(π/2)-pulse sequence.Adopting his argumentation, it is shown in the following how any combination oftwo pulses leads to refocusing of parts of the magnetization.
As a staring point, some arbitrary magnetization densities m⊥ and mz are as-sumed to be created by and excitation pulse and free precession and the effect ofthe refocusing pulse is analyzed. Rotating the magnetization instantaneously byαref about the x-axis, the resulting transversal magnetization density is given by
m+⊥(ωor) = m⊥(ωor) cos2 αref
2+ m∗⊥(ωor) sin2 αref
2− imz(ωor) sin αref (3.14)
(Woessner, 1961). The plus indicates the magnetization density after the refocusingpulse. This representation separates the magnetization density into three parts. Thefirst part is the unaffected original magnetization density, which is weighted bycos2(αref/2). This part of the magnetization density continues to dephase after therotation. The second part is the complex conjugate of the original magnetizationdensity. It incorporates an inversion of the phase slope, creating a symmetry of thephase evolution before and after the pulse assuming free precession. It is weightedby sin2(αref/2). Therefore, this part is maximal at αref = π. The third part is simplythe newly excited magnetization.
This result is used to analyze the magnetization density after application of anexcitation pulse with flip angle αexc and a refocusing pulse with αref. The phaseof the excitation pulse ϕαexc can be chosen freely, where ϕαexc = 0 corresponds toa rotation about the x-axis. In contrast, the refocusing pulse is fixed to a rotationabout the x-axis. Please note that this does not imply a loss of generality, since thephase of αref can be absorbed by ϕαexc by choosing an appropriate frame of reference.Exciting a spin ensemble from thermal equilibrium by αexc, the created transversalmagnetization density is described by
m⊥(ωor, t) = meq(ωor) sin αexc · exp(i(ωort + ϕαexc − π/2)). (3.15)
22

3.4 hahn echoes
At the time THE/2, a refocusing pulse αref is applied. Using Equation (3.14), thetransversal magnetization density at the echo time is given by
m⊥(ωor, THE) = meq(ωor) sin αexc ·(
exp(−i(ϕαexc − π/2)) · sin2 αref
2
+ exp(i(ϕαexc − π/2 + ωorTHE)) · cos2 αref
2
)
−imeq(ωor) cos αexc· exp(iωorTHE/2) sin αref.(3.16)
This generally holds for sequences of two short pulses applied to magnetization atthermal equilibrium. The resulting magnetization is decomposed into three terms.The first summand is weighted by sin2(αref/2) and is independent of ωz as well asTHE. It describes the refocused part of the magnetization, whose amplitude is givenonly by meq, αexc and αref. The second summand describes the magnetization thatdephases as if there was no refocusing pulse. It is weighted by cos2(αref/2). Thethird part is the magnetization newly excited by the refocusing pulse.
In his original paper, Hahn (1950) assumes complete dephasing of the spinensemble. Assuming a Cauchy distribution, this condition can be expressed asT′2 THE/2. This implies ∆ωfwhm 2π/THE for the full width of half maximumof the Larmor frequency. This constraint can e.g. be fulfilled by crusher gradients.Under this assumption, the magnetization dephases such that it does not contributeto the signal after THE/2, if it is not refocused. Thus, the second and third term ofEquation (3.16) are negligible and the resulting magnetization at THE reduces to
m⊥,Hahn(ωor) = meq(ωor) sin αexc · sin2 αref
2· exp(−i(ϕαexc − π/2)) . (3.17)
Only the refocused term contributes to the signal at the echo time. For high valuesof ∆ωfwhm · THE the magnetization at t 6= THE is negligible and a sharp echo isformed. Throughout this dissertation echoes of this kind are called Hahn echoes.The spin dynamics during the formation a Hahn Echo is illustrated in Figure 3.
Dropping the assumption of complete dephasing, the signal behavior at both THE
and at t 6= THE is rather complicated. The cos2 αref/2 term is no longer negligibleand can increase or - by complex summation - reduce the signal intensity at THE.Spin echoes in that regime are discussed in Chapter 8.
23

mr signal and basic mr experiments
x
y
z
x
y
z
x
y
z
x
y
z
ωx
0 ½ t/THE
π/2 π/2
x
y
z
x
y
z
x
y
z
x
y
z
|S|
½ 1 t/THE
Figure 3.: The spin dynamics in Hahn’s original experiment (Hahn, 1950) on theBloch-sphere is depicted together with the corresponding pulse sequence.The spin ensemble is displayed within the range of ∆ωfwhm · THE = 200π,resulting in strong dephasing at THE/2, as indicated by the distributionof all colors over the entire disk. The last two Bloch-spheres in the toprow show the magnetization directly before and after the refocusingpulse. The illustration is continued in the second row, accompaniedwith the corresponding signal, assuming a Cauchy distribution withT′2 = THE/50. After the refocusing pulse, the spin dynamics has arather obscure pattern. But at THE, the tips of the vectors draw a figureeight on one hemisphere, resulting in the magnetization componentM⊥ = i/2 ·Meq, where Meq denotes the magnitude of the equilibriummagnetization (see Equation 3.16). In this picture, the color-coding ofLarmor frequencies illustrates the uniform distribution of all isochromats.The exact arrangement depends on the discretization of the illustration.
24

4M A G N E T I C R E S O N A N C E I M A G I N G
In magnetic resonance imaging (MRI) the magnetization density is mapped toan image. The purpose of anatomical imaging is the distinct display of differenttissues. In order to create a good contrast between different tissues, the mag-netization density can be weighted by relaxation times, according to the Blochequation (2.58). Beyond anatomical imaging, MRI is further used to map brainfunctionality amongst others. In this chapter, the general process of spatial encodingand image reconstruction is outlined with focus on strategies that are important forunderstanding this dissertation. In Section 4.1, the explanation of spatial encodingis accompanied by a discussion on image reconstruction, since their potentials andlimitations closely interrelate. Practical implementations of image reconstructionare given in Section 4.2 with a focus on the methods used for preparing this thesis.
4.1 gradient encoding
In optics, the maximum resolution is given by the diffraction limit ∆x ≥ λ/2,where λ denotes the wavelength. At a Larmor frequency of 100 MHz, this leadsto a resolution of approximately 3 m, "which is not sufficient even for imagingelephants" as Ernst et al. (1987) put it nicely. Lauterbur’s (1973) genius idea of usingspatially varying magnetic fields for encoding images forms the basis of almost allMR imaging experiments. Within the scope of this thesis, it is sufficient to assumethe encoding fields to be linear in space, i.e. have a constant gradient. The effectof a so-called gradient field on the Bloch equation (2.46) is to change the Larmorfrequency to
ωz(~r, t) = −γ~G(t) ·~r + ωor(~r). (4.1)
In order to demonstrate the mechanism of imaging gradients, off-resonance effectsare neglected for the rest of this section, i.e. ωor = 0 is assumed. The gradientstrength is denoted by ~G(t) = ~∇ · Bz(~r, t) and the position in space by~r.
Since the position space is three-dimensional, usually three orthogonal, spatiallyconstant gradients are used that define the axes x, y and z of a 3D image. Anygradient direction can be synthesized by linear combination, allowing a rotationof the coordinate system. In basic MR textbooks the encoding process is oftendivided into slice selection, phase and frequency encoding. Slice selection isdiscussed first, as it is conceptually different. Thereafter, the concept of Fourierencoding is explained, which combines phase and frequency encoding into a singleframework. Fourier encoding can be applied in 2D after the excitation of a thinslice. Alternatively a thick slab can be excited, followed by 3D Fourier encoding.The basic concept of 2D and 3D encoding is equivalent and the following gives ageneral explanation.
25

magnetic resonance imaging
4.1.1 Slice Selective Excitation
Slice selective excitation (Lauterbur et al., 1975) allows the encoding of one dimen-sion simply by creating transversal magnetization only over a certain region ofspace. Applying an excitation pulse while the slice gradient ~Gs is turned on, theBloch equation takes the following form:
ddt
~M =
ωx
ωy
−γ~Gs ·~r
× ~M. (4.2)
Usually, one wants to excite the magnetization within a defined slice by someflip angle, while leaving the magnetization elsewhere unaffected. The solution tothis problem is in general non-trivial. But for small flip angles Equation (4.2) isapproximated by the Fourier transformation (Hoult, 1979). Therefore, a sinc shapedpulse is an appropriate approximation for the slice selective excitation problem.
Right after the pulse, the phase of the magnetization usually varies over theslice profile. E.g. in the case of a symmetric sinc pulse the phase is equal tothe one accumulated in half the pulse duration during free precession. It can becompensated by inverting the slice gradient for an appropriate amount of time.
4.1.2 Fourier Encoding
The Concept of k-Space
Fourier encoding is performed by manipulating the Larmor frequency (4.1) andthus the phase of the magnetization density m⊥(~r, t) by switching gradients afterthe excitation. Neglecting relaxation and off-resonance effects and assuming thesensitivity of the receive coil to be constant over space, Equation (3.8’) is adopted todescribe the signal in the presence of imaging gradients:
S(t) ∝∫
samplem⊥(~r, 0) · exp
(−iγ
∫ t
0~G(t′) ·~rdt′
)d3r. (4.3)
The accumulated phase induced by the gradients is described in the so-calledk-space. Coordinates in this space are given by
~k(t) = γ∫ t
0~G(t′) dt′. (4.4)
The concept of k-space was introduced by Kumar et al. (1975), Ljunggren (1983)and King and Moran (1984), simplifying the signal equation to
S(~k)
∝∫
samplem⊥(~r, 0) · exp
(−i~k ·~r
)d3r. (4.3’)
The signal depends purely on the position in k-space, if all time dependenciesdespite the gradients are neglected. This equation reveals that gradients do nothingbut a three dimensional, continuous Fourier transform of the spatially varyingmagnetization density. Therefore, the mature theoretical framework of the Fouriertransform, as well as its sophisticated and fast implementations such as the fast
26

4.1 gradient encoding
Fourier transform (FFT) (Cooley and Tukey, 1965) can be utilized. The signalprocessing community provides rich literature on this topic. In the context of MRI,Liang and Lauterbur (2000, Chapter 2.5 and 5.4) give an in-depth insight into thefundamental aspects of gradient encoding.
The Nyquist Theorem
In order to derive the Nyquist theorem, each dimension in space is treated sep-arately. Here, the dimension x is considered. The extension to ~r = (x, y, z)T isstraightforward. In the presence of the gradient Gx, the analog digital converter(ADC) evaluates the signal (4.3’) at discrete points in k-space:
S[n] ∝∫ ∞
−∞m⊥(x, 0) · exp(−in∆kxx) dx. (4.3’’)
The signal at discrete points in k-space is denoted by S[n], while S(kx) describesa continuous function of kx. The sampling interval is given by ∆kx. Please notethat the analog digital converter performs an integration along kx. But sincethe integration range is rather small, it can be approximated by the mean value.Assuming the signal to be sampled at all n ∈ Z, Equation (4.3’’) represents a Fourierseries of the magnetization density. An image I(x) of the object is reconstructed bythe Fourier transformation:
I(x) =∆kx
2π
∞
∑n=−∞
S[n] exp(in∆kxx)
∝∆kx
2π
∞
∑n=−∞
∫ ∞
−∞m⊥(x′, 0) · exp
(in∆kx(x− x′)
)dx′.
(4.5)
Please note that the image is a continuous function of the spatial position. Usingthe Poission summation formula, the exponential function is replaced by a Diracdelta-distribution:
I(x) ∝∞
∑n=−∞
∫ ∞
−∞m⊥(x′, 0) · δ
(x− x′ − 2πn
∆kx
)dx′
=∞
∑n=−∞
m⊥
(x− 2πn
∆kx, 0)
.(4.5’)
Because of the discretization of the signal, the image is composed of an infinitenumber of replica of the transversal magnetization density, spaced by 2π/∆kx. Ifthe magnetization density extends over the distance FOVx (field of view), the signalmust be sampled with
∆kx ≤ 2π/FOVx (4.6)
in order to avoid fold-over artifacts. This law is widely known as the Nyquist-Shannon sampling theorem (short Nyquist theorem). It was first proposed byClaude Shannon (1949) based on the work of Harry Nyquist (1928). The originalformulation states that a continuous signal can be completely recovered whencontaining no frequency higher than half the sampling frequency. Please note thedifference of a factor of two between the original formulation and Equation (4.6).This is due to the signal deconvolution described in Section 3.2. At each samplingpoint actually two data points are acquired with a phase difference of π/2 andcombined into a complex signal. This halves the required number of data points.
27

magnetic resonance imaging
Image Resolution
Of course, only a finite amount of data points is sampled in practice. The effect oflimiting the sampled area of k-space is discussed in the following. The Nyquisttheorem states that with a finite amount of data points an exact reconstruction ofI(x) is not possible (Shannon, 1949). In fact, there is no unique reconstruction, sincehigh spatial frequencies are not determined. Therefore, a reconstructed image isonly an approximation of the magnetization density.
In the Fourier series in Equation (4.5), it is feasible to fill the unmeasured Fouriercoefficients with arbitrary, finite values. The most convenient solution is the oneminimizing the `2-norm of the image intensity. For an image I(x), the `p-norm isgiven by
‖I‖p ≡(∫|I(x)|p dx
)1/p
. (4.7)
Using the Parseval theorem, one can show that all unknown Fourier coefficients areforced to zero, leading to the image reconstruction equation
I(x) =∆kx
2π
N/2−1
∑n=−N/2
S[n] exp(in∆kxx) , (4.8)
where N ∈N denotes the number of acquired data points (Liang and Lauterbur,2000, Chapter 6.2.2). Please note that this Fourier series still results in a continuousimage function, which is composed of low frequency components only. However,setting all unknown Fourier coefficients to zero leads to the well known Gibbsringing artifact (Gibbs, 1898).
Sampling k-space up to the frequency kx,max = N/2 · ∆kx, the resolution due tothe acquisition process is defined by
∆x ≡ π
kx,max=
2π
N∆kx. (4.9)
Throughout this dissertation the (nominal) resolution of an image is be given by thisdefinition. For computation and display purposes, the Fourier series is evaluatedonly at discrete points in space. The maximum voxel size for including all sampledinformation is then given by ∆x. The reconstruction of a discrete image with thatparticular voxel size is simply given by the fast Fourier transform (FFT) of the signalvector. Regardless, one often evaluates the Fourier series with smaller ∆x in orderto obtain a more pleasant looking image. This can be implemented by zero-paddingthe sampled k-space before the application of the FFT. Nevertheless, the resolutionis defined by Equation (4.9) throughout this dissertation. A fundamental propertyof the FFT is that the signal vector has the same length as the resulting image vector.Without zero-padding, the number of sampled data points N results in
FOVx = ∆x · N =2π
∆kx, (4.10)
which is the maximum FOVx permitted by the Nyquist theorem (4.6) and closesthe circle.
28

4.1 gradient encoding
The Voxel and the Point Spread Function
For the analysis of off-resonance effects such as T∗2 -decay and for a practical def-inition of an MR image in general, it is essential to define a voxel. The nameoriginates from "volume pixel". Each voxel corresponds to one discrete data pointin the reconstructed image. Ideally the signal of one voxel is composed only of themagnetization within a small region of space. For Fourier encoding, the signal of avoxel is given by combining Equation (4.3’’) and (4.8):
I[x] ∝∆kx
2π
N/2−1
∑n=−N/2
∫ ∞
−∞m⊥(x′, 0) exp
(in∆kx(x− x′)
)dx′. (4.11)
The signal of one voxel is composed of the entire magnetization density, weightedby the imaging process and the reconstruction. In order to quantify the contributionof the magnetization density at one point in space to all voxel, the point spreadfunction (PSF) is defined by switching the order of the sum and the integral:
I[x] ∝∫ ∞
−∞m⊥(x′, 0)PSF
(x′, x
)dx′. (4.12)
In this definition, the signal of a voxel is the integral over the magnetization densityweighted by the PSF. In the particular case of Fourier encoding and reconstruction,the PSF is
PSFFourier(∆x) =∆kx
2π
N/2−1
∑n=−N/2
exp(in∆kx∆x) . (4.13)
This PSF is shift-invariant, since it depends only on the relative distance ∆x = x− x′
between the magnetization density and the voxel1. In contrast, the PSF dependson the spatial position of the source in the case of parallel imaging. In the caseof non-linear reconstructions it also depends on the magnetization density itself.Off-resonance effects and relaxation also biases the PSF. Pictorially speaking, thePSF describes how the magnetization density of one point in space is distributedover the image.
4.1.3 Navigating Through k-Space: Hardware Limitations
So far, the mathematical limits of k-space sampling for Fourier image reconstructionwere discussed. Gradients are used for navigation through k-space, as defined inEquation (4.4). Magnetic field gradients are created by currents flowing throughdesignated coils. These currents are bounded by power supply and heat production.Hence, the speed of traveling through k-space is limited to
~kmax = ~Gmax. (4.14)
In standard MRI systems the vectorial gradient ~G = (Gx, Gy, Gz)T is realized bythree coils, which create perpendicular gradients and are limited independently.In the system used for preparing this thesis, all three channels have the samespecifications. This property is assumed in the following. By definition of theEuclidean norm, the magnitude of the maximum gradient strength |~Gmax| depends
1 It is assumed that object and image space are matched to each other.
29

magnetic resonance imaging
on the direction of the gradient. If any k-space trajectory is desired to be freelyrotatable, the maximum gradient strength must fulfill |~Gmax| ≤ Gmax, where Gmax
denotes the maximum gradient strength of a single channel.The second limitation is given by Faraday’s law of induction. It states that a
magnetic field can only be built up in a finite amount of time. Therefore, the firstderivative of the gradient strength with respect to time, i.e. G, is limited. Thisquantity is often referred to as slew rate. Strictly speaking, the voltage applied to agradient coil is limited. Hence, the maximum slew rate as a function of the gradientstrength depends on the inductive and ohmic resistance of the coil. For simplicity,one usually takes the maximum slew rate that is realizable at any gradient strengthto limit the second derivative of a k-space trajectory:
~kmax = ~Gmax. (4.15)
MRI hardware does not allow to change the gradient strength in a continuousmanner. The gradient shape is discretized into multiples of the so-called gradientraster time (GRT). The power supply of the coils converts the digital gradient shapeinto a voltage. Data acquisition along the trajectory can, however, be done at afaster rate.
4.1.4 Cartesian k-Space Sampling and Basic Pulse Sequences
Historically, radial k-space sampling was employed for the first MRI experiments(Lauterbur, 1973). However, Cartesian trajectories were the first ones that gotwidespread and still dominate clinical MRI. Their benefits are robustness to gradienttiming errors and efficiently fulfilling the Nyquist theorem by equidistant sampling.Gradients are usually switched in trapezoidal shapes and readout is performedduring constant gradient strength. Therefore, the data points lie on a Cartesiangrid, allowing straight forward and fast reconstruction with the FFT.
In general, an MRI experiment consists of a sequence of RF- and gradient-pulses,leading to the phrase "pulse sequence" (short sequence). The aim of MRI pulsesequences is spatial encoding and simultaneously creating a good contrast, eitherbetween different tissues or between different functional states of the tissue, suchas activation of the brain. MRI pulse sequences can be categorized into two basicfamilies, the gradient and the spin echo sequences. In this section, basic membersof those families are illustrated for 2D Cartesian k-space sampling. The extensionto 3D encoding is done by phase encoding in the slice direction.
Gradient Echo Sequences
Gradient echo (GE) sequences perform imaging on top of the FID (Section 3.3),as shown in Figure 4. The first part of a GE sequence is the excitation of themagnetization with an arbitrary flip angle α, typically in the range of 0 < α ≤ π/2.Thereafter, Fourier encoding is performed. In the case of Cartesian 2D encoding, k-space is sampled line by line after consecutive excitations. In the frequency encodingdirection, the Nyquist theorem is easily met by sampling at an appropriate rateconsidering the gradient strength. In the phase encoding direction, the Nyquisttheorem (4.6) and the desired resolution (4.9) define the number of k-space linesthat need to be acquired.
30

4.1 gradient encoding
|ωx,y||S|
t
TGE
TR
Gz
tGy
tGx
t
1 2 3
ky
kx
1
2
Figure 4.: A gradient echo pulse sequence is shown which samples k-space lineby line on a Cartesian grid. After slice selective excitation with Gz, thephase along the slice profile is rewinded. Phase encoding is performedby Gy simultaneously to the dephasing in frequency direction Gx. Thecombination of the last two gradients corresponds to traveling to thebeginning of a k-space line (Sector 1). The frequency encoding is per-formed thereafter and corresponds to traveling along this line, while datais acquired (Sector 2). After the time TGE, the gradient moments in the Gx
direction add up to zero, leading to a so-called gradient echo. At the endof the k-space line, the phase encoding is undone, while in the x-directiona so-called spoiler gradient is applied with the purpose of destroyingresidual transversal magnetization (Sector 3). After the time TR, the nextline of k-space is acquired by changing the phase encoding gradient.
31

magnetic resonance imaging
Gradient echo pulse sequences are often separated into so-called balanced andspoiled ones. The sequence shown in Figure 4 applies a gradient spoiler after dataacquisition in order to destroy residual transversal magnetization. Additionally, thephase of consecutive excitation pulses can be changed in a pseudo-random manner.This suppresses the development of a steady state. This scheme, called RF-spoiling,is a key idea of the FLASH (fast low angle shot) sequence first proposed by Haaseet al. (1986). The image contrast is given by the Bloch equation (2.58). It can bemanipulated by changing the repetition time, the flip angle and the echo time TGE,which is defined by
~k(TGE) = 0 (4.16)
assuming that this condition is fulfilled exactly once. In general, a gradient echosequence is weighted by T∗2 since magnetic field inhomogeneities are not refocused.Especially near air-tissue interfaces and metal implants the susceptibility differencesof neighboring tissue leads to significant variations of the Larmor frequency. Thisentails artifacts such as distortions, blurring and signal attenuation depending onthe k-space trajectory.
The so called balanced steady state free precession (bSSFP) sequence exploits asteady state of the entire magnetization vector and has a very high SNR efficiencyin combination with a unique T2/T1-contrast. Unlike in Figure 4, all gradientmoments are balanced (induce no net phase to the magnetization) and the phaseof the RF-pulse is increased by π in consecutive excitations (Carr, 1958). Schefflerand Hennig (2003) showed that this sequence develops a steady state in which themagnetization within a certain range of Larmor frequencies is refocused at TR/2.This is essentially a spin echo formation and the classification as a gradient echosequence is questionable. This property is discussed in Chapter 8 in context of theauthor’s own contributions.
Spin Echo Sequences
The second category comprises spin echo (SE) pulse sequences. They combineHahn’s theory of echo formation (Section 3.4) with spatial encoding. A basic spinecho pulse sequence is sketched in Figure 5.
The contrast of a spin echo image is given by the same laws as in GE imaging,with two major differences arising from the refocusing pulse. As described inSection 3.4, magnetic field inhomogeneities are refocused at THE, eliminating T′2-effects. One usually choses TGE = THE, ensuring the center of k-space to be freeof off-resonance effects. Nevertheless, at t 6= THE, the T′2-decay contributes alsoto the signal equation. This effect is, however, often neglected. The refocusing ofthe magnetization leads to the characteristic robustness of spin echo imaging withrespect to field inhomogeneities.
The contrast of SE images can be manipulated by TR and THE. The flip angleof the excitation pulse plays a minor role for the image contrast. The combinationof excitation and refocusing pulse destroys the longitudinal magnetization instandard SE protocols (compare to Section 3.4.2). In combination with long T1-relaxation times, long repetition times are enforced, making spin echo imaging aslow technique. An efficient way of accelerating SE acquisition is the so-called RARE(rapid acquisition with relaxation enhancement) sequence introduced by Henniget al. (1986). The key idea is to acquire multiple k-space lines after successive
32

4.1 gradient encoding
|ωx,y||S|
t
THE/2
THE
Gz
tGy
tGx
t
1 2 3
ky
kx
1
2
Figure 5.: A spin echo pulse sequence with Cartesian k-space sampling is displayed.In contrast to the gradient echo sequence (Figure 4), the dephaser gradi-ents in frequency and phase encoding direction (Sector 1) have the samesign as their rephaser (Sector 2, 3). They introduce a phase of the magne-tization which is inverted by the refocusing pulse. This corresponds to achange of sign of the k-space position, i.e. a jump in k-space.
refocusing pulses. As shown by Hennig et al. (1986), T2-weighting in RARE-images is dominated by the time the center of k-space is acquired. Especially bigstructures have most energy concentrated in the center of k-space, causing thisbehavior. Smaller structures on the other hand contain a significant amount thehigh frequency components, increasing the contribution of the outer part of k-spaceto the contrast.
4.1.5 Non-Cartesian k-Space Trajectories
With more precise hardware, more computation power and new reconstructionalgorithms, non-Cartesian sampling schemes have become a central topic of researchin the MRI community. Within the limits described in Section 4.1.3, one couldimagine all sorts of trajectories. However, only a few shapes are of practicalrelevance. The most widely used non-Cartesian trajectory, including in clinicalroutine, is the radial one (Lauterbur, 1973) and its modifications like PROPELLER(Pipe, 1999). In research, spiral imaging (Meyer et al., 1992) is getting more andmore popular for its efficiency in terms of k-space coverage per unit of time. Dueto its relevance for this dissertation, the design of 2D spirals is reviewed in thefollowing.
Spiral Imaging
It is most convenient to describe spirals with the polar coordinates of k-space kr
and kϑ. The position in the 2D k-space is described by the complex function
kx,y(t) = kx(t) + iky(t) = kr(t) exp(ikϑ(t)) . (4.17)
33

magnetic resonance imaging
The Nyquist theorem (4.6) in the angular direction kϑ can be easily met by samplingthe data at an appropriate rate along the spiral trajectory. In the radial direction,the Nyquist theorem is given by
dkr
dkϑ=
1FOVr
. (4.18)
Dividing by the differential of time, this is transformed to
kϑ = FOVr kr. (4.18’)
Differentiating Equation (4.17) with respect to time and inserting (4.18’), the complexvalued gradient strength equals
Gx,y =1γ
dkx,y
dt=
exp(ikϑ)
γkr(1 + ikrFOVx,y
). (4.19)
The slew rate is deduced by differentiating the gradient strength with respect totime and applying (4.18’) again:
Gx,y =exp(ikϑ)
γ
(ik2
r
(2FOVr + ikrFOV2
r + kr∂FOVr
∂kr
)+ kr(1 + ikrFOVr)
). (4.20)
The partial derivative of FOVr with respect to kr is chosen to be non-zero, if theNyquist theorem is violated deliberately for acceleration of the imaging processin combination with more advanced reconstruction techniques. So-called variabledensity spirals were first proposed by Spielman et al. (1995). A nice description canalso be found in (Glover, 1999). In the context of the subject of this dissertation ithas been published in (Assländer et al., 2013).
Taking the absolute value of Equation (4.19) and (4.20), the dependency on kϑ
is dropped. Setting the gradient strength and slew rate to hardware limits, theresulting differential equations are solved iteratively for kr and kr, respectively. Thesolution with the smaller |kr| fulfills both hardware limits. The Nyquist theorem(4.18’) defines kϑ. After integration over time the entire spiral is defined.
In the mathematical description, a single-shot spiral was assumed. For betterimaging quality, one can choose a fraction of FOVr for calculating the spiral andfill the k-space after successive excitations with rotated spirals. Figure 6 sketches amulti-shot 2D spiral sequence. Comparing spiral imaging to the Cartesian scheme(Figure 4), one could refer to the direction along the spiral as the frequency encodingdirection. Phase encoding then corresponds to rotating the spiral. Since thosedirections are not directions of the Fourier transformation, the artifact behavior israther complex (see Chapter 7).
4.2 iterative image reconstruction
The field of MR image reconstruction offers a huge variety of methods. Some ofthem require a specific data acquisition scheme. For example, if data is sampledon a Cartesian grid and fulfills the Nyquist theorem, it can be reconstructed by amultidimensional FFT. It becomes more complex when leaving the Cartesian grid(see Figure 6). At the first glance, the Fourier image reconstruction Equation (4.8)has no implications on the sampling scheme. Evaluating this discrete Fourier
34

4.2 iterative image reconstruction
|ωx,y||S|
t
TGE
TR
Gz
tGy
tGx
t
ky
kx
Figure 6.: A gradient echo sequence with a spiral readout is shown together withthe corresponding k-space. The trajectory was designed with the out-lined algorithm. In this particular case the spiral is acquired center-out,leading to a minimal echo time. After the data acquisition is finished, thetrajectory returns into center of k-space for steady state reasons. By apply-ing the gradient shape in reverse order, an outside-in spiral is acquired,where the echo time would be at the end of the trajectory. Gradient- andRF-spoiling can be further incorporated (not shown here).
transformation directly has a computational complexity2 of O(N2) which makes itimpractical. The FFT has a complexity of O(N log N) and is the method of choicefor most MR image reconstructions. However, it requires the data points to lie on arectilinear grid. A widespread method to fulfill this requirement for non-Cartesiank-space trajectories is convolution gridding (Jackson et al., 1991). It allows theapplication of the FFT thereafter.
Another issue still being addressed by current research is the reconstruction ofdata that violates the Nyquist constraint. Especially for speeding up the acquisitionprocess, those reconstruction techniques are essential in modern MRI. The mostwidespread method dealing with that issue is sensitivity encoding. Using multiplereceive coils, their spatially varying sensitivity can be used for spatial encoding.The zoo of reconstruction techniques for so-called parallel imaging is huge. Itcan be divided into methods that fill missing lines in k-space, such as SMASH(simultaneous acquisition of spatial harmonics) (Sodickson and Manning, 1997),GRAPPA (generalized autocalibrating partially parallel acquisitions) (Griswold et al.,2002) and SPIRiT (Iterative self-consistent parallel imaging reconstruction fromarbitrary k-space) (Lustig and Pauly, 2010), and methods that undo the fold-overartifact in image space. The latter concept is called SENSE (sensitivity encoding)and was proposed by Pruessmann et al. (1999). It is used in this dissertation in amodified version. The k-space based methods are not discussed any further.
Another method to cope with sub-Nyquist data has recently arisen under thename of compressed sensing (Lustig et al., 2007). Instead of coil sensitivities, it uses
2 The computational complexity describes how fast the number of computations increases with the sizeof the problem. Of course, this does not imply that at a given problem size an algorithm with a lowercomplexity is faster. However, if the problem is big enough, an algorithm with a lower complexity isalways faster.
35

magnetic resonance imaging
a priori information in order to deal with undersampling artifacts. The key idea isthat MR images can be represented in some space, where only a few coefficientssignificantly contribute to the image. This concept is very similar to the JPEG 2000compression. Popular sparsifying3 spaces are the wavelet (Lustig et al., 2007)and the total variation (TV) domain (Block et al., 2007). In compressed sensing,undersampling artifacts must be incoherent in order to make them distinguishablefrom the object. This requirement can be fulfilled by choosing random phaseencoding steps in Cartesian sampling. Many non-Cartesian trajectories intrinsicallyfulfill this requirement sufficiently such that no randomizing of the sampling schemeis necessary. There are various possibilities to implement compressed sensing. Inthis thesis, compressed sensing is implemented by `1-norm regularization (seeEquation 4.7).
In the following, iterative reconstruction techniques are shortly reviewed withthe emphasis on the way they are used in this dissertation. This general frameworkallows the incorporation of sensitivity encoding, compressed sensing, off-resonancecorrection etc. in a straight forward manner.
4.2.1 The Forward Problem
This section addresses the issue of describing the imaging process accurately andin a way that is computationally efficient. Employing the concept of k-space (4.3’)to Equation (3.8’), the signal of the coil c can be expressed as
Sc(t) ∝∫
samplem⊥(~r, 0) · Bc(~r) · exp
(−i~k(t) ·~r + iωor(~r)t−
tT2(~r)
)d3r. (4.21)
The transversal magnetization created by the excitation pulse is represented bym⊥(~r, 0), including T1-relaxation effects in the case of a steady-state experiment.Bc(~r) is the spatially dependent coil sensitivity. The argument of the exponentialfunction is separated into two parts: the k-space trajectory created by imaginggradients and the Larmor frequency in the absence of imaging gradients ωor(~r),which varies over space due to magnet imperfections and susceptibility effects.Generally, T2 varies over space as well.
For numerical calculations, the signal equations need to be modeled in a discretemanner:
Sc[t] ∝∼∑n
M⊥[~rn] · Bc[~rn] · exp(−i~k[t] ·~rn + iωor[~rn]t−
tT∗2 [~rn]
). (4.22)
Thereby the square brackets indicate the discreteness of the argument. The sum-mation is performed over all discrete areas of the sample which correspond tothe voxels in the reconstructed image. In the following the phrase voxel is alsoused to describe the discrete areas of the object. The mean off-resonance of a voxelis denoted by ωor[~rn]. The variation of the Larmor frequency within the voxel isassumed to be Cauchy-distributed (Equation 2.55) and are taken into account by theT∗2 -decay. Similar to Equation (3.2), the magnetization of a specific voxel is definedby
M⊥[~rn] =∫
voxel nm⊥(~r, 0) d3r. (4.23)
3 Sparse means that most coefficients are negligible.
36

4.2 iterative image reconstruction
Since the whole measurement process is linear with respect to M⊥[~rn], it is expressedin matrix form:
~S ∝∼ E · ~M⊥. (4.24)
The vector ~S includes the signal of all coils at all measured time points. The matrixE describes the measurement process. The sensitivity of the receive coils and thephase evolution along time are described in the columns and the positions in space~rn correspond to the rows. The matrix vector multiplication is equivalent to the sumin Equation (4.22). The vector ~M⊥ consist of the magnetization of all voxels. Thislinear equation forms the basis of most iterative image reconstruction algorithms.
Non-Uniform Fast Fourier Transformation
Equation (4.24) reveals that image reconstruction can be traced back to linear algebra.However, explicitly evaluating this matrix vector multiplication is computationallyinefficient. Again, the method of choice is the FFT, which requires the data to lieon a rectilinear grid. It is common and suggested by standard display devices tochoose the voxel to lie on a Cartesian grid, but the k-space data is often chosen tobe non-Cartesian (see Section 4.1.5). For arbitrary k-space data, the measurementprocess is implemented as an operator that first performs an FFT and grids thedata onto the trajectory thereafter. This procedure is widely known as the non-uniform fast Fourier transformation (nuFFT). Off-resonance and relaxation effectsare thereby neglected. The gridding process used in this thesis is the min-maxapproach suggested by Fessler and Sutton (2003). In one dimension, the signal isapproximated by
S′[kq] ∝∼J−1
∑j=0
uj
N−1
∑n=0
exp(−ik jxn
)· s(xn) · M⊥(xn) ∀q ∈ 0, . . . , Q− 1. (4.25)
Thereby, s(xn) is some unknown factor that scales the original image. The innersum is evaluated by the FFT in O(N log N). The outer sum convolves the Cartesiandata onto non-Cartesian points. Including all points of the Cartesian grid (J=N),it can be shown that a periodic sinc is the perfect solution for the weights uj.However, given the length of the trajectory Q, the complexity of this process isO(JQ), bringing the computational advantage to naught. Therefore, one usuallychooses a small neighborhood J N for the convolution, reducing the complexityof the nuFFT to that of the FFT.
The optimal solution in the min-max sense is given by comparing the result tothe discrete Fourier transformation (4.22):
minsn
maxkq
minuj
maxM⊥,n
∣∣S[kq]− S′[kq]∣∣ . (4.26)
This equation minimizes the maximal error of the gridding. Given some scalingfunction, the optimal weights are found algebraically. For finding the optimalscaling factors, no algebraic solution is known. Fessler and Sutton (2003) assumea Fourier series of low order for the scaling and perform brute force numericaloptimization.
For further artifact reduction, Fessler and Sutton (2003) suggested to oversamplethe FFT. The design parameters for the interpolation are therefore the amount of
37

magnetic resonance imaging
oversampling and the number of neighbors J taken into account for the convolution.The choice of these parameters is a trade-off between accuracy and computationalefficiency. Scaling factors and interpolation weights are thereafter given by themin-max approach.
Fessler and Sutton (2003) showed that a Kaiser-Bessel interpolation kernel withoptimized scaling is nearly optimal. For simplicity, this approach is used throughoutthis thesis.
The extension of this approach to multiple dimensions is straight forward andnot discussed any further. Coil sensitivities are incorporated by multiplying themagnetization with the coil sensitivities and then performing the nuFFT for eachcoil.
Off-Resonance Correction
As mentioned above, off-resonance effects are neglected by the nuFFT-operator. Anefficient way to incorporate them is the time segmented approach suggested byNoll et al. (1991). The basic idea is to evaluate the nuFFT for certain time points τp:
Sc,p[t] ∝∼∑n
M⊥[~rn] · Bc[~rn] · exp(−i~k[t] ·~rn + iωor[~rn]τp
)∀p ∈ 0, . . . , P− 1.
(4.27)Thereafter interpolation is done between the supporting points. Sutton et al. (2003)suggested to use the min-max approach here as well. In this dissertation, Kaiser-Bessel interpolation is used instead. It has the advantage of most coefficients beingzero and, therefore, reducing the computational complexity.
In the literature it has also been suggested to segment the off-resonance correctionin the frequency rather than in the time domain (Noll et al., 1991). The segmentationapproach was also generalized by Fessler et al. (2005). However, they also foundthat time segmentation is a good compromise between simplicity, computationalefficiency and accuracy.
T∗2 -decay could be incorporated in the same manner. This topic is not followedup any further, since it is not required in the scope of this thesis.
4.2.2 The Inverse Problem
The measurement process was previously described by the simple linear Equa-tion (4.24). Image reconstruction is done by simulating the expected signal froma test image and minimizing the error when comparing it to the measured signal.Formulating the definition of the `p-norm in Equation (4.7) in a discrete manner, itreads
∥∥∥~I∥∥∥
p≡(
∑n
∣∣∣~In
∣∣∣p)1/p
. (4.28)
If the forward operator is well-conditioned, an image ~I is given by minimizing the`2-norm
~I = argmin~I′
12
∥∥∥~S− E~I′∥∥∥
2
2. (4.29)
38

4.2 iterative image reconstruction
An optimal solution to this problem is provided by the Moore-Penrose pseudoin-verse
~I =(
E†E)−1
E†~S. (4.30)
For solving Equation (4.29) or (4.30), several iterative algorithms are known. Inthis dissertation, the method of conjugate gradients (Hestenes and Stiefel, 1952) isused, which is an efficient gradient descent algorithm. It successively applies theforward operator and its adjoint to the search vector and compares the result tothe measured signal. Therefore, no inverse gridding (non-Cartesian to Cartesiangrid) is needed, avoiding the problem of density correction, which is described in(Jackson et al., 1991).
Tikhonov Regularization
If the forward operator is ill-conditioned, there is an infinite number of solutions.As a result, the optimization process does not converge. This is for instance thecase, if the Nyquist theorem is violated and no or not sufficient parallel imaging isapplied. One solution for this problem was suggested by Tikhonov (1963). Similarto the zero-padding discussed in Section 4.1.2, the cost function
~I = argmin~I′
12
∥∥∥~S− E~I′∥∥∥
2
2+ λ2
∥∥∥~I′∥∥∥
2
2(4.31)
results in an image with minimal energy. The regularization parameter λ ∈ R
trades off the measurement residual ‖~S− E~I′‖22 against the signal intensity in the
`2-norm ‖~I′‖22 and can be chosen freely (see Chapter 7).
The big advantage of Tikhonov regularization is its linearity. Hence, the standardconjugate gradient method and its rich theoretical background about convergenceapply. Its disadvantage is that solutions with strongly varying signal intensity arepenalized by minimizing the energy. This corresponds to blurring in the image.
`1-Norm Regularization
In order to overcome the problem of blurring in regularized reconstructions, the `1-norm can be applied, which is known to be edge preserving. The method describedin the following is a popular way of implementing compressed sensing, whichhas been known to the signal processing community for decades (Claerbout andMuir, 1973). Their mathematical limits were explored by Donoho and Logan (1992)and the method was brought to the field of MRI by Lustig et al. (2007). As statedbefore, the basic idea of compressed sensing is to transform the image into somespace where most coefficients of the image are negligible and identify the solutionof Equation (4.29) with the least non-zero coefficients. The norm describing thenumber of non-zero elements is the `0-norm, which does not behave very well andis, strictly speaking, not even a norm. Luckily, Donoho (2006) showed that for mostundetermined systems, the solution with the minimal `1-norm is also the sparsestsolution (least non-zero elements). Therefore, sparseness is enforced by the costfunction
~I = argmin~I′
12
∥∥∥~S− E~I′∥∥∥
2
2+ λ2
∥∥∥∇(~I′)∥∥∥
1, (4.32)
39

magnetic resonance imaging
where ∇ is the finite difference operator. In the context of MRI, Rudin et al. (1992)initially proposed the so-called total variation penalty for noise removal. In thecontext of reconstructing undersampled data, it was introduced by Block et al. (2007).Of course other sparsifying transformations such as the wavelet transformationcould be used instead.
Unfortunately, this cost function is no longer linear. Therefore, the non-linearconjugate gradient method (Fletcher and Reeves, 1964) is used for minimization.
4.3 signal to noise ratio
The signal to noise ratio (SNR) is an important metric for assessing the quality ofMR images. Under the assumption of Gaussian noise, it is given by
SNR[~rn] =I[~rn]
σnoise[~rn]. (4.33)
Spatial variations of the SNR are introduced by spatially varying signal in the imageI[~rn]. The standard deviation of the noise σnoise is constant over space in standardFourier encoding. However, as shown by Pruessmann et al. (1999), parallel imagingintroduces spatial variations of the noise as well.
The SNR of MR images is influenced by many factors, such as field strength,repetition time, echo time, relaxation parameter, imaging scheme etc. Therefore,absolute numbers of the SNR are rather meaningless and usually the effect ofsingle parameters are analyzed by comparing images with only a single parameterchanged.
4.4 functional mri
The goal of fMRI is to map the brain functionality. During brain activation, T∗2 - orT2-weighted images are acquired continuously. The time series of each voxel is thenanalyzed in post processing.
4.4.1 Physical and Physiological Background
The physical background of fMRI is the different magnetic behavior of hemoglobinin the oxygenated and deoxygenated state. As first reported by Pauling and Coryell(1936), deoxyhemoglobin has four unpaired electrons, making it paramagnetic. Inoxyhemoglobin, on the other hand, the bonds of iron are covalent, resulting in a dia-magnetic behavior similar to the surrounding brain tissue. Thus, the concentrationof deoxyhemoglobin changes the local Larmor frequency and ultimately the signal.This effect is used to measure the so-called blood oxygen-level dependent (BOLD)contrast, which is an indirect method to measure neuronal activity. In vivo it wasfirst shown by Ogawa et al. (1990). The first human experiments were performedby Belliveau et al. (1991). Another milestone of fMRI is the work by Logothetis et al.(2001), which demonstrates a strong correlation of the BOLD contrast and neuronalactivity.
Different groups analyzed the effect of the nature of the BOLD effect: Kennanet al. (1994) demonstrated the dependency of the relaxation rate as a function of
40

4.4 functional mri
the diffusive correlation time. In the case of slow diffusion, a spin echo refocusesthe dephasing. However, if the diffusion is relatively fast, each spin experiencesa random magnetic field and the signal cannot be recovered by a spin echo (seeSection 2.4). Changes in the blood oxygenation is expected to affect both, T2-and T′2-decay, depending on the diffusive correlation time. Weisskoff et al. (1994)reported a maximum BOLD effect on T2, if the vessels are at the size of the averagediffusion distance during the time THE. This is approximately 2-7 µm, which is thesize of capillaries. For larger vessels, they found a smaller effect on T2. In case ofGE imaging, this is overcompensated by an increase in the BOLD effect on T′2 withan increased vessel size. Overall, gradient echo imaging shows higher sensitivity toBOLD, since it is sensitive to both, T2- and T′2-effects, but it is dominated by the largevessel signal (Weisskoff et al., 1994). Small capillaries are expected to show betterspatial correlation to the brain activity than big veins. Therefore, spin echo BOLDis expected to show more specificity. Those findings were experimentally validatedby Bandettini et al. (1994). Gati et al. (1997) demonstrated a linear dependency ofthe BOLD contrast of big veins with respect to the magnetic field strength, whilethe BOLD contrast of small vessels scales quadratically with the field strength.Consequently, higher field strength like 7 T or even 9.4 T show more specificity ofthe BOLD signal and allow spin echo fMRI with sufficient sensitivity. Generally,gradient vs. spin echo fMRI is a trade-off between sensitivity and specificity.
HRF
05 10 15 20 25 t[s]
Figure 7.: The hemodynamic response function (HRF) following a short stimulus att=0 was calculated with the SPM8 software package (http://www.fil.ion.ucl.ac.uk/spm). This HRF model neglects the initial dip. The exactshape of the HRF varies between subjects and regions of the brain. Here,the signal intensity at rest was set to zero. The peak value of the HRFvaries strongly with numerous parameters. It is of the order of singlepercentages of the baseline signal.
The physiological response to a stimulation of the brain is rather complicated.Active neurons consume oxygen, leading to an increased concentration of deoxyhe-moglobin in venous blood. This reduces T2 and T′2 in and around the veins and,thus, reduces the signal intensity (absolute value). This so-called initial dip is rathersmall and often neglected. After a few seconds delay, the body responds to neuronalactivity by increasing the cerebral blood flow and the cerebral blood volume. Asan overall effect, the concentration of deoxyhemoglobin decreases compared to thebaseline, resulting in an increase of signal intensity (see Figure 7). Shortly after theend of the stimulus, the signal drops below the baseline. The origin of the so-calledpost stimulus undershoot is not completely revealed yet (Frahm et al., 2008). A
41

magnetic resonance imaging
good introduction into modeling the hemodynamic response function (HRF) isgiven by Buxton et al. (2004).
Figure 7 shows the HRF for a short stimulus. However, one often stimulates thebrain for a longer period of time. Assuming linear behavior, the BOLD responseof a long stimulus is given by the convolution of the HRF with the stimulationfunction as demonstrated in Figure 8.
HRF
020 t[s]
⊗
Stim.
020 40 60 80 t[s]
=
BOLD
020 40 60 80 t[s]
Figure 8.: The BOLD response is given by convolution of the HRF with the stimu-lation function. A block design is shown here, where three stimulationsstarting after 7 s last for 15 s each with 15 s rest in between.
4.4.2 General Linear Model
For analyzing event-related fMRI data, the general linear model (GLM) is com-monly incorporated. The assumption thereby is a linear relationship between allsimultaneously ongoing processes and the observed signal. One usually modelsthe time series of a voxel to consist of the baseline signal, the BOLD response(see Figure 8) and some low order polynomials in order to describe slow scannerdrifts. For paradigms with multiple stimuli, multiple BOLD responses can beincorporated. Those components are described by the design matrix X. For eachvoxel, the absolute value of the time series ~I[~rn] ∈ CNt , containing Nt data points, isdescribed by ∣∣∣~I[~rn]
∣∣∣ = X · ~β +~ε. (4.34)
The vector ~β describes the parameters of the GLM fit and ~ε is the residual signalnot explained by the model and is assumed to be Gaussian distributed. If X hasfull rank, the best fit parameter in the least square sense is determined with theMoore-Penrose pseudoinverse:
~β =(
XTX)−1
XT∣∣∣~I[~rn]
∣∣∣ . (4.35)
The residual signal is given by
~ε =∣∣∣~I[~rn]
∣∣∣− X~β. (4.36)
After the GLM fit, the Student’s t-test is used to calculate the likelihood of brainactivity. The t-value is given by
t ≡ ~cT~β√~εT~ε
N−rankX~cT(XTX)−1~c
, (4.37)
42

4.4 functional mri
where ~c denotes the so-called contrast vector and has the same length as ~β. It isone at the position of the BOLD response under consideration and zero elsewhere.N ∈ N describes the length of the time series. Given the t-distribution, the nullhypothesis (voxel not being activated) is tested. The level of significance is usuallyset to 0.001 for rejecting the null hypothesis and assuming the voxel to be activated.
The Student’s t-test requires a Gaussian distribution of ~ε. However, this isnot generally valid in fMRI experiments, since physiologically induced signalfluctuations possess sharp peaks at certain frequencies (see Section 4.4.3 and 7.2).Furthermore, the noise is correlated along the temporal dimension. Solutions todeal with the autocorrelation have been proposed by Friston et al. (1994, 1995).
As discussed in Section 4.1.2, the PSF is finite and induces correlations betweenthe time series of multiple voxels. Thus, a voxel that is falsely assumed to be active(false positive) can entail other false positives. This questions the meaning of thechosen level of significance when analyzing multiple voxels. A better solution is todefine the so-called familywise error rate which is the probability of finding one ormore false positives. For correlated observables (voxels), a threshold for the t-valuescan be found using the random field theory (Adler and Hasofer, 1976). Throughoutthis thesis, the threshold is calculated by using a familywise error rate of 0.05.
4.4.3 Physiological "Noise"
As stated before, the vector ~ε does not only contain thermal (white) noise, but alsosignal fluctuations caused by physiology. The two main sources are respiration andcardiac motion. The respiratory signal is usually in the range of 0.2-0.5 Hz. Thecardiac signal has its main peak at 1 Hz, but also has major contributions at itshigher harmonics. These signal fluctuations are too fast to be covered by standardEPI based fMRI, which has a repetition time of 2-3 s for whole brain imaging. Inthe frequency domain, the cardiac signal folds onto the lower frequencies and isno longer distinguishable from other components. In order to allow modeling ofphysiologically induced signal fluctuations, it is therefore essential to acquire fMRIdata at a higher temporal frequency.
Assuming the temporal fluctuations to be Gaussian distributed, they can bequantified by the temporal SNR (tSNR) which is defined for each voxel by the meansignal intensity divided by the standard deviation along the time axis. In literature,the phrase "physiological noise" got established for describing all temporal signalfluctuations that are not described by the GLM. Please note that the physiological"noise" is strongly correlated both in the spatial and temporal directions and theGaussian distribution is assumptive.
43


5S TAT E O F T H E A RT A N D O W N C O N T R I B U T I O N S
5.1 related work
5.1.1 Accelerated fMRI
Nowadays, the most widely used technique in fMRI is multi-slice EPI (Mansfield,1977), which has a temporal resolution of approximately 2-3 s for full brain imaging.Many attempts have been made for accelerating fMRI data acquisition. Promisingresults were achieved by exciting multiple slices simultaneously (Feinberg et al.,2010). The signal of the simultaneously excited slices is separated by the use ofcoil sensitivities. Setsompop et al. (2012) extended this technique by adding somegradient encoding in order to achieve a better separation of the slices, incorporatingthe basic idea of CAIPIRINHA (controlled aliasing in parallel imaging results inhigher acceleration) (Breuer et al., 2005). This approach was implemented withnon-Cartesian trajectories by Zahneisen et al. (2014). Posse et al. (2012) suggestedto use multi-slab echo volume imaging (EVI) (Mansfield et al., 1989) for fast fMRI.The most radical approach to just acquire a single point of k-space and do spatialencoding purely with coil sensitivities was suggested by Hennig et al. (2007) underthe name "magnetic resonance encephalography" (MREG). The name adverts toelectroencephalography (EEG), which has a very similar concept of spatial encoding.Simultaneously, inverse imaging was proposed by Lin et al. (2006), which, in itsoriginal implementation, encodes two dimensions of k-space with gradients onlywhile encoding the third dimension purely by coil sensitivities, similar to MREG.
With the initial - rather extreme - version of MREG as a starting point, Grotz et al.(2009), Hugger et al. (2011) and Zahneisen et al. (2011, 2012) found a repetitiontime of approximately 100 ms to be sufficient to cover the most significant physio-logical signal fluctuations (see Section 4.4.3). Hence, MREG was converted into amore conservative method by reintroducing some gradient encoding to it. Today,the phrase MREG stands for non-Cartesian, single shot 3D gradient encoding incombination with sensitivity encoding and regularized image reconstruction. Sincethe whole volume is encoded after one excitation, a single RF- and gradient-schemeis repeated. This entails the advantage of a more steady state of the magnetizationand the hardware, promising less signal fluctuations and a higher tSNR.
The first single shot 3D trajectories used for MREG were rosettes (Zahneisenet al., 2011), which acquire a full brain dataset within 23 ms. Their disadvantage isa very non-uniform sampling with multiple intersections of the trajectory in thecenter of k-space. This leads to a high sensitivity to magnetic field inhomogeneitiesand, hence, to signal attenuation in the resulting image. In this regard, significantimprovements were achieved by using concentric shells trajectories (Zahneisenet al., 2012) which avoid intersections. In this trajectory, outer shells first samplethe k-space periphery. The center of k-space is acquired at the - to some extentfreely selectable - echo time followed by inside-out sampling. The sampling densitycan be chosen rather freely. The more benign off-resonance behavior of concentric
45

state of the art and own contributions
shells allows data acquisition for approximately 60 ms. Altogether, concentric shellsacquire images with higher spatial resolution.
Regularized image reconstruction for highly undersampled 3D-fMRI was firstsuggested by Lin et al. (2006). For non-Cartesian 3D single shot trajectories, it wasintroduced by Zahneisen et al. (2011). Non-linear reconstructions was brought tothe field of fast fMRI by Hugger et al. (2011).
5.1.2 RF-Pulse Design for Spin Echo fMRI
In order to allow for spin echo MREG, pulses for spin echo formation are discussed.The concept of combining excitation and refocusing into one single pulse was firstsuggested by Ngo and Morris (1987) and Wu et al. (1991), who referred to those asprefocused and delayed-focus pulses, respectively. Such pulses are characterizedby an - over some target frequency band - approximately constant flip angle and alinear phase slope with a negative gradient with respect to the Larmor frequency.This concept has been adopted in many publications, such as (Rourke et al., 1993;Starcuk, 1993; Topp et al., 1993; Balchandani et al., 2009; Gershenzon et al., 2008).They all have a flip angle of π/2 in common. Delayed-focus pulses with low flipangles, which are therefore suitable for low repetition times, have been proposedby Lim et al. (1994) and Shen (2001), whereat Lim et al. (1994) combined a (π − α)-and a π-pulse into a single RF-pulse using the Shinnar-Le Roux Algorithm (Paulyet al., 1991) and (Shen, 2001) used simulated annealing in order to calculate thepulse profile.
In all presented publications, the pulse length is considerably larger than thetime between the end of the pulse and the spin echo formation. Using optimalcontrol (Pontryagin, 1962; Conolly et al., 1986), Gershenzon et al. (2008) analyzed thepossibilities of delayed-focus pulses with a flip angle of π/2. They found reasonablepulse performance for echo times (measured from the end of the pulse) less thanthe pulse length. For larger echo times, the algorithm gives no meaningful results.The performance drop-off is comparable to the one expected by a π/2-π-pulsesequences.
5.2 summary of own contributions
The purpose of this thesis is to investigate the influence of spatial variations of theLarmor frequency on the resulting image and to optimize the MREG sequence inthat regard.
Off-resonance effects can roughly be separated into macro- and microscopicvariations. While macroscopic field inhomogeneities lead to undesired effectslike distortions, blurring and signal attenuation, microscopic ones contribute tothe desired BOLD contrast (Section 4.4). In Chapter 6, frequency variations areclassified based on a Taylor expansion with respect to the spatial position of themagnetization. It is shown how zeroth order effects can be incorporated into thereconstruction (see Section 4.2.1).
First-order effects on the other hand can be described as a distortion of the k-spacetrajectory. For that matter the concept of local k-space is described in Section 6.1.In Chapter 7, this framework is applied to MREG, allowing for optimization of
46

5.2 summary of own contributions
trajectories in that regard. A single shot spherical stack of spirals trajectory isproposed, which combines fast sampling speed, as inherent to non-Cartesiantrajectories, with benign off-resonance behavior similar to EPI.
In Section 6.1, higher order polynomials are described by the T′2-decay. Thosepolynomials contain undesired variations originating from macroscopic susceptibil-ity differences, but they also contain parts of the BOLD contrast. The possibility ofmanipulating the T′2-decay with excitation pulses is discussed in Chapter 8 alongwith the potentials arising therefrom. The approach of delayed-focus pulses isadopted and the boundaries of those pulses are discussed for small flip angles. It isshown that the echo time, measured from the end of the pulse, can be larger thanthe length of the pulse for small flip angles. To the best of my knowledge, this isnew to the field of MR. A theoretical limit for the echo time is derived and verifiedby simulations. Pulse shapes were calculated with an optimal control algorithm.However, reasonable pulse performance was found only in the regime of weakdephasing, providing insufficiently long echo times for appreciable reduction ofoff-resonance effects in MREG. Potential applications of the proposed RF-pulses aredemonstrated in the example of imaging the lung and the head.
47


6O F F - R E S O N A N C E E F F E C T S I N F M R I
In this chapter, spatial variations of the Larmor frequency are described with theintention to separate effects depending on how they can be accessed in MR exper-iments. This motivates methods that partially deal with cumbersome frequencyvariations, which are covered in the subsequent two chapters.
6.1 classification of frequency variations
Generalizing Equation (4.5), the complex valued signal of one voxel is given bythe sum over all acquired data, weighted by some reconstruction term Ft,c[~rn]. Thelatter term depends on the time of data acquisition t, the receive coil c and thespatial position~rn:
I[~rn] ∝ ∑t,c
Ft,c[~rn]∫
samplem⊥(~r, 0)Bc(~r) · exp
(−i~k[t] ·~r + iωor(~r)t−
tT2(~r)
)d3r.
(6.1)This equation holds true for all linear reconstructions, even though Ft,c[~rn] is oftennot explicitly known. The equation describes the transformation from a continuousmagnetization density to a discrete signal, which is thereafter transformed intoa discrete image. The coil sensitivities Bc(~r) and the trajectory ~k[t] can therebybe designed within the laws of physics. In general, the Larmor frequency can bemanipulated by adding magnetic fields, which may also depend on the spatialposition. So-called shimming adds spatially varying magnetic fields in order toreduce frequency variations. In a standard human MRI scanner, shim fields arepolynomials up to second order. Please note that more advanced shimming coilshave been proposed e.g. by Juchem et al. (2010). Independent of the approach,shimming works only to a certain degree. The remaining off-resonance ωor(~r) isthe subject of this dissertation.
Given the vectors~r = (x, y, z)T and~rn = (xn, yn, zn)T, a 3D Taylor expansion isapplied to the off-resonance frequency ωor(~r) in Equation (6.1):
I[~rn] ∝ ∑t,c
Ft,c[~rn]∫
samplem⊥(~r, 0)Bc(~r) exp
(− i~k[t] ·~r
+ it∞
∑a=0
∞
∑b=0
∞
∑d=0
1a!b!d!
∂a+b+dωor[xn, yn, zn]
∂xa ∂yb ∂zd (x− xn)a(y− yn)
b(z− zn)d
− tT2(~r)
)dx dy dz.
(6.2)
The expression
1a!b!d!
∂a+b+dωor[xn, yn, zn]
∂xa ∂yb ∂zd (x− xn)a(y− yn)
b(z− zn)d
49

off-resonance effects in fmri
is given for the four lowest order polynomials by
(a, b, d) = (0, 0, 0) : ωor[xn, yn, zn]
(a, b, d) = (1, 0, 0) :∂ωor[xn, yn, zn]
∂xn(x− xn)
(a, b, d) = (0, 1, 0) :∂ωor[xn, yn, zn]
∂yn(y− yn)
(a, b, d) = (0, 0, 1) :∂ωor[xn, yn, zn]
∂zn(z− zn).
The sum of those four polynomials can be formulated as
ωor[~rn] + ~∇ωor[~rn] ·(~r−~rn) .
Extracting this term in Equation (6.2) and reorganizing the residual sum results in
I[~rn] ∝ ∑t,c
Ft,c[~rn] exp(
it(
ωor[~rn]− ~∇ωor[~rn] ·~rn
))
·∫
samplem⊥(~r, 0)Bc(~r) exp
(i(~∇ωor[~rn]t−~k[t]
)·~r
+ it∞
∑A=2
A
∑b=0
A−b
∑d=0
1(A−b−d)!b!d!
∂Aωor[xn, yn, zn]
∂xA−b−d ∂yb ∂zd
· (x− xn)A−b−d(y− yn)
b(z− zn)d − t
T2(~r)
)dx dy dz.
(6.2’)
This Taylor expansion discriminates the spatially constant and linear terms from thehigher orders, which are expressed by the residual sum. Those terms are accessiblein different ways during MRI experiments, which is discussed in the following.
6.1.1 Constant Term - Off-Resonance Correction
The zeroth order and parts of the first order polynomials are merged into theexpression exp(it(ωor[~rn]− ~∇ωor[~rn] ·~rn)), which does not depend on~r and can beabsorbed into a modified Forc
t,c [~rn]:
I[~rn] ∝ ∑t,c
Forct,c [~rn]
∫
samplem⊥(~r, 0)Bc(~r) exp
(i(~∇ωor[~rn]t−~k[t]
)·~r
+ it∞
∑A=2
A
∑b=0
A−b
∑d=0
1(A−b−d)!b!d!
∂Aωor[xn, yn, zn]
∂xA−b−d ∂yb ∂zd
· (x− xn)A−b−d(y− yn)
b(z− zn)d − t
T2(~r)
)dx dy dz.
(6.3)
The variable Forct,c [~rn] describes a reconstruction which addresses the absorbed term
by an appropriate off-resonance correction (see Section 4.2.1).
50

6.1 classification of frequency variations
6.1.2 Linear Terms - Local k-Space
The other part of the first-order polynomials is additive to the k-space trajectoryand is described as a trajectory deformation. However, these polynomials dependon the spatial position. Thus, also the deformed k-space trajectory depends on thespatial position. This entails the term "local k-space". The trajectory in local k-spaceis defined by
~klocal[~rn, t] ≡~k[t]− ~∇ωor[~rn]t. (6.4)
It would be more accurate to incorporate the phase variations of m⊥(~r, 0) andBc(~r) as well. However, they are neglected for the purpose of analyzing frequencyvariations. Incorporating the definition of local k-space, the signal of one voxel isgiven by
I[~rn] ∝ ∑t,c
Forct,c [~rn]
∫
samplem⊥(~r, 0)Bc(~r) exp
(− i~klocal[~rn, t] ·~r
+ it∞
∑A=2
A
∑b=0
A−b
∑d=0
1(A−b−d)!b!d!
∂Aωor[xn, yn, zn]
∂xA−b−d ∂yb ∂zd
· (x− xn)A−b−d(y− yn)
b(z− zn)d − t
T2(~r)
)dx dy dz.
(6.5)
For gradient echo imaging, the echo time was introduced in Section 4.1.4 as thetime the gradient moments sum up to zero. When taking frequency variations intoaccount, one can define the effective echo time by
~klocal[~rn, TEeff] = 0. (6.6)
If all gradient moments sum up to zero, the magnetization at~rn is in phase with itsdirect surrounding. Thus, for this infinitesimally small area, a spin echo is formedat TEeff. But if the effective echo time varies over space, no global spin echo isformed at any time.
Some trajectories may not fulfill the condition (6.6) e.g. due to distortions. Amore practical definition of the effective echo time is
TEeff[~rn] = argmint
~klocal[~rn, t]. (6.7)
Trajectory optimization with respect to local k-space is the subject of Chapter 7.Please note that similar concepts of describing first-order off-resonance variationshave been introduced by Noll (2002), Deichmann et al. (2002) and Yang et al. (2002).In the context of PatLoc, local k-space was introduced by Gallichan et al. (2011).
6.1.3 Higher Orders - T′2-Decay
The effect of higher order magnetic field variations is not apparent. As discussedin Section 2.4.3, the signal behavior highly depends on the distribution of themagnetization density as a function of the Larmor frequency. In Equation (6.5), themagnetization density is given as a function of space, weighted by many effectsand integrated over the entire sample. The combination of the weighting factors
51

off-resonance effects in fmri
corresponds to the point spread function (see Section 4.1.2). Nevertheless, themagnetization density of each voxel is usually assumed to be Cauchy distributedwith respect to the Larmor frequency. For macroscopic effects in combination withan imaging experiment, this assumption is rarely justified. Taking only higherorder polynomials into account, an exponential decay yields a more accurateapproximation for each voxel:
I[~rn] ∝∼∑t,c
Forct,c [~rn]
∫
samplem⊥(~r, 0)Bc(~r) exp
(−i~klocal[~rn, t] ·~r− t
T′2[~rn]− t
T2(~r)
)d3r.
(6.8)As demonstrated by Hennig et al. (1986), image contrast is mainly determined bythe time the center of k-space is acquired. Extending these findings to local k-spaceand assuming the T2-decay to be dominated by a single value for each voxel, resultsin the following approximation:
I[~rn] ∝∼∑t,c
Forct,c [~rn]
∫
samplem⊥(~r, 0)Bc(~r) exp
(−i~klocal[~rn, t] ·~r− TEeff[~rn]
T∗2 [~rn]
)d3r.
(6.8’)In this equation, all polynomials of the spatial variation of the Larmor frequencyare incorporated in Forc
t,c ,~klocal and TEeff/T∗2 .
6.2 origin of frequency variations
There are three main effects that lead to variations of the Larmor frequency. Firstof all, magnets cannot be designed to provide a completely homogeneous field.The MAGNETOM Trio (Siemens, Erlangen, Germany) used for the preparation ofthis thesis, possesses a homogeneity of 0.1 ppm within a sphere of 40 cm diameter.Those signal variations are very smooth and contribute mainly to the zeroth orderpolynomial. Hence, they are not taken into account in the following discussion.
The second origin of off-resonance effects is the so-called chemical shift. Theelectrons surrounding the nucleus have a shielding effect. Different chemicalsurroundings imply different Larmor frequencies. The main chemical surroundingsof protons in biological tissue are water and fat molecules. For fMRI, only signalfrom water molecules is of interest. The fat signal can be suppressed using variousmethods. In MREG, the fat signal is distributed over the entire image due tonon-Cartesian trajectories. Since the fat signal is expected to be constant over time,it has no impact on the fMRI analysis and can be ignored.
The most important source of frequency variations is susceptibility, which entailsboth desired and objectionable effects in fMRI. Magnetic fields penetrate differenttissues differently, leading to variations of the Larmor frequency at interfacesbetween different tissues. The size and structures of those interfaces are manifold.Most troublesome for fMRI are the air-tissue interfaces above the sinuses. Theoff-resonance frequency increases dramatically close to the interface and leads tosignificant contributions to the zeroth and first-order polynomials. However, alsothe BOLD contrast (Section 4.4) relies on the susceptibility changes induced bydeoxyhemoglobin. Single molecules lead to signal variations at the sub-voxel scale.Thus, the BOLD effect contributes mainly to the higher order polynomials and canbe described by a change of T∗2 in Equation (6.8’).
52

7S P H E R I C A L S TA C K O F S P I R A L S T R A J E C T O R I E S
This chapter addresses the analysis and optimization of MREG trajectories in localk-space. A spherical stack of spirals (SoS) trajectory is proposed for improvedoff-resonance behavior and overall image quality. A concentric shells trajectory(Zahneisen et al., 2012) was used for comparison, since it shows the most benignoff-resonance behavior of all MREG trajectories proposed so far. Concluding thischapter, artifacts in spin echo MREG are analyzed.
The content of this chapter was partially published in (Assländer et al., 2013),including some of the figures.
7.1 methods
7.1.1 Experimental Setup
All experiments were performed on a 3 T MAGNETOM Trio scanner (Siemens,Erlangen, Germany) with approval of the local ethics committee. It is equipped witha gradient system with a maximum gradient strength of 38 mT/m and a slew rateof 170 T/m/s along each axis. Excitation was performed with the body transmitcoil and the manufacturer’s 32 channel head coil array was used for signal reception.All trajectories were calculated off-line using MATLAB (The MathWorks, Natick,MA, USA). The MREG sequence is a gradient-spoiled gradient echo sequence whichreads the gradient shapes from a text file.
7.1.2 Coil Sensitivities and Off-Resonance Maps
Parallel imaging was implemented by describing the signal as a function of thecoil sensitivities Bc[~rn] in the forward model (Equation 4.22). Coil sensitivities weremeasured with a multi-slice double gradient echo sequence with the parametersTR = 1000 ms, TGE = 2.46/4.92 ms, flip angle = 50°, dwell time = 4.9 µs, FOV =
(192 mm)3, voxel size = (3 mm)3. After FFT image reconstruction, coil sensitivitieswere calculated by employing the algorithm suggested by Walsh et al. (2000) to theimage of the first echo.
Choosing voxel-wise the coil with the highest absolute signal, an off-resonancemap ωor[~rn] was calculated from the phase difference of the two echoes. Thephase map was unwrapped with PRELUDE (Jenkinson, 2003) provided by the FSLtoolbox (http://www.fmrib.ox.ac.uk/fsl). The unwrapped map was then usedas an initial map for the iterative `1-norm off-resonance map estimation describedby Funai et al. (2008). The derived map and its gradient components are shown inFigure 9.
53

spherical stack of spirals trajectories
a
−1
−0.5
0
0.5
1
ωor
[rad
/ms]
b
−40
−20
0
20
40
dωor
/dx
[rad
/m/m
s]
c
−40
−20
0
20
40
dωor
/dy
[rad
/m/m
s]
d
−40
−20
0
20
40
dωor
/dz
[rad
/m/m
s]Figure 9.: Representative transversal slices of the off-resonance map used for recon-
struction are displayed in (a) together with its gradient components (b-d).The arrows highlight areas with dωor/dz < 0, which show the oppositeartifact behavior compared to the most dominant source of artifacts, i.e.dωor/dz > 0. Please note that for display purposes, the color map coversonly a fraction of the maximum values. The maximum Larmor frequen-cies are of the order of ωor = ±2 rad/ms, while the gradient exhibitsvalues in the range of ±350 rad/m/ms.
54

7.1 methods
7.1.3 Trajectory Design
Spherical stack of spirals trajectories are composed of single spirals which weredesigned as outlined in Section 4.1.5. As shown by Spielman et al. (1995), it isbeneficial to sample the center of k-space more densely than the outer part, sinceartifacts resulting from Nyquist violations in the outer parts of k-space are lesssevere. For 3D trajectories, FOVr in Equations (4.19) and (4.20) were set to
FOVr
(∣∣∣~k∣∣∣)=
FOVr,Nyquist
Rr
(∣∣∣~k∣∣∣) . (7.1)
The in-plane1 extent of the object is denoted by FOVr,Nyquist and Rr(|~k|) refers tothe so-called undersampling factor, which can be chosen according to the encodingcapabilities of the receive coils and the reconstruction technique. With the depen-dency on
∣∣∣~k∣∣∣ =
√k2
x + k2y + k2
z, outer spirals possess high undersampling factorsover the entire spiral, while the central spirals sample the center of k-space moredensely. Spirals were calculated in steps of
∆kz = ±2πRz(|kz|)FOVz,Nyquist
, (7.2)
beginning with kz = 0. The undersampling factor Rz depends solely on kz, hencethe resulting spirals are flat. The field of view in slice direction is representedby FOVz,Nyquist and needs to cover all significant contributions of transversal mag-
netization density. For each kz, a spiral of the size kr,max[kz] =√|~kmax| − kz was
created in order to resolve a spherical envelope. ~kmax is defined by the desiredresolution according to Equation (4.9). The acquisition direction of the spiralsalternates between inside out and outside in. The central spiral is acquired insideout in order to maintain a reasonable echo time.
After matching the endings of the spirals by in-plane rotation, they were smoothlyconnected by bending the spirals. For time optimal connections, a linear program-ming algorithm was employed (Hargreaves et al., 2004).
A spherical stack of spirals trajectory was designed with an isotropic nominalresolution of 3 mm and a FOVNyquist of 192 mm. Undersampling factors wereset to Rr = 3 + 3 · |~k|/|~kmax| and Rz = 2 + 3 · kz/kz,max, resulting in a stack of 23spirals. For simplicity, the Euler algorithm was employed to solve the differentialEquations (4.19) and (4.20). In order to reduce numerical errors, a step size of1.25 µs was used. Afterwards, the trajectory was resampled to the gradient rastertime of 10 µs. The resulting pulse sequence is sketched in Figure 10 and an SoStrajectory is drawn in Figure 11.
Changing magnetic fields induces currents in conductors as described by Fara-day’s law. This may lead to a stimulation of the peripheral nerves, when switchinggradients too fast. As shown by Hebrank and Gebhardt (2000), peripheral nervestimulation (PNS) increases with the area under the gradient and, therefore, withthe radius of a spiral. In order to reduce PNS, the maximum slew rate used inEquation (4.20) is defined as
Gx,y(kr) ≡ Gx,y,max · exp(−χkr) , (7.3)
1 Perpendicular to the slice gradient
55

spherical stack of spirals trajectories
|ωx,y||S|
t
TGE
Gz
tGy
tGx
t
Figure 10.: A single TR of the MREG sequence with the 3 mm stack of spiralstrajectory is shown. After excitation, the trajectory successively samplesspirals. At the end of each TR a spoiler gradient is applied. Thedisplayed signal is the sum of squares of all coil elements of the firsttime frame of the experiment described in Section 7.1.6.
−8000 800
−8000
800
−800
0
800
kx [rad/m]ky [rad/m]
k z[r
ad/m
]
Figure 11.: A spherical stack of spirals trajectory is displayed. For visualization pur-poses, the undersampling factors are chosen arbitrarily. The trajectorysamples k-space monotonously in the kz-direction. The envelope of thetrajectory is a sphere, resulting in an isotropic sampling of the maximalspatial frequency.
56

7.1 methods
where χ is an empirical factor. This slew rate reduction facilitates the samplingof the central part of the spirals at full speed while avoiding PNS at the outerparts of k-space. Figure 12 (a) depicts the absolute value of the vectorial slew rate.The design algorithm ensures maximum slew rate along the spirals as long as themaximum gradient strength is not exceeded. This condition is usually fulfilledfor low resolution imaging. Thus, the slew rate is constant for χ = 0. In the caseof χ = 0.2 m/rad, the slew rate is adapted to the current radius (Equation 7.3),resulting in a varying absolute value. The time optimal connection of consecutivespirals does not necessarily exploit the maximum slew rate, wherefore sharp peaksoccur. The connection algorithm allows the maximum slew rate for each individualgradient channel. Some of the peaks therefore exceed 170 T/m/s in the displayedsum of squares.
0 10 20 30 40 50 60 70
0
100
200
a
t [ms]
|~ G|[
T/m
/s]
0 10 20 30 40 50 60 700
0.5
1b
t [ms]
PNS
leve
l(no
rm.)
χ = 0χ = 0.2 m/rad
Figure 12.: The absolute value of the vectorial slew rate of the proposed stack ofspirals trajectory (3 mm resolution) is shown in (a). It is constant forχ = 0 while it is reduced for the outer parts of the spirals in the caseof χ = 0.2 m/rad. The sharp spikes correspond to the connectionsbetween consecutive spirals. The normalized level of peripheral nervestimulation is depicted in (b). The threshold for passing the safety testsof the scanner equals 1.
With the simulation software provided by Siemens (Erlangen, Germany), PNScan be predicted based on the method suggested by Hebrank and Gebhardt (2000)(Figure 12b). The normalized PNS level has to stay below 1 for the entire trajectoryin order to pass the safety tests of the scanner. The stimulation level oscillates, sincedifferent gradient fields stimulate differently. Driving the gradient system at itsmaximum slew rate (χ = 0), this threshold is exceeded, whereas the stimulation
57

spherical stack of spirals trajectories
level stays below 1 along the entire trajectory when employing χ = 0.2 m/rad. Thefirst spirals stay well below 1 since those outer spirals are small (see Figure 11).Since the algorithm for the PNS level takes the recent history of the gradient intoaccount, the first spirals are further favored. This facilitates sampling the firstspirals at full speed, without exceeding the limit. However, this is omitted herefor simplicity and symmetry reasons. Generally, the stimulation level is low at thecentral parts of the spirals (e.g. dashed line). In those parts the maximum slew rateof the gradient system is exploited. At the outer parts of the spirals (e.g. dottedline), the slew rate is reduced and the stimulation level drops below 1. The slewrate reduction factor χ allows a smooth transition between the slew rate and PNSlimited regimes. However, it elongates the trajectory slightly.
The resulting trajectory has a length of 75 ms and an echo time of 36 ms, measuredfrom the middle of the excitation pulse to the time at which the center of k-space isacquired (see Figure 10).
The proposed stack of spirals trajectory travels in the positive kz-direction (seeSection 7.2). The trajectory was inverted to travel in the negative kz-direction forthe analysis of off-resonance artifacts. For comparison, a concentric shells trajectorywas designed according to Zahneisen et al. (2012) with undersampling factors ofRr = 2 + 3 · |~k|/|~kmax| and Rϑ = 3 + 3 · |~k|/|~kmax|. By acquiring the outmost shellfirst and the others inside out, the echo time was set to approximately 16 ms. Thelength of the trajectory is approximately 60 ms.
Another SoS trajectory was designed for partial brain imaging with an isotropic,nominal resolution of 2 mm. While in-plane FOVr,Nyquist is still set to 192 mm,FOVz,Nyquist is reduced to 64 mm. Setting the undersampling factors to Rr = 3 + 3 ·|~k|/|~kmax| and Rz = 2 + 3 · kz/kz,max, the resulting trajectory has an approximateecho time of 34 ms and a length of 75 ms.
For all three trajectories, the data acquired during ramping the trajectory up anddown was excluded from reconstruction in order to avoid trajectory intersectionsthat potentially lead to artifacts in the presence of off-resonance and T∗2 -decay.
7.1.4 Image Reconstruction
The raw data was exported to an external server, where image reconstruction wasimplemented in MATLAB (The MathWorks, Natick, MA, USA) as described inSection 4.2.
Dynamic Off-Resonance Correction
The acquired signal vector was corrected for spatially global off-resonance changesover time. Correcting for "dynamic off-resonance in k-space" (DORK) has beenproposed by Pfeuffer et al. (2002). Before the start of the trajectory, 400 µs FID wereacquired. This allows the calculation of frequency changes between time frames bymeasuring the evolution of the phase of the FID. At the middle of the excitationpulse, the phase of the magnetization is assumed to be the same for each timeframe. Taking one data point during the FID, the change of the Larmor frequency isdetermined by the change of the phase divided by the time of free precession. Theglobal off-resonance of the first time frame was enforced to be zero by adjusting thefrequency before the MREG scan.
58
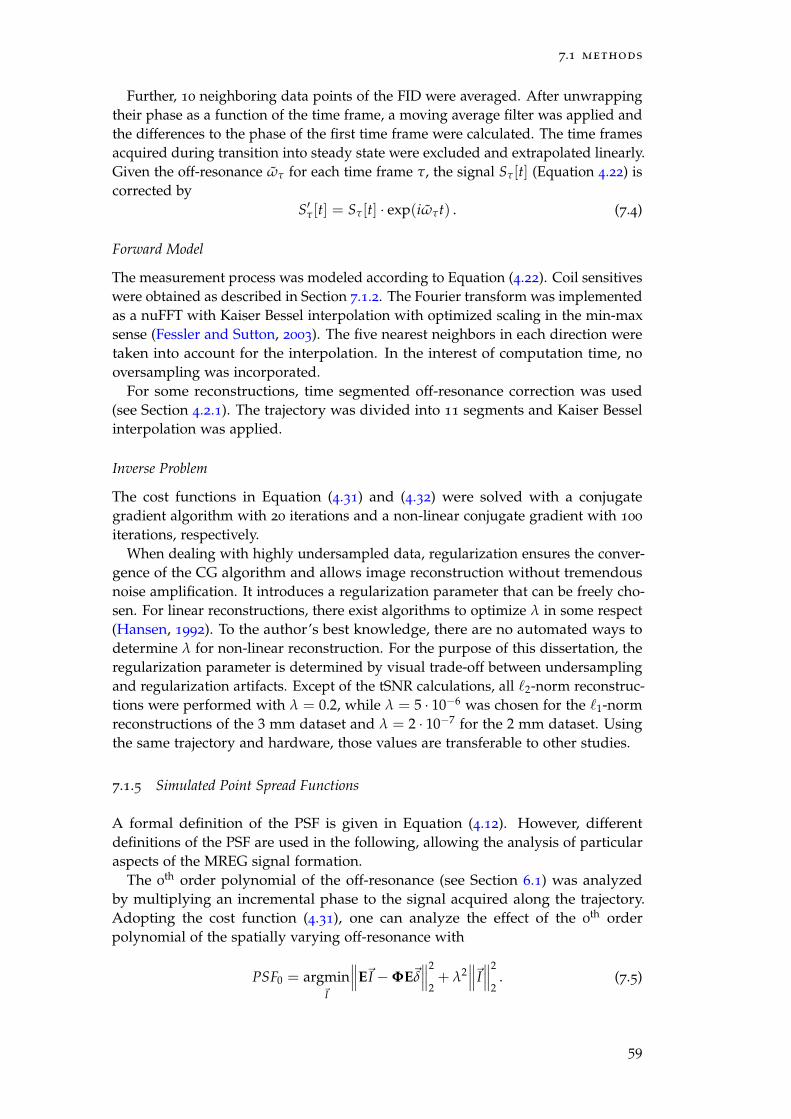
7.1 methods
Further, 10 neighboring data points of the FID were averaged. After unwrappingtheir phase as a function of the time frame, a moving average filter was applied andthe differences to the phase of the first time frame were calculated. The time framesacquired during transition into steady state were excluded and extrapolated linearly.Given the off-resonance ωτ for each time frame τ, the signal Sτ[t] (Equation 4.22) iscorrected by
S′τ[t] = Sτ[t] · exp(iωτt) . (7.4)
Forward Model
The measurement process was modeled according to Equation (4.22). Coil sensitiveswere obtained as described in Section 7.1.2. The Fourier transform was implementedas a nuFFT with Kaiser Bessel interpolation with optimized scaling in the min-maxsense (Fessler and Sutton, 2003). The five nearest neighbors in each direction weretaken into account for the interpolation. In the interest of computation time, nooversampling was incorporated.
For some reconstructions, time segmented off-resonance correction was used(see Section 4.2.1). The trajectory was divided into 11 segments and Kaiser Besselinterpolation was applied.
Inverse Problem
The cost functions in Equation (4.31) and (4.32) were solved with a conjugategradient algorithm with 20 iterations and a non-linear conjugate gradient with 100iterations, respectively.
When dealing with highly undersampled data, regularization ensures the conver-gence of the CG algorithm and allows image reconstruction without tremendousnoise amplification. It introduces a regularization parameter that can be freely cho-sen. For linear reconstructions, there exist algorithms to optimize λ in some respect(Hansen, 1992). To the author’s best knowledge, there are no automated ways todetermine λ for non-linear reconstruction. For the purpose of this dissertation, theregularization parameter is determined by visual trade-off between undersamplingand regularization artifacts. Except of the tSNR calculations, all `2-norm reconstruc-tions were performed with λ = 0.2, while λ = 5 · 10−6 was chosen for the `1-normreconstructions of the 3 mm dataset and λ = 2 · 10−7 for the 2 mm dataset. Usingthe same trajectory and hardware, those values are transferable to other studies.
7.1.5 Simulated Point Spread Functions
A formal definition of the PSF is given in Equation (4.12). However, differentdefinitions of the PSF are used in the following, allowing the analysis of particularaspects of the MREG signal formation.
The 0th order polynomial of the off-resonance (see Section 6.1) was analyzedby multiplying an incremental phase to the signal acquired along the trajectory.Adopting the cost function (4.31), one can analyze the effect of the 0th orderpolynomial of the spatially varying off-resonance with
PSF0 = argmin~I
∥∥∥E~I −ΦE~δ∥∥∥
2
2+ λ2
∥∥∥~I∥∥∥
2
2. (7.5)
59

spherical stack of spirals trajectories
The forward operator is denoted by E and employs in-vivo coil sensitivities andthe nominal trajectory. Φ is diagonal matrix with the entries Φj,j = exp(iωortj),where ωor denotes the off-resonance under consideration and tj the time at whichthe particular data point is acquired. The test image ~δ is a Kronecker delta, whichis one at the central voxel and zero elsewhere. In terms of encoding capacities ofthe coil-sensitivities, the central voxel is expected to be the worst case scenario. T∗2analysis was performed by repeating the simulations with Φj,j = exp(−tj/T∗2 ).
In Section 6.1.2, trajectory distortions caused by the 1st order polynomial of theoff-resonance are discussed. The imaging behavior of distorted trajectories wasanalyzed with
PSF1 = argmin~I
∥∥∥E~I − E~δ∥∥∥
2
2+ λ2
∥∥∥~I∥∥∥
2
2. (7.6)
The forward operator E employs the nominal k-space trajectory, which is distortedby the dωor/dz-value under consideration. High spatial frequencies of the distortedtrajectory were cut off in order to avoid a fold-over of the trajectory when performinga discrete FFT.
7.1.6 BOLD Experiments
Sequence Parameters
In order to allow for a good comparison, all BOLD-MREG measurements wereperformed for 100 s with TR = 100 ms, although shorter repetition times can berealized depending on the length of the trajectory. A flip angle of 25° was used,which is approximately the Ernst angle for gray and white matter at the givenTR. The dwell time of 5 µs ensures Nyquist sampling in the readout directionalong the entire trajectory. The nominal echo times depend on the trajectories andare approximately 36 ms for the 3 mm and 34 ms for the 2 mm stack of spiralstrajectory. The shells trajectory has an echo time of approximately 16 ms.
All whole brain experiments were performed with a slab thickness of 192 mm.The slow encoding direction of the SoS trajectory (z) was aligned along the boreaxis (see Section 7.2).
The partial brain images with 2 mm nominal resolution were acquired with aslab thickness of 50 mm, providing some oversampling in order to account forimperfections in the slice profile. In this particular measurement, the slab and thetrajectory were tilted by 19° from the transversal to the coronal direction for bettercoverage of the brain.
Stimulation Paradigm and Statistical Analysis
A flickering checkerboard was presented to the subject three times for 15 s with15 s rest in between. The first 8 s were excluded from the fMRI analysis in order toallow transition of the signal into steady state. The model of the resulting BOLDstimulus is displayed in Figure 8. Statistical analysis was performed with SPM8(www.fil.ion.ucl.ac.uk/spm). Furthermore, 0th to 2nd order polynomials wereemployed as regressors of no interest.
60

7.2 results
Temporal SNR Calculations
The tSNR (see Section 4.4.3) was calculated voxel by voxel by dividing the elementof ~β (Equation 4.35) that corresponds to the constant part of the GLM fit by thestandard deviation of the residual ~ε (Equation 4.36). The constant element of ~βcorresponds to the mean value of the time series corrected for the linear, quadraticand the BOLD component. For this measure to be meaningful, the constant term ofthe design matrix must be normalized and the low order polynomials must be zeroon the average. The BOLD vector is designed according to Section 4.4 and is notzero on average such that the BOLD contrast is removed.
For analyzing the tSNR as a function of λ, the 3 mm stack of spirals dataset(trajectory traveling in positive kz-direction) was reconstructed multiple times andfor each reconstruction the mean tSNR of the brain and its top-posterior quadrantwas taken. Please note that Gauss distribution of the signal variations is assumedwhich is known to be not entirely correct (see Section 4.4.3).
7.1.7 Spin Echo Experiments
In order to demonstrate the off-resonance effects, a spin echo MREG measurementwas performed. The 3 mm SoS trajectory used for the fMRI studies was employedhere as well. The center of the nominal k-space was acquired at TGE = 120 msafter the center of the excitation pulse. The time between the slice selective π/2-excitation pulse and the non-selective, rectangular π-refocusing pulse was variablyimplemented to allow for a freely selectable
∆TE = TGE − THE. (7.7)
All spin echo MREG images were reconstructed onto a 1283 grid, using `1-normregularization in the total variation domain with λ = 5 · 10−6 and employingoff-resonance correction.
7.2 results
Following the structure of Section 6.1, the effect of different parts of the Taylorexpansion of the spatially dependent off-resonance is analyzed in simulations.Thereafter, the results are experimentally verified. At the end of this section, thestack of spirals trajectory is examined within a spin echo experiment.
7.2.1 Constant Term - Off-Resonance Correction
The effect of the 0th-order polynomial of the off-resonance is analyzed with pointspread functions (|PSF0|) calculated according to Equation (7.5). The PSFs aredisplayed in Figure 13 for the 3 mm stack of spirals and shells trajectory. The PSFsof the shells and the SoS trajectory look similar when no off-resonance is present.This entails a similar nominal resolution of the two trajectories. However, the PSFsdiffer significantly when introducing an ωor 6= 0. A global off-resonance blurs thesignal over the entire FOV when using a shells trajectory. The slowest encodingdirection of shells is the radial one in k-space, similar to 2D spirals. Thus, theiroff-resonance behavior is alike.
61

spherical stack of spirals trajectories
Concentric Shells
ωor = 0|P
SF0|
x z
Stack of Spirals
|PSF
0|
x z
ωor = 50 rad/s
|PSF
0|
x z
|PSF
0|
x z
ωor = 100 rad/s
|PSF
0|
x z
|PSF
0|
x z
ωor = 250 rad/s
|PSF
0|
x z
|PSF
0|
x z
Figure 13.: The |PSF0| of the shells trajectory is plotted accompanied by its counter-part of the 3 mm stack of spirals trajectory. The effect of different globaloff-resonance values is shown. All PSFs are scaled equally. Only thecentral x-z-plane is displayed, since both trajectories are approximatelyrotationally symmetric in the x-y-plane.
62

7.2 results
In contrast, the PSF of the SoS trajectory is mainly shifted when increasing theoff-resonance frequency. The slowest encoding direction of the SoS is kz. Alongthis direction, the accumulated phase increases monotonously. According to theFourier shift theorem, a linear phase in k-space corresponds to a shift in positionspace. With a varying magnetic field, each voxel is shifted by a different distance,resulting in geometric distortions in the image. This behavior is similar to the oneknown from 2D EPI. Since the phase increment is monotonous but non-linear alongkz, some blurring adds to the shift of the main peak of the PSF.
As indicated by the title of this section and as already discussed in Section 6.1.1,the effect of the constant term of the off-resonance can be accounted for by modelingit in the forward operator (see Section 4.2.1). Images with and without off-resonancecorrection can be viewed in Figure 20.
7.2.2 Linear Terms - Local k-Space
The Larmor frequency in the human brain varies over space as demonstrated inFigure 9. Even though the frequency variations are small in most parts of thebrain, tremendous susceptibility gradients can be observed in the supra-temporalareas above the sinuses. Local k-space is defined in Equation (6.4) as the sum ofthe nominal trajectory and a constant velocity induced by the local off-resonancegradient.
z-Component of the Off-Resonance Gradient
First, the effect of the dωor/dz-component is analyzed, which corresponds to theslowest encoding direction of the SoS trajectory. In Figure 14, the projection of localtrajectories along the angular direction (in cylindrical coordinates) is displayed. Theangular direction is neglected in the off-resonance analysis, since it is the directionof readout for both SoS and shells trajectories and is acquired comparatively fast.The top row of Figure 14 depicts the stack of spirals trajectory, which travelsmonotonously in the positive kz-direction, if there is no off-resonance gradientpresent (c). In the presence of a strong, negative off-resonance gradient in z-direction, the trajectory hardly acquires the target area indicated by the whitebackground (a). The average speed of the stack of spirals trajectory along kz isgiven by
dkz
dt=
2 · kz,max
TADC=
2π
∆z · TADC≈ 28 rad/m/ms, (7.8)
where ∆z = 3 mm denotes the voxel size in z-direction and TADC = 75 ms thelength of the trajectory. In the presence of an off-resonance gradient of the strengthdωor/dz = −40 rad/m/ms, the traveling direction of the trajectory is inverted formost parts. Only the outer shells are acquired in positive kz-direction, since theyare smaller and less dense (Figure 14a).
In general, the trajectories in local k-space describe the spatial informationacquired for areas with corresponding off-resonance gradients. In terms of signalattenuation, the center of local k-space is crucial. One can consider an off-resonancegradient of (
dωor
dz
)
cutoff≡ − kz,max
TADC≈ −14 rad/m/ms, (7.9)
63

spherical stack of spirals trajectories
b
0 0.5 1√k2
x + k2y [ rad
mm ]
−14 radm ms
a
0 0.5 1−2−1
01
2
34
√k2
x + k2y [ rad
mm ]
k z[r
ad/m
m]
dωzdz = −40 rad
m ms
f
0 0.5 1−3
−2−1
01
2
3
√k2
x + k2y [ rad
mm ]
k z[r
ad/m
m]
dωzdz = −40 rad
m ms
g
0 0.5 1√k2
x + k2y [ rad
mm ]
−18 radm ms
h
0 0.5 1√k2
x + k2y [ rad
mm ]
0 radm ms
c
0 0.5 1√k2
x + k2y [ rad
mm ]
0 radm ms
d
0 0.5 1√k2
x + k2y [ rad
mm ]
14 radm ms
e
0 0.5 1√k2
x + k2y [ rad
mm ]
40 radm ms
j
0 0.5 1√k2
x + k2y [ rad
mm ]
40 radm ms
i
0 0.5 1√k2
x + k2y [ rad
mm ]
18 radm ms
Figure 14.: The top row shows projections of the stack of spirals trajectory (travelingin the positive kz-direction) for different off-resonance gradients. Forcomparison, distorted shells trajectories are displayed in the bottomrow. The white background indicates the target area of k-space, whichcorresponds to a 3 mm resolution. The different off-resonance gradientsare found in different areas of the brain (see Figure 9). Thus, thedistorted trajectories can be considered as trajectories in "local k-space".
64

7.2 results
which corresponds to approximately 52 µT/m, as a cutoff value (Figure 14b). Thetrajectory is then squeezed to half its size and the center of k-space is acquired atthe end of the trajectory. For stronger negative off-resonance gradients, the centerof k-space is not acquired.
Positive off-resonance gradients stretch the SoS trajectory, leading to high under-sampling factors (Figure 14d, e). However, the trajectories still cover the center ofk-space, maintaining signal intensity.
The bottom row of Figure 14 shows the concentric shells trajectory in the presenceof off-resonance gradients. The trajectory travels from pole to pole in alternatingdirections in consecutive shells. Thus, they are alternately stretched and squeezed.The cutoff value for acquiring the center of local k-space is |~∇ωor| ≈ 18 rad/m/ms.Due to the approximate symmetry of the trajectory, the off-resonance behaviorhardly depends on the direction of the gradient.
dωor
dz= −40
radm ms
|PSF
1|
x z
dωor
dz= −14
radm ms
|PSF
1|
x z
dωor
dz= 14
radm ms
|PSF
1|
x z
dωor
dz= 40
radm ms
|PSF
1|
x z
Figure 15.: The |PSF1| (Equation 7.6) is shown for stack of spirals trajectories that aredistorted by different off-resonance gradients. The PSF1 for dωor/dz = 0corresponds to the PSF0 with ωor = 0 (top right of Figure 13).
In contrast to the 0th order polynomial, the effect of the 1st order polynomialcannot be resolved with off-resonance correction. If the trajectory is distorted,the area acquired in local k-space is changed, leading to a fundamental loss ofinformation. The top left of Figure 15 demonstrates the poor encoding capacity of astack of spirals trajectory when distorted by an off-resonance gradient opposingthe slowest encoding direction. The plotted absolute value suggests that signalattenuation is within an acceptable limit. However, the complex phase of the PSF hasa huge slope in z-direction (not shown). Only the outer part of k-space is acquired,as illustrated in Figure 14 (a). According to the Fourier shift theorem, the Fouriertransformation of data with significant contributions in only one outer region results
65

spherical stack of spirals trajectories
a slope of the phase. Equation (4.12) defines an image as the integral over weightedpoint spread functions. Integrating over complex values with a strongly varyingphase leads to signal cancellation. Consequently, strong negative off-resonancegradients in z-direction lead to signal attenuation, despite the significant signalreflected by the absolute value of the PSF. The arrows in Figure 9 (d) highlighttwo regions which have a strong negative off-resonance gradient. Thus, signalattenuation is expected in those areas when acquiring the data with a stack ofspirals trajectory that travels in positive kz-direction. Turning the trajectory aroundwould allow the signal to be maintained in those regions. However, signal dropoutwould then be expected above the sinus frontalis where a positive dωor/dz ispresent.
The bottom row of Figure 15 demonstrates the encoding capacities of a stretchedSoS trajectory (Figure 14d, e). The stretched trajectory violates the Nyquist theorem,even when taking coil sensitivities and regularization into account. This results inside lobes in the PSF. Increasing the off-resonance gradient, the side lobes get closerto the main peak, which is gradually attenuated.
0 10 20 30 40 50 60 70 80
−2
0
2
4dωor/dz = 40 rad/m/ms
14 rad/m/ms
0 rad/m/ms
−14 rad/m/ms
−40 rad/m/ms
t [ms]
k z[r
ad/m
m]
Figure 16.: In order to demonstrate the origin of the effective echo time, the kz-component of the stack of spirals trajectory is plotted for differentoff-resonance gradients as a function of time.
In Figure 16, the kz-component of the stack of spirals trajectory is plotted as afunction of time. TEeff is approximately given by the time at which the trajectorycrosses kz = 0. With dωor/dz = −40 rad/m/ms, the trajectory does not acquire thecenter of k-space at all. At dωor/dz = −14 rad/m/ms, the trajectory hits kz = 0at its end. Increasing dωor/dz further, the effective echo time decreases gradually.The signal behavior at different effective echo times is discussed at the end of thissection.
x- and y-Components of the Off-Resonance Gradient
The effect of off-resonance gradients perpendicular to the slowest encoding directionis almost independent of its in-plane direction due to the near rotation symmetry
66

7.2 results
of the SoS trajectory. A dωor/d(x, y) 6= 0 leads to a tilt of the trajectory. In order tocause signal attenuation, an in-plane off-resonance gradient - without a gradientin z-direction being present - needs to shift the trajectory by kmax within TADC/2,which approximately corresponds to the nominal echo time. Thus, the tolerablein-plane off-resonance gradient (in terms of signal attenuation) is approximatelydouble the size, compared to a gradient opposing the slowest encoding direction ofthe trajectory.
Alignment of the Trajectory with Respect to the Off-Resonance Gradient
As described above, signal attenuation is mainly caused by the component of theoff-resonance gradient opposing the slowest encoding direction. Figure 9 (b, c)depict significant positive and negative contributions to dωor/dx and dωor/dy. Inthe z-direction, the off-resonance gradient is mainly positive within the brain (d).Thus, it is a good choice to align the slowest encoding direction with the positivegradient in head-foot-direction (z-axis), justifying the nomenclature used so far.
The Complete Off-Resonance Gradient
The trajectory in local k-space is calculated for each voxel by taking all threecomponents of the off-resonance gradient into account. In order to provide anestimation of the signal attenuation expected in MREG images, Figure 17 depictsthe effective echo time, calculated according to Equation (6.7) for the 3 mm SoStrajectory with the off-resonance map shown in Figure 9.
0
10
20
30
40
50
60
70
TE e
ff[m
s]
Figure 17.: The effective echo time is shown for the 3 mm SoS trajectory in thepresence of the off-resonance frequency depicted in Figure 9. Areaswhere the local trajectory does not acquire the central area of k-space atall are displayed white.
In the white areas, the local k-space trajectory fulfills |~klocal| > π/2 rad/voxel forthe entire trajectory. In those areas, signal attenuation is expected. Please note thatthis cutoff-value is chosen heuristically.
67

spherical stack of spirals trajectories
7.2.3 Higher Orders - T∗2 -Decay and BOLD-Sensitivity
The effect of a spatially constant T∗2 -decay is analyzed with point spread functions,calculated according to Equation (7.5). The PSFs depicted in Figure 18 reveal signalattenuation for both trajectories. In accordance with the findings of Zahneisenet al. (2012), the blurring induced by T∗2 is small compared to off-resonance effects(Figure 13). Thus, it is reasonable to approximate the effect of T∗2 as mere signalattenuation, justifying the exponential decay in Equation (6.8’) to scale with TEeff.
Concentric Shells
T∗2 = 0
|PSF
0|
x z
Stack of Spirals
|PSF
0|x z
T∗2 = 40 ms
|PSF
0|
x z
|PSF
0|
x z
Figure 18.: The absolute value of PSF0 of the shells trajectory and its counterpart ofthe 3 mm stack of spirals trajectory are depicted for different spatiallyconstant T∗2 -times. All PSFs are scaled equally. Only the central x-z-plane is displayed, since both trajectories are approximately rotationallysymmetric in the x-y-plane.
In Section 6.2, the origin of higher order frequency variations from both micro-scopic and macroscopic susceptibility effects were discussed. Deichmann et al.(2002) assume T∗2 to be dominated by microscopic effects and to show thereforeonly minor variations over space. Under this assumption, one can use the effectiveecho time in Figure 17 to predict the signal intensity in any particular voxel. Someregions in the lower part of the brain exhibit a high effective echo time. Thus, theseregions are expected to show low signal intensity. In contrast, the top part of thebrain has a very low effective echo time, except for a small circular region in topslices. Thus, in those regions high signal intensity is expected with a small circulararea of lower signal intensity.
Deichmann et al. (2002) demonstrated that the BOLD-sensitivity has its maximumat TGE ≈ T∗2 , surrounded by a rather flat top. T∗2 of gray matter is approximately
68

7.2 results
40 ms at 3 T (Peran et al., 2007). Thus, according to the considerations of Deichmannet al. (2002), an effective echo time of 15-80 ms is expected to result in good BOLDsensitivity. This is fulfilled for most parts of the brain (see Figure 17). Only the verytop of the brain and areas very close to the sinuses have a lower effective echo time.In those areas a reduced BOLD sensitivity is expected.
7.2.4 BOLD Experiments
Whole Brain MREG with 3 mm Resolution
The Larmor frequency for each time frame was calculated as described in Sec-tion 7.1.4. The result for the 3 mm stack of spirals trajectory traveling in the positivekz-direction can be viewed in Figure 19. The change in the Larmor frequency ismainly a low order drift due to scanner heating. The second component present isan oscillation at the respiratory frequency. The Larmor frequency during transitioninto steady state is extrapolated. Those time frames are not used in the fMRI-analysis. Employing Equation 7.4, the change of the global Larmor frequency iscorrected for all data shown in the following.
0 10 20 30 40 50 60 70 80 90 1000
20
40
τ [s]
ωτ
[rad
/s]
Figure 19.: The Larmor frequency is depicted as a function of the time frames duringthe acquisition of the 3 mm SoS dataset with the trajectory traveling inthe positive kz-direction.
The simulated |PSF0| in Figure 13 is experimentally confirmed by the resultsdepicted in the left column of Figure 20. While the shells trajectory results inblurring (a), the brain is squeezed and stretched into the sinus frontalis in thecase of the SoS trajectory traveling in the negative (b) and positive (c) kz-direction,respectively. In the upper part of the brain, further distortions of the object arepresent for both SoS trajectories (b, c). As can be seen by a comparison of the leftand the right columns of Figure 20, a reasonable correction of the blurring in thecase of the shells trajectory (a, d) and of the geometric distortions in the SoS images(b, c, e, f) is achieved by the off-resonance correction.
However, signal attenuation can still be observed in all three off-resonancecorrected images (d-f). As discussed in Section 7.2.2, off-resonance artifacts arealmost independent of the direction of the off-resonance gradient relative to ashells trajectory. In contrast, the artifacts change dramatically when the slowestencoding direction of the SoS trajectory is flipped. One can notice by comparing
69

spherical stack of spirals trajectories
a
b
c
d
e
f
w/o ORC w. ORC
Con
cent
ric
Shel
lsSo
Sw
.dk
z/dt
≤0
SoS
w.
dkz/
dt≥
0
0 10 20 30 40 50 60 70 80Student’s t-value
Figure 20.: Representative slices of the first time frame of three BOLD experimentsare overlayed by the corresponding activation maps. (a, d) show imagesacquired with the concentric shells trajectory, (b, e) and (c, f) the datasetacquired with the 3 mm SoS trajectory traveling in the negative andpositive kz-direction, respectively. The data was reconstructed without (a-c) and with off-resonance correction (d-f). All images were reconstructedwith `1-norm regularization in the total-variation domain.
70

7.2 results
Figure 20 (e, f) to Figure 9 that signal dropout occurs in areas where a strongdωor/dz opposes the traveling direction of the SoS trajectory. This is in complianceto the simulations presented in Section 7.2.2. Especially above the sinuses, signaldropout is observed in the case of an SoS trajectory with dkz/dt ≤ 0 (e). Turningthe trajectory around, signal intensity is maintained in those areas (f). The arrowshighlight areas with a negative dωor/dz (see Figure 9d), which show the oppositeoff-resonance behavior compared to the area above the sinuses.
Comparing the areas that fulfill |~klocal| > π/2 rad/voxel for the entire trajectory(white areas in Figure 17) to the signal dropout in Figure 20 (f), good agreementcan be observed. Furthermore, areas with a high TEeff show signal reduction e.g. inthe areas highlighted by the circles in Figure 20 (f). The top slices of the brain showhigh signal intensity, since TEeff is rather low in those areas. Only a small region(highlighted by the circle) has a reduced signal intensity, since TEeff is much higherin this region.
When omitting off-resonance correction, the activation maps are slightly shiftedin z-direction with respect to each other (Figure 20a-c). Applying off-resonancecorrection, this shift is undone and the activation maps show good alignment forall three experiments (d-f).
0 10 20 30 40 50 60 70 80 90t [s]
Voxe
lint
ensi
ty
Sinus sagittalis superiorVisual cortexGLM fit
0 0.5 1 1.5 2 2.5 3 3.5 4 4.5 5
a b c
f [Hz]
Voxe
lint
ensi
ty
Figure 21.: The time series and their frequency spectra of two voxels are displayedtogether with the GLM fit of the voxel in the visual cortex. For bettervisualization, only positive frequencies are considered. The spectralpeak highlighted with (a) is at the repetition frequency of the activationpattern. (b) are peaks most likely due to respiration, while (c) denotessignal peaks at multiples of the cardiac frequency.
71

spherical stack of spirals trajectories
The time series of one voxel of Figure 20 (f) in the areas of the sinus sagittalissuperior and of an activated voxel in the visual cortex are shown in Figure 21together with the absolute value of their spectra. The time series in the area ofthe sinus sagittalis is dominated by cardiac signal fluctuations. The highest peakin its spectrum is located at the frequency of the heart beat at approximately1 Hz. Significant contributions of up to the fourth harmonic is observed (c). Thetime series of the activated voxel shows signal fluctuations similar to the GLM fit,even though deviations from the shape of the HRF are present. The spectrum ofthe activated voxel has a major peak at the repetition frequency of the activationpattern of 0.03 Hz (a), as does the spectrum of the GLM fit. Another major peakin the spectrum of the activated voxel is located at approximately 0.33 Hz, whichcorresponds the respiratory frequency (b). Its second harmonic can be seen at0.67 Hz as well. Those effects are not modeled by the GLM fit, which has noappreciable contributions at higher frequencies.
a b
0 10 20 30 40 50 60 70Student’s t-value
Figure 22.: Reconstruction with `2-norm regularization with λ = 0.2 (a) is comparedto `1-norm regularization with λ = 5 · 10−6 (b). The data is the sameas shown in Figure 20 (f), acquired with the proposed stack of spiralstrajectory.
Figure 22 compares images reconstructed with the cost-functions defined inEquation (4.31) and (4.32). The anatomic image reconstructed with `2-norm regular-ization (a) has significant aliasing artifacts which have a noise-like appearance. Em-ploying `1-norm regularization, those artifacts vanish mostly, resulting in smootherimages (b). Furthermore, the edge preserving property of the non-linear reconstruc-tion results in sharper images. The activation patterns of both reconstructions showsimilar extent.
In order to compare different regularization methods, the temporal signal to noiseratio (tSNR) is depicted in Figure 23. The tSNR of the `2- and `1-norm regularizedreconstructions are similar at the regularization parameters used throughout this
72

7.2 results
0 0.5 1 1.5 2 2.5 3 3.5 4 4.5 5
60
80
100a
λ
tSN
R
`2-norm regularization
Vis. cortex w/0 ORCVis. cortex w. ORCWhole brain w/o ORCWhole brain w. ORC
0 0.1 0.2 0.3 0.4 0.5 0.6 0.7 0.8 0.9 1
·10−4
40
60
80
100b
λ
tSN
R
`1-norm regularization
Vis. cortex w/o ORCWhole brain w/o ORC
Figure 23.: The tSNR as a function of the regularization parameter is shown. Themean over the whole brain was taken as well as over the top-posteriorquadrant of the brain, which approximately corresponds to the visualcortex. In the case of the `2-norm regularization, the tSNR was calcu-lated with and without off-resonance correction (a). In the interest ofcomputation time, the `1-norm regularization was not combined withoff-resonance correction (b).
73

spherical stack of spirals trajectories
dissertation (highlighted by circles). This emphasizes that the noise-like artifacts inFigure 22 (a) are indeed artifacts and not noise.
The tSNR of the `2-norm reconstruction shown in Figure 23 (a) is a non-linearfunction of the regularization parameter. Choosing small values, an ill-conditionedmatrix is inverted, resulting in strong noise amplification. Increasing λ, the condi-tioning of the matrix inversion is improved and the tSNR increases and reaches itsmaximum near λ = 1 when averaging over the whole brain, and around 0.3 whenaveraging over the top posterior quadrant. Choosing an infinitely high regulariza-tion parameter transforms Equation (4.31) into a back-projection reconstruction.Thus, the tSNR of the back-projection reconstruction is asymptotically approachedfor high λ. Comparing the tSNR averaged over the whole brain to the tSNR inthe visual cortex, where off-resonance effects are negligible, higher values can benoted for the visual cortex. Off-resonance correction has only a minor impact onthe average tSNR.
The tSNR of the `1-norm reconstruction, depicted in Figure 23 (b), shows similarbehavior for small regularization parameters. However, after reaching its firstmaximum near the visually chosen λ = 5 · 10−6, the tSNR is not monotonous.
a b
0 10 20 30 40 50 60 70Student’s t-value
Figure 24.: The image of Figure 20 (f) is repeated in (a), interpolated onto a 1283
grid by zero-filling. (b) depicts the same data directly reconstructedonto a 1283 grid, using `1-norm regularization. The displayed slices arethe same as in Figure 9, 17, 20 and 22.
In order to demonstrate the potential and limitations of non-linear reconstructions,the SoS dataset was reconstructed onto a grid of the size 1283 (Figure 24b). Eachreconstructed voxel has the size (1.5 mm)3. The image reveals more anatomicaldetails and does not show Gibbs-ringing, which is apparent in the interpolatedimage (white rectangle in a). By comparing the activation maps, no significantimprovement can be observed. On the contrary, the activation pattern seems to beslightly blurred in the high-resolution reconstruction (b). However, the "ground
74

7.2 results
truth" of the activation is unknown, questioning the comparison of activationpatterns.
Partial Brain MREG with 2 mm Resolution
The stack of spirals trajectory allows for a reduced FOV in z-direction. The gainedacquisition time can be invested into higher spatial resolution. Figure 25 depictsan image acquired with 2 mm isotropic resolution (b). For comparison, a whole-brain dataset with 3 mm resolution was interpolated onto a 2 mm grid by zero-filling (a). Higher resolution is visible in both anatomical image and the overlaidactivation map. However, off-resonance artifacts are distinct in the 2 mm dataset.The high-resolution trajectory requires more time for single spirals. Due to thereduced FOVz, the step size in kz-direction between consecutive spirals is increased.The combination of those two effects results in stretched trajectories (similar toFigure 14e) with big gaps, which potentially miss the center of local k-space. Thet-values achieved with the 2 mm trajectory are slightly reduced due to a lowersignal to noise ratio, which comes along with higher resolution in MRI.
a b
0 10 20 30 40 50 60Student’s t-value
Figure 25.: A dataset acquired with the proposed 3 mm stack of spirals trajectory forfull-brain imaging was reconstructed with `1-norm regularization andthen interpolated onto a grid with 2 mm resolution (a). It is compared toa dataset acquired with an SoS trajectory with 2 mm isotropic resolutionwith an in-plane FOV of 192 mm and a FOVz = 64 mm (b).
7.2.5 Spin Echo MREG
Trajectory Distortions
After a sequence of two short pulses, separated by THE/2, a spin echo is formed atTHE according to the theory of Erwin Hahn outlined in Section 3.4. This corresponds
75

spherical stack of spirals trajectories
to an in-phase condition of the relevant spins at THE. When the spin echo is alignedwith the acquisition of the center of nominal k-space, the center of local k-space isacquired at TGE = THE, independent of magnetic field inhomogeneities. This alignsthe trajectories in local k-space, as shown in Figure 26. Nevertheless, the in-phasecondition is not fulfilled for t 6= THE. Thus the trajectories are still distorted andcompared to Figure 14 merely shifted.
Contrary to the trajectories in gradient echo imaging, strong gradients opposingthe traveling direction of the trajectory result in inverted trajectories with reasonablecoverage of the target k-space, which is indicated by the white background (Fig-ure 26a). In the presence of weaker negative gradients, the trajectory is squeezedand acquires only the central part of local k-space (b). Positive off-resonance gra-dients stretch the trajectory, leading to high undersampling factors. Thus, theconsiderations for gradient echo MREG apply to spin echo MREG as well: tremen-dous undersampling (Figure 26d, e) leads to residual aliasing, similar to the pointspread functions shown in Figure 15.
b
b
0 0.5 1√k2
x + k2y [ rad
mm ]
−20 radm ms
a
a
0 0.5 1
−2
−1
0
1
2
√k2
x + k2y [ rad
mm ]
k z[r
ad/m
m]
dωzdz = −40 rad
m ms
c
c
0 0.5 1√k2
x + k2y [ rad
mm ]
0 radm ms
d
d
0 0.5 1√k2
x + k2y [ rad
mm ]
20 radm ms
e
e
0 0.5 1√k2
x + k2y [ rad
mm ]
40 radm ms
Figure 26.: Projections of the stack of spirals trajectory (dkz/dt ≥ 0) are depictedfor different off-resonance gradients in the z-direction. In contrast toFigure 14, the in-phase condition is set to the time at which the nominaltrajectory acquires the center of k-space. This mimics a spin echo with∆TE = 0. The white background indicates the target area of k-spacewhich correspond to a 3 mm resolution.
Experiments
Figure 27 depicts MREG images which are acquired during the formation of aspin echo. When matching the spin echo and acquisition of the center of nominalk-space (∆TE = 0), signal intensity is maintained in the critical regions. However,one can note blurring artifacts above the sinuses. Signal attenuation can be notedalong the boundary of the sinus frontalis, as well as along a horizontal line throughthe eyes (arrows). In the affected areas, a gradient with approximately dωor/dz ≈−20 rad/m/ms is present. As shown in Figure 26 (b), only the central part of localk-space is acquired and many trajectory intersections are present, which result insignal attenuation.
76

7.2 results
Unmatching the spin echo and the gradient echo successively results in anoscillation of the signal intensity above the sinus sphenoidalis as well as above thesinus frontalis (circles in Figure 27). This originates from the spirals successivelypassing through the center of local k-space followed by gaps while positive off-resonance gradients shift the trajectory when changing ∆TE.
reference ∆TE = 0 10 ms 20 ms 30 ms 40 ms
−40
−30
−20
−10
0
10
20
30
40
dωor
/dz
[rad
/m/m
s]
Figure 27.: Representative slices of a spin echo MREG scan are shown, whereTHE and TGE are successively unmatched. The images demonstratethe transition from spin echo (∆TE = 0) to gradient echo (∆TE =
40 ms) MREG. In order to demonstrate anatomical fidelity, the imagesof the first echo of the reference scan are shown aside. For artifactanalysis, the corresponding dωor/dz map is depicted as well. Pleasenote that for display purposes, the color map covers only a fraction ofthe maximum values. In the displayed slices, values in the range ofdωor/dz = ±330 rad/m/ms occur. Circles and arrows highlight artifactsdiscussed in the text.
When changing ∆TE, the time between excitation and data acquisition remainsunchanged. Thus, T2-relaxation is not affected at each point of the trajectory.However, dephasing is strongly affected by this parameter, changing the T′2-decay.In areas with a negative dωor/dz, the signal does not decay exponentially whenincreasing ∆TE. The signal above the sinus frontalis (second row of Figure 27)drops to a negligible level already at ∆TE = 10 ms. In that particular area, agradient with dωor/dz ≈ −200 rad/m/ms is present. In contrast, the signal inthe frontal part of the eyes remains almost unchanged (second row) and dropsat ∆TE = 20 ms. In that particular area, the off-resonance gradient in z-direction
77

spherical stack of spirals trajectories
is dωor/dz ≈ −100 rad/m/ms. This demonstrates that the model of a mereexponential decay is insufficient and that the effective echo time has to be takeninto account. Adopting Equation (6.8), the signal of a voxel in spin echo MREG canbe approximated by
I[~rn] ∝∼∑t,c
Forct,c [~rn]
∫
samplem⊥(~r, 0)Bc(~r)·
exp(−i~klocal[~rn, t] ·~r− |TEeff[~rn]− THE|
T′2[~rn]− TEeff[~rn]
T2(~r)
)d3r.
(7.10)
Similar to Equation (6.8’), the T2-decay is assumed to be dominated by the timebetween excitation and the acquisition of the center of local k-space. On the otherhand, T′2-decay is approximated by the time between the in-phase condition andthe acquisition of the local k-space center. Overall, a change of ∆TE leads to anon-trivial superposition of T2- and T′2-effects.
7.3 discussion
This dissertation is devoted to the analysis of off-resonance effects in non-linear3D trajectories. In this particular chapter it was shown that the most apparentartifacts arise from off-resonance gradients, whereas 0th-order effects of the spatiallyvarying Larmor frequency can be addressed by off-resonance correction. In orderto optimize the data acquisition scheme, a single shot spherical stack of spiralstrajectory was proposed. Its feasibility was shown for single shot whole brainimaging with a nominal isotropic resolution of 3 mm and for partial brain imagingwith FOVz = 64 mm and a nominal isotropic resolution of 2 mm. Reconstructionswith different regularization methods were analyzed, both visually and with tSNRanalysis, as well as reconstructions onto different grid sizes. At last, the artifactbehavior in spin echo MREG was demonstrated.
The experimental setup used in this project allows for single shot whole brainimaging with a trajectory length of 75 ms. This results in violations of the Nyquisttheorem, which were compensated by a regularized reconstruction making useof the spatially dependent sensitivities of multiple receive coils. The acquisitionscheme and the geometry of the coil array therefore need to be matched. The 32channel head coil used has a "soccer ball" geometry (Wiggins et al., 2006) whichprovides near isotropic spatial information. The in-plane rotation symmetry ofthe spirals depends on the isotropic encoding power of the receive coils, whereasa trade-off between the undersampling in-plane and in z-direction allows fora compensation of a potential deviation of the encoding power in z-direction.Generally, the reconstruction of data with high undersampling factors requiresa coil array with many small coil elements. Coils with few big elements are notsuitable for MREG. State of the art hardware can acquire data with up to 128 receivechannels simultaneously. This facilitates routine imaging e.g. with the 95 channelreceive coil (Wiggins et al., 2009). MREG would benefit from the increased spatialinformation, which potentially allows for single shot imaging with higher spatialresolution. Alternatively, the trajectory can be shortened, potentially mitigatingoff-resonance artifacts and increasing the temporal resolution.
Unlike Cartesian, but like concentric shells trajectories, spirals are designed toexploit the slew rate of the gradient system (in low resolution imaging) for their
78

7.3 discussion
entire duration. Thus, they sample k-space very efficiently. In this chapter it wasshown that a reduction of the slew rate at the outer parts of the spirals allows agood compromise between sampling speed and peripheral nerve stimulation. Thisconcept can be transfered to shells and other trajectories.
The 0th-order polynomial of the Taylor expansion of the Larmor frequency withrespect to the spatial position leads to blurring in the case of the shells and togeometric distortions in the case of the stack of spirals trajectory, respectively(Figure 20a-c). However, this can be corrected for by a suitable off-resonancecorrection, as demonstrated in (d-f).
Conceptually, the main modification from concentric shells to SoS is changingthe slowest encoding direction from radial to Cartesian. Thereby, the stack ofspiral trajectories loose the near isotropic imaging behavior, which is inherent toconcentric shells due to their near 3D rotational symmetry. The SoS trajectorygains the freedom to align the slowest encoding direction with the most severeoff-resonance gradient, resulting in significant artifact reduction. As shown inFigure 9 in combination with Figure 20 (d), the most prominent source of artifactin concentric shells images is a positive dωor/dz above the sinus frontalis. It wasfound that matching the slowest encoding direction of the trajectory with this off-resonance gradient results in the least signal attenuation. However, for investigatingcertain parts of the brain, the stack of spirals trajectory can be rotated for artifactminimization in that particular area.
The off-resonance behavior of different trajectories was analyzed by employingthe concept of local k-space in combination with point spread functions. Similarto the standard concept of k-space, local k-space describes the spatial informationacquired for the considered point in position space. The maximal spatial frequencycorresponds to the voxel size as defined in Equation (4.9). The Nyquist theoremapplies as well, as demonstrated by point spread functions in Figure 15. Thetrajectories in local k-space (Figure 14 and 26) demonstrate the loss of spatialinformation in the presence of off-resonance gradients and thus reveal the limits ofoff-resonance correction.
An off-resonance gradient opposing the slowest encoding direction of the trajec-tory causes the most severe artifacts. It was shown that acquiring the central part oflocal k-space is essential for maintaining the signal intensity. An off-resonance gra-dient that squeezes the trajectory to half its size can be considered as a cut-off value.Stronger off-resonance gradients opposing the slowest encoding direction preventthe acquisition of the center of k-space. Areas in which |~klocal| > π/2 rad/voxelis fulfilled for the entire local trajectory are printed white in Figure 17. Thoseareas show good agreement with the areas of signal dropout in Figure 20 (f). Forconcentric shells, the cut-off value for acquiring the center of k-space is less obvious.
Off-resonance gradients aligned with the slowest encoding direction stretch thetrajectory. Acquiring higher spatial frequencies theoretically results in a locallyhigher resolution. However, it was shown that high undersampling factors comealong with the elongation of the trajectory and lead to residual aliasing (Figure 15).Furthermore, strong non-linearities of the Larmor frequency variations are presentin the affected areas. The overall appearance is blurring in the resulting image e.g.above the sinus frontalis in Figures 20 (f). The same effect occurs in the spin echoMREG images above the sinus frontalis (Figure 27).
79

spherical stack of spirals trajectories
Off-resonance gradients perpendicular to the slowest encoding direction tilt thestack of spirals trajectory. The cut-off value for signal dropout is approximatelydouble the size compared to a gradient opposing the slowest encoding direction.Figure 17 displays the effect of the entire off-resonance gradient on the effectiveecho time.
Local k-space describes only linear effects and, therefore, only the spatial encodingwith respect to the immediate neighbor of the point under consideration. At the sub-voxel scale, higher orders of the spatially varying Larmor frequency are describedby the T′2-decay. However, non-monotonous frequency variations can also affect theimaging behavior on a scale of multiple voxels. An off-resonance gradient opposingthe slowest encoding direction squeezes the image, if no off-resonance correction isapplied. In other words, the distance between neighboring voxels is decreased. Ifthe off-resonance gradient exceeds the average speed of the trajectory, its travelingdirection is inverted, resulting in a negative voxel distance. As a consequence, theneighboring voxels can overlap independent of the off-resonance gradient at theirown position. This overlap results from an ambiguity of the sum of the encodinggradient and the off-resonance frequency variations and cannot be undone withoutfurther knowledge. This gedankenexperiment reveals the limitation of the conceptof local k-space to linear and monotonous effects. In general, those considerationsapply to any trajectory, but the appearance of ambiguities is less obvious fortrajectories like concentric shells.
The off-resonance behavior of concentric shells is similar to the one of 2D spirals,since both acquire the radial dimension of k-space slowest. The 2D equivalent ofthe stack of spirals is the EPI trajectory. Both have the slowest encoding directionaligned with a Cartesian axis of k-space. Thus, the stack of spirals trajectory inheritsthe benign off-resonance behavior of EPI while using the degree of freedom comingalong with the 3rd dimension for efficient non-Cartesian sampling. Overall, the stackof spirals trajectory outperforms concentric shells in terms of signal attenuation.Furthermore, the stack of spirals trajectory allows a field of view reduction in onedirection. The gained acquisition time can be either invested in higher spatialresolution (Figure 25) or in higher temporal resolution in combination with artifactreduction.
The T∗2 -decay was shown to have only minor impact on image quality (Figure 18)and leads mainly to signal reduction as a function of the effective echo time.Good overall agreement can be seen when comparing the spatial distribution ofthe effective echo time (Figure 17) to the signal intensity in the correspondingimage (Figure 20f). The assumption of a spatially constant T∗2 was adopted fromDeichmann et al. (2002). While linear effects have been taken into account byintroducing the effective echo time in Equation (6.8’), the effect of macroscopic non-linear magnetic field inhomogeneities on T∗2 remains an open question. A significantreduction of the effective echo time potentially reduces the BOLD sensitivity. Inareas with strong off-resonance gradients one would expect non-linearities to beabove average as well. Thus, a reduction of T∗2 is expected in the affected areas.The two effects described are therefore expected to counteract in terms of BOLDsensitivity.
At a single point in time, the T′2-decay can be resolved by acquiring the MREGdata during the formation of a spin echo. Figure 27 demonstrates the preservationof the signal intensity when the center of k-space is acquired simultaneously with
80

7.3 discussion
the spin echo. Nevertheless, blurring artifacts remain. They are due to trajectorydeformations resulting from dephasing before and after the spin echo. Unmatchingthe spin echo and the acquisition of the center of k-space results in signal dropoutwhich is not an exponential function of ∆TE. The coverage of the center of localk-space plays a major role in signal formation. A detailed signal analysis involves anon-trivial combination of T2- and T′2-effects as outlined in Equation (7.10).
An examination of the tSNR reflects similar behavior for `1- and `2-regularization.Both regularization techniques exhibit a peak in the tSNR near the visually chosenregularization parameters, supporting this choice. However, in the case of `2-regularization, the visually best results are achieved with a slightly smaller λ,compared to the tSNR optimal regularization. At the optimum, the image quality israther sensitive to changes of λ. Nevertheless, the tSNR provides some informationfor choosing the regularization parameter. In the end it is a trade-off betweenspatial fidelity and tSNR.
For the calculation of the tSNR, Gaussian noise was assumed. This is notstrictly correct, since physiological effects lead to non-Gaussian signal fluctuations.Furthermore, the absolute value of the signal - which is used for the fMRI analysis -is actually Rice-distributed. It is assumed that the statistical error arising from thenon-Gaussian distribution is not affected by the reconstruction technique. Thus,this simplistic approach is still used to analyze the image reconstruction.
All signal fluctuations were assumed to be noise in the calculation of the tSNR,except for the BOLD signal and low order drifts. However, part of the motivation ofincreasing the temporal resolution in fMRI is the acquisition of physiological signalfluctuations unaliased with the BOLD contrast (Figure 21). Including respiratoryand cardiac signal fluctuations as a confounding factor in the signal analysisimproves the sensitivity of fMRI (Posse et al., 2012; Jacobs et al., 2014; Proulx et al.,2014). Glover et al. (2000) showed a convenient way to remove respiratory andcardiac signal fluctuations for the time series. This effectively increases the tSNRand also improves the assumption of a Gaussian noise distribution.
The possibilities and limitations of MREG with increased spatial resolution wereexamined. Increasing the reconstruction grid results in improved anatomical imageswhen employing `1-norm regularization in the total variation domain. However, theactivation pattern seems to be hardly affected at all. For the data shown in Figure 24,the gradient encoding did not acquire any data beyond kmax = ±π/(3 mm).Furthermore, coil sensitivities have a rather smooth profile. Thus, an increase inresolution can only originate from regularization. In the anatomical scan, goodcontrast is given between gray/white matter and CSF. This setup is ideal for totalvariation regularization. The iterative algorithm converges to the solution thatmatches the measured low-resolution data while providing the least total variation.Due to the edge preserving property of the `1-norm, the image exhibits sharpboundaries rather than smooth transitions. The result is a good approximationof the underlying anatomy. On the contrary, the steady state contrast betweendifferent tissues is rather low in MREG, as is the BOLD contrast. Thus, totalvariation regularization leads to a smoothing of the images, while no further spatialinformation is present in the image reconstruction. The smoothing due to extensivetotal variation regularization is block wise and fundamentally different to a lowpass filter. As a consequence, no additional spatial information is introduced whenincreasing the matrix size and the activation pattern shows no increase in resolution.
81

spherical stack of spirals trajectories
When acquiring higher spatial frequencies with gradient encoding, an increasedresolution can be noted in both anatomy and activation pattern (Figure 25). How-ever, the "ground truth" of the activation is unknown. Furthermore, higher spatialresolution results in a decreased SNR in MRI. This decreases the Student’s t-valuesin the dataset with 2 mm isotropic resolution.
Compared to standard EPI, MREG with stack of spirals trajectories show anincreased BOLD sensitivity, especially for event related activation such as epilepticspikes (Jacobs et al., 2014; Proulx et al., 2014). Furthermore, Lee et al. (2013)demonstrated that resting state networks contain information at higher frequencieswhich are not accessible by standard EPI. Spherical stack of spirals trajectoriesmaintain signal intensity in the prefrontal cortex. This is a crucial area of the defaultnetwork for instance. Stack of spirals trajectories therefore allow for the analysis ofhigher frequency components of the default network, which has not been possiblebefore.
Higher magnetic fields lead to an increase of field inhomogeneities due to sus-ceptibility differences, preventing the direct application of the proposed stack ofspirals trajectory at 7 T or even 9.4 T. Since a higher field strength reduces T∗2 ,the echo time can be reduced as well. This facilitates shorter trajectories whensacrificing some spatial resolution or segmenting the trajectory. Realizing singleshot imaging with full brain coverage and 3 mm isotropic resolution necessitatesadditional hardware, e.g. more receive coils that provide additional spatial informa-tion (Wiggins et al., 2009). Alternatively, one could employ fast gradient inserts toreduced peripheral nerve stimulation (vom Endt et al., 2007) and, thus, facilitate amore efficient sampling of k-space. Also, novel shimming approaches (Juchem et al.,2010) reduce the magnetic field variations and, hence, allow for longer trajectories.Furthermore, alternate imaging strategies like PatLoc (Hennig et al., 2008) promisea more efficient sampling for specific regions of interest. The increased BOLDsensitivity at higher field strengths, especially for smaller vessels (Gati et al., 1997),makes spin echo fMRI a powerful tool. The possibility for spin echo MREG will bediscussed in the following chapter.
82

8D E L AY E D - F O C U S P U L S E S
Whereas gradient echo fMRI offers a strong sensitivity, spin echo fMRI is com-pelling due to its specificity and artifact reduction, as outlined in Section 4.4.1. InSection 7.2.5, the benefit of a refocusing of the magnetization was demonstrated forMREG: the signal attenuation is greatly mitigated. Deichmann et al. (2002) analyzedthe dependency of the gradient echo BOLD sensitivity on macroscopic magneticfield inhomogeneities. The question arises, whether (partially) compensating thespin dephasing could be beneficial for the BOLD sensitivity, especially in areas withstrong susceptibility gradients. Changing ∆TE, as defined in Equation (7.7), allowsfor the analysis of the BOLD sensitivity as a function of the effective echo time andfor further optimization of the sequence with respect to a target area of the brainin that regard. A flexible trade-off between the good intrinsic BOLD sensitivityof MREG and the specificity of spin echo fMRI would enable the analysis of theunderlying processes as well as the optimization regarding a particular application.Subject of this chapter is the design of RF-pulses that lead to refocusing of themagnetization and meet the experimental conditions of MREG.
The (π/2)-π-pulse sequence used in Section 7.2.5 is not feasible for a repetitiontime of 100 ms, since it completely destroys the longitudinal magnetization andresults in a very small steady state magnetization. In Section 3.4.1, a sequence ofa (π − α)-excitation (with 0 < α < π/2) and a π-refocusing pulse was discussed.This sequence does not destroy the longitudinal magnetization completely, butthe excitation pulse rotates the magnetization onto the southern hemisphere, assketched in the top row of Figure 1. As a consequence, T1-relaxation destroys mostof the longitudinal magnetization, if the two pulses are separated by a significantamount of time. For that reason, this pulse sequence is not feasible for MREGas well. Also a combination of a small excitation and a small refocusing pulse isnot feasible, since the resulting echo scales with sin αexc · sin2(αref/2), according toEquation (3.16).
In the following, Hahn’s assumption of complete dephasing is dropped. Con-sidering any sequence of RF-pulses as a composite pulse, the possibilities andboundaries of spin echo forming pulses, i.e. delayed-focus pulses (Wu et al., 1991),are discussed. By geometrical considerations, the maximal echo time for a givenpulse length and flip angle is derived. It is shown that the time between the endof the pulse and the echo can exceed the length of the RF-pulse. This stands incontrast to Hahn echoes, where pulse duration and echo time are at most equal.Thereafter, the possibility of calculating those pulses in the regime of weak dephas-ing is demonstrated. It is shown how the experimental conditions of MREG are notmet by the proposed RF-pulses and why spin echo MREG seems to be out of thepermissible range. Beyond fMRI, proof of concept applications of the delayed-focuspulses are presented at the end of this chapter.
Part of this work has been published in conference proceedings (Assländer andHennig, 2013; Assländer et al., 2014).
83

delayed-focus pulses
8.1 theory
8.1.1 Hahn’s Pulse Sequence in the Regime of Weak Dephasing
In Section 3.4, Hahn’s theory of spin echo formation was reviewed, which forms thebasis of most spin echo experiments in MR. It is based on the assumption of com-plete dephasing, hence enforces the second and third summands in Equation (3.16)to be zero, resulting in Equation (3.17). This condition can be approximately ful-filled by applying crusher gradients before and after the refocusing pulse. In thefollowing, the signal behavior of a sequence of two hard pulses is discussed whendropping this assumption.
x
y
z
x
y
z
x
y
z
x
y
z
ωx
0 ½ t/THE
π/2 π/2
x
y
z
x
y
z
x
y
z
x
y
z
|S|
½ 1 1.55 t/THE
Figure 28.: The simulations of the spin dynamics of Figure 3 is repeated withT′2 = 10 THE. The magnetization, which is displayed in the range∆ωfwhm · THE = 0.4π, wraps around the negative z-axis. The signalintensity does not reach its maximum at the designated THE, but atapproximately 1.55 THE. Please note the different scaling of the two timeaxes.
84

8.1 theory
Taking Hahn’s original (π/2)-(π/2)-pulse sequence and reducing the width ofthe Cauchy distribution of the magnetization density to T′2 = 10 THE
1, no echo isformed at the designated THE, but the signal maximum is reached at approximately1.55 THE (Figure 28). This is a consequence of the complex sum of the first twosummands in Equation 3.16.
This simple simulation demonstrates the necessity of complete dephasing inHahn’s theory of spin echo formation. The evolution of the transversal magnetiza-tion in Figure 28 is independent of the sign of the flip angle of the refocusing pulse:a π/2-(−π/2)-pulse results in the same signal behavior. However, the time courseof the signal strongly depends on the distribution of the magnetization density as afunction of the Larmor frequency.
Dropping the assumption of complete dephasing lifts the restriction on the echotime and the signal reaches its maximum later than the designated THE (Figure 28).Thus, this simple modification of Hahn’s experiment demonstrates the possibilityof increasing the echo time - in terms of maximal signal intensity - beyond the markof twice the time between the excitation and the refocusing pulses, which is thedesignated THE in Hahn’s theory.
0 0.1 0.2 0.3 0.4 0.50
0.1
0.2
0.3
0.4
0.5
THE/T′2
T max
sign
al/
T′ 2
Figure 29.: The blue line illustrates the time of maximal signal intensity in thetransition from the regime of weak dephasing (THE . 0.25 T′2) to theregime of complete dephasing. The dashed line indicates the designatedecho time in Hahn’s theory and is increasingly better approximated forlong THE. In contrast, Tmax signal differs significantly from THE in theregime of weak dephasing.
The time of maximal signal intensity is plotted in Figure 29 as a function ofTHE. For THE & 0.25 T′2, the signal maximum follows approximately Hahn’s theory,which is indicated by the dashed line. However, the signal maximum appearssignificantly later than THE for THE . 0.25 T′2.
1 For the calculation of the signal intensity, a frequency range of 4 · ∆ωfwhm was considered
85

delayed-focus pulses
8.1.2 The Maximal Echo Time as a Function of the Flip Angle
A spin echo forming pulse sequence can be sketched in two steps: first, a spinensemble is excited and dephases. Second, the phase slope of the magnetizationis inverted such that free precession leads to a spin echo formation. Thus, theachievable echo time depends on the phase difference accumulated in the stage ofdephasing. The Bloch equation prevents direct access to the phase difference oftwo spin isochromats, since hard pulses act on all isochromats in the same way.Only precession can create a phase difference, providing indirect access to phasedifferences between isochromats.
The Maximum Phase Difference
In the following, the on-resonant isochromat with ω0 ≡ 0 and an isochromat withthe infinitesimally small frequency dωz are described on the Bloch-sphere. Giventwo hard pulses with arbitrary flip angles and separated by the time TP, the maximalphase difference of the two isochromats is derived. In the following, a sequenceof hard pulses is treated as one composite pulse of the length TP. Describing thedynamics of the two spin isochromats in spherical coordinates, the evolution oftheir infinitesimally small phase difference dϕ after the first hard pulse with theflip angle α1 is given by
dϕ = TP · dωz. (8.1)
Without loss of generality, a rotation about the x-axis with 0 < α1 ≤ π/2 is assumed.Switching to a Cartesian coordinate system, this infinite phase difference can bedescribed by the Euclidean distance on the Bloch-sphere
dδ = TP · dωz · sin α1. (8.2)
The differential dδ measures the distance between the tips of the magnetizationvectors. Differentiation of this equation with respect to α1 reveals that the fastestgrowth of the Euclidean distance is achieved at α1 = π/2. Thus, the maximumEuclidean distance achievable within the time TP is
dδmax = TP · dωz. (8.3)
From now on α1 = π/2 is assumed, followed by the time TP of free precession.Applying the second hard pulse at TP, the entire spin ensemble is rotated by α2
while maintaining the Euclidean distance. If the phase of the RF-pulse varies fromthe first pulse, the Euclidean distance is partly converted into a different finalflip angle of the two isochromats. In contrast, a rotation of α2 about the x-axisconverts the entire dδmax into a phase difference and, thus, maximizes dϕ. Since theEuclidean distance is maintained by the second RF-pulse, the final phase differencecan be calculated by expressing dδmax in spherical coordinates as a function ofthe total flip angle αt = α1 + α2 = π/2 + α2. In small-angle approximation, theresulting spherical coordinate dϕmax is given by
|dϕmax| =TP · dωz
| cos α2|=
TP · dωz
| sin αt|. (8.4)
86

8.1 theory
Employing the absolute value, this equation is true for any α1, α2 and αt ∈ R.With dωz being infinitesimally small, the small-angle approximation is fulfilled, ifαt − n · π 0 ∀ n ∈ Z.
In conclusion, the maximal phase difference is achieved by first flipping themagnetization to the equator, where it dephases fastest, and then to a smaller finalflip angle such that the phase difference is amplified depending on αt. This effect isillustrated by Figure 30.
a
x
y
z b
x
y
z c
x
y
z
Figure 30.: The subplot (a) depicts magnetization that was excited from thermalequilibrium by a hard pulse with α1 = π/2 and precessed freelythereafter. In (b), the same magnetization is shown after rotating itto αt = π/10. In the same plot, the projection of the magnetization ontothe x-y-plane is displayed. By comparing the magnetization in (a) tothe angle of the projection in (b) (indicated by the black lines), one canrecognize the amplification of the phase difference. If the magnetizationis flipped to the hemisphere with positive y, the phase slope is inverted,leading to an echo formation (c).
The Echo Time as a Function of the Phase Slope
In Section 8.1.1, the π/2-π/2-pulse sequence was discussed in the weak dephasingregime. It created a spin echo - in terms of maximum signal intensity - at 1.55 THE.In Figure 28, one observes that directly after the second RF-pulse, the phase isconstant except for a jump at ωz = 0. Thus, the phase has a linear slope with ajump at the time of maximal signal intensity. Furthermore, the flip angle variessignificantly over Larmor frequencies. As a consequence, the isochromats do notcontribute equally to the resulting signal and the overall signal intensity is small.
In the following, shaped pulses are discussed that create spin echoes by aligningall spin isochromats within a given bandwidth at the echo time in some approx-imation. This condition translates into an approximately constant flip angle andan approximately linear, negative phase slope at the end of the pulse. Followingthe notation of Gershenzon et al. (2008), the latter quantity can be described by thedimensionless phase slope
R =1
TP
dϕ
dωz, (8.5)
where TP denotes the duration of the entire RF-pulse. Echo time and bandwidthscale with the length of the pulse. Eliminating this scaling factor, R solely describesthe effect of the shape of the pulse. For instance, a rectangular excitation pulse hasR = 2/π, while the π/2-π-pulse sequences described above, has R = −1 when
87

delayed-focus pulses
assuming hard pulses. In general, negative R-values lead to a spin echo formation.To the author’s knowledge, all RF-pulses published so far are limited to either|R| ≤ 1 with arbitrary RF-amplitude or to |R| < 1 with limited RF-amplitude.Given this R-value, one can define the echo time
TER = −R · TP, (8.6)
where all spin isochromats under consideration are in phase. Please note that TER
is measured beginning from the end of the pulse, contrary to the THE, which ismeasured from the middle of the excitation pulse. A negative TER corresponds tosome time before or during the RF-pulse at which the magnetization would have tobe in phase in order to create the particular phase slope by free precession.
Combining Equation (8.4) and (8.5), the maximal echo time is defined by thedimensionless value
|Rmax| =1
| sin αt|. (8.7)
The limit |R| ≤ 1 is valid for αt = π/2, but can be exceeded for other flip angles,allowing TER > TP. For this appraisal a sequence of two hard pulses was considered.But as stated before, any shaped RF-pulse can be approximated arbitrarily well bya sequence of hard pulses. Furthermore, two spin isochromats were considered,which are separated by an infinitesimally small Larmor frequency. However, theaim in practical settings is to refocus all magnetization within a finite frequencyrange. Nevertheless, Equation (8.7) can be considered as an upper limit for anyRF-pulse.
8.2 methods
8.2.1 RF-Pulse Design
Optimal Control Algorithm
The RF-pulses presented in this chapter were calculated employing optimal control,which is a generalization of the classical Euler-Lagrange formalism (Pontryagin,1962). This approach was brought to the field of MR by Conolly et al. (1986). Avery nice formulation of the theoretical background can also be found in (Pinch,1993) and - MR-specific - in (Skinner et al., 2003). The goal is to find the optimalcontrol, i.e. RF-pulse, with respect to a given criterion. For the present excitationproblem, the initial magnetization is assumed to be aligned along the z-axis, i.e.~M(0) = (0, 0, 1)T, and the magnetization ~M(TP, ωz) after application of an RF-pulseof the length TP is examined. The quality factor
φ(ωz) =~MT(ωz) · ~M(TP, ωz) ∈ [−1, 1] (8.8)
quantifies the difference between the target magnetization ~MT(ωz) and the finalmagnetization (Skinner et al., 2003). An optimal RF-pulse would entail φ = 1 forall Larmor frequencies of interest. This condition is usually not accomplishablefor all frequencies of interest by a pulse of finite duration. Therefore, the first-order necessary condition for an optimal solution is used instead: if an RF-pulseis optimal, a small perturbation of the RF-pulse δωx,y(t) ∈ C causes no change in
88

8.2 methods
the cost function. While maximizing φ(ωz), compliance to the three componentsof the Bloch Equation (2.46) is ensured with three Lagrange multipliers, which aredenoted by the vector ~Λ. As demonstrated by Skinner et al. (2003), an optimalRF-pulse fulfills
~M(t, ωz) = ~ω(t, ωz)× ~M(t, ωz), ~M(0) = (0, 0, 1)T (8.9)
~Λ(t, ωz) = ~ω(t, ωz)× ~Λ(t, ωz), ~Λ(TP, ωz) =~MT(ωz) (8.10)
0 = ~M(t, ωz)× ~Λ(t, ωz). (8.11)
The rotation caused by the RF-pulse and the off-resonance frequency are jointlydenoted by ~ω(t, ωz) = (Reωx,y(t), Imωx,y(t), ωz)T. Interestingly, the Lagrangemultiplier fulfills the Bloch equation and is equal to the magnetization for anoptimal solution.
For a given bandwidth of interest ∆ωz, the cost function is evaluated for the off-resonance frequencies ω
(i)z ∈ −∆ωz/2,−∆ωz/2 + 20π rad/s, . . . , 0, . . . , ∆ωz/2.
The total quality factor Φ ∈ [−1, 1] is given by the weighted sum over all frequencies:
Φ ≡∑i
W[ω(i)z ] · φ[ω(i)
z ]. (8.12)
The weighting factor is defined by
W[ω(i)z ] ≡
100 · δω
(i)z ,0
+ (1− δω
(i)z ,0
) exp(−(
ω(i)z /σor
)2)
∑i
(100 · δ
ω(i)z ,0
+ (1− δω
(i)z ,0
) exp(−(
ω(i)z /σor
)2)) (8.13)
and describes a Gaussian curve with the standard deviation σor. The Kroneckerdelta δ
ω(i)z ,0
weights the on-resonant Larmor frequency, i.e. ω(i)z = 0, by a large factor.
This ensures the correct flip angle for the on-resonant isochromat. The denominatorassures ∑i W[ω
(i)z ] = 1 and normalizes the total quality factor.
The RF-pulse is approximated by a series of hard pulses, each followed by a timeof free precession ∆t. The pulse shape is optimized iteratively with the gradientdescend method described by Skinner et al. (2003) and Janich et al. (2011):
1. Choose an initial RF-pulse ~ω(1,2)[t] (first two elements of the frequency vector)
2. Evolve ~M[0, ω(i)z ] for all frequencies forward in time
3. Evolve ~M[TP, ω(i)z ]× ~Λ[TP, ω
(i)z ] for all frequencies backwards in time
4. Update the RF-pulse:
~ω(1,2)[t]→ ~ω(1,2)[t] + ξ ∑i
W[ω(i)z ] ·
(~M[t, ω
(i)z ]× ~Λ[t, ω
(i)z ])(1,2)
5. Truncate |~ω(1,2)[t]| at the maximal RF-amplitude
6. Calculate the RF-energy: ERF = ∑t
∣∣∣~ω(1,2)[t]∣∣∣2· ∆t
7. If ERF > Emax: ~ω(1,2)[t]→ ~ω(1,2)[t] ·√
Emax/ERF
89

delayed-focus pulses
8. Repeat steps 2-7 until a convergence of Φ is reached.
The step size ξ of the gradient descent is calculated with line search (Bryson, 1975).For each frequency, only two evolutions along time (steps 2 and 3) are necessaryin order to calculate the gradient ∑i W[ω
(i)z ] ·
(~M[t, ω
(i)z ]× ~Λ[t, ω
(i)z ])(1,2)
, causing
optimal control to be very efficient.
Optimization Parameters
All pulses were approximated by 50 instantaneous rotations, each followed by anequidistant time of free precession. As start values, 10 random real valued pulseswere generated. The amplitudes for each instantaneous rotation were normaldistributed within the range of [−6000 rad/s, 6000 rad/s]. The imaginary part ofthe start values were set to zero, since a symmetric problem suggests real pulses.However, complex pulses were allowed in the optimal control algorithm. All pulseswere optimized for a bandwidth of ∆ωz = 3000 rad/s. The pulse optimization wasperformed in a three-step process: first, all 10 pulses were optimized in 10 iterations.Second, the best 5 pulses were optimized in 100 iterations. Third, only the bestpulse was further optimized. In order to improve convergence, a narrow weightingfunction with σor = 100 rad/s was used for the first two optimization steps. In thethird step, the standard deviation was increased in 20 steps to σor = 1000 rad/s andin each step an optimal control optimization was performed with 5000 iterations.
Pulses were calculated for R ∈ −5,−4.9, . . . , 5 and αt ∈ 0.5°, 1°, . . . , 90° witha fixed pulse length of TP = 10 µs and TP = 500 µs. Pulses were calculated withoutany limitations of the RF-amplitude in order to demonstrate the physical boundaries.The optimization process was repeated for TP = 500 µs with a maximum RF-amplitude of 10 000 rad/s and a limitation of the total energy deposition Emax =
6125 rad2/s, which was heuristically found to meet the SAR-limitations (specificabsorption rate) at a repetition time of 8 ms.
The pulse calculations were repeated for the parameters R ∈ −5,−4.9, . . . , 5and TP ∈ 50 µs, 100 µs, . . . , 5000 µs at a fixed flip angle of αt = 3.5° with andwithout RF-limits.
8.2.2 Experiments
Measurements with one of the proposed pulses were performed at a 3 T MAG-NETOM Trio scanner (Siemens, Erlangen, Germany) using a standard FLASHsequence modified to read external pulse files. The proposed pulse with R = −1.3,TP = 500 µs and a flip angle of 3.5° was used for non-selective excitation. Forcomparison, all acquisitions were repeated with the same imaging parameters,but using a 100 µs rectangular RF-pulse for excitation. Three dimensional spatialencoding was performed in a Cartesian manner with the readout gradient in thesuperior-inferior direction. The echoes were acquired asymmetrically in order toreduce the echo time. Phase encoding in left-right and anterior-posterior direc-tion was performed in agreement with the Nyquist theorem and without partialFourier. In the two phase encoding directions, only an elliptical extent of k-spacewas sampled in the interest of time.
90

8.3 results
In the image reconstruction process, the asymmetric echo was addressed by thePOCS algorithm (Haacke et al., 1991). Thereafter, the images were interpolated byzero-filling k-space by a factor of 4 in all directions (see Section 4.1.2), followed by astandard FFT reconstruction and a sum of squares combination of the individualRF-channels.
Lung Imaging
A volunteer’s lung was imaged during inhalation. Each image was acquired withina single breath-hold. The combination of the manufacturer’s spine array and abody surface coil array was used for signal reception. The imaging parameters wereTR = 3.5 ms, TE = 0.63 ms (measured from the end of the pulse), resolution =
3 mm × 3 mm × 5 mm, FOV = 960 mm × 480 mm × 240 mm and a dwell time of3.5 µs. The echoes were acquired asymmetrically: 88 data points before and 160after the echo. Based on the approximate linearity of the proposed pulses for smalltip angles (see Section 8.3), the pulse was used at a flip angle of 1.7° in order tomeet SAR limitations.
To demonstrate the signal behavior in the vessels in the lung, a maximum intensityprojection (MIP) was calculated: over a 5 cm slab through the heart, the voxels withthe maximum absolute value in anterior-posterior direction were condensed intoa single image. Furthermore, the SNR was estimated in a region of interest in aposterior slice assuming Gaussian distribution.
Head Imaging
The same RF-pulse was employed for acquiring images of a volunteer’s head. Theparameters were TR = 8 ms, TE = 0.63 ms (measured starting from the end of thepulse), resolution = (1.3 mm)3, FOV = 512 mm × 256 mm × 256 mm, dwell time= 5.8 µs and 4 averages. The original flip angle of 3.5° was used. The echoes wereacquired asymmetrically: 24 data points before and 192 after the echo.
8.3 results
8.3.1 RF-Pulses
In order to provide an empirical estimate of the possibilities and boundaries ofdelayed-focus pulses, the quality factors (Equation 8.12) of approximately 75 000pulses are displayed in the Figures 31 and 32. Their difference to the optimalquality factor 1 is plotted on a logarithmic scale. Blue areas indicate pulses whichalign the magnetization well with the target magnetization, while yellow and redareas represent parameters for which the optimal control algorithm did not findappropriate pulses. Small flip angles and weak dephasing both result in overallsmall errors of the quality factors such that pulses with 1 − Φ & 10−4 can beconsidered as not applicable.
In Equation (8.7), a theoretical limit |Rmax| was derived as a function of the flipangle. This limit is indicated by the white lines in Figure 31. The contours of thequality factors run approximately parallel to the theoretical limit. Within this limit,a plateau of quality factors with 1−Φ . 10−7 can be observed. This area represents
91

delayed-focus pulses
20 40 60 80−5
−3
−1
1
3
5
αt []
R
10−7
10−6
10−5
10−4
10−3
1−
Φ
Figure 31.: The error of the quality factor is displayed for various pulses on alogarithmic scale. The pulses have a duration of TP = 10 µs. ArbitraryRF-amplitudes were allowed during the optimization process. The graylines indicate the R-values achieved by free precession and Hahn’s pulsesequence, respectively. The white lines depict the theoretical limit Rmax.
pulses with excellent performance. In combination with the theoretical limit, themap suggests an error of approximately 10−6 as a boundary of acceptable pulseperformance. As derived within the appraisal in Section 8.1.2, |R| > 1 is indeedtangible for small flip angles. However, the plateau narrows for higher flip anglesand its boundary asymptotically approaches |R| = 1, as does the theoretical limit.One hard pulse followed by free precession and Hahn’s sequence of two hard pulsesresult in R = 1 and R = −1, respectively. Those values are highlighted by the graylines. The noise-like variations of the quality factors are due to convergence issuesof the algorithm and do not contain a physical meaning. Also, small differencesbetween the quality factors at positive and negative R-values can be noted. Theyare assumed to be caused by different convergence behavior and also no physicalmeaning is known.
For a pulse duration of 500 µs, the contours of the quality factor do not matchthe shape of the theoretical limit anymore (Figure 32a). A qualitative agreement ofthe shapes is, however, still given. The practical limit (given by the quality factor)stays below the theoretical one over the entire map, supporting the appraisal forRmax as an upper boundary. For small flip angles, |R| > 1 is still achievable at thispulse duration and the plateau narrows down to |R| ≤ 1 for high flip angles similarto Figure 31.
Figure 32 (c) demonstrates the dependency of the quality factor on the pulseduration in more detail. The theoretical limit of Rmax ≈ 16 is not reached for TP &100 µs. For long pulse durations, the boundary of reasonable pulse performanceasymptotically approaches the R achieved by Hahn’s pulse sequence (|R| = 1). Forlong pulses, stronger dephasing is necessary in order to realize a given R. Thus,long pulses can be referred to as the regime of strong dephasing at which Hahn’slaw of echo formation (Equation 3.17) applies. In contrast, |R| > 1 is possible forshort pulses, which corresponds to the regime of weak dephasing.
92

8.3 results
a
20 40 60 80−5
−3
−1
1
3
5
αt []
R
b
20 40 60 80αt []
10−7
10−6
10−5
10−4
10−3
1−
Φ
c
1 2 3 4 5−5
−3
−1
1
3
5
TP [ms]
R
d
1 2 3 4 5TP [ms]
10−7
10−6
10−5
10−4
10−3
1−
Φ
Figure 32.: The error of the quality factor is displayed for various pulses on alogarithmic scale. The pulse duration was fixed to TP = 500 µs in (a, b)and in (c, d) all pulses have a flip angle of 3.5°. The quality factorsin (a, c) represent pulses with arbitrary RF-amplitudes. (b, d) depictspulses with limited RF-amplitude and power. The gray lines indicatethe R achieved by Hahn’s pulse sequence, while the white lines depictthe theoretical limit Rmax derived in Equation (8.7). The red circle andsquares highlight the pulses with R = −4.3, TP = 150 µs, αt = 3.5° andR = −1.3, TP = 500 µs, αt = 3.5°, respectively. Their pulse shape can befound in Figure 33 and 34.
93

delayed-focus pulses
The quality factor map in Figure 32 (a, c) represents pulses that were calculatedwithout any limitations to the RF-amplitude. In this case, the achievable pulseperformance is symmetric about R = 0. When limiting the RF-amplitude and totalamount of energy deposition, this symmetry is lost (Figure 32b, d). The best pulseperformance for αt = 90° is at R ≈ 2/π (Figure 32b), which is the phase sloperesulting from a rectangular pulse.
As shown in Figure 32 (d), no reasonable pulse was found for R = −1 andTP = 5 ms with the given parameters. The restrictions of energy depositionprohibits a standard Hahn sequence. However, in the regime of weak dephasing, i.e.for shorter pulse durations, pulses with R ≤ −1 are still possible. In this simulation,the highest |R| values were achieved at TP = 100 µs. For shorter pulses, thelimitation of the RF-amplitude prevents good performance for steep phase slopeswhile longer pulses are mainly limited by the total amount of energy deposition.
All four sub-figures show a clear boundary where the quality factor crosses theconsidered limit of 1−Φ = 10−6 and increases by multiple orders of magnitude.The pulse with the parameters R = −4.3, TP = 150 µs and αt = 3.5° possesses anerror of the quality factor of 8.0 · 10−6. The pulse is highlighted by the red circlein Figure 32 (d). In Figure 33, the pulse shape is depicted along with the spindynamics during the application of the pulse to longitudinal magnetization. Similarto the gedankenexperiment shown in Figure 30, the magnetization dephases afterexcitation. After approximately 70 µs, the sign of the RF-pulse changes and themagnetization rotates back towards the z-axis. By rotating the magnetization tothe other hemisphere, i.e. changing the sign of My, the phase slope is inverted,resulting in a negative R.
x
y
z
x
y
z
x
y
z
x
y
z
ωx[rad/s]
10000
5000
0
−5000
−10000
−100 −50 0 645 t [µs]
Figure 33.: The real part of the RF-pulse, resulting from the optimization withthe parameters R = −4.3, TP = 150 µs and αt = 3.5°, is shown. Theimaginary part of the pulse is negligible. The Bloch-spheres illustratethe dynamics of the magnetization during the application of the pulseto longitudinal magnetization. A bandwidth of ∆ωz = 3000 rad/s isdisplayed.
94

8.3 results
Figure 34 depicts the pulse, resulting from optimization with a similar target mag-netization but at a longer pulse duration of TP = 500 µs. This pulse is highlightedby red squares in Figure 32 (b, d). The error of the quality factor is approximately2.5 · 10−6 and therefore slightly lower compared to the 150 µs pulse, yet, still abovethe suggested limit of 10−6. The pulse changes its sign twice: first, the magnetiza-tion dephases on the target hemisphere (negative My) and is thereafter rotated tothe other hemisphere (positive My). Here, it refocuses and dephases again. Finally,it is flipped back to the target hemisphere (negative My), resulting in a negativephase slope. Comparing the second and last Bloch-sphere, one can see the changeof the order of the color-coded spin isochromats. This corresponds to a changeof the sign of R. In both presented pulses, fast dephasing is achieved at large flipangles which are amplified by flipping the magnetization back to smaller flip angles,similar to the artificial pulse used for the geometrical considerations in Section 8.1.2.
x
y
z
x
y
z
x
y
z
x
y
z
ωx[rad/s]
8000
4000
0
−4000−400 −300 −200 −100 0 t [µs]
Figure 34.: The real part of the RF-pulse, resulting from the optimization withthe parameters R = −1.3, TP = 500 µs and αt = 3.5°, is shown. Theimaginary part of the pulse is negligible. The Bloch-spheres illustratethe dynamics of the magnetization during the application of the pulseto longitudinal magnetization. A bandwidth of ∆ωz = 3000 rad/s isdisplayed.
The resulting magnetization is displayed in Figure 35 for both pulses. Anincrease of the flip angle as a function of the off-resonance frequency can beobserved, especially for the 150 µs pulse. Comparing this result to the spin dynamicsillustrated in Figure 33, one perceives a dephasing of the magnetization along acone. After flipping the magnetization to the hemisphere with positive y, this coneis approximately maintained, resulting in the described flip angle curve and in aflattening of the phase slope with increased off-resonance frequencies (Figure 35b).
The magnetization at the end of the 500 µs pulse shows good agreement with thetarget magnetization in the absolute value (Figure 35a). As shown in Figure 34, thespin ensemble dephases on the target hemisphere (negative My) forming a cone.The magnetization then changes hemispheres twice while maintaining the originalcone shape to some degree but with an inverted phase slope. This results in a
95

delayed-focus pulses
0
0.1
0.2
0.3a
|M⊥|/|~ M|
~M(TP = 150 µs, R = −4.3, αt = 3.5)~M(TP = 500 µs, R = −1.3, αt = 3.5)~M(TP = 500 µs, R = −1.3, αt = 1.7)~MT
−4000 −3000 −2000 −1000 0 1000 2000 3000 4000−2
−1
0
1
2b
ωz [rad/s]
ϕ[r
ad]
Figure 35.: The absolute value of the magnetization at the end of the pulses andthe target magnetization used for the optimization of both pulses aredepicted in (a). Further, the magnetization of the 500 µs pulse is shownrescaled to 1.7°. In (b), the corresponding phase of the magnetizationis illustrated. The phase of the rescaled pulse matches exactly the oneresulting from the pulse at its original flip angle.
96

8.3 results
very flat flip angle over the target frequency band (Figure 35a). However, the flipangle increases strongly outside the target bandwidth. This is illustrated in therightmost Bloch-sphere of Figure 34: the magnetization is approximately alignedwith the x-axis. When comparing this plot with the homologous one in Figure 33,one can furthermore spot stretched red and blue areas. Those represent the largeoff-resonance frequencies which show a stronger phase-dispersion at the end of the500 µs pulse (Figure 35b). The phase is approximately linear in the target frequencyband. However, the slope is lower than the target one. A smaller phase slopecorresponds to a shorter echo time. This error reflects the increased error of thequality factor compared to the plateau in Figure 32 (d).
The 500 µs pulse was rescaled to a flip angle of 1.7°. The resulting magnetizationis also depicted in Figure 35. Compared to the original pulse, the absolute value ofthe transversal magnetization shows less variations as a function of the off-resonancefrequency (Figure 35a). This reflects that it is easier to create delayed-focus pulsesat low flip angles. The phase of the magnetization is unchanged in comparison tothe original pulse.
8.3.2 Experiments
Lung Imaging
Figure 36 and 37 depict images of a volunteer’s lung acquired with a 3D FLASHsequence. One dataset was acquired using a standard rectangular RF-pulse forexcitation and is used for comparison with the image acquired with the proposed500 µs delayed-focus pulse (Figure 34).
a b
Figure 36.: The central region of two maximum intensity projections of 3D lung im-ages are shown. The image acquired with a rectangular excitation pulseis shown in (a), while (b) depicts the dataset acquired with the proposed500 µs delayed-focus pulse. The arrows highlight blood vessels.
When comparing the MIPs (Figure 36), one can notice signal attenuation in someblood vessels in the standard gradient echo FLASH image (a), as indicated bythe arrows. However, when employing the proposed RF-pulse, the signal of the
97

delayed-focus pulses
highlighted blood vessels is maintained (b). Since the images were acquired in twodifferent breath holds, the slices are not exactly aligned. However, taking the MIPover a 5 cm slab, the effect of slight movement is expected to be negligible. Theimages were windowed equally. The different contrast in the tissue surroundingthe lung results from magnetization transfer effects (see next section for details).
a b
Figure 37.: The central part of a slice located in the posterior region of the lungis depicted for a rectangular excitation pulse (a) and for the proposed500 µs delayed-focus pulse (b). The boxes indicate the area over whichthe SNR was estimated.
The slice depicted in Figure 37 is located in the posterior part of the lung. Thesignal in the gradient echo FLASH image (a) is highly attenuated by susceptibilityeffects. In contrast, the magnetization is refocused by the proposed spin echoFLASH (SE-FLASH), resulting in a higher signal intensity (b). In the area indicatedby the white boxes, the signal to noise ratio is increased by a factor of approximately1.4 when applying the proposed pulse instead of the 100 µs rectangular pulse.
Head Imaging
The same RF-pulses were employed for imaging a volunteer’s head (Figure 38).The most apparent effect of the proposed delayed-focus pulse is an increasedcontrast between white and gray matter (b), compared to the standard FLASHimage (a). This is due to magnetization transfer (MT). As shown in Figure 35, theflip angle of the proposed pulse increases for large off-resonance frequencies. Thissaturates the magnetization of hydrogen bound in macro-molecules, which arespread over a large band of Larmor frequencies. In thermal equilibrium, some ofthe longitudinal magnetization is transfered from water to the macro-molecules,leading to attenuation of the water signal. The signal of the macro-molecules is notvisible in standard MR images, since it relaxes very fast. This effect is strongest inwhite matter and muscles due to a high density of macro-molecules.
Besides the MT effect, one can notice a signal increase in the bone marrow of theskull (arrows), when exciting with the proposed spin echo pulse (b). This originatesfrom two effects: As visible in Figure 35, the flip angle is slightly increased for
98

8.4 discussion
a b
Figure 38.: A sagittal slice of a volunteer’s head, acquired with a standard rectan-gular RF-pulse (a) and with the proposed 500 µs delayed-focus pulse(b). The arrows highlight the bone marrow in the skull. The white linesindicate the position of the inserted transversal and the sagittal slice,respectively. The such highlighted area comprises a tooth implant fixedby a metal screw.
off-resonant spin isochromats. Bone marrow mainly consists of fat, which has achemical shift of approximately 2700 rad/s at 3 T. The flip angle at the Larmorfrequency of fat is approximately twice as high as the flip angle at the Larmorfrequency of water (see Figure 35). On top of that, the marrow is close to the bone,where susceptibility differences cause frequency variations. This results in signalattenuation (a). However, when refocusing the magnetization with the proposedpulse, the signal is maintained (b). The effect is strongest close to the bone, resultingin a thinner appearance of the marrow in the GE-FLASH (a) compared to theproposed SE-FLASH (b).
The volunteer has a tooth implant which is fixed by a metal screw. The suscep-tibility of metal differs significantly from the one of biological tissue. This causessignal attenuation in the surrounding tissue as can be seen in the transversal slicedepicted in the lower right corner of Figure 38 (a). In contrast, the signal of thetissue surrounding the implant is maintained in the SE-FLASH image (b). Similarbehavior is apparent in the tissue between the teeth. Due to the susceptibilitydifference of the teeth compared to the surrounding tissue, the signal is attenuatedin the GE-FLASH (a) while it is maintained in the SE-FLASH image (b).
8.4 discussion
In this chapter the possibilities of forming spin echoes beyond Hahn’s theory wasexplored. The aim was to mitigate susceptibility artifacts in MREG experimentsand to facilitate spin echo MREG. In Section 8.1.2, a theoretical limit for the echotime was derived that suggests that echo times larger than the pulse durationare possible for small flip angles. The optimal control pulses shown in Figure 31
99
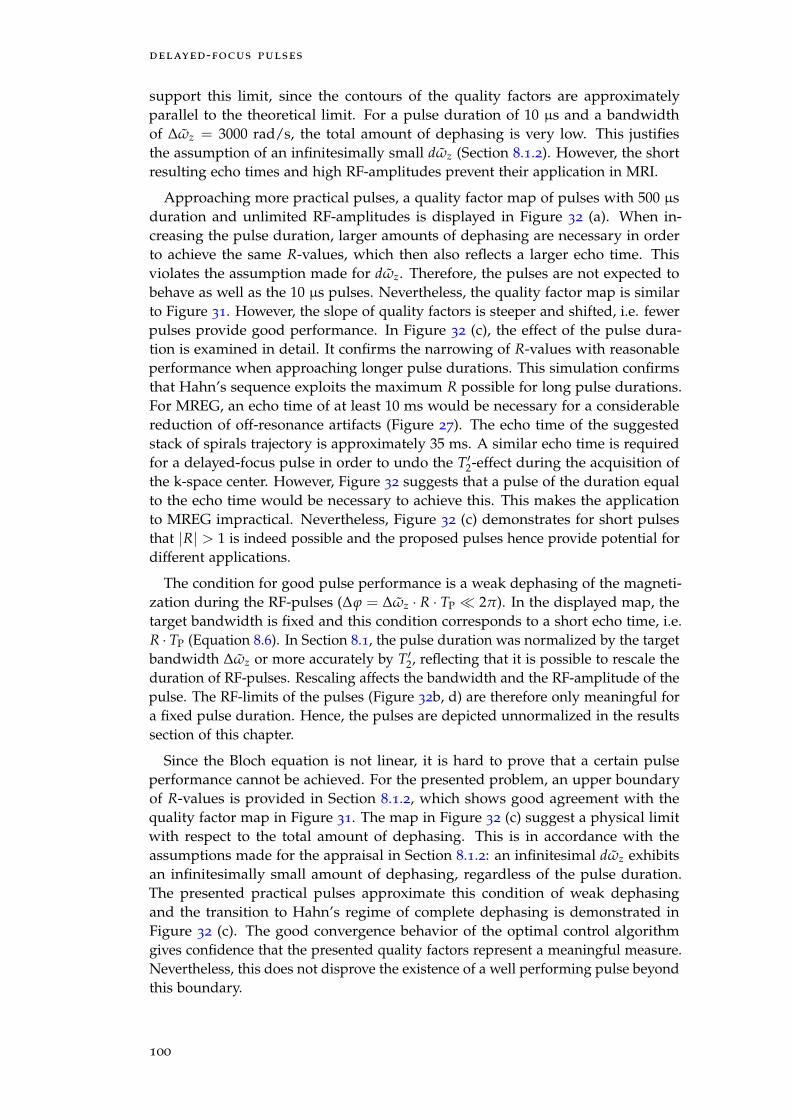
delayed-focus pulses
support this limit, since the contours of the quality factors are approximatelyparallel to the theoretical limit. For a pulse duration of 10 µs and a bandwidthof ∆ωz = 3000 rad/s, the total amount of dephasing is very low. This justifiesthe assumption of an infinitesimally small dωz (Section 8.1.2). However, the shortresulting echo times and high RF-amplitudes prevent their application in MRI.
Approaching more practical pulses, a quality factor map of pulses with 500 µsduration and unlimited RF-amplitudes is displayed in Figure 32 (a). When in-creasing the pulse duration, larger amounts of dephasing are necessary in orderto achieve the same R-values, which then also reflects a larger echo time. Thisviolates the assumption made for dωz. Therefore, the pulses are not expected tobehave as well as the 10 µs pulses. Nevertheless, the quality factor map is similarto Figure 31. However, the slope of quality factors is steeper and shifted, i.e. fewerpulses provide good performance. In Figure 32 (c), the effect of the pulse dura-tion is examined in detail. It confirms the narrowing of R-values with reasonableperformance when approaching longer pulse durations. This simulation confirmsthat Hahn’s sequence exploits the maximum R possible for long pulse durations.For MREG, an echo time of at least 10 ms would be necessary for a considerablereduction of off-resonance artifacts (Figure 27). The echo time of the suggestedstack of spirals trajectory is approximately 35 ms. A similar echo time is requiredfor a delayed-focus pulse in order to undo the T′2-effect during the acquisition ofthe k-space center. However, Figure 32 suggests that a pulse of the duration equalto the echo time would be necessary to achieve this. This makes the applicationto MREG impractical. Nevertheless, Figure 32 (c) demonstrates for short pulsesthat |R| > 1 is indeed possible and the proposed pulses hence provide potential fordifferent applications.
The condition for good pulse performance is a weak dephasing of the magneti-zation during the RF-pulses (∆ϕ = ∆ωz · R · TP 2π). In the displayed map, thetarget bandwidth is fixed and this condition corresponds to a short echo time, i.e.R · TP (Equation 8.6). In Section 8.1, the pulse duration was normalized by the targetbandwidth ∆ωz or more accurately by T′2, reflecting that it is possible to rescale theduration of RF-pulses. Rescaling affects the bandwidth and the RF-amplitude of thepulse. The RF-limits of the pulses (Figure 32b, d) are therefore only meaningful fora fixed pulse duration. Hence, the pulses are depicted unnormalized in the resultssection of this chapter.
Since the Bloch equation is not linear, it is hard to prove that a certain pulseperformance cannot be achieved. For the presented problem, an upper boundaryof R-values is provided in Section 8.1.2, which shows good agreement with thequality factor map in Figure 31. The map in Figure 32 (c) suggest a physical limitwith respect to the total amount of dephasing. This is in accordance with theassumptions made for the appraisal in Section 8.1.2: an infinitesimal dωz exhibitsan infinitesimally small amount of dephasing, regardless of the pulse duration.The presented practical pulses approximate this condition of weak dephasingand the transition to Hahn’s regime of complete dephasing is demonstrated inFigure 32 (c). The good convergence behavior of the optimal control algorithmgives confidence that the presented quality factors represent a meaningful measure.Nevertheless, this does not disprove the existence of a well performing pulse beyondthis boundary.
100

8.4 discussion
Pulses that fulfill hardware and safety limitations are displayed in Figure 32 (b, d).Limiting the RF-amplitude and amount of energy-deposition hardly affects thequality factors at positive R-values. In contrast, pulses with negative R are affectedand the boundary of usable pulses is shifted. This indicates a higher requirementof RF-power in order to form a spin echo (negative R) compared to the excitation ofmagnetization with a positive phase slope. The reason for this can be understoodintuitively, since free precession generally creates a positive R as does for instance arectangular pulse, which is known to be very SAR efficient. For a negative R, thisphase slope needs to be inverted which consumes additional RF-power. Sequenceslike FLASH became widespread since they facilitate short repetition times. However,SAR limitations restrict the RF-pulse design for a short repetition time significantly.A (π − α)-π-pulse sequence (Section 3.4.1) is for instance hardly accomplishable invivo at a repetition time of 8 ms at 3 T. This is reflected by Figure 32 (d), where thepulse with R = −1 and TP = 5 ms shows a large error in the quality factor map.In contrast, R ≤ −1 is still possible in the weak dephasing regime, i.e. for shortpulses. This demonstrates the RF-power efficiency of spin echo pulses in the weakdephasing regime compared to standard Hahn echoes.
In Figure 32 (b, d), the pulses highlighted by the red circle and the squares exhibita slightly increased error of the quality factor compared to the plateau. The magne-tization resulting from those pulses (Figure 35) reveal that this is mainly caused bya slightly too small phase slope. This observation suggests that the optimal controlalgorithm creates pulses with slightly lower phase slopes when reaching physicalboundaries before the algorithm breaks down completely. Furthermore, it supportsthe choice of 1− Φ . 10−6 as a limit for acceptable pulses. This boundary wasfound heuristically and can of course be stretched when accepting slight errors inthe resulting magnetization.
An interesting aspect of the two pulses in Figure 35 is their similar phase slopein the central part of the bandwidth. Consequently, the echo time of those pulsesis similar, even though their pulse duration differs significantly. This emphasizesthat the proposed pulses cannot be described by Hahn’s theory of echo formation,where the echo time (measured from the end of the pulse) is approximately equalto the pulse duration. Figure 33 and 34 visualize the spin dynamics of the proposedpulses: the magnetization oscillates about the positive z-axis. Thus, T1-relaxationdoes not cause a signal reduction in steady state, contrary to the (π − α)-π-pulsesequence.
Rescaling the 500 µs pulse to different flip angles, only little changes in the result-ing magnetization are observed, especially in the phase (Figure 35). This allows theflip angle of the proposed pulses to be flexibly adjusted within a certain range. Therescaled pulse was employed for lung imaging (Figure 36 and 37). Furthermore,it gives confidence that B1-inhomogeneities have little impact on the performancebesides the modified flip angle. This insensitivity to B1-inhomogeneities is intrinsicto the proposed pulses and was not taken into account in the optimal controlalgorithm.
Figure 36, 37 and 38 demonstrate the feasibility of converting the establishedFLASH into a spin echo FLASH sequence with the proposed pulses. This allows areduction of off-resonance artifacts which are inherent to the FLASH sequence. Asshown by Scheffler and Hennig (2003), the bSSFP sequence also achieves a crossover between gradient and spin echo sequences. The spin dynamics in the bSSFP
101

delayed-focus pulses
sequence and the proposed delayed-focus pulses are very similar: the magnetizationoscillates about the positive z-axis. In the case of bSSFP, the hemisphere, i.e. thesign of My when assuming real pulses, is changed once every TR. Consequently,the total amount of dephasing is large for long TR, resulting in banding artifactsin the presence of magnetic field inhomogeneities. The Larmor frequency of thebanding artifacts is determined by the repetition time and is therefore restrictedby gradient performance and experimental parameters. In contrast to the bSSFPsequence, the proposed SE-FLASH offers the flexibility to design the RF-pulse tomatch the experimental conditions independent of the repetition time, since thedesired phase slope is achieved within a single RF-pulse.
As discussed earlier, MREG seems to be out of reach for delayed-focus pulses.However, many experimental conditions require the advantages of the FLASHsequence, such as speed and a steady state of the longitudinal magnetization. Here,the increased SNR and mitigated artifacts provided by the proposed SE-FLASHsequence would be highly beneficial. This becomes especially important for thosefunctional imaging methods which cannot be combined with standard spin echosequences such as RARE (Hennig et al., 1986). To give an example, Jakob et al.(2004) showed that T1-quantifications can provide important information on thepulmonary functionality. The employed inversion recovery SNAPSHOT-FLASHsequence requires low flip angles in order to minimize the effect on the T1-relaxation.Here, the proposed delayed focus pulses could provide an increased SNR, since thelung is highly affected by susceptibility artifacts.
The focus of this thesis was 3D imaging. Therefore, only non-selective pulseswere examined. The general framework allows further modifications to calculateslice selective delayed-focus pulses. However, forcing the flip angle outside thebandwidth of interest to zero implies additional constraints to the optimal controlalgorithm. This is expected to reduce the performance of the pulses.
102

9S U M M A RY A N D O U T L O O K
9.1 summary
Central to this work is the investigation of susceptibility artifacts in MREG and theoptimization of the pulse sequence in that regard. Assuming a fixed hardware setupwith the best possible shim, the Larmor frequency can only be further influencedby the dynamic gradient fields used for spatial encoding. Within this constraint, thedata acquisition scheme in MREG was optimized. Besides the Larmor frequency,the phase of the magnetization can be influence with RF-pulses. This work presentshow this property of the Bloch equation can be used to form spin echoes under theexperimental conditions of MREG, i.e. a long echo time and a short repetition timecompared to the relaxation times.
In order to analyze the nature of susceptibility artifacts, the Larmor frequencywas Taylor expanded with respect to the spatial position. It was demonstrated howzeroth order effects can be corrected for by suitable off-resonance correction methodswhile higher order field variations are not accessible in the image reconstruction,since they lead to a fundamental loss of information. However, first order variationscan be incorporated in the design of the k-space trajectory. Signal attenuationis mitigated when avoiding an extensive counteraction of the imaging and thesusceptibility gradients. In a 3D encoding process, one usually has - in somecoordinate system - 3 encoding directions that are acquired at different speeds. Asdemonstrated, the slowest encoding direction has the smallest average imaginggradient and is therefore the one most affected by susceptibility gradients. So far,all trajectories used for MREG were designed symmetrically in order to achievean isotropic imaging behavior (Hugger et al., 2011; Zahneisen et al., 2011, 2012).In the present work this constraint was dropped which facilitates an appreciablereduction of signal attenuation. Acquiring the data monotonously along kz withsuccessive spirals, signal attenuation is greatly reduced, especially above the sinusfrontalis which is the most prominent source of susceptibility artifacts. This imagingbehavior shows good agreement with a description of the trajectory in local k-spacethat takes susceptibility gradients into account. The proposed stack of spiralstrajectory exhibits a good overall image quality and comparably good resolution inthe presence of frequency variations and T∗2 -decay. To this date, the proposed pulsesequence has been spread worldwide to 7 research sites, where it is actively usedfor brain research (Toronov et al., 2013; Proulx et al., 2014; Akin et al., 2014a,b; Jägeret al., 2013; Korhonen et al., 2013, 2014; Lee et al., 2013a,b, 2014a,b; LeVan et al.,2013; LeVan and Hennig, 2013; Menzel et al., 2013).
Higher order frequency variations cannot be compensated with linear encodinggradients. However, Hahn (1950) demonstrated that RF-pulses can be used to(approximately) refocus the magnetization at a specific time point, i.e. to form aspin echo. In this dissertation, it was demonstrated how signal attenuation can beavoided in MREG images with a standard π/2-π-pulse sequence. However, the
103

summary and outlook
in-phase condition is only valid for a single point in time. Thus, major parts ofk-space are still corrupted by frequency variations.
The suitability of spin echo MREG was examined with respect to the desiredrepetition time of 100 ms. In order to achieve a reasonable steady state magnetiza-tion, small flip angles are required. To this end, shaped RF-pulses were discussedthat form an echo without a separate refocusing pulse. Such pulses became knownin literature as delayed-focus pulses among other names. It was demonstrated inthis dissertation how the behavior of the magnetization differs in the regime ofweak dephasing (∆ϕ . π) compared to Hahn’s well established regime of completedephasing. Assuming weak dephasing, an oscillation of the magnetization aboutthe positive z-axis is an efficient way to invert the phase slope. For such pulses, atheoretical limit for the maximum echo time as a function of the pulse durationand the flip angle was derived, which showed good agreement with the findings insimulations. It was revealed that the echo time (measured form the end of the pulse)can exceed the pulse duration in that regime. To my best knowledge, this has notbeen reported in literature so far. In the investigated regime, the pulse performanceif dominated by the total amount of dephasing rather than the duration of the pulse.This stands in contrast to Hahn’s regime of complete dephasing, where the echotime correlates directly to the pulse duration.
MREG seems to be out of reach for the proposed delayed-focus pulses due to thelong echo time that is required. However, e.g. the FLASH sequence typically hasecho times short enough to match the regime of weak dephasing. In this work, thederived SE-FLASH sequence was shown to benefit from the proposed delayed-focuspulses by mitigating susceptibility artifacts compared to a standard gradient echoFLASH.
9.2 outlook
In this dissertation, approaches for reducing susceptibility artifacts were discussedfor a given hardware setup. The new generation of MR scanner provides strongergradient coils and - more importantly for MREG - it allows the simultaneous acqui-sition of up to 128 individual RF-channels. New potential for higher undersamplingfactors arise with coils like the 95 channel head coil proposed by Wiggins et al.(2009). Experiments are required to show to which extent this can be used to speedup the acquisition. Within new boundaries, it is again a trade-off between spatialand temporal resolution. Here, further investigations are necessary to study towhich extent off-resonance artifacts are mitigated when adjusting the parametersof the stack of spirals trajectory to the increased encoding power of the 95 channelcoil.
With the proposed delayed-focus pulses, proof of concept images revealed in-creased SNR and reduced artifacts in areas affected by susceptibility differences.The next step is their application to 3D T1-mapping in the lung, which has onlybeen performed in single slices so far. Quantitative measurements of a 3D volumein a single breath-hold is a demanding task. Ehses et al. (2013) achieved goodquantitative maps with highly undersampled data by incorporating the exponentialrelaxation in the reconstruction algorithm to reduce its complexity. This poten-tially allows for 3D quantitative measurements in a single breath-hold. Some lung
104

9.2 outlook
diseases affect the entire organ or at least large parts of it. For their detection,spatial resolution of the T1-maps is not essential. High resolution is rather requiredin order to keep signal attenuation within limits. Refocusing the magnetizationwith delayed-focus pulses, this factor is eliminated and a reduction of the spatialresolution is possible. This also brings 3D methods in the realm of possibility.Alternatively, band-selective pulses could be examined in order to facilitate theapplication of the standard T1-mapping methods used in lung imaging.
Further work should comprise the modification of the delayed-focus pulses forbSSFP imaging. Assuming an excited and dephased initial magnetization, thepulses can be optimized to invert the present phase slope while maintaining the flipangle. By increasing the bandwidth of such an RF-pulse beyond the limits set bythe repetition time in a standard bSSFP sequence, banding artifacts can potentiallybe mitigated. bSSFP has been used for fMRI as well, both in the transition band, i.e.the banding "artifact" (Scheffler et al., 2001; Miller et al., 2003; Miller and Jezzard,2008), and in the passband (Bowen et al., 2005; Dharmakumar et al., 2006; Zhonget al., 2007). With a modified bSSFP sequence, delayed-focus pulses could also beused for fast fMRI, even though the k-space acquisition would be highly segmentedin contrast to the single shot approach used in MREG so far.
105


AA P P E N D I X
a.1 table of symbols
~B =(
Bx, By, Bz)T ∈ R3 Magnetic field
B0 ∈ R Static magnetic field aligned along thez-axis
B1 = B1,x + iB1,y ∈ C Rf-pulse: magnetic field varying overtime in complex notation
~B1 =(
B1,x, B1,y, 0)T ∈ R3 Rf-pulse: magnetic field varying over
time in vector notation~Bc ∈ R3 Sensitivity of the receive coil c in vectorial
notationBc ∈ C Sensitivity of the receive coil cB = hγB0/(kBT) Boltzmann factor~c ∈ 0, 1N Contrast vector for selecting one GLM
parameter (N is the number of fit param-eters)
C Field of complex numbers∆E ∈ R Energy gap of spin up and down statesE ∈ R EnergyERF ∈ R Energy of the particular RF-pulse~E Electric fieldE Forward operator describing the measure-
ment processexp Exponential function| f 〉 ∈ H Final stateFt,c[~rn] ∈ C Reconstruction term, which depends on
the spatial position~rn, coil c and time tForc
t,c [~rn] ∈ C Reconstruction term including off-resonance correction
FOV Field of view~G = (Gx, Gy, Gz)T ∈ R3 Gradient strength~G = (Gx, Gy, Gz)T ∈ R3 Slew rateh ≈ 1.054571726 · 10−34 Js Reduced Planck constantH Hamilton operatorH Hilbert spaceHs Spin Hilbert spacei Imaginary unit|i〉 ∈ H Initial state~I ∈ CN Image with N voxels in vector represen-
tation
107

appendix
~I[~rn] ∈ CNt Time series of one voxel with the lengthNt
Ima Imaginary part of aj ∈0, 1/2, 1, 3/2, . . . Total angular momentum quant. number~k =
(kx, ky, kz
)T ∈ R3 Position in k-spacekϑ ∈ [0, 2π[ angular coordinate of k-space (polar coor-
dinate system)kr ∈ R+
0 radial coordinate of k-space (polar coor-dinate system)
kB ≈ 1.380649 · 10−23 m2kg s−2K−1 Boltzmann constant~m(a) ∈ R3 Magnetization density as a function of am⊥(a) ∈ C Transversal magnetization density as a
function of ams ∈−s,−s + 1/2, . . . , s− 1/2, s Magnetic quantum number~M =
(Mx, My, Mz
)T ∈ R3 Macroscopic magnetization~MT Target magnetizationMz ∈ R Longitudinal magnetizationM⊥ = Mx + iMy ∈ C Transversal magnetizationN Number of spinsN0 Non-negative integer numbersN Natural numbersO Computational complexityp ∈ [0, 1] ProbabilityPSF Point spread function~r =(x, y, z)T ∈ R3 Spatial positionr Radial dimension in space (cylindrical co-
ordinates)R Dimensionless phase slopeRr,z Undersampling factor in r and z directionRea Real part of aRx, Ry, Rz ∈ SU (2s + 1) Rotation of the spin state around the
x, y, z-axisR Field of real numbersR+
0 Non-Negative real numberss ∈0, 1/2, 1, 3/2, . . . Spin quantum numberSx,y,z ∈ U (2s + 1) Spin operator in x, y, z-direction~S =
(Sx, Sy, Sz
)T ∈ U (2s + 1)3 Spin operatorS ∈ C Measured MR SignalSU (n) Special unitary group of degree nt TimeT Absolute temperature measured in KelvinAT Transposed of AT1 Longitudinal relaxation timeT2 Transversal relaxation timeT′2 Characteristic time of spin dephasingT∗2 Combination of T2 and T′2TADC Duration of the readout
108

A.1 table of symbols
TEeff Effective echo timeTER Echo time defined by the R-valueTGE Gradient recalled echo timeTHE Hahn echo timeTP Duration of the RF-pulseTR Repetition timeTrA Trace of AU VoltageU (n) Unitary group of degree nW ∈ R+
0 Weighting factor (optimal control)x, y, z Dimensions of spaceX Design matrix for the GLM fitZ Whole numbers
α ∈ R Flip angleαexc ∈ R Flip angle of excitation pulseαre f ∈ R Flip angle of refocusing pulseαt ∈ R Total flip angle of a composite pulse~β ∈ RN Parameter of a GLM fit with N compo-
nentsγ ≈ 2.675222 · 108 rad/(Ts) Gyromagnetic ratio of the protonδjk =1 ∀ j= k, δjk =0 ∀ j 6= k Kronecker deltaδ(a) Delta distribution~ε ∈ RN Residual of the GLM fit (N is the lenght
of the time series)εjkl Levi-Civita symbolλ ∈ R+
0 Regularization parameter~Λ ∈ R3 Lagrange multiplier
~µ =(
µx, µy, µz
)T∈ SU (2s + 1)3 Magnetic moment of the spin
ξ ∈ R+0 Step size of gradient descent (optimal con-
trol)π ≈ 3.14159 rad Piρ Density matrixρeq Density matrix at thermal equilibriumσ Standard deviationσor Standard deviation of the optimal control
weighting function∑A Sum over the index Aτ ∈ R Length of an RF-pulseϕ ∈ R Complex phase of the magnetizationϕRF ∈ R Complex phase of an RF-pulseφ(ωz) ∈ [0, 1] Quality factor used in optimal controlΦ ∈ [0, 1] Weighted average of the quality factor
over all frequenciesΦ Off-resonance matrix for PSF calculationsχ ∈ R+
0 Empirical factor to reduce PNS|ψ〉 ∈ Hs Spin state
109

appendix
~ω =(ωx, ωy, ωz
)T ∈ R3 Larmor frequencyω0 ∈ R Central Larmor frequencyωcs Chemical shiftωor ∈ R Off-resonance (Larmor) frequency in the
absence of imaging gradientsωz = ωz −Ω ∈ R Larmor frequency in the rotating frame of
reference (including imaging gradients)ωRF ∈ R Frequency of an RF-pulseωx,y = −γB1 Nutation frequency created by an RF-
pulseΩ ∈ R Frequency of a rotating frame of reference
around the z-axis
1 Identity matrix〈A〉 ∈ [0, 1] Expected value of A〈a| Bra operator a (linear functional on Ket
vectors; Bra-Ket notation)|a〉 ∈ H Ket vector a (Bra-Ket notation)|↑〉 = (1, 0)T Spin up eigenstate|↓〉 = (0, 1)T Spin down eigenstatea! Factorial of aA A in the rotating frame of referenceA∗ Complex conjugate of AA† Complex conjugate, transposed of A[A, B] = AB− BA Commutator∀ For all≡ Defined by∝ Proportional∝∼ Approximately proportionalda/dx Total derivative of a with respect to xa Total derivative of a with respect to time∂a/∂x Partial derivative of a with respect to x~∇ = ( ∂
∂x , ∂∂y , ∂
∂z )T Del operator
∇ Finite difference operator
110

A.2 abbreviations
a.2 abbreviations
ADC Analog-to-digital converterBOLD Blood oxygen-level dependent contrastbSSFP balanced steady state free precessionCAIPIRINHA Controlled aliasing in parallel imaging results in higher accelerationCG Conjugate gradient(D)FT (Discrete) Fourier transformDORK Dynamic off-resonance in k-spaceEEG ElectroencephalographyEPI Echo planar imagingEVI Echo volume imagingFFT Fast Fourier transformFID Free induction decayFLASH Fast low angle shotfMRI Functional magnetic resonance imagingFOV Field of viewFWHM Full width at half maximumGE Gradient echoGLM General linear modelGRAPPA Generalized autocalibrating partially parallel acquisitionsGRT Gradient raster timeHRF Hemodynamic response functionMIP Maximum intensity projectionMR Magnetic resonanceMREG Magnetic resonance encephalographyMRI Magnetic resonance imagingMT Magnetization transferNMR Nuclear magnetic resonancenuFFT Non-uniform fast Fourier transformPNS Peripheral nerve stimulationPatLoc Parallel imaging technique using local gradientsPOCS Projections onto convex setsPROPELLER Periodically rotated overlapping parallel lines with enhanced reconstructionPSF Point spread functionRARE rapid acquisition with relaxation enhancementRF Radio frequencySAR Specific absorption rateSE Spin echoSENSE Sensitivity encodingSNR Signal-to-noise ratioSMASH Simultanious acquisition of spatial haromnicsSoS Stack of spiralsSPIRiT Iterative self-consistent parallel imaging reconstruction from arbitrary k-spaceSPM Statistical parameter mappingtSNR Temporal SNR
111


P U B L I C AT I O N S
journal articles
Assländer, J., B. Zahneisen, T. Hugger, M. Reisert, H.-L. Lee, P. LeVan, and J.Hennig (2013). Single shot whole brain imaging using spherical stack ofspirals trajectories. NeuroImage 73, 59–70.
Jacobs, J., J. Stich, B. Zahneisen, J. Assländer, G. Ramantani, A. Schulze-Bonhage,R. Korinthenberg, J. Hennig, and P. LeVan (2014). Fast fMRI provides highstatistical power in the analysis of epileptic networks. NeuroImage 88(0), 282 –294.
Ramb, R., C. Binter, G. Schultz, J. Assländer, F. Breuer, M. Zaitsev, S. Kozerke, andB. Jung (2014). A g-factor metric for k-t-GRAPPA and PEAK-GRAPPA basedparallel imaging. Magnetic Resonance in Medicine, in press.
Zahneisen, B., J. Assländer, P. LeVan, T. Hugger, M. Reisert, T. Ernst, and J. Hennig(2014). Quantification and correction of respiration induced dynamic fieldmap changes in fMRI using 3D single shot techniques. Magnetic Resonance inMedicine 71(3), 1093–1102.
Zahneisen, B., T. Hugger, K. J. Lee, P. Levan, M. Reisert, H.-L. Lee, J. Assländer,M. Zaitsev, and J. Hennig (2012). Single shot concentric shells trajectories forultra fast fMRI. Magnetic Resonance in Medicine 68(2), 484–94.
patents
Assländer, J., S. J. Glaser, and J. Hennig (2013). MRT zur Erzeugung selbstre-fokussierende Magnetisierung. DE 10 2013 205 528.5.
Assländer, J., and J. Hennig (2012). Kernspintomographieverfahren mit einemMultiband-Hochfrequenzpuls mit mehreren separaten Frequenzbändern. DE10 2012 208 019.
conference proceedings
Assländer, J., S. Köcher, S. J. Glaser, and J. Hennig (2014). Spin Echoes in the WeakDephasing Regime. In Proc. Intl. Soc. Mag. Reson. Med. 22, p. 30.
Assländer, J., and J. Hennig (2013). Spin Echo Formation with a Phase Pre-Winding Pulse. In Proc. Intl. Soc. Mag. Reson. Med. 21, p. 4249.
Assländer, J., M. Reisert, B. Zahneisen, T. Hugger, and J. Hennig (2012). MREGusing a Stack of Spirals Trajectory. In Proc. Intl. Soc. Mag. Reson. Med. 20,p. 328.
113

publications
Assländer, J., J. Stockmann, M. Blaimer, F. A. Breuer, and M. Zaitsev (2012). Fieldof View reduction using SinusOidal gradient Pulses in Combination with anO-space Gradient eNcoding field and reconstructing with SPACE RIP (VSOPCOGNAC). In Proc. Intl. Soc. Mag. Reson. Med. 20, p. 2290.
Assländer, J., M. Blaimer, F. A. Breuer, M. Zaitsev, and P. M. Jakob (2011). Combina-tion of arbitrary gradient encoding fields using SPACE RIP for reconstruction(COGNAC). In Proc. Intl. Soc. Mag. Reson. Med. 19, p. 2870.
Korhonen, V., J. Kantola, T. Myllyla, T. Starck, M. Kallio, H. Ansakorpi, J. Ass-länder, J. Nikkinen, O. Tervonen, P. LeVan, J. Hennig, and V. Kiviniemi(2013). Critically sampled MREG and NIRS data detect similar DMN activitysimultaneously. In Proc. Organ. Hum. Brain Mapp. 19, p. 3603.
Lee, H.-L., J. Assländer, P. LeVan, and J. Hennig (2014). Resting-State FunctionalHubs at Multiple Frequencies Revealed by MR-Encephalography. In Proc. Intl.Soc. Mag. Reson. Med. 22, p. 4184.
Lee, H.-L., J. Assländer, P. LeVan, and J. Hennig (2014). Frequency-DependentResting-State Connectivity and Network Disintegration in Brain Hub Regions.In Proc. Organ. Hum. Brain Mapp. 20, p. 1791.
Lee, H.-L., J. Assländer, P. LeVan, and J. Hennig (2013). Observing Resting-StateBrain Modules at Different Frequencies Using MREG. In Proc. Intl. Soc. Mag.Reson. Med. 21, p. 3277.
Lee, H.-L., J. Assländer, P. LeVan, and J. Hennig (2013). Frequency-DependentResting-State Network Modules Revealed in MR-Encephalography. In Proc.Organ. Hum. Brain Mapp. 19, p. 1811.
LeVan, P., J. Jacobs, J. Stich, B. Zahneisen, T. Hugger, J. Assländer, A. Schulze-Bonhage, and J. Hennig (2012). EEG-fMRI using the ultra-fast MREG sequenceallows the single-trial localization of epileptic spikes. In Proc. Organ. Hum.Brain Mapp. 18.
Littin, S., J. Assländer, A. Dewdney, A.M. Welz, H. Weber, G. Schultz, J. Hennig,and M. Zaitsev (2013). PatLoc Single Shot Imaging. In Proc. Intl. Soc. Mag.Reson. Med. 21, p. 2379.
Riemenschneider, B., J. Assländer, and J. Hennig (2013). An Approach to 3DMulti-Band Acquisition. In Proc. Intl. Soc. Mag. Reson. Med. 21, p. 411.
Testud, F., J. Assländer, C. Barmet, T. Hugger, B. Zahneisen, K. Prüssmann,J. Hennig, and M. Zaitsev (2012). Magnetic Resonance EncephalographyReconstruction with Magnetic Field Monitoring. In Proc. Intl. Soc. Mag. Reson.Med. 20, p. 215.
Weber, H., J. Assländer, S. Littin, J. Hennig, and M. Zaitsev (2014). Local Resolu-tion Adaptation for Curved Slice Echo Planar Imaging. In Proc. Intl. Soc. Mag.Reson. Med. 22, p. 4248.
Weber, H., D. Gallichan, J. Assländer, J. Hennig, and M. Zaitsev (2012). CurvedSlice Functional Imaging. In Proc. Intl. Soc. Mag. Reson. Med. 20, p. 2052.
114

B I B L I O G R A P H Y
Abragam, A. (1961). The principles of nuclear magnetism, Volume 32. Oxford UniversityPress.
Adler, R. J. and A. Hasofer (1976). Level crossings for random fields. The annals ofProbability 4(1), 1–12.
Akin, B., H.-L. Lee, J. Hennig, and P. LeVan (2014a). Tracking instantaneousconnectivity changes related to single-trial activation. In Proc. Organ. Hum. BrainMapp. 20, pp. 1805.
Akin, B., H.-L. Lee, J. Hennig, and P. LeVan (2014b). Ultra-Fast fMRI Using MREGImproves Subject Specific Extraction of Resting State Networks. In Proc. Intl. Soc.Mag. Reson. Med. 22, pp. 4183.
Assländer, J. and J. Hennig (2013). Spin Echo Formation with a Phase Pre-WindingPulse. In Proc. Intl. Soc. Mag. Reson. Med. 21, pp. 4249.
Assländer, J., S. Köcher, S. J. Glaser, and J. Hennig (2014). Spin Echoes in the WeakDephasing Regime. In Proc. Intl. Soc. Mag. Reson. Med. 22, pp. 30.
Assländer, J., B. Zahneisen, T. Hugger, M. Reisert, H.-L. Lee, P. LeVan, and J. Hennig(2013). Single shot whole brain imaging using spherical stack of spirals trajectories.NeuroImage 73, 59–70.
Balchandani, P., M. Yamada, J. Pauly, P. Yang, and D. Spielman (2009). Self-refocusedspatial-spectral pulse for positive contrast imaging of cells labeled with SPIOnanoparticles. Magnetic Resonance in Medicine 62(1), 183–192.
Bandettini, P. A., E. C. Wong, A. Jesmanowicz, R. S. Hinks, and J. S. Hyde (1994).Spin-echo and gradient-echo EPI of human brain activation using BOLD contrast:A comparative study at 1.5 T. NMR in Biomedicine 7(1-2), 12–20.
Belliveau, J., D. Kennedy, R. McKinstry, B. Buchbinder, R. Weisskoff, M. Cohen,J. Vevea, T. Brady, and B. Rosen (1991). Functional mapping of the human visualcortex by magnetic resonance imaging. Science 254(5032), 716–719.
Bloch, F. (1946). Nuclear Induction. Physical Review 70(7-8), 460–474.
Block, K. T., M. Uecker, and J. Frahm (2007). Undersampled radial MRI withmultiple coils. Iterative image reconstruction using a total variation constraint.Magnetic Resonance in Medicine 57(6), 1086–1098.
Bloembergen, N., E. M. Purcell, and R. V. Pound (1948). Relaxation Effects inNuclear Magnetic Resonance Absorption. Physical Review 73, 679–712.
Bowen, C., R. Menon, and J. Gati (2005). High field balanced-SSFP fMRI: a BOLDtechnique with excellent tissue sensitivity and superior large vessel suppression.In Proc. Intl. Soc. Mag. Reson. Med. 13, pp. 119.
115

Bibliography
Breuer, F. A., M. Blaimer, R. M. Heidemann, M. F. Mueller, M. A. Griswold, and P. M.Jakob (2005). Controlled aliasing in parallel imaging results in higher acceleration(CAIPIRINHA) for multi-slice imaging. Magnetic Resonance in Medicine 53(3),684–691.
Bryson, A. E. (1975). Applied optimal control: optimization, estimation and control. Wiley,New York.
Buxton, R. B., K. Uludag, D. J. Dubowitz, and T. T. Liu (2004). Modeling thehemodynamic response to brain activation. NeuroImage 23 Suppl 1, S220–S233.
Carr, H. Y. (1958, Dec). Steady-State Free Precession in Nuclear Magnetic Resonance.Physical Review 112, 1693–1701.
Claerbout, J. F. and F. Muir (1973). Robust modeling with erratic data. Geo-physics 38(5), 826–844.
Conolly, S., D. Nishimura, and A. Macovski (1986). Optimal control solutions tothe magnetic resonance selective excitation problem. IEEE Transactions on MedicalImaging 5(2), 106–15.
Cooley, J. W. and J. W. Tukey (1965). An algorithm for the machine calculation ofcomplex Fourier series. Mathematics of Computation 19(90), 297–301.
Deichmann, R., O. Josephs, C. Hutton, D. R. Corfield, and R. Turner (2002). Com-pensation of Susceptibility-Induced BOLD Sensitivity Losses in Echo-Planar fMRIImaging. NeuroImage 15(1), 120–135.
Dharmakumar, R., X. Qi, J. Hong, and G. A. Wright (2006). Detecting microcircu-latory changes in blood oxygen state with steady-state free precession imaging.Magnetic Resonance in Medicine 55(6), 1372–1380.
Dirac, P. A. M. (1928a). The quantum theory of the electron. Proceedings of the RoyalSociety of London. Series A 117(778), 610–624.
Dirac, P. A. M. (1928b). The quantum theory of the electron. Part II. Proceedings ofthe Royal Society of London. Series A 118(779), 351–361.
Donoho, D. L. (2006). For most large underdetermined systems of linear equationsthe minimal l1-norm solution is also the sparsest solution. Communications onPure and Applied Mathematics 59(6), 797–829.
Donoho, D. L. and B. F. Logan (1992). Signal recovery and the large sieve. SIAMJournal on Applied Mathematics 52(2), 577–591.
Ehses, P., N. Seiberlich, D. Ma, F. A. Breuer, P. M. Jakob, M. A. Griswold, andV. Gulani (2013). IR TrueFISP with a golden-ratio-based radial readout: Fastquantification of T1, T2, and proton density. Magnetic Resonance in Medicine 69(1),71–81.
Einstein, A. (1917). Zur Quantentheorie der Strahlung. Physikalische Zeitschrift 18,121–128.
116

Bibliography
Ernst, R. R., G. Bodenhausen, A. Wokaun, et al. (1987). Principles of nuclear magneticresonance in one and two dimensions, Volume 14. Clarendon Press Oxford.
Feinberg, D. A., S. Moeller, S. M. Smith, E. Auerbach, S. Ramanna, M. F. Glasser,K. L. Miller, K. Ugurbil, and E. Yacoub (2010, 12). Multiplexed Echo PlanarImaging for Sub-Second Whole Brain FMRI and Fast Diffusion Imaging. PLoSONE 5(12), e15710.
Fessler, J. A., S. Lee, V. T. Olafsson, H. R. Shi, and D. C. Noll (2005). Toeplitz-Based Iterative Image Reconstruction for MRI With Correction for Magnetic FieldInhomogeneity. IEEE Transactions on Signal Processing 53(9), 3393–3402.
Fessler, J. A. and B. P. Sutton (2003). Nonuniform fast Fourier transforms usingmin-max interpolation. IEEE Transactions on Signal Processing 51(2), 560–574.
Fletcher, R. and C. M. Reeves (1964). Function minimization by conjugate gradients.The Computer Journal 7(2), 149–154.
Frahm, J., J. Baudewig, K. Kallenberg, A. Kastrup, K. D. Merboldt, and P. Dechent(2008). The post-stimulation undershoot in BOLD fMRI of human brain is notcaused by elevated cerebral blood volume. NeuroImage 40(2), 473 – 481.
Friston, K. J., A. P. Holmes, J. B. Poline, P. J. Grasby, S. C. R. Williams, R. S. J.Frackowiak, and R. Turner (1995). Analysis of fMRI Time-Series Revisited.NeuroImage 2(1), 45 – 53.
Friston, K. J., P. Jezzard, and R. Turner (1994). Analysis of functional MRI time-series.Human Brain Mapping 1(2), 153–171.
Funai, A. K., J. A. Fessler, D. T. B. Yeo, V. T. Olafsson, and D. C. Noll (2008). Regu-larized field map estimation in MRI. IEEE Transactions on Medical Imaging 27(10),1484–1494.
Gallichan, D., C. Cocosco, A. Dewdney, G. Schultz, A. Welz, J. Hennig, and M. Zait-sev (2011). Simultaneously driven linear and nonlinear spatial encoding fields inMRI. Magnetic Resonance in Medicine 65(3), 702–714.
Gati, J. S., R. S. Menon, K. Ugurbil, and B. K. Rutt (1997). Experimental determi-nation of the BOLD field strength dependence in vessels and tissue. MagneticResonance in Medicine 38(2), 296–302.
Gerlach, W. and O. Stern (1922). Der experimentelle Nachweis der Richtungsquan-telung im Magnetfeld. Zeitschrift für Physik 9, 349–352.
Gershenzon, N. I., T. E. Skinner, B. Brutscher, N. Khaneja, M. Nimbalkar, B. Luy, andS. J. Glaser (2008). Linear phase slope in pulse design: Application to coherencetransfer. Journal of Magnetic Resonance 192(2), 235 – 243.
Gibbs, J. W. (1898). Fourier’s series. Nature 59, 200.
Glover, G. H. (1999). Simple analytic spiral K-space algorithm. Magnetic Resonancein Medicine 42(2), 412–415.
117

Bibliography
Glover, G. H., T.-Q. Li, and D. Ress (2000). Image-based method for retrospec-tive correction of physiological motion effects in fMRI: RETROICOR. MagneticResonance in Medicine 44(1), 162–167.
Griswold, M. A., P. M. Jakob, R. M. Heidemann, M. Nittka, V. Jellus, J. Wang,B. Kiefer, and A. Haase (2002). Generalized autocalibrating partially parallelacquisitions (GRAPPA). Magnetic Resonance in Medicine 47(6), 1202–1210.
Grotz, T., B. Zahneisen, A. Ella, M. Zaitsev, and J. Hennig (2009). Fast functionalbrain imaging using constrained reconstruction based on regularization usingarbitrary projections. Magnetic Resonance in Medicine 62, 394–405.
Haacke, E. (1999). Magnetic Resonance Imaging: Physical Principles and SequenceDesign. Wiley, New York.
Haacke, E., E. Lindskogj, and W. Lin (1991). A fast, iterative, partial-Fourier tech-nique capable of local phase recovery. Journal of Magnetic Resonance (1969) 92(1),126 – 145.
Haase, A., J. Frahm, D. Matthaei, W. Hanicke, and K.-D. Merboldt (1986). FLASHimaging. Rapid NMR imaging using low flip-angle pulses. Journal of MagneticResonance (1969) 67(2), 258–266.
Hahn, E. L. (1950). Spin Echoes. Physical Review 80, 580–594.
Hansen, P. (1992). Analysis of Discrete Ill-Posed Problems by Means of the L-Curve.SIAM Review 34(4), 561–580.
Hargreaves, B. A., D. G. Nishimura, and S. M. Conolly (2004). Time-optimal multi-dimensional gradient waveform design for rapid imaging. Magnetic Resonance inMedicine 51(1), 81–92.
Hebrank, F. X. and M. Gebhardt (2000). SAFE-Model - A New Method for PredictingPeripheral Nerve Stimulations in MRI. In Proc. Intl. Soc. Mag. Reson. Med. 8, pp.2007.
Hennig, J., A. Nauerth, and H. Friedburg (1986). RARE imaging: a fast imagingmethod for clinical MR. Magnetic Resonance in Medicine 3(6), 823–833.
Hennig, J., A. M. Welz, G. Schultz, J. Korvink, Z. Liu, O. Speck, and M. Zaitsev(2008). Parallel imaging in non-bijective, curvilinear magnetic field gradients: aconcept study. Magnetic Resonance Materials in Physics, Biology and Medicine 21(1-2),5–14.
Hennig, J., K. Zhong, and O. Speck (2007). MR-Encephalography: Fast multi-channel monitoring of brain physiology with magnetic resonance. NeuroIm-age 34(1), 212–219.
Hestenes, M. R. and E. Stiefel (1952). Methods of Conjugate Gradients for SolvingLinear Systems. Journal of Research of the National Bureau of Standards 49 (6).,409–436.
118

Bibliography
Hoult, D. (1979). The solution of the Bloch equations in the presence of a varyingB1 field - an approach to selective pulse analysis. Journal of Magnetic Resonance(1969) 35(1), 69–86.
Hugger, T., B. Zahneisen, P. LeVan, K. J. Lee, H.-L. Lee, M. Zaitsev, and J. Hennig(2011). Fast Undersampled Functional Magnetic Resonance Imaging UsingNonlinear Regularized Parallel Image Reconstruction. PLoS One 6(12), e28822.
Jackson, J. I., C. H. Meyer, D. G. Nishimura, and A. Macovski (1991). Selectionof a convolution function for Fourier inversion using gridding [computerisedtomography application]. IEEE Transactions on Medical Imaging 10(3), 473–478.
Jacobs, J., J. Stich, B. Zahneisen, J. Assländer, G. Ramantani, A. Schulze-Bonhage,R. Korinthenberg, J. Hennig, and P. LeVan (2014). Fast fMRI provides highstatistical power in the analysis of epileptic networks. NeuroImage 88(0), 282 – 294.
Jakob, P. M., T. Wang, G. Schultz, H. Hebestreit, A. Hebestreit, and D. Hahn (2004).Assessment of human pulmonary function using oxygen-enhanced T1 imagingin patients with cystic fibrosis. Magnetic Resonance in Medicine 51(5), 1009–1016.
Janich, M. A., R. F. Schulte, M. Schwaiger, and S. J. Glaser (2011). Robust slice-selective broadband refocusing pulses. Journal of Magnetic Resonance 213(1), 126 –135.
Jenkinson, M. (2003). Fast, automated, N-dimensional phase-unwrapping algorithm.Magnetic Resonance in Medicine 49(1), 193–7.
Juchem, C., T. W. Nixon, S. McIntyre, D. L. Rothman, and R. A. de Graaf (2010).Magnetic field homogenization of the human prefrontal cortex with a set oflocalized electrical coils. Magnetic Resonance in Medicine 63(1), 171–80.
Jäger, V., M. Dümpelmann, P. LeVan, G. Ramantani, A. Schulze-Bonhage, J. Hennig,and J. Jacobs (2013). High resolution temporal imaging and high density EEGimproves EEG-fMRI in focal epilepsy. In Epilepsia, Volume Special Issue: 30thInternational Epilepsy Congress, pp. 363.
Kennan, R. P., J. Zhong, and J. C. Gore (1994). Intravascular susceptibility contrastmechanisms in tissues. Magnetic Resonance in Medicine 31(1), 9–21.
King, K. F. and P. R. Moran (1984). A unified description of NMR imaging, data-collection strategies, and reconstruction. Medical physics 11, 1.
Korhonen, V., T. Hiltunen, T. Myllylä, and V. Kiviniemi (2014). DRIFTER-basedphysiological corrections to MREG vs. NIRS source correlations. In Proc. Organ.Hum. Brain Mapp. 20, pp. 2255.
Korhonen, V., J. Kantola, T. Myllyla, T. Starck, M. Kallio, H. Ansakorpi, J. Assländer,J. Nikkinen, O. Tervonen, P. LeVan, J. Hennig, and V. Kiviniemi (2013). Criticallysampled MREG and NIRS data detect similar DMN activity simultaneously. InProc. Organ. Hum. Brain Mapp. 19, pp. 3603.
Kumar, A., D. Welti, and R. Ernst (1975). Imaging of macroscopic objects by NMRFourier zeugmatography. Naturwissenschaften 62, 34–34.
119

Bibliography
Ladd, M. E. (2007). High-field-strength magnetic resonance: potential and limits.Topics in Magnetic Resonance Imaging 18(2), 139–152.
Lauterbur, P. C. (1973). Image formation by induced local interactions: examplesemploying nuclear magnetic resonance. Nature 242(5394), 190–191.
Lauterbur, P. C., D. M. Kramer, W. V. House Jr, and C.-N. Chen (1975). Zeug-matographic high resolution nuclear magnetic resonance spectroscopy. Imagesof chemical inhomogeneity within macroscopic objects. Journal of the AmericanChemical Society 97(23), 6866–6868.
Lee, H.-L., J. Assländer, P. LeVan, and J. Hennig (2013a). Frequency-DependentResting-State Network Modules Revealed in MR-Encephalography. In Proc. Organ.Hum. Brain Mapp. 19, pp. 1811.
Lee, H.-L., J. Assländer, P. LeVan, and J. Hennig (2013b). Observing Resting-StateBrain Modules at Different Frequencies Using MREG. In Proc. Intl. Soc. Mag.Reson. Med. 21, pp. 3277.
Lee, H.-L., J. Assländer, P. LeVan, and J. Hennig (2014a). Frequency-DependentResting-State Connectivity and Network Disintegration in Brain Hub Regions. InProc. Organ. Hum. Brain Mapp. 20, pp. 1791.
Lee, H.-L., J. Assländer, P. LeVan, and J. Hennig (2014b). Resting-State FunctionalHubs at Multiple Frequencies Revealed by MR-Encephalography. In Proc. Intl.Soc. Mag. Reson. Med. 22, pp. 4184.
Lee, H.-L., B. Zahneisen, T. Hugger, P. LeVan, and J. Hennig (2013). Trackingdynamic resting-state networks at higher frequencies using MR-encephalography.NeuroImage 65(0), 216 – 222.
LeVan, P. and J. Hennig (2013). Optimization of physiological noise removal inultra-high temporal resolution fMRI. In Proc. Organ. Hum. Brain Mapp. 19, pp.1743.
LeVan, P., J. Jacobs, V. Jayakumar, and J. Hennig (2013). Ultra-fast fMRI revealshigh-frequency fluctuations in response to neuronal discharges. In Proc. Intl. Soc.Mag. Reson. Med. 21, pp. 0522.
Levitt, M. H. (2001). Spin dynamics. Wiley, New York.
Liang, Z.-P. and P. C. Lauterbur (2000). Principles of Magnetic Resonance Imaging: ASignal Processing Perspective. The IEEE Press.
Lim, K. O., J. Pauly, P. Webb, R. Hurd, and A. Macovski (1994). Short TE phosphorusspectroscopy using a spin-echo pulse. Magnetic Resonance in Medicine 32(1), 98–103.
Lin, F.-H., L. L. Wald, S. P. Ahlfors, M. S. Haemaelaeinen, K. K. Kwong, and J. W.Belliveau (2006). Dynamic magnetic resonance inverse imaging of human brainfunction. Magnetic Resonance in Medicine 56(4), 787–802.
Ljunggren, S. (1983). A simple graphical representation of Fourier-based imagingmethods. Journal of Magnetic Resonance (1969) 54(2), 338–343.
120

Bibliography
Logothetis, N. K., J. Pauls, M. Augath, T. Trinath, and A. Oeltermann (2001).Neurophysiological investigation of the basis of the fMRI signal. Nature 412(6843),150–157.
Lustig, M., D. Donoho, and J. M. Pauly (2007). Sparse MRI: The application ofcompressed sensing for rapid MR imaging. Magnetic Resonance in Medicine 58(6),1182–1195.
Lustig, M. and J. M. Pauly (2010). SPIRiT: Iterative self-consistent parallel imagingreconstruction from arbitrary k-space. Magnetic Resonance in Medicine 64(2),457–471.
Mansfield, P. (1977). Multi-planar image formation using NMR spin echoes. Journalof Physics C: Solid State Physics 10(3), L55.
Mansfield, P., A. M. Howseman, and R. J. Ordidge (1989). Volumar imaging usingNMR spin echoes: echo-volumar imaging (EVI) at 0.1 T. Journal of Physics E:Scientific Instruments 22(5), 324.
Menzel, A., J. Jacobs, G. Ramantani, A. Schulze-Bonhage, J. Hennig, and P. LeVan(2013). EEG-MREG reveals negative BOLD in the default mode network in singlepatients with focal epilepsy. In Proc. Organ. Hum. Brain Mapp. 19, pp. 3112.
Meyer, C. H., B. S. Hu, D. G. Nishimura, and A. Macovski (1992). Fast spiralcoronary artery imaging. Magnetic Resonance in Medicine 28(2), 202–213.
Miller, K. L., B. A. Hargreaves, J. Lee, D. Ress, R. Christopher deCharms, andJ. M. Pauly (2003). Functional brain imaging using a blood oxygenation sensitivesteady state. Magnetic Resonance in Medicine 50(4), 675–683.
Miller, K. L. and P. Jezzard (2008). Modeling SSFP functional MRI contrast in thebrain. Magnetic Resonance in Medicine 60(3), 661–673.
Ngo, J. T. and P. G. Morris (1987). General solution to the NMR excitation problemfor noninteracting spins. Magnetic Resonance in Medicine 5(3), 217–237.
Noll, D. C. (2002). Rapid MR image acquisition in the presence of backgroundgradients. In IEEE International Symposium on Biomedical Imaging, pp. 725–728.
Noll, D. C., C. H. Meyer, J. M. Pauly, D. G. Nishimura, and A. Macovski (1991).A homogeneity correction method for magnetic resonance imaging with time-varying gradients. IEEE Transactions on Medical Imaging 10(4), 629–637.
Nyquist, H. (1928). Certain topics in telegraph transmission theory. Transactions ofthe American Institute of Electrical Engineers 47(2), 617–644.
Ogawa, S., T. M. Lee, A. R. Kay, and D. W. Tank (1990). Brain magnetic resonanceimaging with contrast dependent on blood oxygenation. Proceedings of the NationalAcademy of Sciences of the United States of America 87(24), 9868–9872.
Pauli, W. (1927). Zur Quantenmechanik des magnetischen Elektrons. Zeitschrift fürPhysik 43(9), 601–623.
121

Bibliography
Pauling, L. and C. D. Coryell (1936). The Magnetic Properties and Structure ofHemoglobin, Oxyhemoglobin and Carbonmonoxyhemoglobin. Proceedings of theNational Academy of Sciences of the United States of America 22(4), 210–216.
Pauly, J., P. Le Roux, D. Nishimura, and A. Macovski (1991). Parameter relations forthe Shinnar-Le Roux selective excitation pulse design algorithm [NMR imaging].IEEE Transactions on Medical Imaging 10(1), 53–65.
Peran, P., G. Hagberg, G. Luccichenti, A. Cherubini, V. Brainovich, P. Celsis, C. Calt-agirone, and U. Sabatini (2007). Voxel-based analysis of R2* maps in the healthyhuman brain. Journal of Magnetic Resonance Imaging 26(6), 1413–1420.
Pfeuffer, J., P.-F. V. de Moortele, K. Ugurbil, X. Hu, and G. H. Glover (2002).Correction of physiologically induced global off-resonance effects in dynamicecho-planar and spiral functional imaging. Magnetic Resonance in Medicine 47(2),344–353.
Pinch, E. R. (1993). Optimal control and the calculus of variations. Oxford UniversityPress Oxford.
Pipe, J. (1999). Motion correction with PROPELLER MRI: application to headmotion and free-breathing cardiac imaging. Magnetic Resonance in Medicine 42(5),963.
Pontryagin, L. S. (1962). Mathematical theory of optimal processes. Wiley-InterscienceNew York.
Posse, S., E. Ackley, R. Mutihac, J. Rick, M. Shane, C. Murray-Krezan, M. Zaitsev,and O. Speck (2012). Enhancement of temporal resolution and BOLD sensitivityin real-time fMRI using multi-slab echo-volumar imaging. NeuroImage 61(1),115–30.
Proulx, S., M. Safi-Harb, P. LeVan, D. An, S. Watanabe, and J. Gotman (2014).Increased sensitivity of fast BOLD fMRI with a subject-specific hemodynamicresponse function and application to epilepsy. NeuroImage 93, Part 1(0), 59 – 73.
Pruessmann, K. P., M. Weiger, M. B. Scheidegger, and P. Boesiger (1999). SENSE:sensitivity encoding for fast MRI. Magnetic Resonance in Medicine 42(5), 952–962.
Purcell, E. M., H. C. Torrey, and R. V. Pound (1946). Resonance absorption bynuclear magnetic moments in a solid. Physical Review 69, 37.
Rabi, I. I., J. R. Zacharias, S. Millman, and P. Kusch (1938, Feb). A New Method ofMeasuring Nuclear Magnetic Moment. Physical Review 53, 318–318.
Rourke, D., P. Kozlowski, and J. K. Saunders (1993). Highly Prefocused SelectivePulses. In Proc. Intl. Soc. Mag. Reson. Med. 1, pp. 1181.
Rudin, L. I., S. Osher, and E. Fatemi (1992). Nonlinear total variation based noiseremoval algorithms. Physica D: Nonlinear Phenomena 60(1-4), 259–268.
Scheffler, K. and J. Hennig (2003). Is TrueFISP a gradient-echo or a spin-echosequence? Magnetic Resonance in Medicine 49(2), 395–397.
122

Bibliography
Scheffler, K., E. Seifritz, D. Bilecen, R. Venkatesan, J. Hennig, M. Deimling, and E. M.Haacke (2001). Detection of BOLD changes by means of a frequency-sensitivetrueFISP technique: preliminary results. NMR in Biomedicine 14(7-8), 490–496.
Setsompop, K., B. A. Gagoski, J. R. Polimeni, T. Witzel, V. J. Wedeen, and L. L.Wald (2012). Blipped-controlled aliasing in parallel imaging for simultaneousmultislice echo planar imaging with reduced g-factor penalty. Magnetic Resonancein Medicine 67(5), 1210–1224.
Shannon, C. E. (1949). Communication in the presence of noise. Proceedings of theIRE 37(1), 10–21.
Shen, J. (2001). Delayed-Focus Pulses Optimized Using Simulated Annealing.Journal of Magnetic Resonance 149(2), 234 – 238.
Skinner, T. E., T. O. Reiss, B. Luy, N. Khaneja, and S. J. Glaser (2003). Applicationof optimal control theory to the design of broadband excitation pulses for high-resolution NMR. Journal of Magnetic Resonance 163(1), 8 – 15.
Sodickson, D. K. and W. J. Manning (1997). Simultaneous acquisition of spatialharmonics (SMASH): fast imaging with radiofrequency coil arrays. MagneticResonance in Medicine 38(4), 591–603.
Spielman, D. M., J. M. Pauly, and C. H. Meyer (1995). Magnetic resonance fluo-roscopy using spirals with variable sampling densities. Magnetic Resonance inMedicine 34(3), 388–394.
Starcuk, Z. (1993). Delayed-Focus Pulses for Magnetic Resonance. In Proc. Intl. Soc.Mag. Reson. Med. 1, pp. 1179.
Sutton, B. P., D. C. Noll, and J. A. Fessler (2003). Fast, iterative image reconstructionfor MRI in the presence of field inhomogeneities. IEEE Transactions on MedicalImaging 22(2), 178–188.
Tikhonov, A. N. (1963). Solution of incorrectly formulated problems and theregularization method. Soviet Math. Doklady 4, 1035–1038.
Topp, S., M. Stubgaard, S. K., and H. 0. (1993). Late Self-Refocusing FrequencySelective RF Pulses. In Proc. Intl. Soc. Mag. Reson. Med. 1, pp. 1183.
Toronov, V., T. Myllylä, V. Kiviniemi, and V. Tuchin (2013). Dynamics of thebrain: Mathematical models and non-invasive experimental studies. The EuropeanPhysical Journal Special Topics 222(10), 2607–2622.
Uhlenbeck, G. E. and S. Goudsmit (1926). Spinning Electrons and the Structure ofSpectra. Nature 117, 264–265.
vom Endt, A., J. Riegler, E. Eberlein, F. Schmitt, U. Dorbert, G. Krüger, and R. Gruet-ter (2007). A high-performance head gradient coil for 7T systems. In Proc. Intl.Soc. Mag. Reson. Med. 15.
Walsh, D. O., A. F. Gmitro, and M. W. Marcellin (2000). Adaptive reconstruction ofphased array MR imagery. Magnetic Resonance in Medicine 43(5), 682–690.
123

Bibliography
Weisskoff, R., C. S. Zuo, J. L. Boxerman, and B. R. Rosen (1994). Microscopic sus-ceptibility variation and transverse relaxation: Theory and experiment. MagneticResonance in Medicine 31(6), 601–610.
Wiggins, G. C., J. R. Polimeni, A. Potthast, M. Schmitt, V. Alagappan, and L. L.Wald (2009). 96-Channel receive-only head coil for 3 Tesla: design optimizationand evaluation. Magnetic Resonance in Medicine 62(3), 754–62.
Wiggins, G. C., C. Triantafyllou, A. Potthast, A. Reykowski, M. Nittka, and L. L.Wald (2006). 32-channel 3 Tesla receive-only phased-array head coil with soccer-ball element geometry. Magnetic Resonance in Medicine 56(1), 216–23.
Woessner, D. E. (1961). Effects of Diffusion in Nuclear Magnetic Resonance Spin-Echo Experiments. The Journal of Chemical Physics 34, 2057.
Wu, X.-L., P. Xu, and R. Freeman (1991). Delayed-focus pulses for magnetic reso-nance imaging: An evolutionary approach. Magnetic Resonance in Medicine 20(1),165–170.
Yang, Y., H. Gu, W. Zhan, S. Xu, D. A. Silbersweig, and E. Stern (2002). Simultaneousperfusion and BOLD imaging using reverse spiral scanning at 3T: Characteri-zation of functional contrast and susceptibility artifacts. Magnetic Resonance inMedicine 48(2), 278–289.
Zahneisen, B., T. Grotz, K. J. Lee, S. Ohlendorf, M. Reisert, M. Zaitsev, and J. Hennig(2011). Three-dimensional MR-encephalography: fast volumetric brain imagingusing rosette trajectories. Magnetic Resonance in Medicine 65, 1260–1268.
Zahneisen, B., T. Hugger, K. J. Lee, P. Levan, M. Reisert, H. L. Lee, J. Assländer,M. Zaitsev, and J. Hennig (2012). Single shot concentric shells trajectories forultra fast fMRI. Magnetic Resonance in Medicine 68(2), 484–94.
Zahneisen, B., B. A. Poser, T. Ernst, and V. A. Stenger (2014). Three-dimensionalFourier encoding of simultaneously excited slices: Generalized acquisition andreconstruction framework. Magnetic Resonance in Medicine 71(6), 2071–2081.
Zeeman, P. (1897). The Effect of Magnetisation on the Nature of Light Emitted by aSubstance. Nature 55, 347.
Zhong, K., J. Leupold, J. Hennig, and O. Speck (2007). Systematic investigationof balanced steady-state free precession for functional MRI in the human visualcortex at 3 Tesla. Magnetic Resonance in Medicine 57(1), 67–73.
124

A C K N O W L E D G E M E N T S
Under the assumption that all people involved have sufficient knowledge of lan-guage, I will switch to German at this point.
Ich bin allen dankbar, die mich in irgendeiner Weise während meiner Promotionunterstützt haben. Besonders hervorheben möchte ich dabei:
Jürgen Hennig für die Betreuung meiner Arbeit, vor allem aberauch für die wissenschaftlichen Freiheiten, die er mirgegeben hat.
Benjamin Zahneisenund Thimo Hugger für die Einarbeitung in das Projekt.
meine Bürokollegen für die stets entspannte und konstruktive Zusammen-arbeit.
die gesamten MR-Physik für das gute Arbeitsklima und all die Freundschaften,die daraus entstanden sind.
Steffen Glaserund seine Gruppe für die nette Zusammenarbeit und den Optimal Con-
trol Algorithmus, den sie mir zur Verfügung gestellthaben.
meine Familie für ihre fortwährende Unterstützung.
Rebecca dafür, dass sie da ist.
125