shock-tube data - ars.els-cdn.com · shock-tube data table a-1. shock-tube data for mixtures 1...
TRANSCRIPT

Shock-Tube Data
Table A-1. Shock-tube data for mixtures 1 through 3
T (K) P (atm) τign (μs)
Mixture 1 1670 1.03 119
1596 1.07 213
1575 1.05 203
1571 1.13 253
1520 1.09 317
1446 1.17 551
1429 1.08 653
1426 0.90 806
1351 1.18 1561
1291 1.10 1874
Mixture 2 1571 1.28 78
1536 1.30 124
1490 1.46 130
1481 1.47 134
1473 1.45 156
1464 1.44 167
1441 1.34 222
1431 1.44 202
1406 1.50 295
1398 1.34 365
1335 1.39 540
1330 1.52 506
1328 1.30 568
1305 1.61 780
1302 1.39 678
1268 1.42 1002
1259 1.61 1298
1248 1.59 1425
Mixture 3 1700 1.28 55
1564 1.28 155
1519 1.35 191
1457 1.39 363
1452 1.31 353
1395 1.36 578
1368 1.36 740
1324 1.39 1032
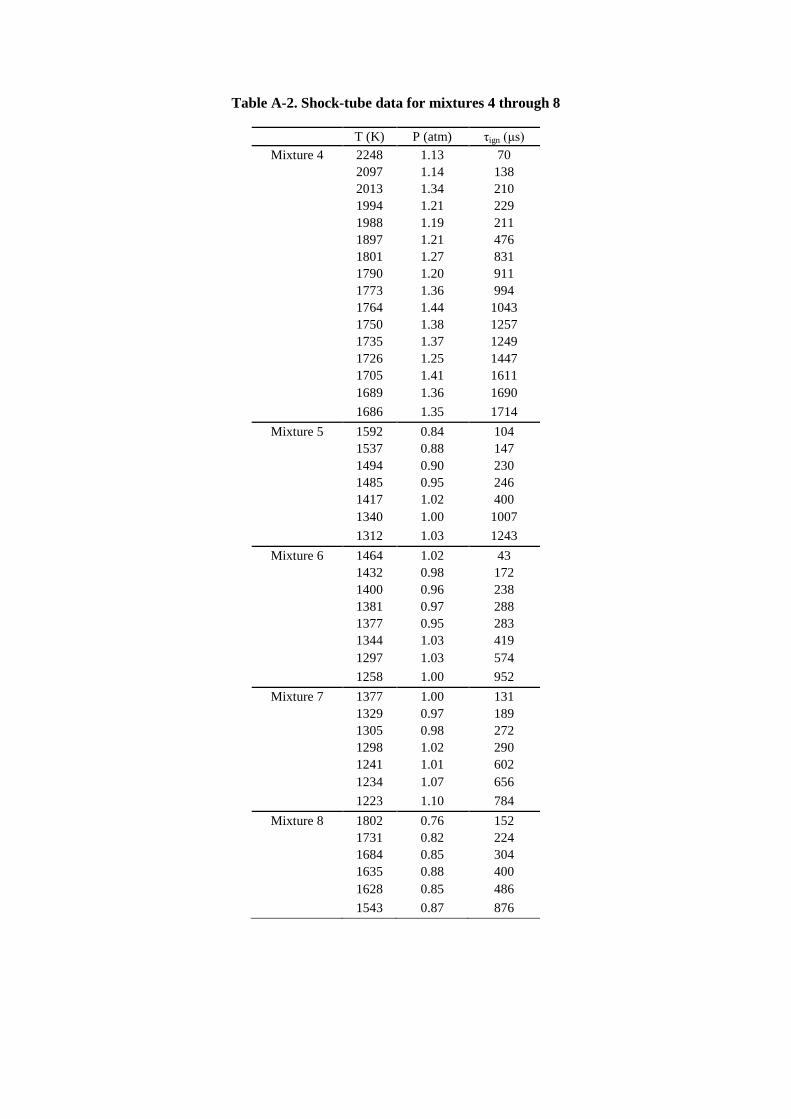
Table A-2. Shock-tube data for mixtures 4 through 8
T (K) P (atm) τign (μs)
Mixture 4 2248 1.13 70
2097 1.14 138
2013 1.34 210
1994 1.21 229
1988 1.19 211
1897 1.21 476
1801 1.27 831
1790 1.20 911
1773 1.36 994
1764 1.44 1043
1750 1.38 1257
1735 1.37 1249
1726 1.25 1447
1705 1.41 1611
1689 1.36 1690
1686 1.35 1714
Mixture 5 1592 0.84 104
1537 0.88 147
1494 0.90 230
1485 0.95 246
1417 1.02 400
1340 1.00 1007
1312 1.03 1243
Mixture 6 1464 1.02 43
1432 0.98 172
1400 0.96 238
1381 0.97 288
1377 0.95 283
1344 1.03 419
1297 1.03 574
1258 1.00 952
Mixture 7 1377 1.00 131
1329 0.97 189
1305 0.98 272
1298 1.02 290
1241 1.01 602
1234 1.07 656
1223 1.10 784
Mixture 8 1802 0.76 152
1731 0.82 224
1684 0.85 304
1635 0.88 400
1628 0.85 486
1543 0.87 876
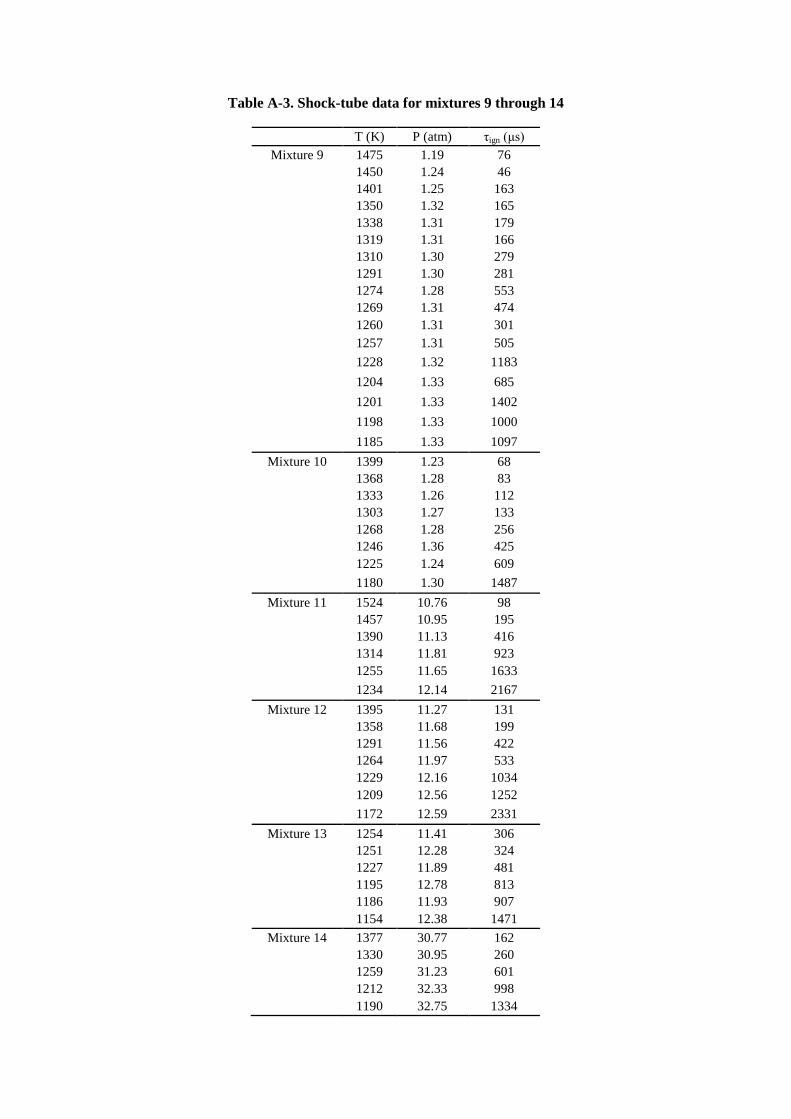
Table A-3. Shock-tube data for mixtures 9 through 14
T (K) P (atm) τign (μs)
Mixture 9 1475 1.19 76
1450 1.24 46
1401 1.25 163
1350 1.32 165
1338 1.31 179
1319 1.31 166
1310 1.30 279
1291 1.30 281
1274 1.28 553
1269 1.31 474
1260 1.31 301
1257 1.31 505
1228 1.32 1183
1204 1.33 685
1201 1.33 1402
1198 1.33 1000
1185 1.33 1097
Mixture 10 1399 1.23 68
1368 1.28 83
1333 1.26 112
1303 1.27 133
1268 1.28 256
1246 1.36 425
1225 1.24 609
1180 1.30 1487
Mixture 11 1524 10.76 98
1457 10.95 195
1390 11.13 416
1314 11.81 923
1255 11.65 1633
1234 12.14 2167
Mixture 12 1395 11.27 131
1358 11.68 199
1291 11.56 422
1264 11.97 533
1229 12.16 1034
1209 12.56 1252
1172 12.59 2331
Mixture 13 1254 11.41 306
1251 12.28 324
1227 11.89 481
1195 12.78 813
1186 11.93 907
1154 12.38 1471
Mixture 14 1377 30.77 162
1330 30.95 260
1259 31.23 601
1212 32.33 998
1190 32.75 1334

Table A-4. Shock-tube data for mixtures 15 through 20
T (K) P (atm) τign (μs)
Mixture 15 1389 15.21 153
1347 15.65 217
1315 15.82 316
1283 16.08 408
1248 16.16 654
1234 16.61 850
1226 16.81 901
Mixture 16 1775 27.87 135
1713 27.37 209
1626 26.75 475
1597 28.26 520
1589 28.23 610
1533 28.25 825
1496 28.31 1131
1470 29.00 1817
Mixture 17 1513 25.60 63
1438 26.38 92
1306 28.39 382
1241 29.96 481
1175 30.85 845
1143 30.70 1276
Mixture 18 1366 14.64 128
1255 14.46 333
1196 15.21 641
1156 15.90 1042
1094 15.97 2417
Mixture 19 1266 30.07 103
1252 28.99 127
1230 30.73 198
1227 29.15 125
1225 30.97 134
1214 30.09 263
1184 37.49 263
1169 30.94 316
1166 30.65 259
Mixture 20 1728 13.33 63
1583 13.79 224
1539 14.46 320
1467 14.52 739
1336 14.43 2068

Table A-5. Shock-tube data for mixtures 21 and 22
T (K) P (atm) τign (μs)
Mixture 21 1291 15.45 101
1249 15.70 212
1165 15.55 423
1126 16.19 928
1082 16.68 1581
Mixture 22 1304 15.74 77
1269 15.81 159
1269 15.79 111
1234 16.79 233
1199 15.72 237

Methane/Ethane Ignition Delay Time Predictions
For all plots AramcoMech_1.0 refers to the mechanism described in this work, GRI 3.0 as described
in [1], the Leeds mechanism is outlined in [2], Ranzi 1201 can be found in [3], while the San Diego
and USC II mechanisms are described in references [4]and [5], respectively.
Shock Tube
Target 1. This work
Figure 1. Methane/Ethane shock tube ignition delays mixtures 1–6. Symbols are experimental points, lines are model
predictions from AramcoMech_1.0, GRI 3.0, Leeds, Ranzi 1201, San Diego and USC II mechanisms.

Figure 2. Methane/Ethane shock tube ignition delays mixtures 7–12. Symbols are experimental points, lines are
model predictions from ArmacoMech_1.0, GRI 3.0, Leeds, Ranzi 1201, San Diego and USC II mechanisms.
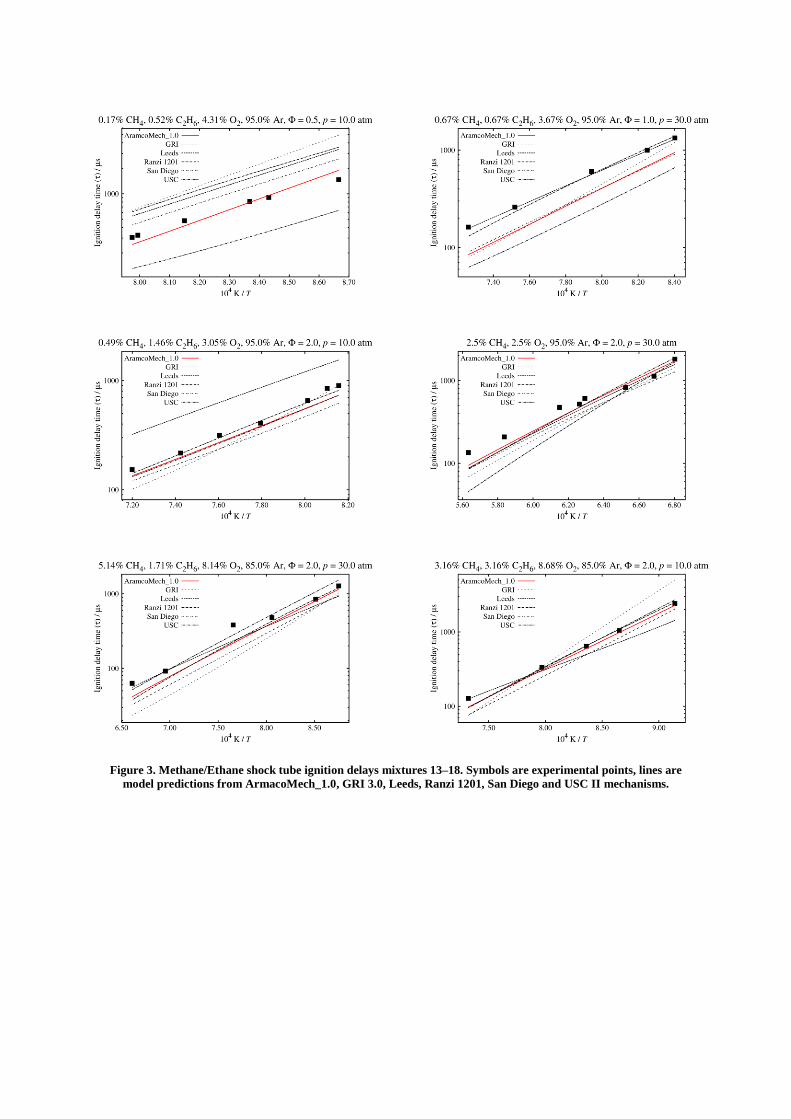
Figure 3. Methane/Ethane shock tube ignition delays mixtures 13–18. Symbols are experimental points, lines are
model predictions from ArmacoMech_1.0, GRI 3.0, Leeds, Ranzi 1201, San Diego and USC II mechanisms.
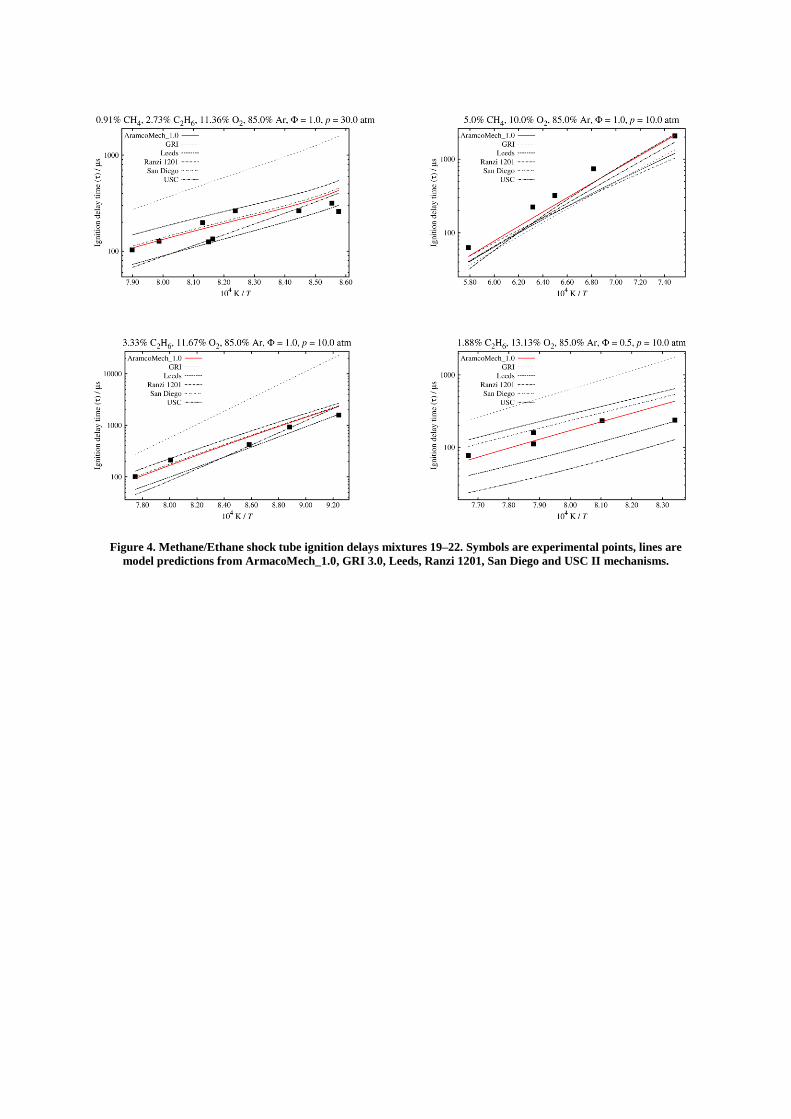
Figure 4. Methane/Ethane shock tube ignition delays mixtures 19–22. Symbols are experimental points, lines are
model predictions from ArmacoMech_1.0, GRI 3.0, Leeds, Ranzi 1201, San Diego and USC II mechanisms.
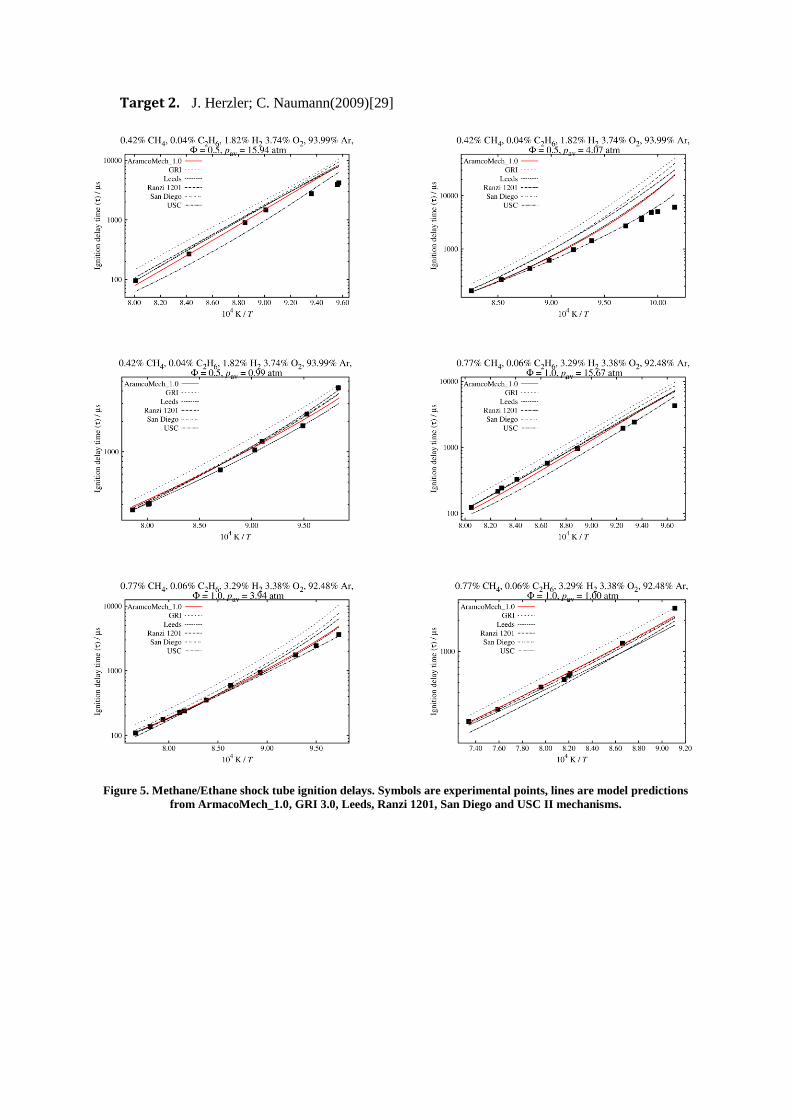
Target 2. J. Herzler; C. Naumann(2009)[29]
Figure 5. Methane/Ethane shock tube ignition delays. Symbols are experimental points, lines are model predictions
from ArmacoMech_1.0, GRI 3.0, Leeds, Ranzi 1201, San Diego and USC II mechanisms.
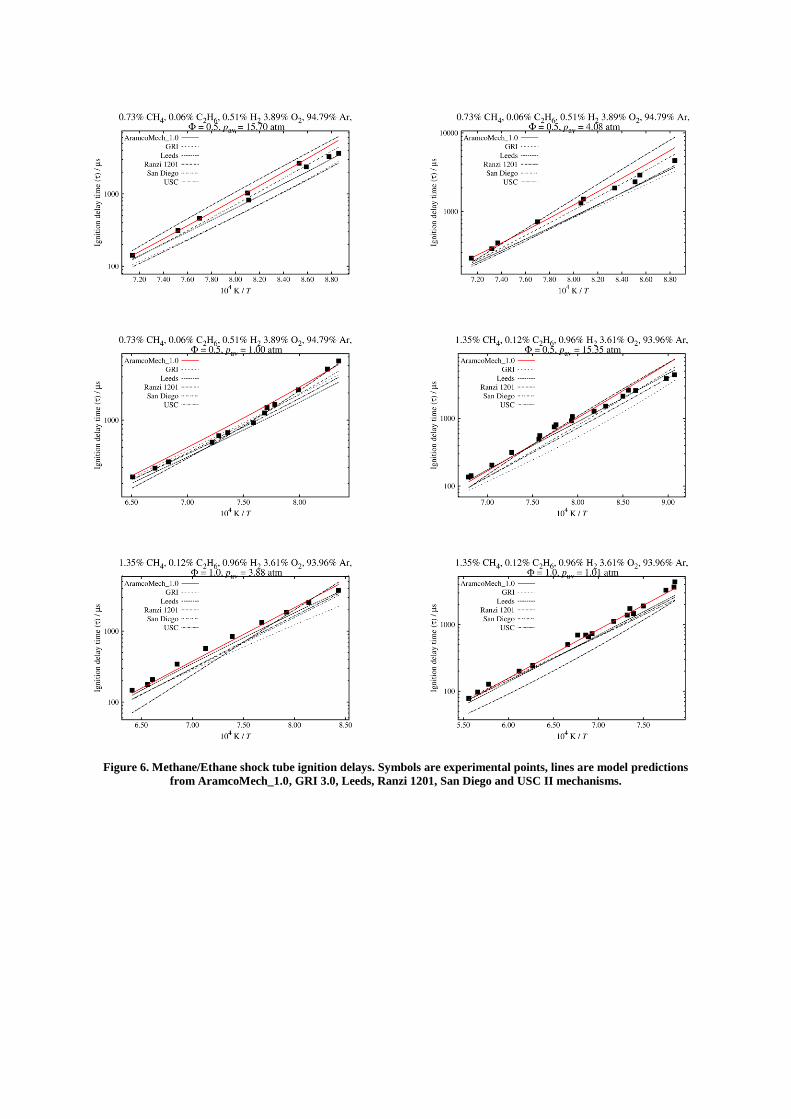
Figure 6. Methane/Ethane shock tube ignition delays. Symbols are experimental points, lines are model predictions
from AramcoMech_1.0, GRI 3.0, Leeds, Ranzi 1201, San Diego and USC II mechanisms.
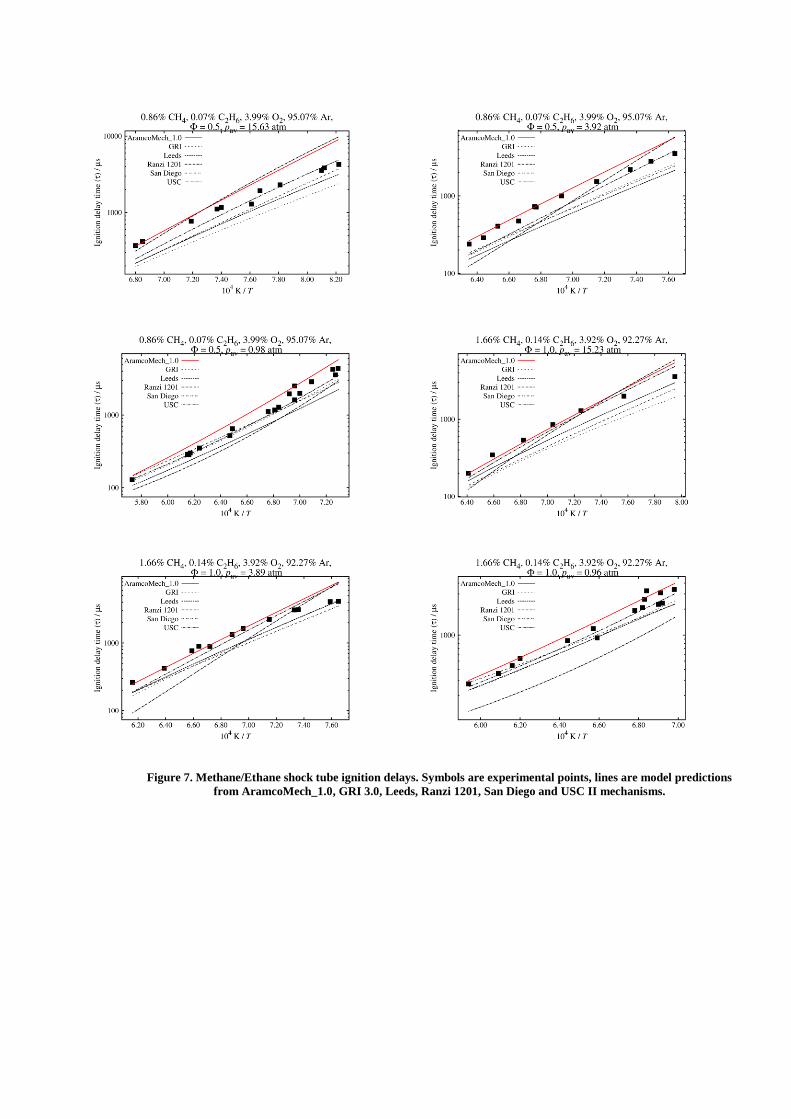
Figure 7. Methane/Ethane shock tube ignition delays. Symbols are experimental points, lines are model predictions
from AramcoMech_1.0, GRI 3.0, Leeds, Ranzi 1201, San Diego and USC II mechanisms.

Flame Speeds
Target 3. W. Lowry; J. d. Vries; M. Krejci; E. Petersen; Z. Serinyel; W. Metcalfe; H. Curran;
G. Bourque (2011)[7]
Target 4. Y. Kochar; J. Seitzman; T. Lieuwen; W. K. Metcalfe; S. M. Burke; H. J. Curran; M.
Krejci; W. Lowry; E. Petersen; G. Bourque(2011)[8]
Figure 8. Methane/Ethane flame speed measurements. Solid symbols are experimental points, lines are model
predictions from ArmacoMech_1.0 (solid), GRI 3.0 (dashed), Ranzi 1201 (dash dot), San Diego (dotted/open symbols)
and USC II (dash dot dot) mechanisms.
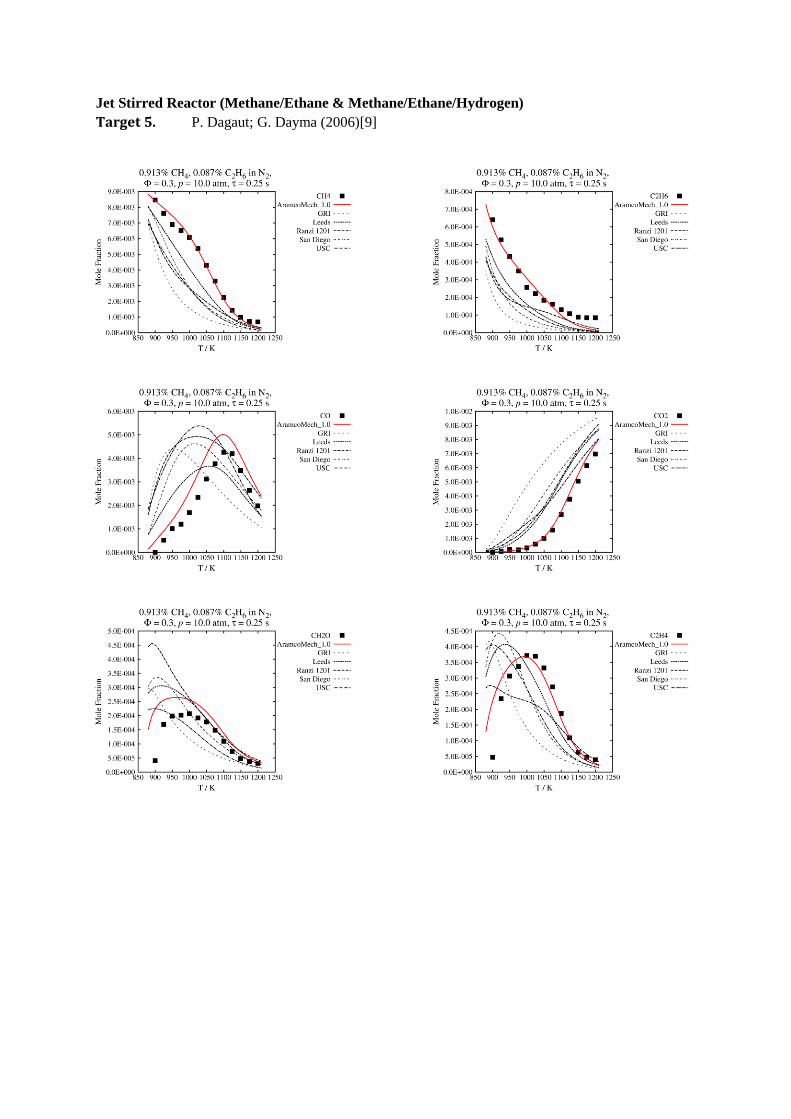
Jet Stirred Reactor (Methane/Ethane & Methane/Ethane/Hydrogen)
Target 5. P. Dagaut; G. Dayma (2006)[9]
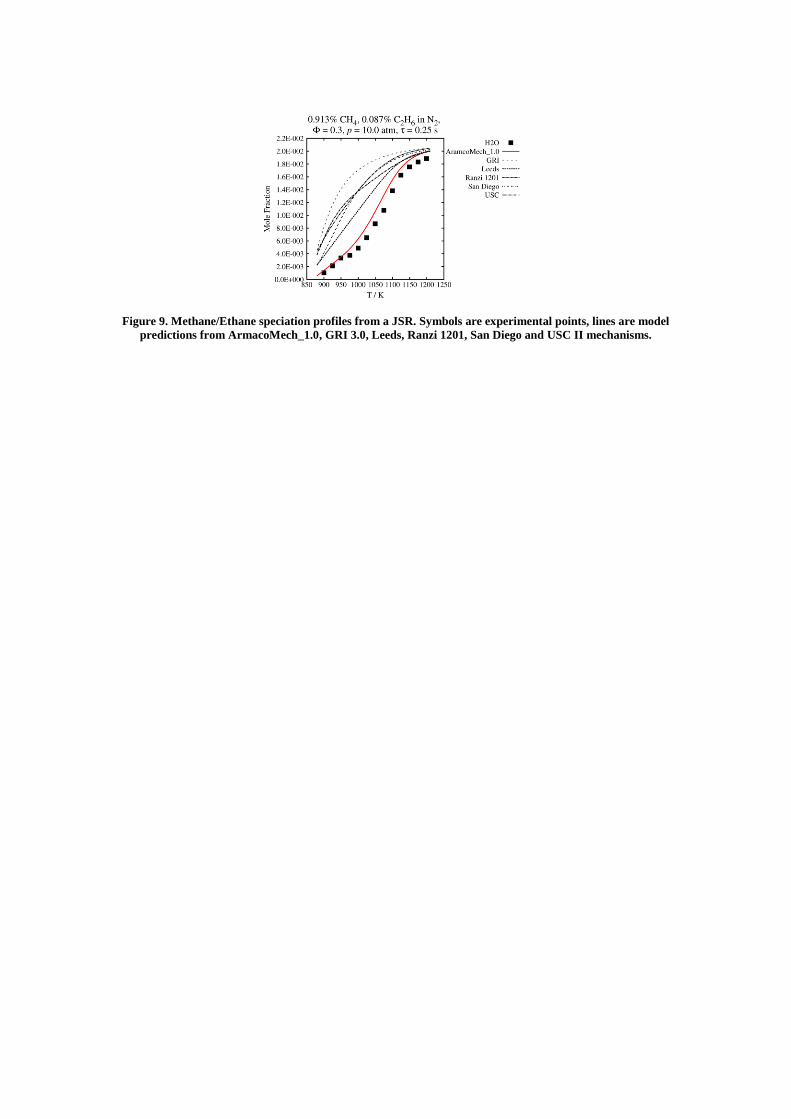
Figure 9. Methane/Ethane speciation profiles from a JSR. Symbols are experimental points, lines are model
predictions from ArmacoMech_1.0, GRI 3.0, Leeds, Ranzi 1201, San Diego and USC II mechanisms.
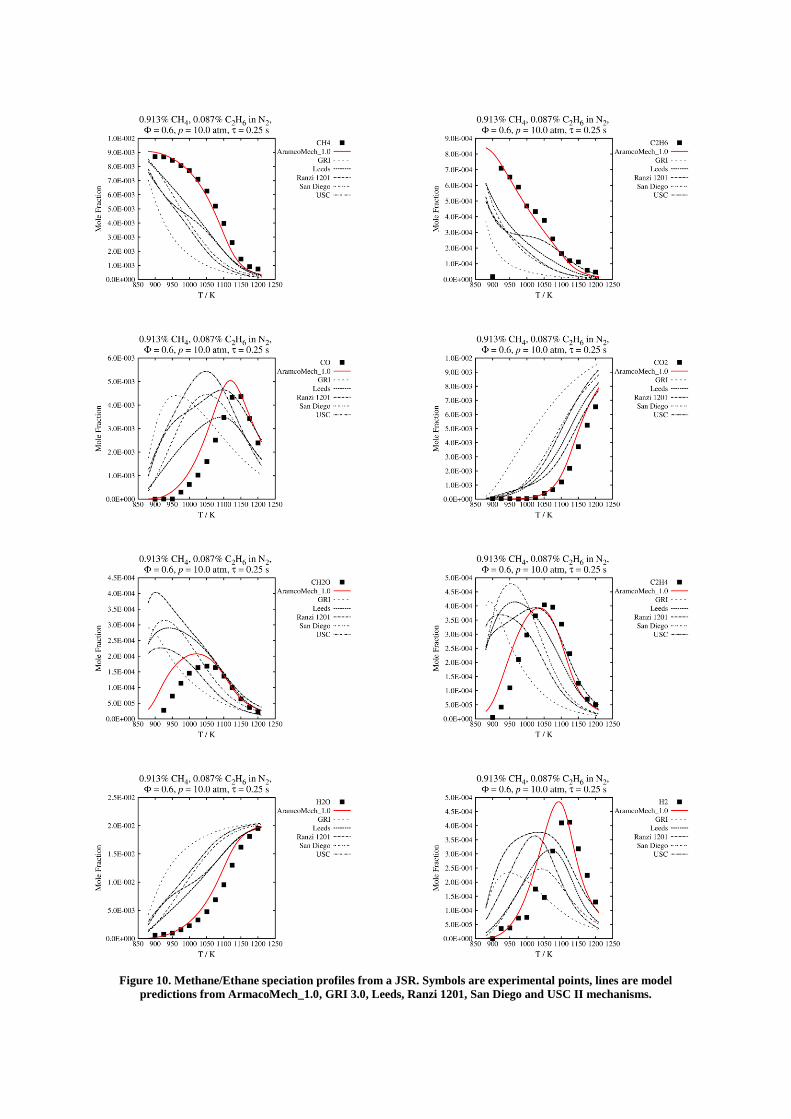
Figure 10. Methane/Ethane speciation profiles from a JSR. Symbols are experimental points, lines are model
predictions from ArmacoMech_1.0, GRI 3.0, Leeds, Ranzi 1201, San Diego and USC II mechanisms.

Figure 11. Methane/Ethane speciation profiles from a JSR. Symbols are experimental points, lines are model
predictions from ArmacoMech_1.0, GRI 3.0, Leeds, Ranzi 1201, San Diego and USC II mechanisms.

Figure 12. Methane/Ethane/Hydrogen speciation profiles from a JSR. Symbols are experimental points, lines are
model predictions from ArmacoMech_1.0, GRI 3.0, Leeds, Ranzi 1201, San Diego and USC II mechanisms.
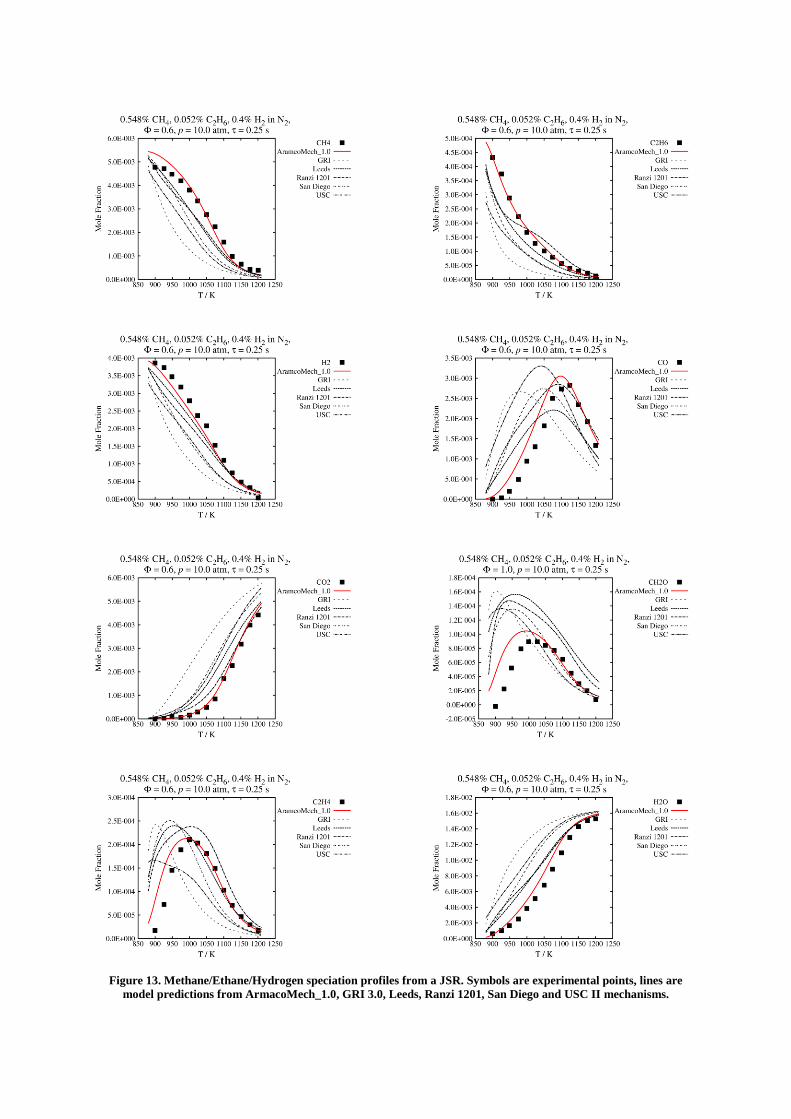
Figure 13. Methane/Ethane/Hydrogen speciation profiles from a JSR. Symbols are experimental points, lines are
model predictions from ArmacoMech_1.0, GRI 3.0, Leeds, Ranzi 1201, San Diego and USC II mechanisms.
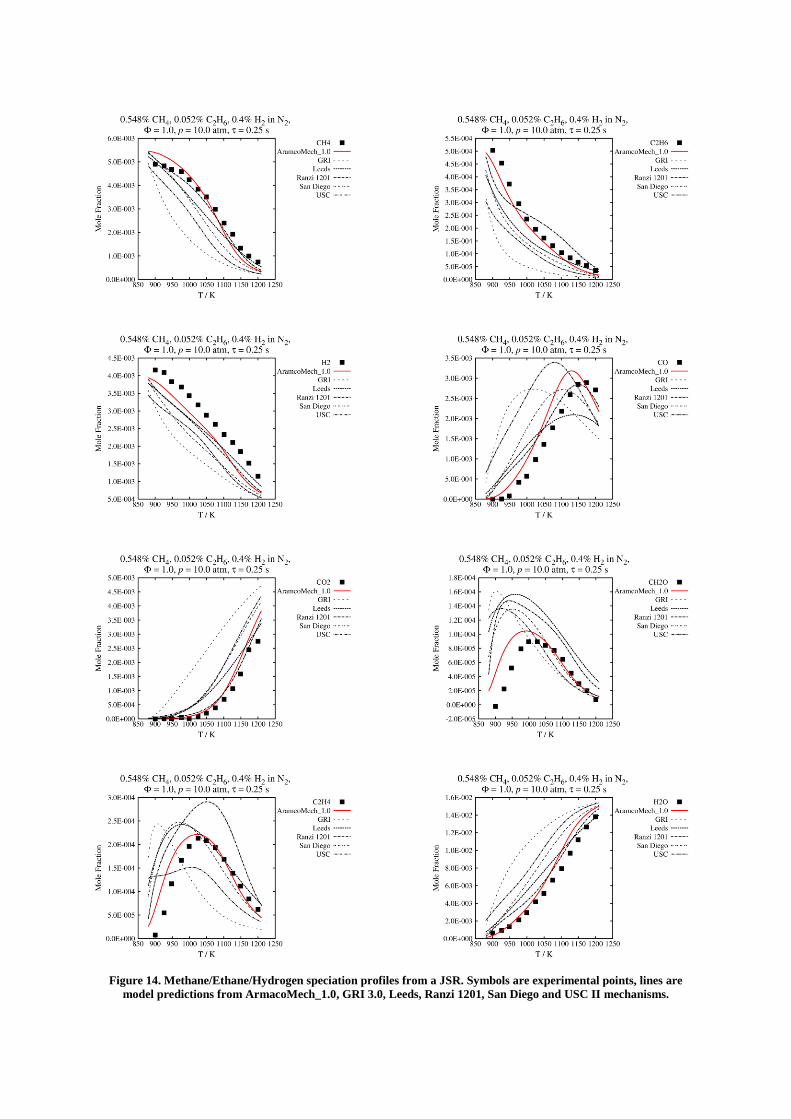
Figure 14. Methane/Ethane/Hydrogen speciation profiles from a JSR. Symbols are experimental points, lines are
model predictions from ArmacoMech_1.0, GRI 3.0, Leeds, Ranzi 1201, San Diego and USC II mechanisms.

Figure 15. Methane/Ethane/Hydrogen speciation profiles from a JSR. Symbols are experimental points, lines are
model predictions from ArmacoMech_1.0, GRI 3.0, Leeds, Ranzi 1201, San Diego and USC II mechanisms.
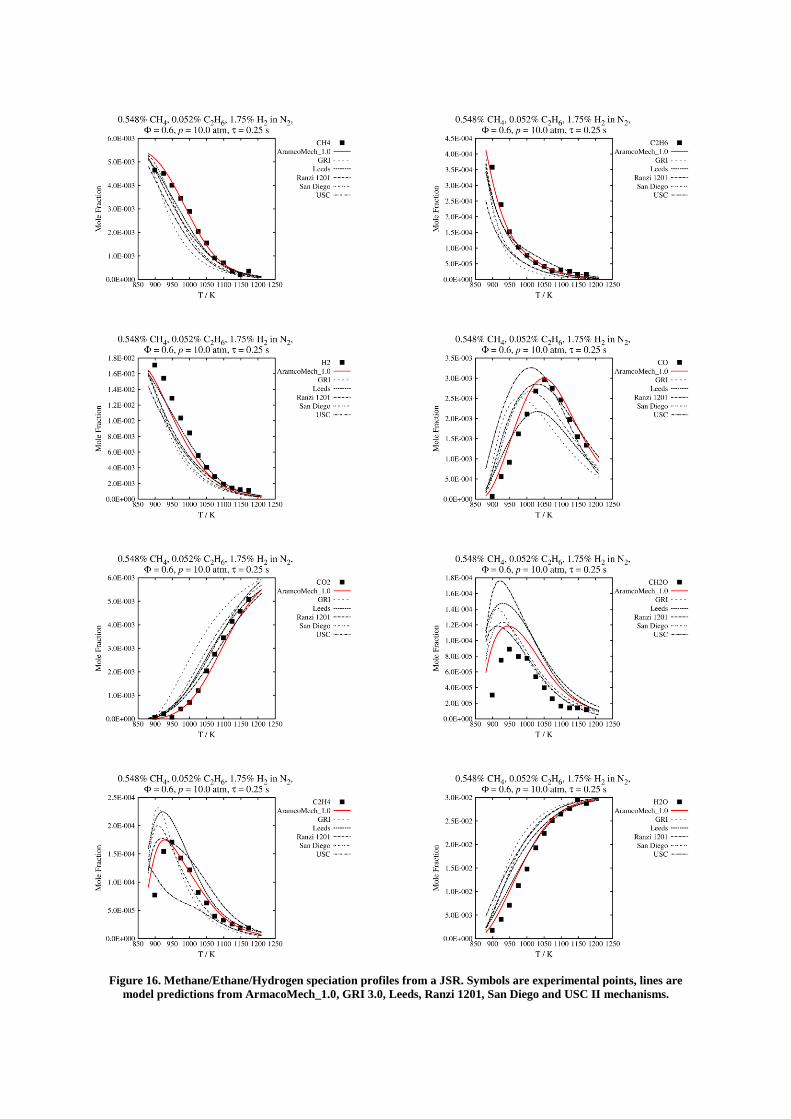
Figure 16. Methane/Ethane/Hydrogen speciation profiles from a JSR. Symbols are experimental points, lines are
model predictions from ArmacoMech_1.0, GRI 3.0, Leeds, Ranzi 1201, San Diego and USC II mechanisms.

Figure 17. Methane/Ethane/Hydrogen speciation profiles from a JSR. Symbols are experimental points, lines are
model predictions from ArmacoMech_1.0, GRI 3.0, Leeds, Ranzi 1201, San Diego and USC II mechanisms.
References
[1] G.P. Smith, D.M. Golden, M. Frenklach, N.W. Moriarty, B. Eiteneer, M. Goldenberg,
C.T. Bowman, R.K. Hanson, S. Song, W.C. Gardiner, Jr., V.V. Lissianski, Z. Qin,
http://www.me.berkeley.edu/gri_mech/
[2] K.J. Hughes, T. Turanyi, M.J. Pilling. The Leeds methane oxidation mechanism
Version 1.5. 2001; Available from:
http://garfield.chem.elte.hu/Combustion/mechanisms/metan15.dat
[3] C1–C3 mechanism version 1201. 2012; Available from:
http://creckmodeling.chem.polimi.it/kinetic.html.
[4] Chemical-Kinetic Mechanisms for Combustion Applications, Mechanical and
Aerospace Engineering (Combustion Research), University of California at San
Diego. 2011; Available from: http://combustion.ucsd.edu.
[5] Hai Wang, X.Y., Ameya V. Joshi, Scott G. Davis, Alexander Laskin, Fokion
Egolfopoulos, Chung K. Law. USC Mech. Version II. High-Temperature Combustion
Reaction Model of H2/CO/C1-C4 Compounds. 2007; Available from:
http://ignis.usc.edu/USC_Mech_II.htm.
[6] J. Herzler, C. Naumann, Proc. Combust. Inst. 32 (2009) 213-220.
[7] W. Lowry, J. de Vries, M. Krejci, E. Petersen, Z. Serinyel, W. Metcalfe, H. Curran,
G. Bourque J Eng Gas Turb Power 133(9) (2011) 091501
[8] Y. Kochar, J. Seitzman, T. Lieuwen, W.K. Metcalfe, S.M. Burke, H.J. Curran, M.
Krejci, W. Lowry, E. Petersen, G. Bourque, ASME Paper GT2011-45122, 56th
ASME Turbo Expo, 2011.
[9] P. Dagaut, G. Dayma,. Int. J. Hydrogen Energy, 31 (2006) 505-515.