shoibal chakravarty - fondazione eni enrico mattei · the energy indicators for sustainable...
TRANSCRIPT


“Energy poverty alleviation and climate change mitigation: is there a trade off?”
Shoibal Chakravarty1 and Massimo Tavoni2
Abstract
Energy poverty alleviation has become an important political issue in the most recent years. Several initiatives
and policies have been proposed to deal with poor access to modern sources of energy in many developing
countries. Given the large number of people lacking basic energy services, an important question is whether
providing universal access to modern energy could significantly increase CO2 emissions. This paper provides one
of the few formal assessments of this problem by means of a simple but robust model of current and future
energy consumption. The model allows mapping energy consumption globally for different classes of energy
use, quantifying current and future imbalances in the distribution of energy consumption. Our results indicate
that an energy poverty eradication policy to be met by 2030 would increase global final energy consumption by
about 7% (or 19EJ). This is the same quantity of energy which would be added between now and 2030 by
individuals with energy consumption above current European standards. The additional energy infrastructure
needed to eradicate energy poverty would produce 16-131 GtCO2 over the 21st century and contribute at most
0.1C of additional warming.
Introduction and motivation
Understanding the distribution of current and future energy needs is an important goal for research and policy
alike. On the one hand, lack of access to reliable energy is believed to hamper economic growth in poor
economies. This is known as ‘energy poverty’, and has received increased political attention in most recent
years. On the other, energy consumption met with the current fossil fuel based energy mix leads to emissions of
greenhouse gases, which are accumulating in the atmosphere and are the major source of global climate
change. Understanding the extent to which these two global problems interact with each other would allow us
to better understand which policy instruments can be put in place if both problems were to be tackled.
The contribution of this paper is to provide some quantitative input to this discussion. We employ a reasonably
simple model calibrated on data on consumption and income distributions, and show that it can replicate quite
accurately the current distribution of final energy consumption by households. We use the model to assess the
pressing policy issue of energy access to different parts of the society, and evaluate the impacts of energy
poverty alleviation in terms of additional demand of energy and associated greenhouse gas emissions for
different carbon intensity assumptions. Our tool is useful for mapping and representing global imbalances: we
show that now the poorest 3 Billion people have negligible energy consumption, and that the 1 Billion people
with energy consumption equal or above the European standards use 3/4th of total final energy. Taking as given
1 Princeton University
2 Euro-Mediterranean Center on Climate Change (CMCC) and Fondazione Eni Enrico Mattei (FEEM).

the projections of international agencies such as the IEA, we show that in a Business as Usual scenario in 2030,
minor changes would occur in the low energy consumption categories, with roughly the same number of
people lacking access to basic human energy needs, though with an increased concentration in Africa. On the
other hand, there will be a large number of additions in the higher energy consumption categories, mostly
driven by economic development in the fast growing economies. We estimate the additional energy demand
which would be required to eradicate energy poverty at about 20EJ in 2030, less than 10% of the projected
consumption in a BAU. With different assumptions about the carbon intensity of energy infrastructure, this
additional demand would generate carbon emissions over the century in the range of 16-131 GtCO2. This
corresponds to a relatively minor contribution to global warming. Our analysis thus supports the thesis that
energy poverty and climate change policies can be set independently from each other.
Measuring energy needs
The debate surrounding energy access has become a key one in energy policymaking over the last few years, an
acknowledgment of the important role of energy in development. Though energy poverty cannot be completely
distinguished from traditional poverty alleviation, its independent assessment is important for various reasons.
First, though poverty traps have long been recognized, their solution in terms of policy intervention is still
highly debated, with the traditional divide between strong government intervention and lasses faire being
blurred by the large evidence now accumulated in randomized experiments (Duflo and Banerjee, 2011).
Second, the policy relevance of the subject has motivated a push towards new measurements and data
collection of energy poverty, paving the way for additional and more accurate research in the field. Finally,
energy access is intertwined with other pressing global issues, in particular the fight against global climate
change. A joint solution of these two issues is required even if their exact interdependence is still to be
resolved. Against this background, most of the academic discussion on energy poverty has focused on
measurement and policy, but has not yet developed formal tools to generate numerical estimates of the
impacts of energy poverty alleviation, with only few recent exceptions (Bazilian et al., 2011). Similarly, the
integrated assessment modeling community -which plays an active role in the assessment of climate mitigation
scenarios in the IPCC- has recently made steps forward towards an integrated modeling approach to energy
sustainability (McCollum et al., 2011), but has dealt only to a limited extent with energy poverty (Ekholm et al.,
2010).
The objective of this paper is to shed light on these issues by providing a quantitative assessment of the
distribution of future energy needs at the global level. This allows us to pin down where energy demand growth
will come from, not only in terms of country of residence but also in terms of segments of population, defined
by levels of energy consumption. We estimate the energy needs of the poorest segments and the range of
additional emissions, depending on the possible primary energy sources. The magnitude of global poverty
cannot be exaggerated and energy poverty is no exception. The IEA estimates that about 1.3 Billion people do
not have access to electricity, the FAO states that 1 Billion people are undernourished and the WHO estimates
that 830 Million urban residents live in slums. And the latest estimates of poverty measured in dollar terms
from the World Bank suggest that roughly 1.3 Billion people live below the poverty line of 1.25$ a day. The
various dimensions of poverty – energy, food, health and sanitation – have significant overlap but are not
perfectly correlated (Pachauri and Spreng, 2011). This has led to a considerable effort in the field to construct
relevant measures of energy poverty. Several indices have been proposed in the past few years, among which

the Energy Indicators for Sustainable Development(Foster et al., 2000; Vera and Langlois, 2007) , the Access-
Consumption matrix (Pachauri et al., 2004), the Energy for Development Index (IEA 2010), the Total Energy
Inconvenience Threshold (Mirza and Szirmai, 2010) and the Multidimensional Energy Poverty Index
(Nussbaumer et al., 2011). This incomplete list reflects the challenge of measuring and even of defining
poverty: this should come as no surprise to poverty experts, who are aware that the concept of absolute
poverty is a contested one, as testified by the existence of poverty glossary books (Spicker et al., 2007).
The Copenhagen declaration of the world summit for social development defines absolute poverty as “a
condition characterized by severe deprivation of basic human needs, including food, safe drinking water,
sanitation facilities, health, shelter, education and information. It depends not only on income but also on access
to social services”. Strikingly, energy does not appear in the list, though its availability is instrumental for most if
not all the listed basic needs. As noted above, energy poverty experts have struggled to generate indexes which
capture the multidimensional essence of energy poverty, but generally speaking two main approaches have
been followed (Kemmler and Spreng, 2007): either based on engineering/bottom up estimates of energy needs
and access to energy services, or from standard income/consumption poverty measures. Direct estimates of
energy needs and services are more accurate, but are not available for all countries, and vary in definition and
measurement. Income and consumption poverty data is much richer, mostly as a result of significant data
collection through surveys coordinated by the World Bank, but is an imperfect indicator of energy poverty. A
trade-off between the two is unavoidable. For the sake of this paper, we will stick to the consumption poverty
definition, since our intention is to build a global mapping of energy needs, and to focus not only on the poorest
but across all the main different energy consumption classes, for which a strong correlation between energy
and income has been established (see for example, (Lenzen et al., 2006)).
Data and Methods
The approach we follow is that of building a transparent yet rigorous model which can generate global, regional
and national maps of final energy consumption for households, by different classes of energy consumption, and
to use it to project forward in time the distribution of energy demand. This approach builds upon and extends
(Chakravarty et al., 2009). Assuming that household energy consumption and income or consumption are
related by a power law relation, as suggested in several empirical studies (Lenzen et al., 2006), we build
distributions of household energy consumption at the country level.
In order to do so, we avail of a comprehensive database on income and consumption distributions using World
Bank and UNU-WIDER income distribution survey databases3. The data is usually provided in term income or
expenditure share of quintiles, and covers most of the world countries. This can be converted to a discrete
income inequality Lorenz curve which is simply the plot of the cumulative income share vs. the cumulative
population share. We model each country income distribution using a Beta 2 probability distribution estimated
3 UNU-WIDER World Income Inequality Database, Version 2.0c, May 2008.
http://www.wider.unu.edu/research/Database/en_GB/database/ accessed online 15/3/2012, and World Development Indicators (various years) http://data.worldbank.org/data-catalog/world-development-indicators, Accessed online 15/3/2012.

using a non-linear least square fit of the model Lorenz curve against the data (Chotikapanich et al., 2007). The
Beta 2 function is defined as follows:
where B(p, q) is the Beta function. Household energy consumption is related to income/consumption by a
constant elasticity of 0.8, in line with the central estimates of the empirical evidence based on energy surveys,
though we provide a sensitivity analysis to this important parameter. The Beta 2 distribution can be converted
to a generalized Beta 2 distribution of population density as a function of energy consumption, given the
assumption of a power law relation between expenditures and energy consumption.
The data on energy consumption is derived from IEA (Extended World Energy Balances), measured in final
energy consumption units. Since we focus on policies to provide access to modern energy, we disregard the
traditional energy source component of the IEA's energy statistics. Moreover, since we are interested in
household energy consumption, we consider only the fraction of final energy associated to consumption and
not to production; to this end we use the coefficients estimated in (Peters and Hertwich, 2008) to separate
direct and indirect household energy consumption.
As for future projections, we use the World Economic Outlook 2011 (IEA) energy and population projections to
2030. We aggregate the country level energy probability distributions into the 14 macro regions used in the IEA
projections4, and for simplicity assume that the parameters of the Beta2 distribution do not change over time
(i.e., constant inequality). One additional assumption that we make is that 2030 population of the energy poor
is an upper bound on the population of the energy poor in the 21st century. The model is written in an open
source language (Python), and is freely available upon request.
Finally, in order to convert energy consumption to emissions of greenhouse gases, we employ different
estimates for the carbon intensity of energy and the replacement of the energy infrastructure. The high
emissions case derives from coal powered electricity (0.9 kgCO2/KWh) and oil (0.91 kgCO2/kg) as fuel, and the
low emissions case derive from renewable (0.5kgCO2/KWh) and gas (0.5kgCO2/kg oil eq). The global
temperature rise associated with these emissions is estimated using the linear relationship between cumulative
emissions and equilibrium temperature rise as proposed in the carbon budget approach (Zickfeld et al., 2009).
In order to simplify the representation of continuous probability density functions, and to provide a more clear
connection to policy, we use five representative categories of energy consumption defined by the thresholds
shown in Table 1. The first three signposts have been proposed by UN Secretary-General's Advisory Group on
Energy and Climate Change (AGECC, 2010), and represent key incremental steps in the energy access matrix, in
terms of basic human needs, productive uses, and modern society. Basic human needs provide basic energy
services in terms of electricity for lighting, health, education, communication and community services, as well
as modern fuels for cooking and heating. Productive uses provide electricity and fuels to increase productivity in
agriculture, commercial activities and transportation. Modern society refers to energy services for more
domestic appliances, for cooling and heating, and for private transportation. Since our scope is to provide a
4 These are 'USA', 'OtherOecdAmericas', 'OecdEurope', 'Japan', 'OtherOecdAsiaOceania', 'Russia',
'OtherEastEuropeEurasia', 'China', 'India', 'OtherNonOecdAsia', 'MiddleEast', 'Africa', 'Brazil', 'OtherLatinAmerica'.

mapping of the whole society , we add a fourth category of ‘higher energy consumers’, defined by consumption
equal or above the current European average.
Category definition
Energy Consumption
(GJ/cap*year)
CO2 emissions at current
global average energy mix
(tCO2/cap*year)
Basic Human Needs:
100kwh/cap*yr + 100 kgoil/cap*yr 5 0.41
Productive Uses:
750kwh/cap*yr + 150 kgoil/cap*yr 10 0.83
Modern society:
2000kwh/cap*yr + 375 kgoil/cap*yr 25 2.1
EU average (half the US average)
75 6.2
Table 1. Categories of final energy consumption and associated emissions.
Policies defined in terms of universal energy access by the UN encompass both the Basic Human Needs and the
Productive uses.
Mapping energy needs globally, now and then.
We are now ready to present the main results of the model used in this paper. Figure 1 reports our main results
in terms of global current and future distribution of population (left panel) and energy (right panel), across the
five energy consumption categories of Table 1. The chart shows that both now and in a 2030 BAU scenario5, a
large fraction of global population will lack access to basic human needs (1.8 Billion people) and productive
uses (3.4 Billion people). These numbers match quite well the current estimates of energy poverty. Between
now and 2030 more than 1 Billion people will be added; about 1/3 will go in the third and fourth energy
consumption categories (10-25, 25-75 GJ/cap*year), reflecting the growth of the global middle class. A more
modest population increase would occur in the energy poverty and in the energy rich categories (in the order of
150 Million people added to each bin).
Turning to the distribution of energy (right panel), the chart clearly highlights the global imbalances in energy
consumption. The almost 3 and 1/2 Billion energy poor contribute negligibly to global energy consumption, with
less than 10% of the total household final energy demand. At the other hand of the spectrum, the 1 Billion
people with energy consumption levels at or above European standards is responsible for half of global energy
consumption. This is also the category where most additional energy will be consumed in 2030 with respect of
5 As defined by the IEA as ‘New policy scenario’.

todays (20 more EJ), despite the limited additions in terms of population as just noticed. The category of
consumption between 25 and 75 GJ/cap follows close. The appendix provides some sensitivity with respect to
the elasticity between income and energy consumption (assumed to be equal to 0.8 for all regions in the base
case), indicating that the picture shown in Figure 1 is quite robust6.
Figure 1. Global distribution of population (left panel) and HH final energy (right panel) across the 5
energy consumption categories, in 2009 (white bars), and additions from 2009 to 2030 (colored bars).
The models also allow us to determine the regional repartition of the population and the energy consumption
distributions, see Figure 2. Africa is the region where about 40% of the energy poorer (below the basic energy
need consumption of 5GJ) reside today, and this figure is projected to increase and approach 60% in 2030, due
to strong population growth and moderate energy consumption increases in a BAU. India instead would reduce
its significant role in the lowest category (from 25% to 10%) but would be by far the largest contributor (almost
50%%) of the second category with consumption levels still below productive uses. Moving up in the categories,
the most notable change is -perhaps unsurprisingly- China, which would increase its share in the upper two
categories, reaching 30% and 6% in 2030 respectively. In the top category with energy consumption levels
above those of European standards, the OECD countries will continue to remain the largest contributors, with
6 It is worth reminding that the global figures won’t change since we are taking them as given in the IEA projections;
only the distribution of population and energy across the 5 categories will change.

60% of the population in the top bin being from the OECD in 2030. Energy exporting countries like Russia, and
Middle East are also play an important role in the top categories, despite lower average per capita income, due
to high energy intensity.

Figure 2. Regional shares of population across the 5 energy consumption categories in 2009 (lower
panel) and 2030 (upper panel).
The energy and climate impacts of poverty alleviation
By allowing to map individual energy consumption now and in the future, our analysis has indicated that energy
poverty is and will remain prominent in the years to come without targeted policy intervention (and provided
such policies would work). However, it is important to keep in mind that alleviating energy poverty is not just a
tremendous challenge per se, but that it also inter-relates to other key pressing issues related to sustainability.
It is thus important to be able to quantify the implications of poverty alleviation on future energy consumption
and on associated emissions of greenhouse gases. The available literature provides a contrasting picture. Most
assessments by international organization and experts actives in the field suggest these to be quite moderate.
For example, the IEA estimates that universal access by 2030 would increase electricity by 2.5%, and fossil fuels
by 0.8%. The World Bank estimates that the additional emissions needed to provide universal access to
electricity could be offset by a switch of the US vehicle fleet to European standards (The World Bank, n.d.) .
However, the impacts might be substantial at the regional level: for example it has been estimated that power
installed capacity in Africa 2030 would increase from 79 to 500 GW to provide full electricity access(Bazilian et
al., 2011). Moreover, poverty alleviation measures might promote economic growth and yield an increase in
energy demand beyond expectations provided that the elasticities between income and energy are sufficiently
high. This has led some researchers to go as far as suggesting that neglecting poverty reduction and pro-poor
growth policies is leading us to grossly underestimate future energy use (Gertler et al., 2011; Wolfram et al.,
2012).
Several targets can be defined when dealing with poverty alleviation. Here we retain the one in line with the
U.N. categories of Table 1, and work out the implications of a policy which would grant universal access by 2030
to a minimum of 10GJ/capita*year, so as to ensure productive uses of energy. In the jargon of our graphs, this
would correspond to providing additional energy to the roughly 3.5 Billion people, so that by 2030 no one
would be left in the lowest two categories; the additional energy would be directed mostly to the 1.8 Billion
energy poorer, but also to those who have basic needs but lack productive uses. Table 2 summarizes the results
of this energy poverty eradication programme for the mostly affected regions, as well as globally. It indicates
that globally the additional energy consumption of this poverty alleviation programme would be slightly less
than 20 EJ, or about 7% of total final energy consumption in 2030. The bulk of the additions would fall on Africa,
whose aggregate final household energy consumption would need to exactly double with respect to the case
without a poverty alleviation policy. Significant increases in demand –in the order of 20%- would also result in
South and South-East Asia. This suggests that albeit the minor global impacts of energy poverty eradication,
some regions would experience quite dramatic changes. The extra energy consumption would be significant for
some countries, and could be mitigated in several ways: savings could be induced by the potential price
increase of energy due to the increased demand, depending on the price elasticity of energy consumption
(which is rather low), and price responsiveness to more demand (probably rather small at the global level,
though not necessarily so locally). Efficiency considerations can be built in the access programmes facilitating a
synergy between energy savings and poverty policies (Pachauri et al., 2012)�. Nonetheless, we should
remember that these are exactly the countries that would benefit the most from energy poverty alleviation,

and the significant increase in energy consumption will have a large positive impact on global welfare. The real
question is whether the regions involved will generate the economic growth to afford the incremental costs.
Region
Final HH Energy
Consumption in
a BAU
(EJ)
Additional Energy
consumption for the
poverty eradication
policy (EJ)
Energy
consumption
increase over
BAU(%)
World 254.4 18.9 7%
Africa 9.5 9.7 102%
India 14.8 3.4 23%
Other Non Oecd
Asia
18.0 3.9 22%
China 38.1 0.87 2%
Other Latin
America
8.3 0.66 8%
Brazil 7.3 0.18 2%
Table 2. The impacts of energy poverty eradication policy in 2030 on energy consumption, regionally
and globally.
The additional energy demand can also be translated into additional CO2 emissions depending on the carbon
intensity of the energy mix. This is important when we want to assess the extent to which the energy poverty
and the climate change agenda interact with each other. In order to do so, we assess different scenarios of
carbon intensity of the energy mix, for a targeted energy poverty policy which linearly ramps up the energy
consumption of the energy poor such that in 2030 the minimum per capita household energy consumption is
10 GJ/year. The purpose of this exercise is to estimate the mean and upper bound on the additional cumulative
emissions generated till 2100.
We assume that the additional energy has an intensity in the range 0.013 tCO2/GJ [Low] to 0.08tCO2/GJ [High].
The 'Low' estimate uses renewables for generating electricity and natural gas as the clean fuel (cooking, heating
etc) whereas the 'High' estimate uses coal for electricity and oil as fuel. We assume that, given the long life of
energy infrastructure, the additional infrastructure will be in place for another 30 years (i.e. constant emissions
till 2060). Finally, we make two different assumptions for the retirement of the additional energy infrastructure
in the period 2060-2100: in the ‘optimistic’ case the additional infrastructure linearly ramps down to zero
emissions in 2100. In the ‘pessimistic’ case, the additional emissions stay constant. Table 3 reports the
estimated emissions and their breakdown in the three periods, as well as a quantification of the impacts of
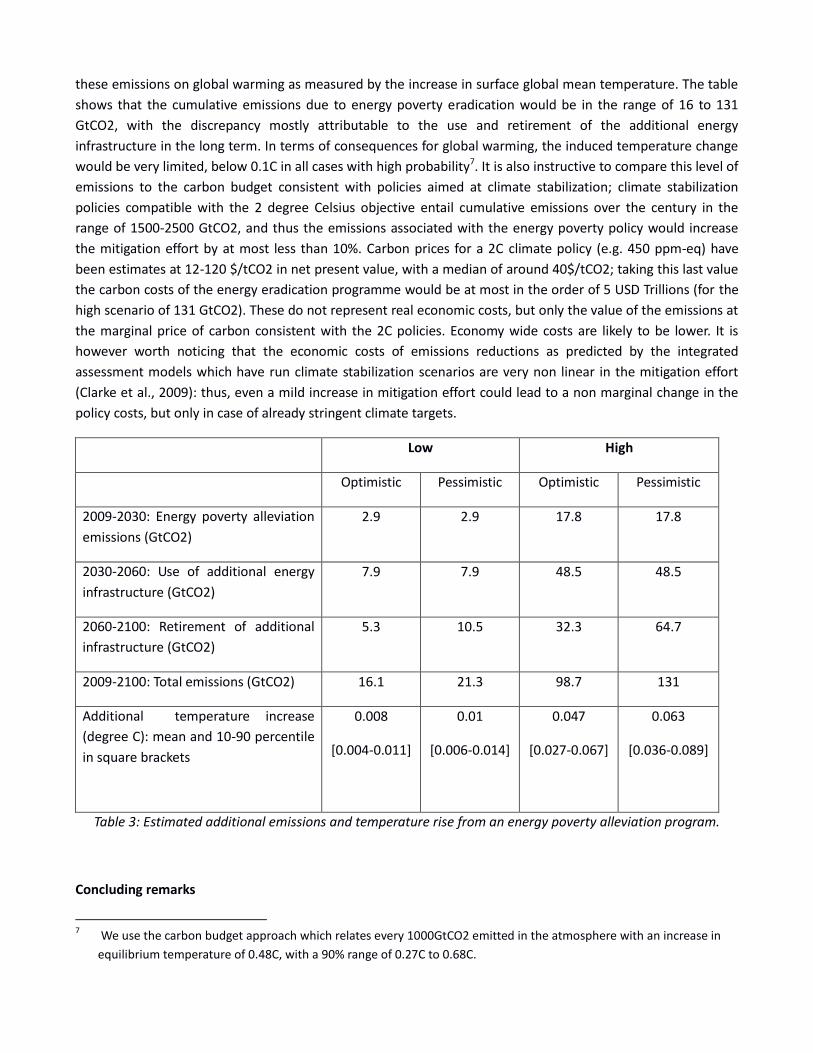
these emissions on global warming as measured by the increase in surface global mean temperature. The table
shows that the cumulative emissions due to energy poverty eradication would be in the range of 16 to 131
GtCO2, with the discrepancy mostly attributable to the use and retirement of the additional energy
infrastructure in the long term. In terms of consequences for global warming, the induced temperature change
would be very limited, below 0.1C in all cases with high probability7. It is also instructive to compare this level of
emissions to the carbon budget consistent with policies aimed at climate stabilization; climate stabilization
policies compatible with the 2 degree Celsius objective entail cumulative emissions over the century in the
range of 1500-2500 GtCO2, and thus the emissions associated with the energy poverty policy would increase
the mitigation effort by at most less than 10%. Carbon prices for a 2C climate policy (e.g. 450 ppm-eq) have
been estimates at 12-120 $/tCO2 in net present value, with a median of around 40$/tCO2; taking this last value
the carbon costs of the energy eradication programme would be at most in the order of 5 USD Trillions (for the
high scenario of 131 GtCO2). These do not represent real economic costs, but only the value of the emissions at
the marginal price of carbon consistent with the 2C policies. Economy wide costs are likely to be lower. It is
however worth noticing that the economic costs of emissions reductions as predicted by the integrated
assessment models which have run climate stabilization scenarios are very non linear in the mitigation effort
(Clarke et al., 2009): thus, even a mild increase in mitigation effort could lead to a non marginal change in the
policy costs, but only in case of already stringent climate targets.
Low High
Optimistic Pessimistic Optimistic Pessimistic
2009-2030: Energy poverty alleviation
emissions (GtCO2)
2.9 2.9 17.8 17.8
2030-2060: Use of additional energy
infrastructure (GtCO2)
7.9 7.9 48.5 48.5
2060-2100: Retirement of additional
infrastructure (GtCO2)
5.3 10.5 32.3 64.7
2009-2100: Total emissions (GtCO2) 16.1 21.3 98.7 131
Additional temperature increase
(degree C): mean and 10-90 percentile
in square brackets
0.008
[0.004-0.011]
0.01
[0.006-0.014]
0.047
[0.027-0.067]
0.063
[0.036-0.089]
Table 3: Estimated additional emissions and temperature rise from an energy poverty alleviation program.
Concluding remarks
7 We use the carbon budget approach which relates every 1000GtCO2 emitted in the atmosphere with an increase in
equilibrium temperature of 0.48C, with a 90% range of 0.27C to 0.68C.

Modern sources of energy like electricity and clean cooking fuels are the prerequisite of a life with a minimal
standard of comfort and dignity. There is a tremendous imbalance in the access to and consumption of these
energy sources today: the poorest 3 Billion people suffer from debilitating energy poverty while the richest 1
billion consume an overwhelming fraction. Sub-Saharan Africa, South Asia and South East Asia are home to
most of the world's energy poor. The projected growth under BAU will not lead to sufficient improvement in
energy poverty eradication, especially in Africa. Countries like China will be successful in moving a significant
number of people to higher energy consumption brackets.
This paper proposes a simple model to quantify the number and global distribution of the energy poor, building
on the data and methodologies developed to study income distribution. The model proposed in this paper is
used to estimate the global distribution of energy consumption and its projected evolution in the next 30 years.
It is useful for quantifying and mapping global imbalances. We show that a global energy poverty reduction
policy aimed at providing 10GJ energy per capita to the global energy poor would increase global energy
demand by 7% in 2030; energy demand would increase substantially in some specific regions, most notably in
Africa, where it would double. When accounting for the long lasting impacts of the needed energy
infrastructure, we show that this policy would have a very small impact on climate change mitigation, even
under scenarios where the additional energy infrastructure is carbon intensive. We estimate that the additional
infrastructure will produce 16-131 GtCO2 over the 21st century and contribute at most 0.1C warming (unlikely).
This impact is manageable when combined with mitigation and efficiency improvements in other fields, and the
management of these emissions would not pose a serious threat to the achievement of climate protection
goals, unless these are very stringent. The benefits to human life and dignity of a successful energy poverty
reduction will be immense.
We must remind the reader that the model has several limitations. The robustness of the income-energy
elasticity is not without some variance, although the sensitivity analysis shown in the Appendix provides
qualitatively similar results. We also do not consider current consumption of bio-energy by the global poor as
useful energy, though in some cases this might be the cases. More and better statistics are needed to further
evaluate this issue. Threshold effects become important in energy technology transitions. It is likely that the
biomass to clean energy transition happens in a narrow income range. Finally, the real question is whether
energy poverty alleviation and pro-poor growth policies will lead to significantly faster rise in the growth of
middle classes and their substantially higher consumption and associated emissions. Recent history shows that
there is no clear answer to this question, different countries having had different growth trajectories from
similar starting points.
References
Bazilian, M., Nussbaumer, P., Rogner, H.H., Brew-Hammond, A., Foster, V., Pachauri, S., Williams, E., Howells, M., Niyongabo, P., Musaba, L., others, 2011. Energy access scenarios to 2030 for the power sector in sub-Saharan Africa. Utilities Policy.
Chakravarty, S., Chikkatur, A., De Coninck, H., Pacala, S., Socolow, R., Tavoni, M., 2009. Sharing global CO2 emission reductions among one billion high emitters. Proceedings of the National Academy of Sciences 106, 11884.
Chotikapanich, D., Griffiths, W.E., Rao, D.P., 2007. Estimating and combining national income distributions using limited data. Journal of Business & Economic Statistics 25, 97–109.
Clarke, L., Edmonds, J., Krey, V., Richels, R., Rose, S., Tavoni, M., 2009. International climate policy architectures: Overview of the EMF 22 International Scenarios. Energy Economics 31, Supplement 2, S64–S81.
Duflo, E., Banerjee, A., 2011. Poor economics: a radical rethinking of the way to fight global poverty. Public Affairs.
Ekholm, T., Krey, V., Pachauri, S., Riahi, K., 2010. Determinants of household energy consumption in India. Energy Policy 38, 5696–5707.
Foster, V., Tre, J.P., Wodon, Q., 2000. Energy prices, energy efficiency, and fuel poverty. Unpublished paper. Latin America and Caribbean Regional Studies Program, Washington, DC: The World Bank.
Gertler, P., Shelef, O., Wolfram, C., Fuchs, A., 2011. Poverty, Growth, and the Demand for Energy. Energy Institute at Haas Working Paper 224.
Kemmler, A., Spreng, D., 2007. Energy indicators for tracking sustainability in developing countries. Energy Policy 35, 2466–2480.
Lenzen, M., Wier, M., Cohen, C., Hayami, H., Pachauri, S., Schaeffer, R., 2006. A comparative multivariate analysis of household energy requirements in Australia, Brazil, Denmark, India and Japan. Energy 31, 181–207.
McCollum, D.L., Krey, V., Riahi, K., 2011. An integrated approach to energy sustainability. Nature Climate Change 1, 428–429.
Mirza, B., Szirmai, A., 2010. Towards a new measurement of energy poverty: A cross-community analysis of rural Pakistan. UNU-MERIT, Maastricht Economic and Social Research and Training Centre on Innovation and Technology.
Nussbaumer, P., Bazilian, M., Modi, V., 2011. Measuring energy poverty: Focusing on what matters. Renewable and Sustainable Energy Reviews.
Pachauri, S., Mueller, A., Kemmler, A., Spreng, D., 2004. On measuring energy poverty in Indian households. World Development 32, 2083–2104.
Pachauri, S., Spreng, D., 2011. Measuring and monitoring energy poverty. Energy Policy. Pachauri, S., Ürge-Vorsatz, D., LaBelle, M., 2012. Synergies between Energy Efficiency and Energy Access Policies
and Strategies. Global Policy 3, 187–197. Peters, G.P., Hertwich, E.G., 2008. CO2 embodied in international trade with implications for global climate
policy. Environmental Science & Technology 42, 1401–1407. Spicker, P., Leguizamon, S.A., Gordon, D., 2007. Poverty: An International Glossary. Zed Books. Vera, I., Langlois, L., 2007. Energy indicators for sustainable development. Energy 32, 875–882. Wolfram, C., Shelef, O., Gertler, P.J., 2012. How Will Energy Demand Develop in the Developing World? National
Bureau of Economic Research Working Paper Series No. 17747. The World Bank, n.d. World Development Report 2010. Zickfeld, K., Eby, M., Matthews, H.D., Weaver, A.J., 2009. Setting cumulative emissions targets to reduce the risk
of dangerous climate change. Proceedings of the National Academy of Sciences 106, 16129 –16134.

Appendix: sensitivity analysis to the income elasticity of energy
Figure A1. Low elasticity. As in Figure 1, but with an income elasticity of energy equal to 0.5 for all
countries.
Figure A2. High elasticity. As in Figure 1, but with an income elasticity of energy equal to 1 for all
countries.

Figure A3. Regional variation in elasticity. As in Figure 1, but with an income elasticity of energy equal
to 1 for developing countries (e.g. with today income below 12000 USD per capita (PPP)) and 0.5 for
industrialized countries.
