shoreline school district trends & projections william l. (“les”) kendrick (consultant)...
TRANSCRIPT
Shoreline School District Trends & Projections
William L. (“Les”) Kendrick(Consultant)
October 16, 2006
October Headcount Data is Used in this Report for Estimating Trends and Projections
2 Trends and Projections -- Sept-2006
Outline
• Enrollment Trends: Shoreline and the County
• Demographic drivers of enrollment
• District enrollment projections
• Projected Change by grade level and service area

3 Trends and Projections -- Sept-2006
District Enrollment TrendOctober Enrollment
P105: 1972-1990P223: 1991-2005
987310538
14674
0
5000
10000
15000
20000
1972
1973
1974
1975
1976
1977
1978
1979
1980
1981
1982
1983
1984
1985
1986
1987
1988
1989
1990
1991
1992
1993
1994
1995
1996
1997
1998
1999
2000
2001
2002
2003
2004
2005

4 Trends and Projections -- Sept-2006
Elementary Enrollment TrendShoreline District K-6
5230 5241 5415 5338 5285 5464 5421 52925072 5012 5024 4866 4773 4741 4620 4518
0
1000
2000
3000
4000
5000
6000
7000
8000
Oct_91
Oct_92
Oct_93
Oct_
04
Oct_
95
Oct_
96
Oct_
97
Oct_
98
Oct_
99
Oct_
00
Oct_
01
Oct_
02
Oct_
03
Oct_
04
Oct_
05
Sept_
06
5 Trends and Projections -- Sept-2006
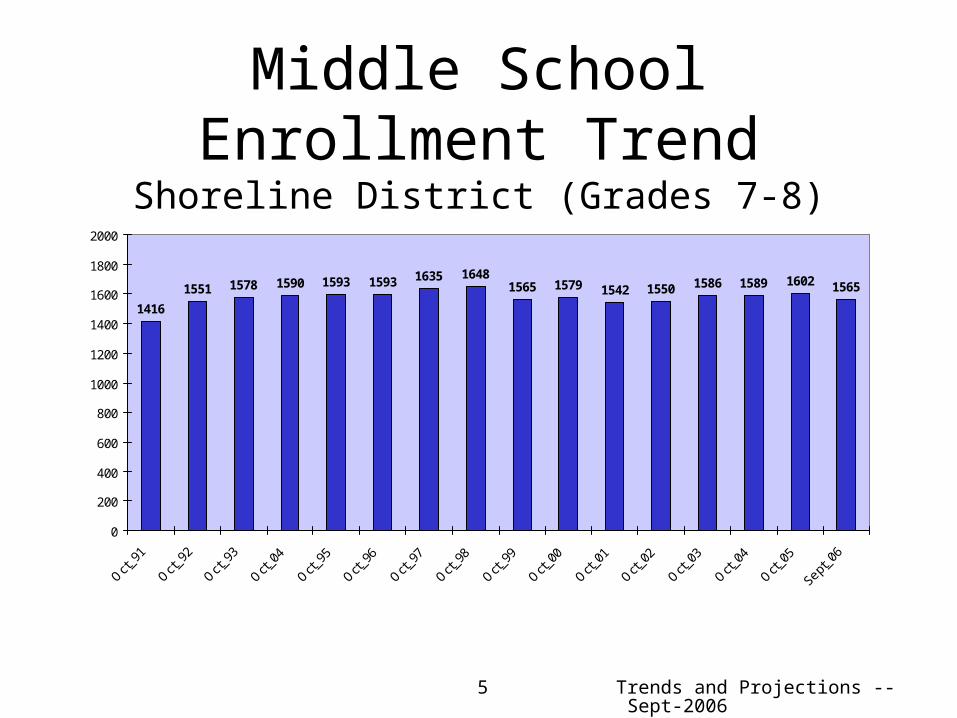
Middle School Enrollment TrendShoreline District (Grades 7-8)
1416
1551 1578 1590 1593 1593 1635 16481565 1579 1542 1550 1586 1589 1602 1565
0
200
400
600
800
1000
1200
1400
1600
1800
2000
Oct_91
Oct_92
Oct_93
Oct_
04
Oct_
95
Oct_
96
Oct_
97
Oct_
98
Oct_
99
Oct_
00
Oct_
01
Oct_
02
Oct_
03
Oct_
04
Oct_
05
Sept_
06
6 Trends and Projections -- Sept-2006
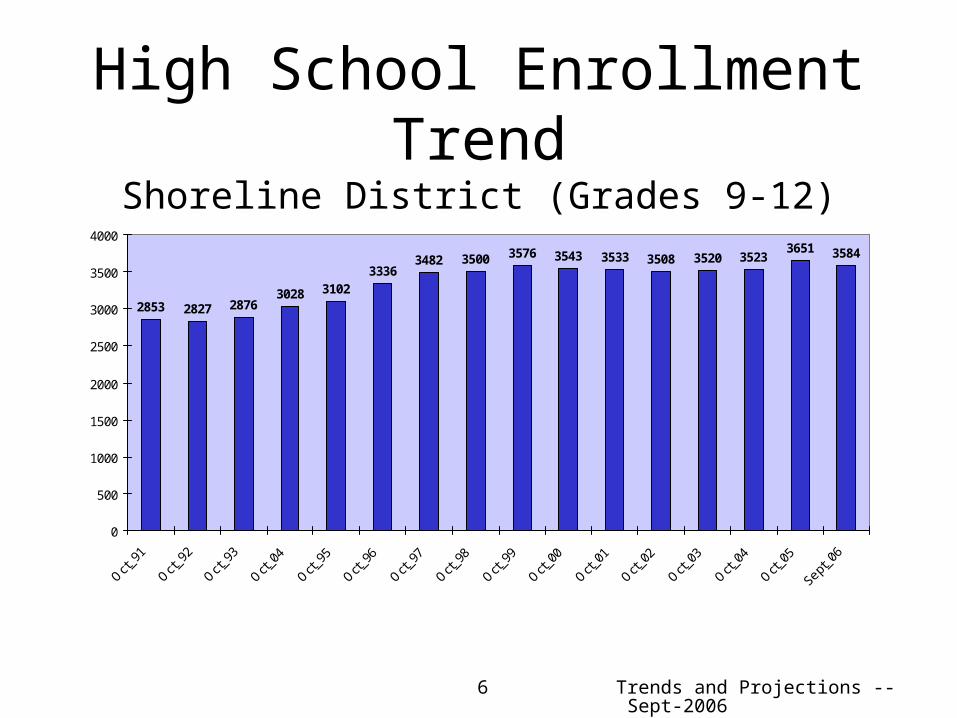
High School Enrollment TrendShoreline District (Grades 9-12)
2853 2827 28763028 3102
33363482 3500 3576 3543 3533 3508 3520 3523
3651 3584
0
500
1000
1500
2000
2500
3000
3500
4000
Oct_91
Oct_92
Oct_93
Oct_
04
Oct_
95
Oct_
96
Oct_
97
Oct_
98
Oct_
99
Oct_
00
Oct_
01
Oct_
02
Oct_
03
Oct_
04
Oct_
05
Sept_
06

7 Trends and Projections -- Sept-2006
Shoreline’s Pattern is Somewhat Similar to Other Districts
• Demographic trends in births and migration are affecting all Districts in the county.
• Smaller birth cohorts have led to declines in elementary enrollments
• Net population gains from people moving in and out of the county have been smaller in recent years

8 Trends and Projections -- Sept-2006
King County Public Schools Enrollment Trend
221133225851
230170233675
237823242897
247527 249769 249587 249319 250399 249971 250791 252241 254,294
2.1% 1.9%1.5% 1.8% 2.1% 1.9%
0.9%
-0.1% -0.1%0.4%
-0.2%0.3% 0.5% 0.8%
150000
170000
190000
210000
230000
250000
1991 1992 1993 1994 1995 1996 1997 1998 1999 2000 2001 2002 2003 2004 2005
-0.01
0
0.01
0.02
0.03
0.04
0.05
0.06
0.07
0.08
0.09
0.1
0.11
0.12
0.13
0.14
0.15
Enrollment Percent Change
9 Trends and Projections -- Sept-2006
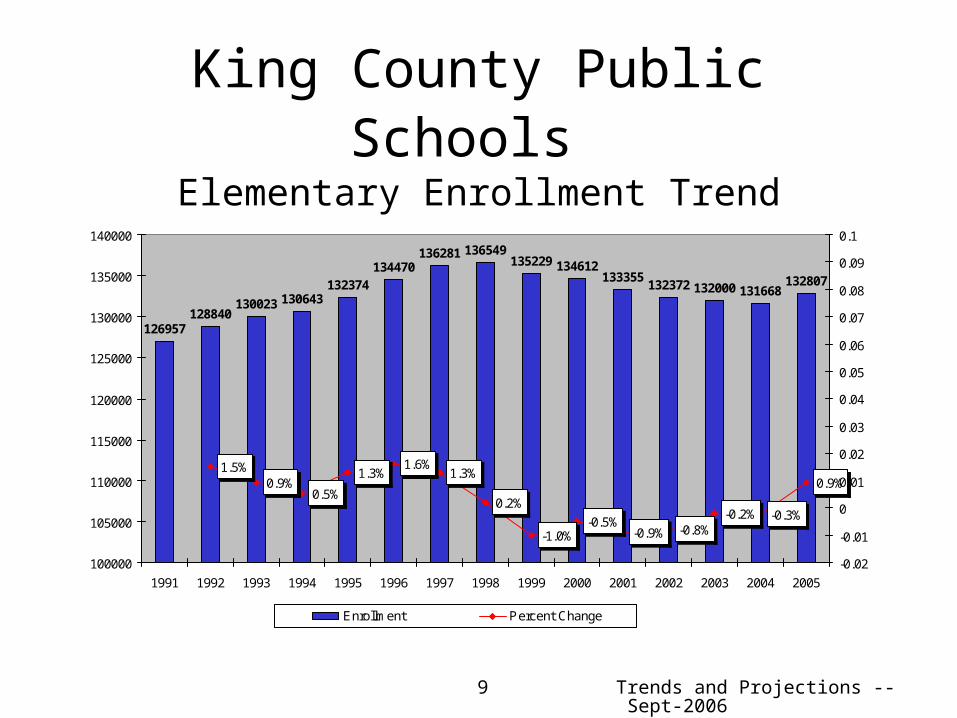
King County Public Schools Elementary Enrollment Trend
126957128840
130023 130643132374
134470136281 136549
135229 134612133355
132372 132000 131668132807
1.5%0.9%
0.5%
1.3%1.6%
1.3%
0.2%
-1.0%-0.5%
-0.9% -0.8%-0.2% -0.3%
0.9%
100000
105000
110000
115000
120000
125000
130000
135000
140000
1991 1992 1993 1994 1995 1996 1997 1998 1999 2000 2001 2002 2003 2004 2005
-0.02
-0.01
0
0.01
0.02
0.03
0.04
0.05
0.06
0.07
0.08
0.09
0.1
Enrollment Percent Change

10 Trends and Projections -- Sept-2006
King County Districts: Change in Enrollment1991 to 1997
34323364
27742452
21171933
18501667
11831146
1039684
604561
523514
4804427
00
0 1000 2000 3000 4000
Issaquah
Kent
Seattle
Federal Way
Northshore
Highline
Auburn
Tahoma
Lake Washington
Enumclaw
Shoreline
Mercer Island
Renton
Riverview
Snoqualmie Valley
Tukwila
Bellevue
Vashon Island
Skykomish
Technical College
Voc. Institute

11 Trends and Projections -- Sept-2006
King County Districts: Change in Enrollment1997-2003
2165958
838803773
562545
352220176
1150
-13-58-99
-129-407
-659-884-934
-1060
-4000 -3000 -2000 -1000 0 1000 2000 3000 4000
Issaquah
Federal Way
Auburn
Kent
Renton
Tahoma
Snoqualmie Valley
Technical College
Bellevue
Tukwila
Mercer Island
Voc. Institute
Riverview
Skykomish
Northshore
Vashon Island
Enumclaw
Shoreline
Seattle
Highline
Lake Washington
12 Trends and Projections -- Sept-2006
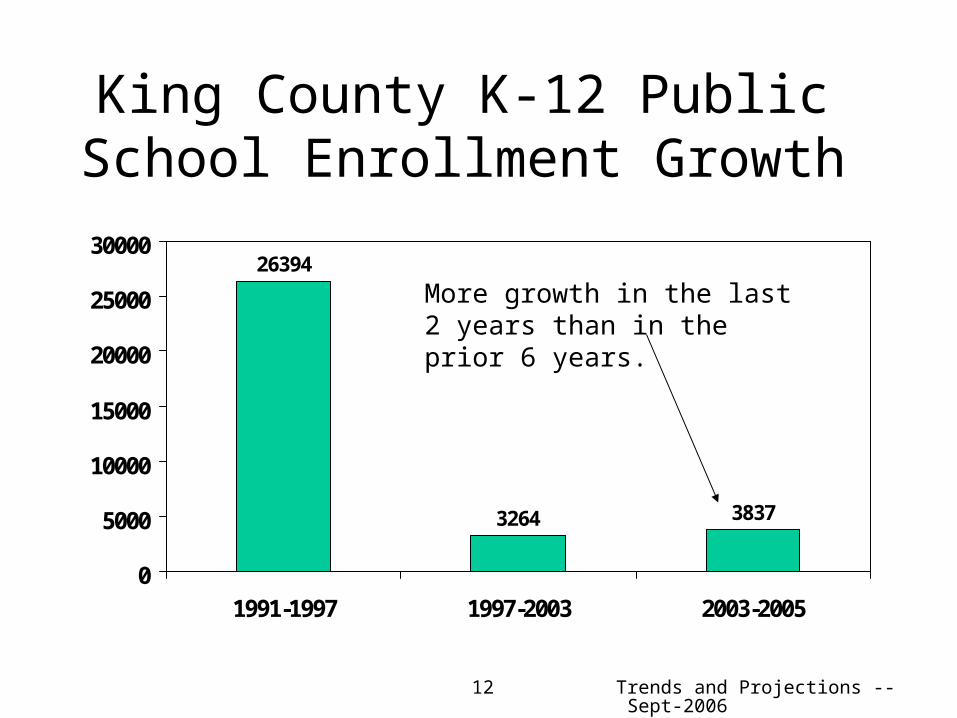
King County K-12 Public School Enrollment Growth
26394
3264 3837
0
5000
10000
15000
20000
25000
30000
1991-1997 1997-2003 2003-2005
More growth in the last 2 years than in the prior 6 years.
13 Trends and Projections -- Sept-2006
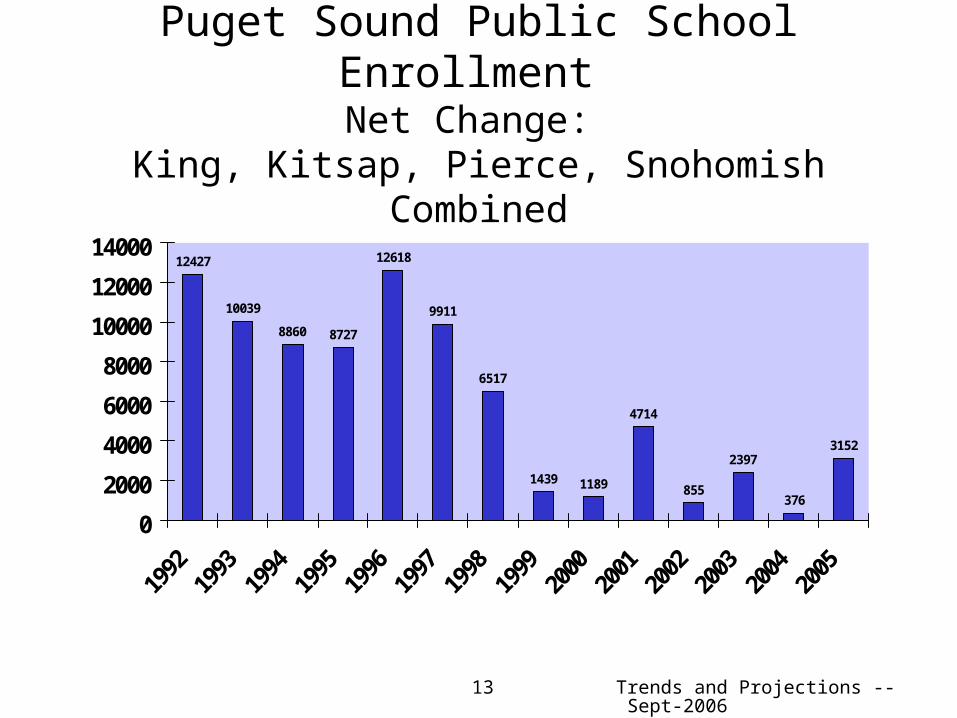
Puget Sound Public School Enrollment Net Change:
King, Kitsap, Pierce, Snohomish Combined
12427
10039
8860 8727
12618
9911
6517
1439 1189
4714
855
2397
376
3152
0
2000
4000
6000
8000
10000
12000
14000
14 Trends and Projections -- Sept-2006
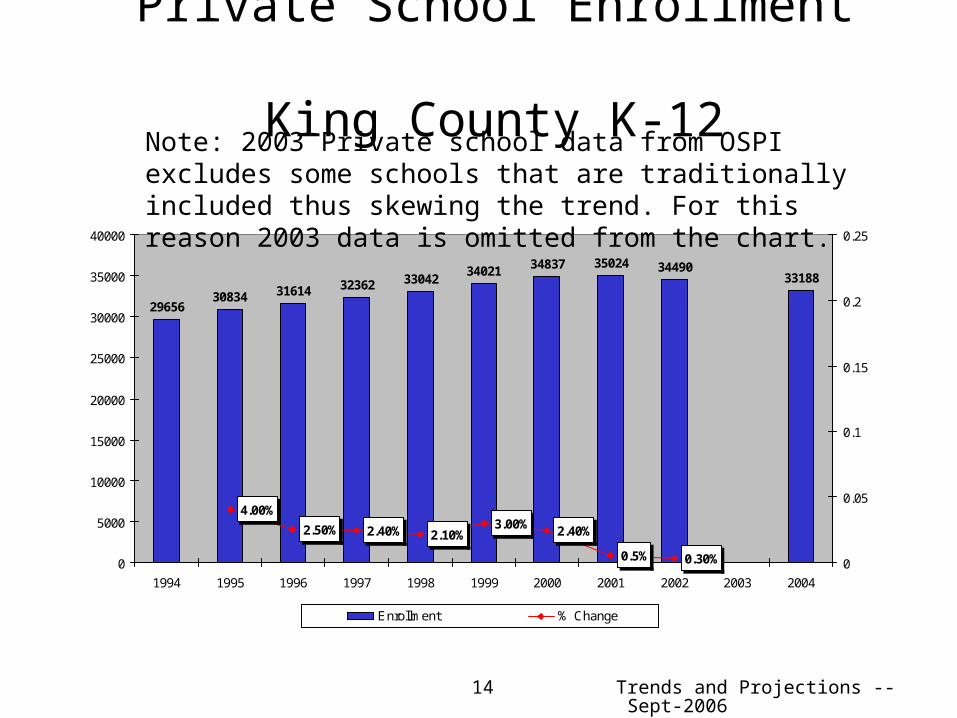
Private School Enrollment King County K-12
2965630834 31614 32362 33042
34021 34837 35024 3449033188
4.00%
2.50% 2.40% 2.10%3.00% 2.40%
0.5% 0.30%0
5000
10000
15000
20000
25000
30000
35000
40000
1994 1995 1996 1997 1998 1999 2000 2001 2002 2003 2004
0
0.05
0.1
0.15
0.2
0.25
Enrollment % Change
Note: 2003 Private school data from OSPI excludes some schools that are traditionally included thus skewing the trend. For this reason 2003 data is omitted from the chart.

Demographic Trends

16 Trends and Projections -- Sept-2006
King County Births, Population Gains from Migration and Shoreline Enrollment
Population Estimates from OFM
-8,000-6,000-4,000-2,000
02,0004,0006,0008,000
10,00012,00014,00016,00018,00020,00022,00024,00026,00028,00030,00032,00034,00036,000
1985 1986 1987 1988 1989 1990 1991 1992 1993 1994 1995 1996 1997 1998 1999 2000 2001 2002 2003 2004 2005
6000
6500
7000
7500
8000
8500
9000
9500
10000
10500
11000
Pop. Change Births (5 Years Prior) Enrollment
Births trending down
Births trending up
17 Trends and Projections -- Sept-2006
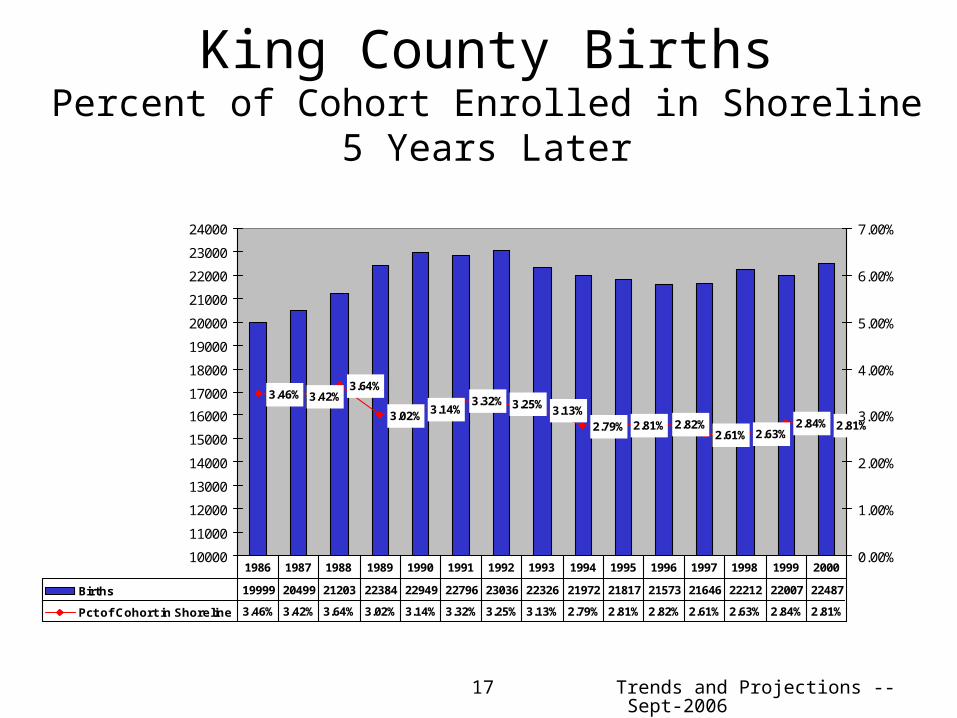
King County BirthsPercent of Cohort Enrolled in Shoreline 5 Years Later
3.46% 3.42%3.64%
3.02% 3.14%3.32% 3.25% 3.13%
2.79% 2.81% 2.82%2.61% 2.63%
2.84% 2.81%
10000
11000
12000
13000
14000
15000
16000
17000
18000
19000
20000
21000
22000
23000
24000
0.00%
1.00%
2.00%
3.00%
4.00%
5.00%
6.00%
7.00%
Births 19999 20499 21203 22384 22949 22796 23036 22326 21972 21817 21573 21646 22212 22007 22487
Pct of Cohort in Shoreline 3.46% 3.42% 3.64% 3.02% 3.14% 3.32% 3.25% 3.13% 2.79% 2.81% 2.82% 2.61% 2.63% 2.84% 2.81%
1986 1987 1988 1989 1990 1991 1992 1993 1994 1995 1996 1997 1998 1999 2000
18 Trends and Projections -- Sept-2006
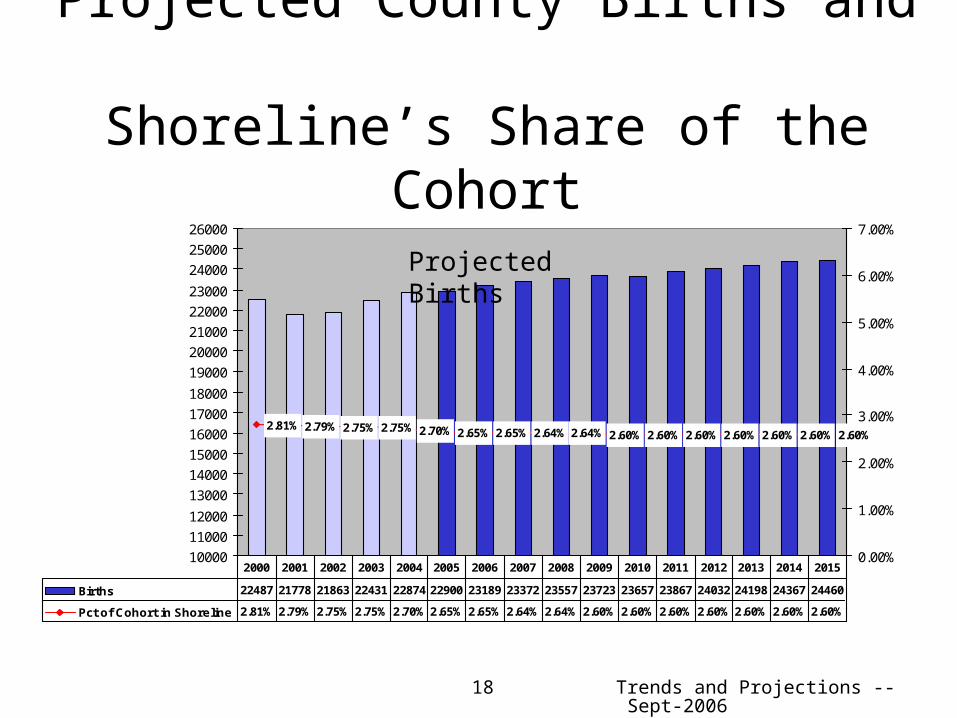
Projected County Births and Shoreline’s Share of the Cohort
2.81% 2.79% 2.75% 2.75% 2.70% 2.65% 2.65% 2.64% 2.64% 2.60% 2.60% 2.60% 2.60% 2.60% 2.60% 2.60%
10000
11000
12000
13000
14000
15000
16000
17000
18000
19000
20000
21000
22000
23000
24000
25000
26000
0.00%
1.00%
2.00%
3.00%
4.00%
5.00%
6.00%
7.00%
Births 22487 21778 21863 22431 22874 22900 23189 23372 23557 23723 23657 23867 24032 24198 24367 24460
Pct of Cohort in Shoreline 2.81% 2.79% 2.75% 2.75% 2.70% 2.65% 2.65% 2.64% 2.64% 2.60% 2.60% 2.60% 2.60% 2.60% 2.60% 2.60%
2000 2001 2002 2003 2004 2005 2006 2007 2008 2009 2010 2011 2012 2013 2014 2015
Projected Births
19 Trends and Projections -- Sept-2006
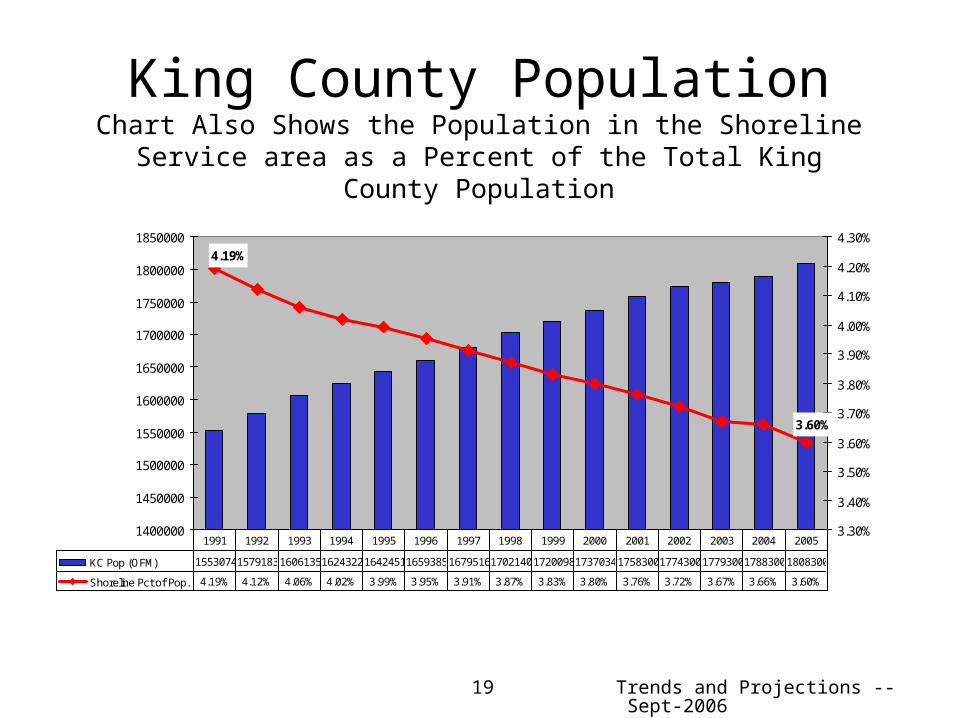
King County PopulationChart Also Shows the Population in the Shoreline Service area as a
Percent of the Total King County Population
3.60%
4.19%
1400000
1450000
1500000
1550000
1600000
1650000
1700000
1750000
1800000
1850000
3.30%
3.40%
3.50%
3.60%
3.70%
3.80%
3.90%
4.00%
4.10%
4.20%
4.30%
KC Pop (OFM) 155307415791831606135162432216424511659385167951617021401720098173703417583001774300177930017883001808300
Shoreline Pct of Pop. 4.19% 4.12% 4.06% 4.02% 3.99% 3.95% 3.91% 3.87% 3.83% 3.80% 3.76% 3.72% 3.67% 3.66% 3.60%
1991 1992 1993 1994 1995 1996 1997 1998 1999 2000 2001 2002 2003 2004 2005

20 Trends and Projections -- Sept-2006
King County Population ForecastBased on OFM Intermediate Series
Chart Also Shows the Projected Change in the Population in the Shoreline Service Area as a Percent of the Projected King County Population
3.57%
3.50%
3.42%
3.60%
1500000
1600000
1700000
1800000
1900000
2000000
2100000
3.00%
3.20%
3.40%
3.60%
3.80%
4.00%
KC Pop (OFM Projection) 1808300 1860359 1936594 2014734
Shoreline Pct of Pop. 3.60% 3.57% 3.50% 3.42%
2005 2010 2015 2020

21 Trends and Projections -- Sept-2006
Shoreline School DistrictPopulation Estimates & ProjectionsHigh Growth Population Projection
Estimates and Projections Based on:Data from OFM, PSRC, Census & the King County Growth Report
64815
68700
66430
6510066041
55000
57000
59000
61000
63000
65000
67000
69000
71000
Avg. House-hold Size = 2.51
Avg. House-hold Size = 2.42
Avg. House-hold Size = 2.37
Avg. House-hold Size = 2.53
22 Trends and Projections -- Sept-2006
New Home Trends in Shoreline(Data from the New Home Trends Database)
• Approximately 650 new construction housing units have been sold in the District in the past 5-7 years.
• About 500 of these units were in multi-family complexes (apartments, condos, townhomes)
• Of the approximately 500 multi-family units listed as sold in New Home Trends, approximately 300 were conversions of apartments to condos or townhomes (132 were recently converted in the Echo Lake service area)
• Development has been concentrated to the west of I-5, especially single-family home development.

Projections

24 Trends and Projections -- Sept-2006
Projecting the Future• Population in the Shoreline District likely to grow
between now and 2020.• The District population as a percentage of the
county population will continue to shrink.• Housing units are expected to increase but the
average household size will decline (generally indicates fewer children).
• County births are expected to be relatively stable between now and 2010 and are expected to increase between 2010 and 2020.
• Birth cohorts and the population trends are the best predictors of future enrollment.

25 Trends and Projections -- Sept-2006
Future Enrollment• District will enroll a smaller share of future birth cohorts.
– K enrollment was 3.46% of county births in 1991– K enrollment was 2.85% of county births in 2005– Percent will range between 2.8% and 2.6% between now and 2020
with a gradual decline over time.
• Share of King County K-12 growth will decline over time– 4.3% in 1991– 3.5% to 3.7% projected by 2020
• The Low, Medium and High forecasts differ in their assumptions regarding the District’s share of future K-12 population growth in King County.
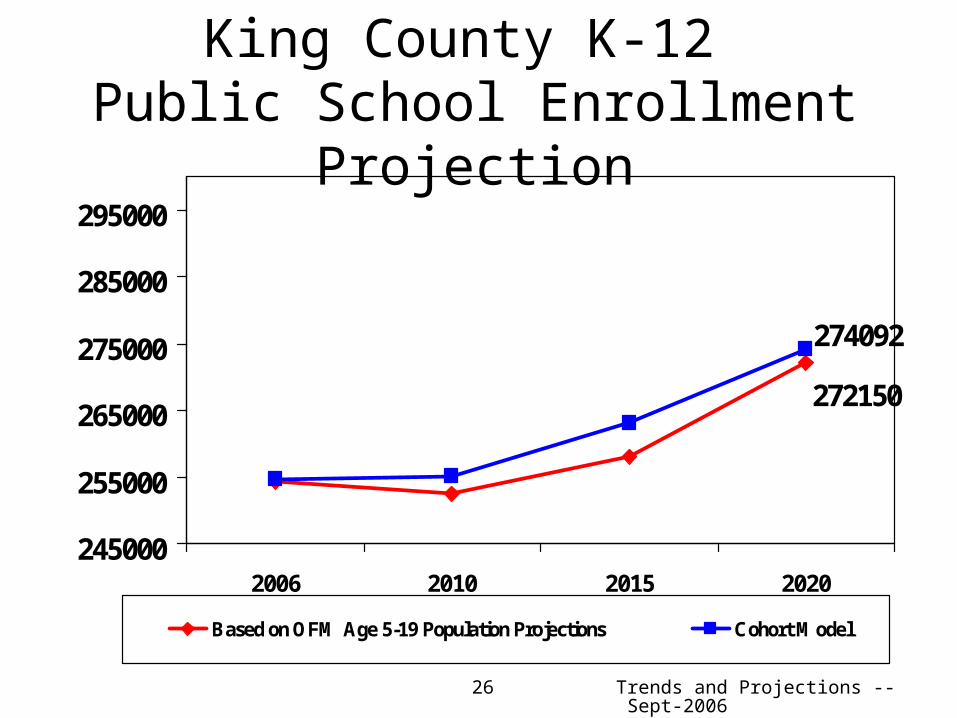
26 Trends and Projections -- Sept-2006
King County K-12 Public School Enrollment Projection
272150
274092
245000
255000
265000
275000
285000
295000
2006 2010 2015 2020
Based on OFM Age 5-19 Population Projections Cohort Model
27 Trends and Projections -- Sept-2006
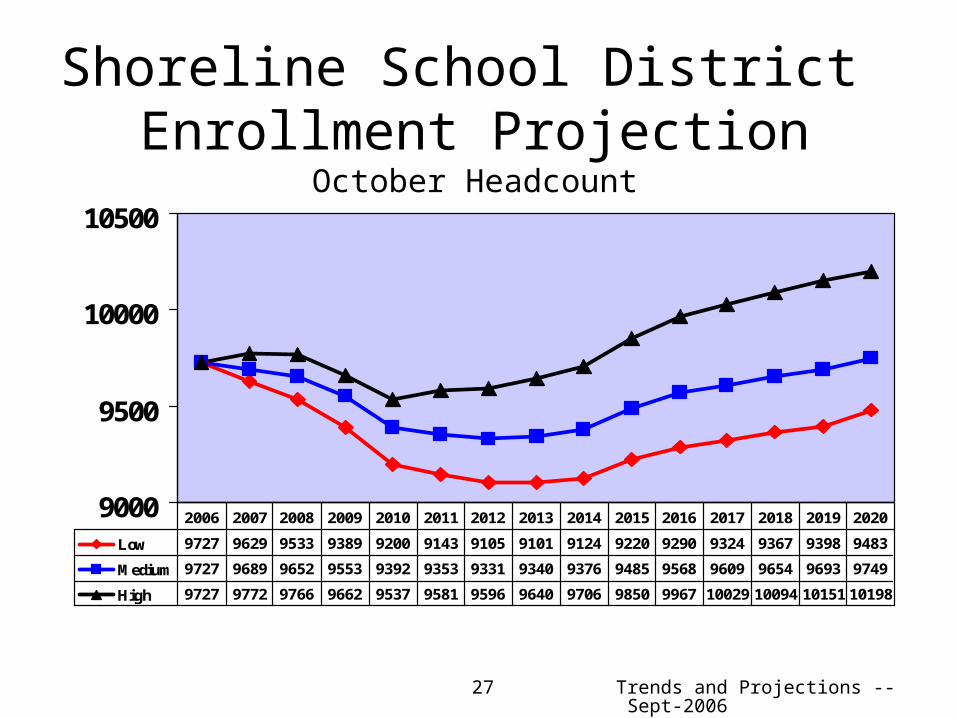
Shoreline School District Enrollment Projection
October Headcount
9000
9500
10000
10500
Low 9727 9629 9533 9389 9200 9143 9105 9101 9124 9220 9290 9324 9367 9398 9483
Medium 9727 9689 9652 9553 9392 9353 9331 9340 9376 9485 9568 9609 9654 9693 9749
High 9727 9772 9766 9662 9537 9581 9596 9640 9706 9850 9967 10029 10094 10151 10198
2006 2007 2008 2009 2010 2011 2012 2013 2014 2015 2016 2017 2018 2019 2020
28 Trends and Projections -- Sept-2006
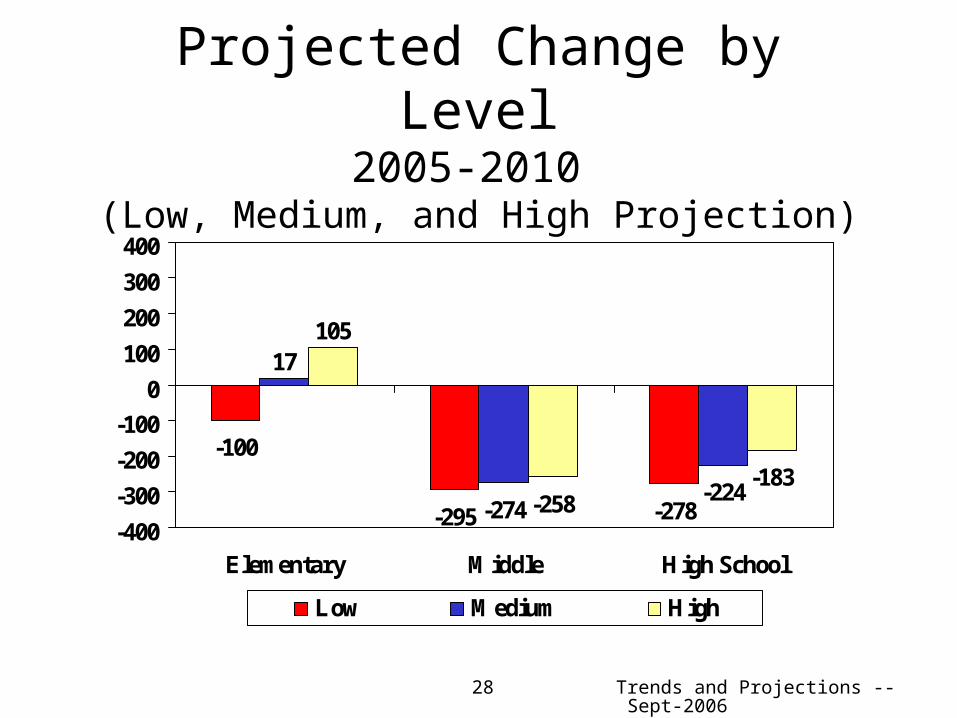
Projected Change by Level2005-2010
(Low, Medium, and High Projection)
-100
-295 -278
17
-274-224
105
-258-183
-400
-300
-200
-100
0
100
200
300
400
Elementary Middle High School
Low Medium High
Service Area Trends and Projections

30 Trends and Projections -- Sept-2006
Single Family Development Projects:1998-2005 (New Home Trends)

31 Trends and Projections -- Sept-2006
Shorewood/Einstein TrendsNet Enrollment Change Between Oct-97 and Oct-05
PSRC Census Estimates show a net gain of approximately 800 residents in these areas since the 2000 Census
64
208
-46
-174
-15-43 -65 -43
-200-150-100
-500
50100150200250

32 Trends and Projections -- Sept-2006
Shorecrest/Kellogg TrendsNet Enrollment Change Between Oct-97 and Oct-05
PSRC Census estimates show a gain of approximately 400 residents in these areas since the 2000 Census
-101
-159
-100
-3
-124
-75
-192-250
-200
-150
-100
-50
0
33 Trends and Projections -- Sept-2006
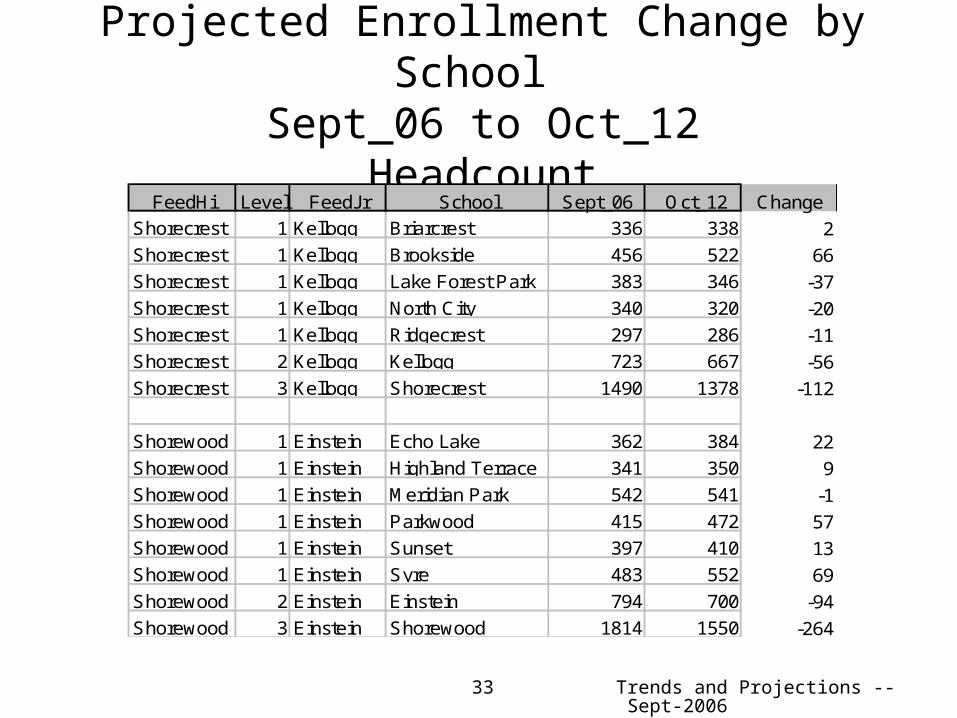
Projected Enrollment Change by School Sept_06 to Oct_12
HeadcountFeedHi Level FeedJr School Sept_06 Oct_12 Change
Shorecrest 1 Kellogg Briarcrest 336 338 2
Shorecrest 1 Kellogg Brookside 456 522 66
Shorecrest 1 Kellogg Lake Forest Park 383 346 -37
Shorecrest 1 Kellogg North City 340 320 -20
Shorecrest 1 Kellogg Ridgecrest 297 286 -11
Shorecrest 2 Kellogg Kellogg 723 667 -56
Shorecrest 3 Kellogg Shorecrest 1490 1378 -112
Shorewood 1 Einstein Echo Lake 362 384 22
Shorewood 1 Einstein Highland Terrace 341 350 9
Shorewood 1 Einstein Meridian Park 542 541 -1
Shorewood 1 Einstein Parkwood 415 472 57
Shorewood 1 Einstein Sunset 397 410 13
Shorewood 1 Einstein Syre 483 552 69
Shorewood 2 Einstein Einstein 794 700 -94
Shorewood 3 Einstein Shorewood 1814 1550 -264
34 Trends and Projections -- Sept-2006
Summary• Enrollment is expected to continue to decline over
the next 5-7 years.• Enrollment should start to grow between 2010 and
2020 as births and population increase in the county (the natural cycle of K-12 enrollment).
• Middle and high school enrollments will show a declining pattern over the next 5-7 years.
• Elementary enrollment should be more stable in the next 5-7 years, though losses will likely continue through 2009.