shoreline situation reports and their application for tidal...
TRANSCRIPT
Shoreline Situation Reports and their Application for Tidal
Wetland Management – A Demonstration Project in
Westmoreland County, Virginia
Final Technical Report Submitted to
Coastal Zone Management Program
Virginia Department of Environmental Quality
Richmond, Virginia
Submitted by
Center for Coastal Resources Management
Virginia Institute of Marine Science
College of William and Mary
This project was funded in part by the Virginia Institute of Marine Science, Center for Coastal Resources Management and the Virginia Coastal Zone Management Program at the Department of Environmental Quality through Grant Number
NA05NOS4191180 of the National Oceanic and Atmospheric Administration, Office of Ocean and Coastal Resource Management under the Coastal Zone Management
Act of 1972, as amended.

Executive Summary Effective and progressive management along the shoreline requires the ability to periodically review and report on resource condition. This applies not only to basic status and trends, but also to establishing mechanisms to evaluate the effectiveness of regulatory programs and policies at managing for sustainable ecosystem services. Since Virginia does not have a truly integrated management strategy in place for regulating tidal wetlands, there exists no central reservoir of information to evaluate resource condition. This has impaired the Commonwealth’s ability to respond easily to common questions frequently prefaced by “how much”, “how many”, “where”, and “when.” In the absence of a centrally managed database where information can be retrieved and analyzed, this study looked to two readily available data sources to test whether these provide an adequate alternative. The Virginia Institute of Marine Science’s Tidal Wetlands Permit Database, and the Shoreline Inventory database was tested for its adequacy in addressing common resource management questions.

Introduction
There has always been a great desire on the part of coastal managers for access to
data that provides for rapid answers to common status and trends questions. How many
miles of bulkhead are there in a county? How many permits are issued annually? What
is the annual impact to tidal wetlands across the Commonwealth? These are just a few.
In Virginia, the Tidal Wetlands Act regulated by the Virginia Marine Resources
Commission and Local Wetlands Boards, and the Chesapeake Bay Preservation Act
regulated at the local government level are the two that were established to specifically
reduce habitat and water quality impacts to tidal waters. They are perhaps the two most
commonly encountered by private property owners who elect to install erosion control
structures along the shoreline. These agencies and others maintain databases for tracking
impacts along tidal shoreline. At the Virginia Institute of Marine Science (VIMS),
Center for Coastal Resources Management (CCRM), a large database is maintained by
the Wetlands Advisory Program who reviews all permits submitted with proposed
impacts to tidal wetlands. This database has been maintained over many years and will
be used in this project to investigate the study questions.
Concurrent with the development of the Wetlands Permit Database, CCRM’s
Comprehensive Coastal Inventory Program (CCI) is developing shoreline inventories for
the Tidewater localities of Virginia. In practice, the Shoreline Inventory is a data
resource that provides an assessment of conditions existing along tidal shoreline in
Virginia. In theory, the Shoreline Inventory, still under development, offers the
opportunity to track trends in shoreline construction and relate fine scale changes back to
permitted activities. As originally proposed, the inventory would be repeated on a cycle
of once every five years. Therefore, a time frame of reference would be established from
which shoreline condition could be evaluated over time. In this case, how much (more)
shoreline has been hardened in the past five years?

With existing linkages already in place between the Shoreline Inventory database
and the Wetlands Permit Database additional questions can be posed? Is the connection
between these two resources sufficient to improve our ability to manage and report on
tidal wetlands over time? Can we evaluate trends in the resource and answer to state and
federally mandated reporting requirements? Are additional measures and resources
necessary to assess actions permitted through the regulatory program versus what we see
constructed on the ground? Do we know how many projects are actually constructed and
whether they are constructed to the specifications of the permit? Can the Shoreline
Inventory substitute for a monitoring program. Does the combined information from the
two sources allow us to identify unauthorized construction along the shoreline?
Project Objective
The project goals are to evaluate each of the questions mentioned above through a
comparative analysis of the VIMS Tidal Wetlands Permit Database and the VIMS
Shoreline Inventory. The county of Westmoreland was identified as the demonstration
area. Westmoreland is a county located on the Northern Neck of Virginia. The area sees
considerable permit activity along developed tidal shoreline, and therefore available sites
to review are numerous. The county was also surveyed in 2001 for conditions to develop
a Shoreline Inventory. To provide a current reference for comparison, the county would
be surveyed again in 2006 as part of this study.
All necessary information will be gathered to allow for a comparison of permitted
activities with the location of erosion control structures built within the study window.
The study is restricted to activities which impact vegetated tidal wetlands and propose
construction of revetments, bulkheads, marsh toe revetment, or similar types of erosion
control structures. These structures have been geo-located in the 2001 and 2006
Shoreline Inventories.
2

Approach
Independent queries were conducted to extract and analyze data stored in the
Wetlands Permit Database and in the Shoreline Inventory databases. Arc Map was used
for most analyzes which combined the two data sources. This required all data extracted
from the permit database which is in Sybase to be converted to coverages and imported
into Arc Map.
Permit Database Query
A cumulative review of permit activities between the studied years (2001-2006)
was queried from the VIMS Wetlands Permit Database. This query extracted projects
from the database where impacts to vegetated tidal wetlands occurred between 2001 and
2006. After careful review, the query was expanded to include permits dating back to
1999. In general, permits must be constructed within 1 year of being issued, but
exceptions exist that could extend that period up to 3 years. The revised query allowed
for the possibility that structures observed during the 2001 survey may have been
permitted prior to that.
To spatially link the site and application information from the permit with the data
extracted from the Shoreline Inventory database we used the GPS locations collected in
the field during the field review. These GPS locations provide the geographic reference
necessary to convert data in the permit record to a GIS “point” coverage. Since not all
fields within the permit database are relevant to this analysis only those associated with
computing wetland loss and wetland type were extracted to create the attribute tables. A
quality control check was performed to remove any duplicate records stored in the
database.
3

Shoreline Inventory Database Query
In 2001, the Comprehensive Coastal Inventory Program surveyed the shoreline of
Westmoreland County following protocols established by the program and first
documented by Berman and Hershner, 1999. This survey generated a shoreline inventory
database for the county of Westmoreland. A requirement of the present study was to
conduct a second survey in 2006 following nearly identical survey protocols. The 2006
survey resulted in the publication of the first formal Westmoreland County Shoreline
Inventory. The products associated with the inventory can be viewed and downloaded at
this website: http://www.ccrm.vims.edu/westmoreland/westmorelandva_disclaimer.html.
The 2006 survey provides the data which was used to assess how shoreline attributes had
changed between 2001 and 2006. Appendix 1 is the report associated with the
development of the shoreline inventory.
The comparison between the two survey years would assess change in delineation
of shoreline structures and any obvious differences in the distribution of marshes
alongshore. While there had been upgrades in field equipment and the addition of a few
attributes in the collection, the second survey was conducted so the data would be
suitable for comparison with the 2001 dataset.
Attribute data extracted from the 2001 and 2006 Shoreline Inventory databases
were specific to two basic types; attributes which described the presence of marshes
along the shoreline, and attributes associated with shoreline structures most likely to
impact vegetated wetlands when constructed. The inventory query pulled data
associated with presence of bulkheads, revetments, miscellaneous structures, and debris.
The presence of marshes is noted as part of the shoreline survey, but marsh acreage is not
surveyed.
4
Investigative Study Questions
This study investigated specific queries and questions that would test the utility of
these two data sources for addressing management needs and concepts. This section
reports on study findings specific to the following questions.
1a) In Westmoreland County, how many acres of vegetated tidal wetlands would be
lost due to permitted actions issued by the regulatory program(s)?
Using records extracted from the permit database from 1999-2006 the query
indicates that 22,556 sq ft (0.52 acres) of tidal wetlands were lost due to fill at the project
sites. The assessment does not consider any mitigation that may have been required.
This number assumes all projects permitted were constructed and all projects were
constructed as proposed.
Identifiable Challenges: There are currently no regular monitoring programs in place at
the state or local levels to insure that projects are constructed as proposed. This remains
a continuing resource management problem at both levels of government, and hinders our
capacity to track and accurately report on wetlands trends.
Also, within the study period, property owners who lost structures due to
Hurricane Isabel in 2003 were allowed to rebuild without permit review or application.
This means that replacement structures may have impacted additional wetlands and may
have been extended beyond the footprint of the original structure. Again, there has been
little tracking of these activities as well.
1b) Could these losses be interpreted from a comparison of marsh presence between
the 2001 and 2006 shoreline inventories? If not, is there a mechanism that could be
implemented to track losses routinely at the state or local level?
5

The shoreline inventory only looks at the linear distribution of marsh habitat
alongshore. Therefore, data from that source can not begin to estimate the acreage of
wetlands lost due to project construction. A comparison of the linear distribution of
marshes between 2001 and 2006 shoreline surveys revealed a 2.78 mile (4.45 km)
increase in observed marshes along the shore. In 2001, 94.90 miles (152.7 km) of marsh
shoreline were observed. In 2006, 97.68 miles (157.2) were surveyed. Roughly 76
miles (122 km) of marsh shoreline overlapped between study periods indicating that 18
+/- 3 miles (29 +/- 5 km) of shoreline with marshes were not co-located. Figure 1
illustrated sections along the shoreline where fringe marsh overlap and new fringe marsh
were record from the shoreline surveys.
While the results suggest an increase in new marsh presence, a more likely
scenario is that marsh fringe was too narrow to capture in the 2001 survey record and by
2006 had increased in width and density to be observable. Also possible would be a
lower tide level during the second survey revealed more of the intertidal fringe. Clearly,
the results support a conclusion that a comparison of shoreline inventories will not be an
effective state-wide mechanism for tracking acreage of wetland change through time.
Identifiable Problems: To track wetland changes incurred through shoreline actions two
options are proposed. Both options would require significant commitments for funds
and personnel time on the part of one or more agencies.
The first option is to implement a direct monitoring program concurrent with the
regulatory programs now in place. A monitoring program would track initiation,
construction, and completion of projects permitted through the regulatory process, and
include on-the ground surveys to delineate project impacts during and following projects.
Tracking mitigation requirements should also be incorporated. A database would be
essential and should be managed through a central agency.
A second option is to implement a statewide wetlands mapping program to track
local changes in the resource through time. This would most efficiently be accomplished
6
through a remotely sensed wetlands mapping program that uses a high resolution multi-
spectral image product to produce a delineation of tidal wetland boundaries. The
frequency of delineations will ultimately be controlled by available funds to support the
initiative. The state of Maryland has a commitment to map state tidal wetlands every five
years, and a comparable time scale would be appropriate for Virginia.
2a) Based on a review of permit records, how many miles of shoreline structures were
permitted in the county between 1999 and 2006?
Within the study window, a review of permits issued through the tidal wetlands
regulatory program for bulkheads, revetments, marsh toe revetments or similar structures
inclusive of structure replacements was conducted. The query found 302 permits calling
for a total of 10.98 miles (17.67 km) of shoreline structures in the county.
As already discussed, since funding for monitoring and enforcement is negligible,
projects are not tracked through construction or completion after the permit is issued.
While most communities may require a building permit, these are often issued and
monitored outside of environmental programs. Therefore, direct knowledge of the actual
impacts occurring to tidal wetlands is not known, and communities have no formal and
consistent mechanism for monitoring projects. It is conceivable that some projects
never get constructed. It is also possible that projects are not constructed as proposed.
In the absence of additional resources or mandates to implement a monitoring
program, we look towards other available resources to determine if they provide a
reasonable platform to track activities. In this project we investigated the application of
using shoreline inventories as a means to track changes in construction of erosion control
structures. We do this through a comparison of structures present in the 2001 and 2006
shoreline inventory surveys for Westmoreland County followed by a comparison with
data stored in the permit database. Can we assess change in structures alongshore
through a direct comparison?
7

Since tide levels and weather conditions forced a slightly different geographic
extent between the two surveys, the analysis was restricted to only areas that were
surveyed in both years. To compare these data with the permit records, permit records
pertaining to areas outside the geographic boundaries of the surveys were eliminated.
This reduced the number of permits to 273 which accounted for 9.88 miles (15.9 km) of
erosion control structures permitted for construction. The permit database search
remained between 1999 and 2006.
2b) How well does the delineation of structures surveyed in the 2001 and 2006
shoreline inventories compare with information on permitted structures extracted from
the permit database?
To address this we queried the 2001 and 2006 shoreline inventory databases for
structure types defined for the project. These included bulkheads, dilapidated bulkheads,
revetments (inclusive of marsh toe revetment), miscellaneous or unconventional. The
query revealed that there were 13.35 miles (21.48 km) of new structures. Figure 2 shows
a section of shoreline where new constructions have been added since the original survey
in 2001. How many of these structures can be related back to permits in the permit
database?
A direct comparison using GPS points collected during the permit review process
was performed and permit locations were superimposed with structures constructed after
the 2001 shoreline survey. The image in Figure 2 also reveals that permits are not
evident at all sites where new structures are present. Spatially, permits were associated
with only 4.7 miles (7.6 km) of new construction along the shorelines. Initially this
suggests that 8.65 miles (13.92) of structures have been built without a permit. A
number of reasons are presented to explain why this is most likely not the case.
First, GPS points collected during the permit review process are always collected
somewhere in the “vicinity” of the proposed projects. Only one GPS point is collected at
8

the site and there is never an attempt to actually delineate the proposed boundaries of the
structure. Therefore, there is not a comparable GIS file to show exactly where the
proposed action will be constructed. This is problematic in any comparison of change or
impact assessment, especially for projects that extend significant distances along the
shoreline. It is conceivable, therefore, that permit locations do not actually represent the
true location of projects.
How frequently does this occur? A review of the available data indicated an
additional 5.5 miles (8.85 km) of shoreline with permit locations in very close proximity
to new structures, but not superimposed. In these areas, the examination determined the
geographic proximity of permit to structure to be so close as to assume they are related.
While it is unlikely this is a conclusive explanation for the overall differences all the
time, it is very likely to account for some of the discrepancy. However, other shortfalls
within the construct of the analysis, the management programs, or the individual
databases are also found to be possible explanations for these differences.
The first pertains to errors that occur in the inventory data collection and
processing. Any structure overlooked in the 2001 survey but noted in the 2006 survey
would be coded as a “new structure”. Errors do occur in the inventory data collection
and structures can be missed if the tide conditions do not permit very near shore
observations. In areas where the near shore water depths are very shallow, observations
may be made at distances approaching 0.25 miles (0.40 km). Images are used to reduce
these errors to the extent possible.
Some minimum criteria were established to search conditions illustrated in maps
as a mechanism to identify possible areas where collection or processing errors may have
occurred. Short breaks in long stretches of structures with no apparent change in
property boundary were identified. Offsets in the overlap of structures between the two
years with the 2001 inventory extending a greater distance along shore suggest the
operator closed the feature on the GPS unit too soon or the processor did not accurately
transpose the feature to the new baseline. The area within the blue circle shown on
9
Figure 2 may be an area where an operator or processing error generated an offset
between the delineation in 2001 and 2006. Since no permit is associated with the
extension, this is a site which could be flagged as a violation, but most likely is not. Five
miles of shoreline were found to have possible processing errors. Without an extensive
recall effort, these locations cannot be verified, but we accept some of these sites might
account for a percentage of the total 8.65 miles (13.92 km) of structures found to be
constructed after 2001 without permits.
Another possible explanation which cannot be overlooked is the possibility that
some structures are not constructed as proposed. Without follow-up at the state or local
level constructed projects may have been extended beyond the boundaries defined in the
permit.
Finally, further explanations are unrelated to the source data used in this analysis.
The first speaks to the county’s efforts to mediate a major shoreline management
conundrum that occurred following Hurricane Isabel which affected nearly all counties
on the Western Shore of the Chesapeake Bay when it passed on September 18, 2003.
Faced with an overwhelming number of private property owners who lost erosion control
structures during the hurricane, Westmoreland implemented an emergency replacement
policy that allowed property owners to replace structures without going through the
permit process. This strategy was also adopted by other local governments facing similar
problems. While the conditions for replacement were made clear, the ability to monitor
and track activities that were occurring along the shoreline was virtually impossible. It is,
therefore, likely that some structures were built where no structures ever existed, and
structures may have been extended beyond the original footprint of the structure lost
during the hurricane. Both scenarios would result in an apparent increase in new
shoreline structures after 2001 without an associated permit.
Finally, a review of integrated coastal management and discussions with local
officials reveal that many structures regulated outside of the jurisdictional authority of the
local wetlands board would not find their way into the permit database. This would
10

include all projects regulated and permitted under the Chesapeake Bay Preservation Act.
The Chesapeake Bay Preservation Act is regulated at the local government level and data
is maintained through that body.
It is conceivable that construction of bulkheads and revetments have occurred
outside of the local wetlands board jurisdiction. The shoreline inventory does not record
the placement of these structures within the framework of the coastal profile (e.g. is the
structure located above mean high water) and there is no attribution in the databases
associated with regulatory oversight. Likewise, this project did not have access to data
or possible databases the local government maintains. Personal communication with both
VMRC and county staff to the Local Wetlands Board indicates that property owner
requests’ to construct erosion control structures in the Resource Protection Areas (RPA)
is not uncommon.
This is an issue that should be addressed at the state and local level since it
impedes resource managers from the ability to accurately report on the state of the
shoreline condition across the state. Without a central database management system in
place, it will always be difficult, if not impossible to even qualify hardening and erosion
control along Virginia’s tidal shoreline. More information on this issue follows.
Management Challenges: More than likely all these factors contribute on some level to
the differences found between the permit database and a change analysis using 2001 and
2006 shoreline inventory data. The analyses performed to examine question 2
concludes that there exists broad enough discrepancies between the shoreline inventory
and the permit database to suggest the shoreline inventory is not a reasonable alternative
to track the status of shoreline hardening alongshore. Opportunities do exist to counter
or correct some of the factors discussed. These include reducing collection and
processing errors within the inventory, require better geographic data within the permit
review process to improve actual site location, and above all enhance database
management practices among the various regulatory programs that will, at a minimum,
allow for comparison and data retrieval from all relevant databases.
11
3) Does a combined assessment of permit information and inventory data serve as a
reasonable basis for identifying unauthorized construction along the shoreline?
The analysis above concludes that a comparison of shoreline surveys when linked
to permits through the wetlands permit database does not provide a reasonable
mechanism for a definitive identification of activities in violation of the state’s overall
wetland regulatory program. The initial query identified 563 possible sites and ended
with 7 following considerable review and collaboration with various regulatory partners.
Since there are no complete linkages between databases maintained by the various
regulatory bodies, it is apparent permits may exist for sites under one authority but not
another. If a site were to be identified as a possible violation, it would be necessary to
research all possible databases before pursuing further action against a property owner.
This study also clearly demonstrates that changes to the existing permit database would
greatly improve the use of the database for this type of application.
12

Summary and Conclusions
The challenge Virginia faces, if they wish to become proficient in reporting status
and trends associated with shoreline activity is to bridge gaps and refine existing
programs that currently issue, track, or monitor conditions. Refinement of current
database practices including attribution and data collection will be required if the intent is
to identify violations occurring along the shoreline. An independent review of each
program would be beneficial and existing or practical linkages between the various
databases identified.
Perhaps the greatest obstacle to meeting this challenge rests within the
architecture of the Commonwealth’s regulatory system. Since tidal shoreline
management in Virginia is segregated, reporting trends, as we have demonstrated here,
will be difficult, albeit impossible. Each component of the tidal shoreline system is
managed independently as required by separate laws. Local governments implement the
Tidal Wetlands Act and Coastal Primary Sand Dune Act through Wetland Boards and the
Chesapeake Bay Preservation Act through a Bay Board or other process. Sub aqueous
lands are the responsibility of the Virginia Marine Resources Commission.
The impediments to integration of databases and information follow sharply the
impediments to integration of shoreline management from a regulatory perspective.
Jurisdictional overlap occurs both horizontally (more than one authority at the same level
of government with management interests in the same resource) and vertically, as in
different levels of government with management interests in the same resource. For
example, the local Wetlands Boards, Virginia DEQ and the Federal Corps all manage
tidal wetlands. Likewise gaps occur where the jurisdictional boundaries of management
programs meet, as opposed to overlap. For example, sub aqueous lands are managed by
VMRC and tidal wetlands are managed by local Wetlands Boards, or non-tidal wetlands
in the Chesapeake Bay Resource Protection Area (RPA) are managed by DEQ and local
government manages the landward RPA buffer.
13

While particular shoreline management options may not be uniformly desirable
from different regulatory perspectives, coordination among management agencies will be
essential; particularly if the Commonwealth hopes to implement a practice of accurate
resource reporting. The effort should be motivated by the desire to maintain the capacity
of the natural system to do the things that are important and valuable to the general
citizenry of the Commonwealth. These programs uniformly seek to accommodate private
and public development interests (inclusive of erosion control) within the broader goal of
sustaining ecosystem services. This project has demonstrated some short comings
within the current management system that reduces its effectiveness for managing
cumulative and secondary impacts of activities that affect the littoral and riparian zones.
Our ability to support and implement sustainable shoreline management requires a
balanced approach to erosion protection which includes an effective strategy for
monitoring management outcomes.
14

Figure 1. Narrow fringe marsh has increased along this section of Nomini Creek since
the shoreline was surveyed in 2001.
15

Figure 2. The geographic correlation between new construction and permit locations
varies greatly in this study. Within the blue box the permit location associated with the
extension of the erosion control structure is clearly visible. Meanwhile, no permit was
found in the wetlands permit database to be associated with the structure highlight in the
pink box.
16

Figure 3. The permit highlighted in the box is most likely associated with the new
construction shown to the west.
17

References
Berman, M.R., Berquist, H., Hershner, C.H., Killeen, S., Nunez, K., Rudnicky, T., Schatt, D.E., and D. Weiss, 2007. Westmoreland County Shoreline Situation Report, Special Report in Applied Marine Science and Ocean Engineering No. 395, Comprehensive Coastal Inventory Program, Center for Coastal Resources Management Virginia Institute of Marine Science, College of William and Mary, Gloucester Point, Virginia, 23062 Berman, M.R., and C.H. Hershner, 1999. Guidelines for Developing Shorelines Situation Reports Establishing Protocols for Data Collection and Dissemination, final report to US EPA Region III, Wetlands Development Grant Program.
18

19
APPENDIX

Westmoreland County, Virginia Shoreline Situation Report
Prepared By: Comprehensive Coastal Inventory Program Center for Coastal Resources Management Virginia Institute of Marine Science, College of William and Mary Gloucester Point, Virginia June, 2007
This project was funded in part by the Virginia Coastal Zone Management Program at the Department of Environmental Quality through Grant # NA05NOS4191180 of the U.S. Department of Commerce, National Oceanic and Atmospheric Administration, under the Coastal Zone Management Act of 1972, as amended.

Westmoreland County - Shoreline Situation Report Supported by the Virginia Institute of Marine Science, Center for Coastal Resources Management, Comprehensive Coastal Inventory Program Prepared by (in alphabetical order) Marcia Berman Harry Berquist Sharon Dewing Carl Hershner Karinna Nunez Karen Reay Tamia Rudnicky Dan Schatt Dave Weiss Project Supervisors: Marcia Berman - Director, Comprehensive Coastal Inventory Program Carl Hershner - Director, Center for Coastal Resources Management Special report in Applied Marine Science and Ocean Engineering No. 395 of the Virginia Institute of Marine Science
June, 2007
This project was funded in part by the Virginia Coastal Zone Management Program at the Department of Environmental Quality through Grant # NA05NOS4191180 of the U.S. Department of Commerce, National Oceanic and Atmospheric Administration, under the Coastal Zone Management Act of 1972, as amended.

Chapter 1. Introduction 1.1 Background In the 1970s, the Virginia Institute of Marine Science (VIMS) received a grant through the National Science Foundation’s Research Applied to National Needs Program to develop a series of reports that would describe the condition of tidal shorelines in the Commonwealth of Virginia. These reports became known as the Shoreline Situation Reports. They were published on a county by county basis with additional resources provided by the National Oceanic and Atmospheric Administration’s Office of Coastal Zone Management (Hobbs et.al., 1975). The Shoreline Situation Reports quickly became a common desktop reference for nearly all shoreline managers, regulators, and planners within the Tidewater region. They provided useful information to address the common management questions and dilemmas of the time. Despite their age, these reports remain a desktop reference. The Comprehensive Coastal Inventory Program (CCI) is committed to developing a revised series of Shoreline Situation Reports that address the management questions of today and take advantage of new technology. New techniques integrate a combination of Geographic Information Systems (GIS), Global Positioning System (GPS) and remote sensing technology. Reports are now distributed electronically unless resources become available for hardcopy distribution. The digital GIS coverages, along with all reports, tables, and maps are available on the web at http://ccrm.vims.edu/shoreline_situation_rpts.html by clicking on Westmoreland County. 1.2 Description of the Locality
Westmoreland County has a land area of 252 square miles located on the Northern Neck of Virginia. Westmoreland shares its borders with Northumberland County, King George County, Essex County, and Richmond County in Virginia. Since a stretch of the county is located directly on the Potomac River, Westmoreland technically shares a border with Maryland and the county of Charles City.
Westmoreland is rural in character with a population of 16,900 in 2005. This is projected
to increase to 17,400 by the year 2015. This is consistent with growth over the past decade.
Westmoreland County has 264 miles of shoreline. The county website reports 6300 acres of wetlands and more than 5400 acres of land in conservation. The topography changes from a base elevation near sea level to more than 193 feet above sea level. Along the coastal areas Westmoreland has everything from low lying marshlands to high eroding bluffs. These characteristics are mapped and surveyed as part of this shoreline inventory.
Tidal shoreline protection is discussed at length in the County’s zoning ordinance. Westmoreland County has a local wetlands board which coordinates, reviews, and issues permits for activities adjacent to tidal waters. Provisions for implementation of the Chesapeake Bay Act are also reported in the County’s Zoning Ordinance (Westmoreland County, 2006) 1.3 Purpose and Goals
This shoreline inventory is developed as a tool for assessing conditions along the tidal shoreline in Westmoreland County. Field data were collected between July and October, 2006. Conditions are reported for three zones within the immediate riparian river area: riparian land use, bank and buffers, and the shoreline. A series of maps and tabular data are published to illustrate and quantify results of an extensive shoreline survey. The shoreline of the Potomac River, Nomini Creek, and the Yeocomico River, inclusive of small tributaries were surveyed for this inventory. A small section along the upper portion of Monroe Bay was coded using remote sensing techniques because the shoreline segment was inaccessible by boat. These areas are indicated on the maps. 1.4 Report Organization
This report is divided into several sections. Chapter 2 describes methods used to develop this inventory, along with conditions and attributes considered in the survey. Chapter 3 identifies potential applications for the data, with a focus on current management issues. All products are located online. 1.5 Acknowledgments
The Shoreline Situation Report for Westmoreland County was funded in part by the Comprehensive Coastal Inventory Program (CCI) with money appropriated by the General Assembly, and the Virginia Coastal Zone Management Program at the Department of
2

Environmental Quality, through Grant Number NA05NOS4191180 of the National Oceanic and Atmospheric Administration.
This work was completed entirely with staff support and management from the Virginia Institute of Marine Science’s Comprehensive Coastal Inventory Program. A host of individuals are acknowledged. In addition to those listed as preparers, the project directors would like to thank the VIMS Vessel Center for their support.
3

Chapter 2. The Shoreline Assessment: Approach and Considerations 2.1 Introduction
The Comprehensive Coastal Inventory Program (CCI) has developed a set of protocols for describing shoreline conditions along Virginia’s tidal shoreline. The assessment approach uses state of the art Global Positioning Systems (GPS), and Geographic Information Systems (GIS) to collect, analyze, and display shoreline conditions. These protocols and techniques have been developed over several years, incorporating suggestions and data needs conveyed by state agency and local government professionals (Berman and Hershner, 1999).
Three separate activities embody the development of a Shoreline Situation Report: data collection, data processing and analysis, and map generation. Data collection follows a three tiered shoreline assessment approach described below. 2.2 Three Tiered Shoreline Assessment
The data inventory developed for the Shoreline Situation Report is based on a three-tiered shoreline assessment approach. This assessment characterizes conditions in the shorezone, which extends from a narrow portion of the riparian zone seaward to the shoreline. This assessment approach was developed to use observations that could be made from a moving boat. To that end, the survey is a collection of descriptive measurements that characterize conditions. GPS units log location of conditions observed from a boat. No other field measurements are performed.
The three tiered shoreline assessment approach divides the shorezone into three regions: 1) the immediate riparian zone, evaluated for land use; 2) the bank, evaluated for height, stability, cover, and natural protection; and 3) the shoreline, describing the presence of shoreline structures for shore protection and recreational purposes. Each tier is described in detail below. 2.2a) Riparian Land Use: Land use adjacent to the bank is classified into one of ten categories (Table 1). The categories provide a simple assessment of land use, and give rise to land management practices that can be anticipated. GPS is used to measure the linear extent along shore where the practice is observed. The width of this zone is not measured. Riparian forest buffers are considered the primary land use if the buffer width equals or exceeds 30 feet. This width is calculated from digital imagery as part of the quality control in data processing.
4

Table 1. Tier One - Riparian Land Use Classes Forest stands greater than 18 feet high / width greater than 30 feet Scrub-shrub stands less than 18 feet high* Grass includes grass fields, and pasture land* Agriculture includes cropland* Residential includes single or multi family dwellings* Commercial includes small and moderate business operations, recreational facilities* Industrial includes large industry and manufacturing operations* Bare lot cleared to bare soil* Timbered clear-cuts* Paved areas where roads or parking areas are adjacent to the shore* Unknown land use undetectable from the vessel* * forest fringe along the shore is present in conjunction with the dominant land use
2.2b) Bank Condition: The bank extends off the fastland, and serves as an interface between the upland and the shore. It is a source of sediment and nutrient fluxes from the fastland, and bears many of the upland soil characteristics that determine water quality in receiving waters. Bank stability is important for several reasons. The bank protects the upland from wave energy during storm activity. The faster the bank erodes, the sooner the upland will be at risk. Bank erosion can contribute high sediment loads to the receiving waters. Stability of the bank depends on several factors: height, slope, sediment composition and characteristics, vegetative cover, and the presence of buffers to absorb energy impact to the bank itself.
The bank assessment in this inventory addresses four major bank characteristics: bank height, bank cover, bank stability, and the presence of natural (beach, marsh) buffers at the bank toe (Table 2). Conditions are recorded continuously using GPS as the boat moves along the shoreline. The GPS log reflects any changes in conditions observed.
Bank height is described as a range, measured from the toe of the bank to the top. Bank cover is an assessment of the percent of either vegetative or structural cover in place on the bank face. Natural vegetation, as well as structural cover like riprap is considered “cover”. The assessment is qualitative (Table 2). Bank stability characterizes the condition of the bank face. Banks that are undercut, have exposed root systems, down vegetation, or exhibit slumping of material qualify as a “high erosion”. At the toe of the bank, natural marsh vegetation and/or beach material may be present. These features offer protection to the bank and enhance water
5

quality. Their presence is noted in the field.
Table 2. Tier 2 - Bank Conditions Bank Attribute Range Description bank height 0-5 ft from the toe to the edge of the fastland 5-10 ft from the toe to the edge of the fastland 10-30ft from the toe to the edge of the fastland > 30 ft from the toe to the edge of the fastland bank stability low erosion minimal erosion on bank face high erosion includes slumping, scarps, exposed roots undercut erosion at the base of the bank bank cover bare <25% cover; vegetation or structural cover partial 25-75% cover; vegetation or structural total >75% cover; vegetation or structural marsh buffer no no marsh vegetation along the bank toe yes fringe, extensive, or embayed beach buffer no no sand beach present yes sand beach present Phragmites australis no no Phragmites australis present on site yes Phragmites australis present on site
Sediment composition and bank slope cannot be surveyed from a boat, and are not included. 2.2c) Shoreline Features: Structures added to the shoreline by property owners are recorded as a combination of points or lines. These features include defense structures, constructed to protect the shoreline from erosion; offense structures, designed to accumulate sand in transport; and recreational structures, built to enhance public or private use of the water (Table 3). The location of these features along the shore is surveyed with a GPS unit. Linear features are surveyed kinematically without stopping the boat. Structures such as docks, and boat ramps are point features, and a static six-second GPS observation is collected at the site. Table 3 summarizes shoreline features surveyed. Linear features are denoted with an “L” and point features are denoted with a “P.” The glossary describes these features, and their purpose along a shore.
6

Table 3. Tier 3 - Shoreline Features Feature Feature Type Comments Control Structures riprap L bulkhead L breakwaters L first and last of a series is surveyed groinfield L first and last of a series is surveyed jetty P debris L can include tires, rubble, tubes, etc. unconventional L composed on non-traditional materials marsh toe revetment L placed in front of an eroding marsh Recreational Structures pier/wharf P includes private and public boat ramp P distinguishes private vs. public landings boat house P all covered structures, assumes a pier marina L includes piers, bulkheads, wharfs
2.3 Data Collection/Survey Techniques Data collection is performed in the field from a small, shoal draft vessel, navigating at slow speeds parallel to the shoreline. To the extent possible, surveys take place on a rising tide, allowing the boat to be as close to shore as possible. The field crew consists of a boat operator, and one data surveyor. The boat operator navigates the boat to follow the shoreline geometry and collects data pertaining to shoreline features. The surveyor collects information pertinent to all land use and bank condition.
Data is logged using the handheld Trimble GeoExplorer III, GeoExplorer XT, or GeoExplorer XH GPS unit. GeoExplorers are accurate to within 4 inches of true position with extended observations and differential correction. Without post processing, these units can achieve accuracies around 3 ft (1 meter). Both static and kinematic data collection is performed. Kinematic data collection is a collection technique where data is collected continuously along a pathway (in this case along the waterway). GPS units are programmed to collect information at a rate sufficient to compute a position anywhere along the course. The shoreline data is collected at a rate of one observation every five seconds. Land use, bank condition, and linear shoreline structures are collected using this technique.
7

Static surveys pin-point fixed locations that occur at very short intervals. The boat actually stops to collect these data, and the boat operator must hold the boat against tidal current, and surface wind waves. Static surveys log 6 GPS observations at a rate of one observation per second at the fixed station. The GPS receiver uses an averaging technique to compute one position based on the 6 static observations. Static surveys are used to position point features like piers, boat ramps, and boathouses.
The Trimble GPS receivers being used include a function that allows a user to pre-program the complete set of features surveyed in a “data dictionary”. The data dictionary prepared for this Shoreline Situation Report includes all features described in section 2.2. As features are observed in the field, surveyors use scroll down menus to continuously tag each geographic coordinate pair with a suite of characteristics that describe the shoreland’s land use, bank condition, and shoreline features present. The survey, therefore, is a complete set of geographically referenced shoreline data. 2.4 Data Processing
Data processing occurs in two parts. Part one processes the raw GPS field data, and converts the data to GIS coverages (section 2.4a). Part two corrects the GIS coverages to reflect true shoreline geometry (section 2.4b). 2.4a.) GPS Processing: Differential correction improves the accuracy of GPS data by including other “known” locations to refine geographic position. Any GPS base station within 124 miles of the field site can serve as one additional location. The CORS base station operated by the National Geodetic Survey in Corbin, Virginia was used for most of the data processing in Westmoreland County.
Differential correction is the first step to processing GPS data. Trimble’s Pathfinder Office GPS software is used. The software processes time synchronized GPS signals from field data and the selected base station. Differential correction improves the position of the GPS field data based on the known location of the base station, the satellites, and the satellite geometry. When Selective Availability was turned off in late Spring, 2000, the need to post process data has nearly been eliminated for the level of accuracy being sought in this project.
Although the Trimble GeoExplorers are capable of decimeter accuracy (~ 4 inches), the short occupation of sites in the field reduces the accuracy to 5 meters (~16 feet). In many cases
8

the accuracy achieved is better, but the overall limits established by the CCI program are set at 5 meters. This means that features are registered to within 5 meters (~16 feet) or better of their true position on the earth’s surface. In this case, positioning refers to the boat position during data collection.
An editing function is used to clean the GPS data. Cleaning corrects for breaks in the data that occur when satellite lock is lost during data collection. Editing also eliminates erroneous data collected when the boat circles off track, and the GPS unit is not switched to “pause” mode.
The final step in GPS processing converts the files to three separate ArcInfo® shape files. These are converted into three coverages: a land use and bank condition coverage (westm_lubc), a shoreline structure coverage (lines only) (westm_sstruc), and a shoreline structure coverage (points only) (westm_astruc). 2.4b.) GIS Processing: GIS processing includes one major step that combines ESRI’s ArcInfo® GIS software, and ERDAS’ Imagine® software. Several data sets are integrated to develop the final inventory products. The processing is intended to correct the new GIS coverages so they reflect conditions at the shoreline, and not along the boat track. All attributes summarized in Tables 1, 2, and 3 are included. A digital shoreline coverage is generated to use as a basemap. For this inventory, a digital shoreline data set generated as part of the 2002 Virginia Base Mapping Program (VBMP) was used as the projects baseline shoreline. This shoreline is not referenced to a tidal datum, but is the most recent available data and developed from a very high resolution product. The shoreline is extracted from the digital terrain model. The VBMP imagery is also used for all background imagery used in data processing and map production. They are an important quality control tool for verifying the location of certain landscape attributes, and provide users with additional information about the coastal landscape.
GIS processing corrects the coverages generated from the GPS field data to the shoreline record. These coverages are geographically coincident with the boat track; from where observations are made. They are, therefore, located somewhere in the waterway. Processing transfers these data back to the shoreline basemap so the data more precisely reflect the location being described along the shore.
Data processing uses all three data sets simultaneously. The baseline shoreline, the post-processed GPS field data, and the ArcInfo coverages. The imagery is used in the background for
9

reference. The processing re-codes the base shoreline with the attributes mapped along the boat track. Each time the boat track data (i.e GPS data) indicates a change in attribute type or condition, the digital shoreline arc is split, and coded appropriately for the attributes using ArcInfo techniques.
The GIS processing under goes a rigorous sequence of checks to insure the positional translation is as accurate as possible. Each field coverage; land use, bank condition, and shoreline condition, is processed separately. The final products are three new coded GIS horeline coverages; westm_lubc (depicting land use and bank cover), westm_sstruc (depicting linear structures), westm_astruc (depicting point structures).
Quality control and assurance measures require that each coverage be checked twice
onscreen by different GIS personnel. Draft hardcopy maps are printed and reviewed in the third and final QA/QC step. Once complete, maps and tables are generated for the website. 2.4c.) Maps and Tables: Maps and tables can be viewed or downloaded as pdf files. A color printer is required on the user end. Color maps are generated to illustrate the attributes surveyed along the shore. A three-part map series has been designed to illustrate the three tiers individually. Plate A describes the riparian land use as color-coded bars along the shore. A legend keys the color to the type of land use. If the line is hatched, there is forest fringe on site. The background imagery is natural color VBMP imagery at a publication scale of 1:12,000. Users should note that the imagery is sometime rotated in order to meet the scale requirements. This means that “north” is not always to the top of the page. Plate B depicts the condition of the bank and any natural buffers present. Four lines, and a combination of color and pattern symbology give rise to a vast amount of bank and natural buffer information. The line furthest inland describes the bank cover. Bank cover is distinguished by colors. Bare banks (<25% cover) are illustrated in fuschia, partial cover (25-75%) is pale orange line, and total cover (>75%) is indicated by a light blue line. Moving toward the water, a darker blue line may be illustrated if Phragmites australis is present. This line will be absent if no Phragmites is detected. Bank height and stability is the next line sequence seaward. These are red, green or yellow lines with a red line indicating an unstable bank, a green line indicating stability, and a yellow line indicating evidence of undercutting. Bank height varies with the thickness of the line; where the thickest lines designate the highest banks (> 30
10

feet). A pattern of small colored circles just channel ward of the shoreline describes any natural buffers present. Open circles represent a natural embayed (green), extensive (fuschia), or fringe (yellow) marsh along the base of the bank. Solid orange circles indicate a sand beach buffer at the base of the bank. It is possible to have both. The length of the each of these symbols described along the shore reflects the length alongshore that the features persist. The symbology changes as conditions change. Plate B uses a grey scale version of the natural color image for the backdrop. Plate C combines recreational and shoreline protection structures in a composition called Shoreline Features. Linear features, described previously (Table 3), are mapped using color coded bar symbols that follow the orientation of the shoreline. Point features use a combination of colors and symbols to plot the positions on the map. Gray scale imagery is used as a backdrop, upon which all shoreline feature data are superimposed. For publication purposes the county is divided into a series of maps. Maps are scaled at 1:12,000 for publication at 11x17. Scale will vary if printed at a different size. There are 30 maps for Westmoreland County; determined by the geographic size and shape of the county. For each map there are three plates (plate 1a, 1b, 1c, etc.), for a total of 90 map compositions. On the website, an index is provided to help users locate the area of interest and view the orientation of the maps to each other. Each plate can be individually selected and viewed from the plate list along the left hand column of the index page.
Tables 4 and 5 quantify features mapped along the rivers using frequency analysis techniques in ArcInfo. The values quantify features on a plate-by-plate basis. For linear features, values are reported in actual miles surveyed. The number of point features surveyed is also listed on a plate by plate basis. The total miles of shoreline surveyed for each plate is reported. A total of 209.82 miles were surveyed in the field. Approximately 1.6 miles of the survey was performed using only remote sensing techniques. This was necessary due to navigation impediments or accessibility problems associated with shallow water. These areas include headwaters of small creeks that could not be reached by boat. Since there is plate overlap, total survey miles cannot be reached by adding the total shoreline miles for each plate. The last row of Tables 4 and 5 reports the total shoreline miles surveyed (field and remotely) for the county (209.82 miles), and the total amount of each feature surveyed along the measured shoreline. Table 6 reports the amount of Phragmites australis delineated along shore.
11

Chapter 3. Applications for Management 3.1 Introduction
There are a number of different management applications for which the Shoreline
Situation Reports (SSRs) support. This section discusses several high profile issues within the Commonwealth or Chesapeake Bay watershed. The SSRs are data reports, and the data provided are intended for interpretation and integration into other programs. This chapter offers some examples for how data from the SSRs can be analyzed to support current state management programs. 3.2 Shoreline Management
The first uses for SSRs were to prepare decision makers to bring about well-informed decisions regarding shoreline management. This need continues today, and perhaps with more urgency. In many areas, undisturbed shoreline miles are almost nonexistent. Development continues to encroach on remaining pristine reaches, and threatens the natural ecosystems that have persisted. At the same time, the value of waterfront property has escalated, and the exigency to protect shorelines as an economic resource using stabilization practices has increased. However, protection of tidal shorelines does not occur without incidence.
Management decisions must consider the current state of the shoreline, and understand what
actions and processes have occurred to bring the shoreline to its current state. This includes evaluating existing management practices, assessing shore stability in an area, and determining future uses of the shore. The SSRs provide data for such assessments.
For example, land use, to some extent, directs the type of management practices one can expect to find along the shoreline. The land use data, illustrated in plate “a” of the SSR series illustrates current land use at the time of survey that may be an indicator of shoreline management practices existing or expected in the future. Residential and commercial areas are frequently altered to counter act shoreline erosion problems or to enhance private access to the waterway. In contrast forested or agricultural uses are frequently unmanaged even if chronic erosion problems exist. Small forest tracks nestled among residential lots have a high probability for development in the future. These areas are also target areas then for shoreline modifications if development does occur. Local governments can do some enhanced and proactive planning if resources allow and the SSR data is readily available. Areas primed for
12

development can be assessed in advance to determine the need for shoreline stabilization, and the type of stabilization that should be recommended.
Stability at the shore is illustrated in plate “b”. The bank is characterized by its height, the amount of cover on the bank face, the state of erosion, and the presence or absence of natural buffers at the bank toe. Upland adjacent to high, fully covered, and stable banks with a stable natural buffer at the base are less prone to flooding or erosion problems resulting from storm activity. Upland adjacent to banks of lesser height (< 5feet) are at greater risk of flooding, but if banks are stable with marshes or beaches present, erosion may not be a significant concern. Survey data reveals a strong correlation between banks of high erosion, and the absence of natural buffers. Conversely, the association between stable banks and the presence of marsh or beach is also well established. This suggests that natural buffers such as beaches and fringe marshes play an important role in bank protection. This is illustrated on the maps. Banks without natural buffers, yet classified as low erosion, are often structurally controlled with riprap or bulkheads. Check plate “c” to verify this.
Plate “c” delineates structures installed along the shoreline. These include erosion control
structures, and structures to enhance recreational use of the waterway. This map is particularly useful for evaluating new requests from property owners seeking structural methods for controlling shoreline erosion problems. Shoreline managers can evaluate the current situation of the surrounding shore including: impacts of earlier structural decisions, proximity to structures on neighboring parcels, and the vicinity to undisturbed lots. Alternative methods such as vegetative control may be evaluated by assessing the energy or fetch environment from the images. Use this plate in combination with Plate B that indicates the qualitative erosion assessment made during the survey.
A close examination of shore conditions may suggest whether certain structural choices have been effective. Success of groin field and breakwater systems is confirmed when sediment accretion is observed. Low erosion conditions surveyed along segments with bulkheads and riprap indicate structures have controlled the erosion problem. The width of the shorezone, estimated from the background image, also speaks to the success of structures as a method of controlling erosion. A very narrow shorezone implies that as bulkheads or riprap have secured the erosion problem at the bank, they have also deflated the supply of sediment available to nourish a healthy beach. The structure may actually be enhancing erosion at the base of the structure due to scour and wave reflection. This is a typical shore response, and remains an unresolved management problem.
13

Shoreline managers are encouraged to use all three plates together when developing
management strategies or making regulatory decisions. Each plate provides important information independent of the others, but collectively the plates become a more valuable management tool. 3.3 Stream Restoration for Non-Point Source Management
The identification of potential problem areas for non-point source pollution is a focal point of water quality improvement efforts throughout the Commonwealth. This is a challenge for any large landscape. Fortunately, we are relatively well informed about the landscape characteristics that contribute to the problem. This shoreline inventory provides a data source where many of these landscape characteristics can be identified. The three tiered approach provides a collection of data which, when combined, can allow for an assessment of potential non-point source pollution problem areas in a waterway. Managers can effectively target river reaches for restoration sites. Below, methods for combining these data to identify problem sites are described.
Grass land and agricultural land, which includes pasture land and cropland, respectively, have the highest potential for nutrient runoff. These areas are also prone to high sediment loads since the adjacent banks are seldom restored when erosion problems persist. Residential, bare, and commercial land uses are also hot spots for non-point source pollution.
To identify areas with the highest potential for non-point source pollution combine these land uses with “high” bank erosion conditions, bare bank cover, and no marsh buffer protection. The potential for non-point source pollution moderates as the condition of the bank changes from “high” bank erosion to “low” bank erosion, or with the presence or absence of stable marsh vegetation to function as a nutrient sink for runoff. Where defense structures occur in conjunction with “low” bank erosion, the structures are effectively controlling erosion at this time, and the potential for non-point source pollution is reduced. If the following characteristics are delineated: low bank erosion, stable marsh buffer, riprap or bulkhead; the potential for non-point source pollution from any land use class can be lowered.
At the other end of the spectrum, forested and scrub-shrub sites do not contribute significant amounts of non-point source pollution to the receiving waterway. Forest buffers, in particular, are noted for their ability to uptake nutrients running off the upland. Forested areas
14

with stable or defended banks, a stable fringe marsh, and a beach would have the lowest potential as a source of non-point pollution. Scrub-shrub with similar bank and buffer characteristics would also be very low. A quick search for potential non-point source sites would begin on Plate A. Identify the “grass” or “agricultural” areas. Locate these areas on Plate B, and find those that have eroding banks (in red) without any marsh protection. The hot spots are these sites where the banks are highest (thick red line), so the potential sediment volume introduced to the water is greatest. Finally check plate C to determine if any artificial stabilization to protect the bank has occurred. If these areas are without stabilizing structures, they indicate the hottest spots for the introduction of non-point source pollution. 3.4 Designating Areas of Concern (AOC) for Best Management Practice (BMP) Sites
Sediment load and nutrient management programs at the shore are largely based on installation of Best Management Practices (BMPs). Among other things, these practices include fencing to remove livestock from the water, installing erosion control structures, and bank re-vegetation programs. Installation of BMPs is costly. Cost share programs provide relief for property owners, but funds are scarce in comparison to the capacious number of waterway miles needing attention. Targeting Areas of Concern (AOC) can prioritize spending programs, and direct funds where most needed.
Data collected for the SSR can assist with targeting efforts for designating AOCs. AOCs can be areas where riparian buffers are fragmented, and could be restored. Use Plate A to identify forested upland. Breaks in the continuity of the riparian forest can be easily observed in the line segments, and background image. Land use between the breaks relates to potential opportunity for restoring the buffer where fragmentation has occurred. Agricultural tracts which breach forest buffers are more logical targets for restoration than developed residential or commercial stretches. Agricultural areas, therefore, offer the highest opportunity for conversion. Priority sites for riparian forest restoration should target forested tracts breached by “agriculture” or “grass” land.
Plate “b” can be used to identify sites for BMPs. Look for where eroding bank conditions persist. The thickness of the line tells something about the bank height. The fetch, or the distance of exposure across the water, can offer some insight into the type of BMP that might be most appropriate. Marsh planting may be difficult to establish at the toe of a bank with high
15

exposure to wave conditions. Look for other marsh fringe in the vicinity as an indicator. Plate “c” should be checked for existing shoreline erosion structures in place.
Tippett et.al.(2000) used similar stream side assessment data to target areas for bank and riparian corridor restoration. These data followed a comparable three tier approach and combine data regarding land use and bank stability to define specific reaches along the stream bank where AOCs have been noted. Protocols for determining AOCs are based on the data collected in the field.
As water quality programs move into implementation phases the importance of shoreline erosion in the lower tidal tributaries will become evident. Erosion from shorelines has been associated with high sediment loads in receiving waters (Hardaway et.al., 1992), and the potential for increased nutrient loads coming off eroding fastland is a concern (Ibison et.al., 1990). The contribution to the suspended load from shoreline erosion is not quantified. Water quality modelers are challenged by gathering appropriate data for model inputs. In Maryland, where there is a complete Shoreline Situation Report series for each locality, data from the inventory is being used to assess shoreline areas where the introduction of sediment from shoreline erosion is possible. Using data illustrated in plate “c”, Maryland is able to identify areas that have been stabilized versus those that are undefended. . They are combining these data with computed shoreline erosion rates to determine the volume of sediment entering the system at points where the shoreline is unprotected.
This type of assessment would be very beneficial in Virginia and may assist in the water quality modeling efforts underway; especially those addressing suspended sediment loads. The SSR provide a resource of relatively recent data that could assist in defining areas of high erosion, and potential high sediment loads (e.g. plate “b”). Waterways with extensive footage of eroding shorelines represent areas that should be flagged as hot spots for sediment input. The volume of sediment entering a system is generally estimated by multiplying the computed shoreline recession rate by the bank height along some distance alongshore. Estimated bank height is mapped along all surveyed shorelines in plate “b”. Banks designated as “eroding” and in excess of 30 feet would be target areas for high sediment loads. Plate “a” can be used in combination with Plate “b” to determine the dominant land use practice, and assess whether nutrient enrichment through sediment erosion is also a concern. This would be the case along agriculturally dominated shoreline Table 4 quantifies the linear extent of high, eroding banks on a plate by plate basis.
16

3.5 Summary These represent only a handful of uses for the SSR data. Users are encouraged to consider merging these data with other local or regional datasets. Now that many agencies and localities have access to some GIS capabilities, the uses for the data are even greater. While the conditions mapped represent a snap shot in time, CCRM hopes to update these on a regular basis. Unfortunately, this goal is hindered by an absence of recent funds available for data collection. The program continues to seek resources and will modify goals and objectives as necessary.
As new issues emerge for coastal managers, and technology improves, the development of the current SSR series and future series will evolve to reflect these changes.
17

Chapter 4. The Shoreline Situation
The shoreline situation is described for conditions in Westmoreland County along primary and secondary shoreline. Characteristics are described for all navigable tidal waterways contiguous to these shorelines. A total of 209.82 miles of the total 262.02 miles of shoreline are described. Less than 2 miles (1.6 miles) were coded remotely. For remotely sensed areas, photo interpretation was made using DOQQs to detect land use, natural buffers, and shoreline structures where possible. Along remotely coded shoreline, there is an assumption that upland banks are well protected by vegetation, and erosion low. It is possible, however, for these banks to experience undercutting from tidal currents. This cannot be verified since field visits were not performed. Bank height conditions along reaches characterized using remote sensing techniques were estimated from USGS 1:24,000 topographic maps. Shoreline Situation Reports are only available electronically. From this website: http://www.ccrm.vims.edu/shoreline_situation_rpts.html users can access digital maps, tables, reports, GIS data, and metadata. The website is organized to encourage users to navigate through a series of informational pages before downloading the data. A map of Virginia and Maryland highlights each county with a completed inventory. There is a list of completed inventories by state below the map. Click on “Westmoreland County” to access all the information available.
From the page below, the user will be linked to a project review and disclaimer page where basic project and data use limitations are presented. The link to maps will take you to an index page illustrating the plate boundaries Figure 2). This is useful if you are interested in a specific area. There are 6 links at the bottom of the disclaimer page. These links are self-explanatory. When you click on “Maps” the county index page will appear. The index illustrates the distribution of plates geographically.
18

Figure 1. Shoreline Inventory Website
19

Figure 2. Map index for Westmoreland County
Once you determine which plate you want, the scroll down menu on the left has links to
the three part series for each plate (Figure 3). At the top of the scroll bar Riparian Land Use is first. You can scroll down to see links to maps illustrating Bank and Buffer conditions and Shoreline Features. The content and details of the three part plate series was described in detail in Chapter 2. The actual map will come up when you click on the plate number. For example, Figure 4 is the riparian land use map for plate 2. Figure 5 is the map illustrating Bank and Buffer conditions for plate 2, and Figure 6 shows all the shoreline features for that same area. You may open all three plates for the series, but can view only one at a time in most browsers. Tools for zooming and panning should be on the tool bar. The maps can be printed at full resolution up to 11x17 color. Color printers are necessary. Summary statistics for all data are reported in tables accessed through the “Tables” button on the inventory project page.
The link to the GIS data is found on the project page again. Files are compressed and easily downloaded. The metadata is a separate link that can also be downloaded. Users are encouraged
20

to read the metadata carefully as well as all other information in the disclaimer.
Figure 3. Scroll down menu for plates
21

Figure 4. Sample riparian land use map for Westmoreland County
22

Figure 5. Map illustrating bank and buffer conditions for plate 5 in Westmoreland County
23

Figure 6. Map illustrating shoreline features for plate 5 in Westmoreland County
24
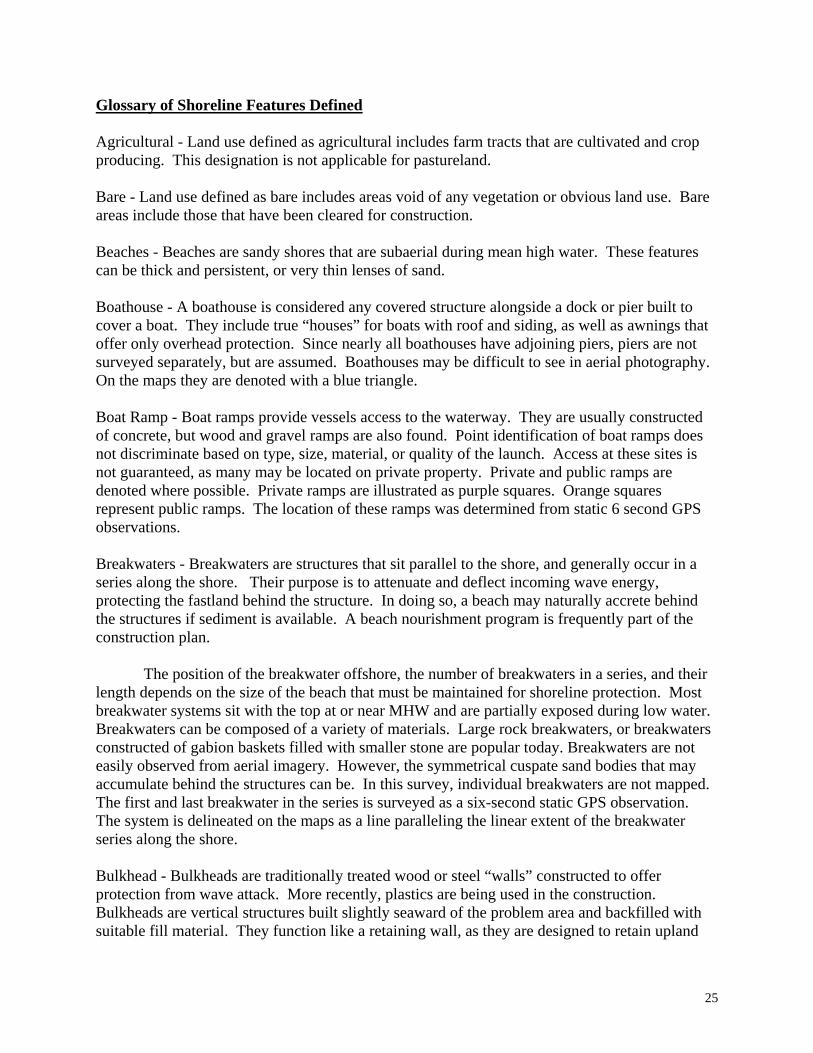
Glossary of Shoreline Features Defined Agricultural - Land use defined as agricultural includes farm tracts that are cultivated and crop producing. This designation is not applicable for pastureland. Bare - Land use defined as bare includes areas void of any vegetation or obvious land use. Bare areas include those that have been cleared for construction. Beaches - Beaches are sandy shores that are subaerial during mean high water. These features can be thick and persistent, or very thin lenses of sand. Boathouse - A boathouse is considered any covered structure alongside a dock or pier built to cover a boat. They include true “houses” for boats with roof and siding, as well as awnings that offer only overhead protection. Since nearly all boathouses have adjoining piers, piers are not surveyed separately, but are assumed. Boathouses may be difficult to see in aerial photography. On the maps they are denoted with a blue triangle. Boat Ramp - Boat ramps provide vessels access to the waterway. They are usually constructed of concrete, but wood and gravel ramps are also found. Point identification of boat ramps does not discriminate based on type, size, material, or quality of the launch. Access at these sites is not guaranteed, as many may be located on private property. Private and public ramps are denoted where possible. Private ramps are illustrated as purple squares. Orange squares represent public ramps. The location of these ramps was determined from static 6 second GPS observations. Breakwaters - Breakwaters are structures that sit parallel to the shore, and generally occur in a series along the shore. Their purpose is to attenuate and deflect incoming wave energy, protecting the fastland behind the structure. In doing so, a beach may naturally accrete behind the structures if sediment is available. A beach nourishment program is frequently part of the construction plan. The position of the breakwater offshore, the number of breakwaters in a series, and their length depends on the size of the beach that must be maintained for shoreline protection. Most breakwater systems sit with the top at or near MHW and are partially exposed during low water. Breakwaters can be composed of a variety of materials. Large rock breakwaters, or breakwaters constructed of gabion baskets filled with smaller stone are popular today. Breakwaters are not easily observed from aerial imagery. However, the symmetrical cuspate sand bodies that may accumulate behind the structures can be. In this survey, individual breakwaters are not mapped. The first and last breakwater in the series is surveyed as a six-second static GPS observation. The system is delineated on the maps as a line paralleling the linear extent of the breakwater series along the shore. Bulkhead - Bulkheads are traditionally treated wood or steel “walls” constructed to offer protection from wave attack. More recently, plastics are being used in the construction. Bulkheads are vertical structures built slightly seaward of the problem area and backfilled with suitable fill material. They function like a retaining wall, as they are designed to retain upland
25

soil, and prevent erosion of the bank from impinging waves. The recent proliferation of vertical concrete cylinders, stacked side by side along an eroding stretch of shore offer similar level of protection as bulkheads, and include some of the same considerations for placement and success. These structures are also included in the bulkhead inventory. Bulkheads are found in all types of environments, but they perform best in low to moderate energy conditions. Under high-energy situations, the erosive power of reflective waves off bulkheads can scour material from the base, and cause eventual failure of the structure. Bulkheads are common along residential and commercially developed shores. From aerial photography, long stretches of bulkheaded shoreline may be observed as an unnaturally straight or angular coast. In this inventory, they are mapped using kinematic GPS techniques. The data are displayed as linear features on the maps. Commercial - Commercial zones include small commercial operations as well as parks or campgrounds. These operations are not necessarily water dependent businesses. Dock/Pier - In this survey, a dock or pier is a structure, generally constructed of wood, which is built perpendicular or parallel to the shore. These are typical on private property, particularly residential areas. They provide access to the water, usually for recreational purposes. Docks and piers are mapped as point features on the shore. Pier length is not surveyed. In the map compositions, docks are denoted by a small green dot. Depending on resolution, docks can be observed in aerial imagery, and may be seen in the maps if the structure was built prior to 1994, when the photography was taken. Forest Fringe – When the dominant land use on a parcel is something other than forest cover, but the parcel retains a fringe of tree cover along the shoreline. Forest Land Use - Forest cover includes deciduous, evergreen, and mixed forest stands greater than 18 feet high. The riparian zone is classified as forested if the tree stand extends at least 33 feet inland of the seaward limit of the riparian zone. Grass - Grasslands include large unmanaged fields, managed grasslands adjacent to large estates, agriculture tracts reserved for pasture, and grazing. Groinfield - Groins are low profile structures that sit perpendicular to the shore. They are generally positioned at, or slightly above, the mean low water line. They can be constructed of rock, timber, or concrete. They are frequently set in a series known as a groinfield, which may extend along a stretch of shoreline for some distance. The purpose of a groin is to trap sediment moving along shore in the littoral current. Sediment is deposited on the updrift side of the structure and can, when sufficient sediment is available in the system, accrete a small beach area. Some fields are nourished immediately after construction with suitable beach fill material. This approach does not deplete the longshore sediment supply, and offers immediate protection to the fastland behind the system.
26

For groins to be effective there needs to be a regular supply of sediment in the littoral system. In sediment starved areas, groin fields will not be particularly effective. In addition they can accelerate erosion on the downdrift side of the groin. The design of “low profile” groins was intended to allow some sediment to pass over the structure during intermediate and high tide stages, reducing the risk of down drift erosion. From aerial imagery, most groins cannot be observed. However, effective groin fields appear as asymmetrical cusps where sediment has accumulated on the updrift side of the groin. The direction of net sediment drift is also evident. This inventory does not delineate individual groins. In the field, the first and last groin of a series is surveyed. We assume those in between are evenly spaced. On the map composition, the groin field is designated as a linear feature extending along the shore. Industrial - Industrial operations are larger commercial businesses. Marina - Marinas are denoted as line features in this survey. They are a collection of docks and wharfs that can extend along an appreciable length of shore. Frequently they are associated with extensive bulkheading. Structures associated with a marina are not identified individually. This means any docks, wharfs, and bulkheads would not be delineated separately. However, if a boat ramp is present it will be surveyed separately and coded as private. Marinas are generally commercial operations. Community docks offering slips and launches for community residents are becoming more popular. They are usually smaller in scale than a commercial operation. To distinguish these facilities from commercial marinas, the riparian land use map (Plate A) will denote the use of the land at the site as residential for a community facility, rather than commercial. The survey estimates the number of slips within the marina and classifies marinas as those with less than 50 slips and those with more than 50 slips. Marsh Toe Revetment – generally a stone structrure (see rip rap) placed at the seaward edge of an existing eroding marsh. Marshes - Marshes are classified as “extensive”, “embayed” or “fringe” marshes. Extensive marshes generally occupy significant acreage. Embayed marshes are similar to pocket or headwater marshes. Fringe marshes are narrow strips of marsh vegetation that extend along the shoreline. In all cases, vegetation must be relatively well established, although not necessarily healthy. Miscellaneous - Miscellaneous point features represent short isolated segments along the shore where material has been dumped to protect a section of shore undergoing chronic erosion. Longer sections of shore are illustrated as line features. They can include tires, bricks, broken concrete rubble, and railroad ties as examples. Paved - Paved areas represent roads which run along the shore and generally are located at the top of the banks. Paved also includes parking areas such as parking at boat landing, or commercial facilities.
27

Phragmites australis - a non-native, invasive wetland plant known to thrive in areas that have experienced disturbance. The plant is prolific and is known to out complete native species. Various types of eradication methods have been used to stop the growth of this plant. Residential - Residential zones include rural and suburban size plots, as well as multi-family dwellings. Riprap - Generally composed of large rock to withstand wave energy, riprap revetments are constructed along shores to protect eroding fastland. Revetments today are preferred to bulkhead construction. They reduce wave reflection that causes scouring at the base of the structure, and are known to provide some habitat for aquatic and terrestrial species. Most revetments are constructed with a fine mesh filter cloth placed between the ground and the rock. The filter cloth permits water to permeate through, but prevents sediment behind the cloth from being removed, and causing the rock to settle. Revetments can be massive structures, extending along extensive stretches of shore, and up graded banks. When a bulkhead fails, riprap is often placed at the base for protection, rather than a bulkhead replacement. Riprap is also used to protect the edge of an eroding marsh. This use is known as toe protection. This inventory does not distinguish among the various types of revetments. Riprap revetments are popular along residential waterfront as a mechanism for stabilizing banks. Along commercial or industrial waterfront development such as marinas, bulkheads are still more common since they provide a facility along which a vessel can dock securely. Riprap is mapped as a linear feature using kinematic GPS data collection techniques. The maps illustrate riprap as a linear feature along the shore. Scrub-shrub - Scrub-shrub zones include trees less than 18 feet high, and is usually dominated by shrubs and bushy plants.
28

References Berman, M.R., and C.H. Hershner, 1999. Guidelines for Developing Shorelines Situation Reports Establishing Protocols for Data Collection and Dissemination, final report to US EPA Region III, Wetlands Development Grant Program. Byrne, R.J. and G.L. Anderson, 1983. Shoreline Erosion in Tidewater Virginia. Special Report in Applied Marine Science and Ocean Engineering No. 111, Virginia Institute of Marine Science, Gloucester Point, VA, 102 pp. Hardaway, C.S., Thomas, G.R., Glover, J.B., Smithson, J.B., Berman, M.R., and A.K. Kenne, 1992. Bank Erosion Study. Special Report in Applied Marine Science and Ocean Engineering No. 319, Virginia Institute of Marine Science, School of Marine Science, College of William and Mary, Gloucester Point, VA, 73 pp. Hobbs, C.H., III, Owen, D.W., and L.C. Morgan, 1979. Summary of Shoreline Situation Reports for Virginia’s Tidewater Localities. Special Report in Applied Marine Science and Ocean Engineering No. 209, Virginia Institute of Marine Science, Gloucester Point, VA, 32 pp. Ibison, N.A., Baumer, J.C., Hill, C.L., Burger, N.H., and J.E. Frye, 1992. Eroding bank nutrient verification study for the lower Chesapeake Bay. Department of Conservation and Recreation, Division of Soil and Water Conservation, Shoreline Programs Bureau, Gloucester Point, VA. Tippett, J., Sharp, E., Berman, M., Havens, K., Dewing, S., Glover, J., Rudnicky, T., and C. Hershner, 2000. Rapidan River Watershed - Riparian Restoration Assessment, final report to the Chesapeake Bay Restoration Fund through the Center for Coastal Management and Policy, Virginia Institute of Marine Science, College of William and Mary.
29