short and long-term dynamics of the u.s ... and long-term dynamics of the u.s. profit rate in the...
TRANSCRIPT

SHORT AND LONG-TERM DYNAMICS OF
THE U.S. PROFIT RATE IN THE CONTEXT
OF THE CURRENT CRISIS
Sergio CÁMARA IZQUIERDO
Área de Investigación Sociedad y Acumulación Capitalista
Departamento de Economía
Universidad Autónoma Metropolitana-Azcapotzalco
Paper to be presented at the
CONGRÈS MARX INTERNATIONAL VI
“CRISES, RÉVOLTES, UTOPIES”
22-25 September 2010, Université de Paris-Ouest-Nanterre-La Défense, France
ABSTRACT
The paper analyses the short and long-term dynamics of the U.S. profit rate in
the postwar era and, in particular, in the context of the current crisis; therefore, the
current crisis is characterized from the profitability trends and fluctuations. In the long-
term, Marxian theory postulates a tendentially falling profit rate as the main cause of
structural crisis of over-accumulation. However, it is argued that the current crisis has
not been preceded by such a tendency in the U.S. economy; rather there has been a
recovery of the profit rate. However, the crisis can be characterized from the structural
tendencies of profitability and accumulation; essentially, it is argued that the low levels
of profitability and the neoliberal inhibition of productive investment constitute the
structural context of the crisis. Secondly, a short-term downfall of the profit rate,
associated with the cyclical movement of the profit share and the interest rate, triggered
the cyclical crisis of the U.S. economy that resulted in the bursting of the housing
bubble and international financial crisis.

SHORT AND LONG-TERM DYNAMICS OF
THE U.S. PROFIT RATE IN THE CONTEXT
OF THE CURRENT CRISIS
Sergio CÁMARA IZQUIERDO
Área de Investigación Sociedad y Acumulación Capitalista
Departamento de Economía
Universidad Autónoma Metropolitana-Azcapotzalco
Paper to be presented at the
CONGRÈS MARX INTERNATIONAL VI
“CRISES, RÉVOLTES, UTOPIES”
22-25 September 2010, Université de Paris-Ouest-Nanterre-La Défense, France
CONTENTS
1. Introduction ................................................................................................................. 1
2. Profitability and accumualation trends: a structural characterization of
the current crisis .......................................................................................................... 3
2.1 Postwar profitability trends in United States .......................................................... 5
2.2 Keynesian and neoliberal accumulation trends ...................................................... 8
2.3 A crisis of neoliberalism? ..................................................................................... 14
3. Business cycles and short-term dynamics of the profit rate .................................. 15
3.1 From the 2001 crisis to the current one ................................................................ 16
3.2 Short-term distribution and profitability dynamics .............................................. 19
3.3 Interest rate and profit rate cycles ......................................................................... 22
3.4 The profit rate fluctuations and the business cycle: cause or consequence? ........ 23
4. Conclusions ................................................................................................................ 23
Bibliography ................................................................................................................... 24

1
SHORT AND LONG-TERM DYNAMICS OF
THE U.S. PROFIT RATE IN THE CONTEXT
OF THE CURRENT CRISIS
Sergio CÁMARA IZQUIERDO
Área de Investigación Sociedad y Acumulación Capitalista
Departamento de Economía
Universidad Autónoma Metropolitana-Azcapotzalco
1. INTRODUCTION
The current crisis is often said to be a structural one, but it is not so frequent to
find a thorough foundation for this assertion. It could be fairly suspected that the
statement is on many occasions wrongly grounded in its profound and prolonged nature.
The consequent shabby comparisons with the 1929 economic depression that quickly
come to surface add to this superfluous characterization. The current crisis is indeed
structural and its similitude to the Great Depression is greater than it is regularly
accounted. However, this vigorous statement must be properly founded; it must be
clearly showed that the causes of the ongoing crisis are related in some way to the
economic structure and, more importantly, it must be proved that the crisis necessarily
implies a restructuration of the main economic relations.
Marxist economic theory provides a solid base for structural economic analysis.
According to it, the capitalist economy is a class society in which the social relations of
production are characterized by capital‟s exploitation of labor and its drive for profit,
which is itself lastly explained by capital‟s drive for accumulation. In other words, the
incessant expansion of capital is the requisite for the reproduction of capitalist societies.
The structural conditions of profitability are, therefore, the main indicator of the health
of the process of capital accumulation and the economy as a whole. The structural
nature of a crisis must be related then to the general conditions of capital profitability
and accumulation.
On the other hand, crises are fundamentally cyclical economic episodes
characterized by a sudden disruption in the process of accumulation. Their emergence is
not immediately related to the long-term dynamics of profitability and accumulation;
instead, short-term economic phenomena spark crises. Nonetheless, their specific

2
development depends on structural conditions of the valorization and accumulation of
capital, so determining the depth and length of the crisis. Also, structural conditions
determine the extent of the recomposition processes of the profitability and
accumulation conditions that take place as a consequence of the crisis, though the
distinction between short and long-term transformations can be blurry. To sum up, an
economic crisis evidences the existing reproduction problems of the capitalist social
relations, and reflects the structural economic conditions in its severity and duration as
well as in the transformation processes that restructure the conditions of valorization
and accumulation in order to ensure the reproduction of capitalist social relations.
The rate of profit, the most relevant variable in the long-term economic analysis
of crisis, also plays a role in the short-term dynamics of crises; mainly, the rate of profit
shows a procyclical behavior. In a first approximation, the positive relation is explained
by the consequences of the crisis on the rate of profit. Thus, the decrease in the level of
economic activity and capacity utilization entitled by a crisis implies a slump in the
profit rate. Also, the greater rigidity of wages in relation to profits during economic
fluctuations explains the cyclical decline in profitability. However, it may also occur the
opposite, that is, a short-term fall in the rate of profit can trigger a crisis. This cyclical
behavior of the profit rate can be explained by their more volatile determinants, such as
income distribution or interest rate fluctuations.
This paper analyzes the long and short-term dynamics of the profit rate in the
U.S. economy during the postwar era and, in particular, in the context of the current
crisis, in order to reveal some of its structural and cyclical characteristics. Therefore, a
comprehensive characterization of the current crisis is not offered, but a partial
characterization biased towards the profitability trends and fluctuations. The rest of the
paper is organized as follows. The second section analyses the long-term dynamics of
the profit rate and its relation with the accumulation process. Firstly, it is contended that
the current crisis is not preceded by a tendential fall in the rate of profit; rather there is a
mild recovery in the general profit rate in the last decades. Nevertheless, the current
crisis has taken place in a lasting context of structurally low profitability caused by the
persistent overaccumulation of capital inherited from 1970s crisis. Secondly, the last
decades are also depicted as the neoliberal regime of accumulation, characterized by its
diminished investment effort as a consequence of the restoration of the power of finance
(lending and shareholding capital) in relation to the productive (industrial and

3
commercial) capital. Therefore, the current crisis can be characterized as a crisis of
neoliberalism.
The third section analyzes the short-term dynamics of the profit rate and its
relation with the business cycle. Firstly, it is shown the strong procyclical nature of the
profitability fluctuations. Secondly, a closer analysis on the dynamics of profitability
during the last two business cycles, corresponding to the Clinton and Bush
administrations, is presented. First, it is contended that the fall in the rate of profit
anticipates the advent of both recessions; this conclusion also holds when the after-tax
rate of profit, which incorporates the effects of fiscal policy, is analyzed. Thirdly, it is
shown that the drop in the profit share is the main cause in the decline of the general and
the after-tax rate of profit. Finally, the role played by the interest rate fluctuations is
analyzed, evidencing its contribution to the 2002-2004 recovery and current crisis
through its impact on the interest burden on profits. Therefore, the short-term decline of
the profit rate is posited as a precipitating factor of the current crisis. The last section
concludes.
2. PROFITABILITY AND ACCUMUALATION TRENDS: A STRUCTURAL
CHARACTERIZATION OF THE CURRENT CRISIS
During the postwar long boom, orthodox Marxist economic theory remained in
impasse. The persistent economic growth seemed not to have an end; cyclical booms
were vigorous and long, while recessions were mild and short. Consequently, the case
for a crisis-prone capitalism was undermined just a few years after the Great
Depression. Not surprisingly, postwar Marxism was dominated by a general discussion
of the “possibly changed nature of capitalism,” (Howard and King, 1992: ch. 4) where
the “revisionist” positions prevailed to the few orthodox participants. Less surprisingly,
things turned around with the coming of the 1970s crisis. Then, orthodox Marxist
economic theory was revitalized around the law of the falling rate of profit and its role
in the occurrence of structural crisis. And not without a reason: the significant empirical
research developed since the 1970s crisis has fairly shown that it was a structural crisis
of overaccumulation related to the fall in profitability caused by technical change.1
1 There are numerous empirical investigations about the tendential fall of the U.S. rate of profit and its
relation to the 1970s crisis; for instance, see Shaikh (1992), Duménil et al. (1987) and Moseley (1991).
The U.S. profitability dynamics can be extrapolated to the world economy, as other numerous empirical
studies on national and multinational dynamics of the rate of profit have proved. For instance, Cámara
(2008: 55-62) characterizes the global dynamics of the world economy, represented by United States,

4
The current crisis has renewed the Marxist debate on crisis theory. In the search
for a Marxian explanation and characterization of the crisis, the inertia of the 1970s
crisis and the orthodox Marxism revival has drawn some authors to turn to the law of
the falling rate of profit as the main explanation of the current (structural) crisis.2 Most
authors, on the contrary, have explained the crisis based on the contradictory nature of
the new dynamics of the world economy since the 1980s, labeled as neoliberalism3
and/or financiarization.4 However, the characterization of the neoliberalism is not
always properly related to the structural trends in profitability and accumulation; often,
neoliberal dynamics are presented as an autonomous force. Consequently, the financial,
rather than the real, dimensions of the crisis are stressed. Repeatedly, the causes of the
crisis are linked to the (de)regulation of markets –mostly, financial–, the unsustainable
growth of the speculative financial sphere and its disconnection with the productive
sphere. The presumption underlying this characterization is that the crisis could have
been avoided or tempered if the adequate policy actions would have been taken, given
the improved structural conditions of valorization and accumulation.
Within this context, the present section provides a structural characterization of
neoliberalism based on the long-term dynamics of the rate of profit and its structural
relation to accumulation; accordingly, the current crisis is structurally characterized as a
crisis of neoliberalism.
Spain and Mexico, and identifies a world pattern of tendential fall in the rate of profit caused by a biased
technical change towards capital. Freeman (1991) for the United Kingdom; Li et. al (2007) for Japan,
United Kingdom, Germany, and France; and Marquetti et. al (2008) for Brazil, among others, confirm
this pattern. 2 Harman (2009), Carchedi (2009), Kliman (2009), and Astarita (2009a) represent some examples of this
pursuit. Harman (2009) compares the 1929 economic slump with the current crisis and points out that “in
both cases capital was faced with a rate of profit lower than two or three decades earlier”. In the same
vein, Carchedi (2009) states that “both theoretical an empirical investigation have provided substantiation
for the thesis that the crises‟ ultimate cause is the tendential fall in the average rate of profit,” and he
thinks this holds for the current crisis. Kliman (2009) claims the falling rate of profit “was an indirect
cause”, but “not the proximate cause of the crisis”, (ibid: 5) given that “that much or even the entire
decline in the rate of profit occurred by the early 1980s, a quarter-century before the current crisis
erupted.” (ibid: 28) Astarita (2009), on the contrary, points out that the falling rate of profit cannot
explain great crisis as the 1930s Great Depression, the Japan‟s 1990s stagnation, or the current crisis. As a
consequence, he departs from the orthodox perspective based on profitability and accumulation to
endorse a crisis theory that relies on the tendency of the economy to overinvestment (excess capacity) and
to disproportionality. 3 A comprehensive Marxian interpretation of neoliberalism can be found in the work of Duménil and
Lévy (2003, 2004a, 2004b). 4 Two Marxist, but opposing views on the concept of financiarization are found in Lapavitsas (2009) and
Astarita (2009b).

5
2.1 Postwar profitability trends in United States
The U.S. general rate of profit has gone through two different long periods after
the Second World War. (Figure 1) The first one dates from the end of the war –when a
strong increase in the profit rate concluded– to the 1970s crisis, corresponding to the
Keynesian period. During this period, the U.S. economy enjoyed high levels of
profitability that entailed a vigorous process of accumulation and an important
economic growth, averaging 4.17% in 1950-1973. The tendency of the rate of profit to
fall manifested in the second half of the 1960s and the 1970s, and it reached its lowest
level in the 1982 crisis. During the crisis years, the rate of profit averaged 18.9%, which
means a 5.5% less in absolute terms and a 23% less in relative terms compared to the
postwar boom years. As stated above, it has been established that the falling
profitability was the cause of the 1970s crisis.
Figure 1. Long-term dynamics of the general profit rate.
United States, 1946-2009
Source: Cámara (2009a). The dotted line represents the average level of the general rate of profit in the
three periods represented. The general rate of profit is defined as the ratio between total surplus value of
the economy and total capital advanced in production.
The second period goes from the 1970s crisis to the present, the neoliberal
period. It corresponds to a period of slight recovery of the general rate of profit, as it
averaged 1.2% higher than during the crisis years. Anyhow, the recovery only partially
offsets the previous fall in the rate of profit, barely above 20% of it. Therefore,
neoliberalism can be characterized as a low profitability period if compared with the

6
first period; the rate of profit is 4.3% lower in absolute terms and 18% lower in relative
terms than during Keynesianism. According to the labor theory of value, the structural
conditions of the capital valorization during neoliberalism explain the meager economic
growth during the period, averaging an annual rate of 2.95% in 1983-2009, as it will be
shown below.
The observation of the dynamics of the general rate of profit during the last
decades prevents an association of the current crisis with the tendential fall in the rate of
profit. On the contrary, the rate of profit undergoes a slight recovery during the
neoliberal years. Nevertheless, the current crisis must be contextualized within a very
long period –over three decades– of low profitability, i.e., a period of weak structural
conditions of accumulation and economic growth, as well as a period of greater
instability.
The long-term dynamics of profitability can be further depicted by the
decomposition of the general rate of profit (P/K) between its distributive and
technological components, the profit share (P/Y) and the productivity of capital (Y/K),5
respectively, where P is the surplus value, K is the capital advance in production, and Y
is the new value created:
K
Y
Y
P
K
P
A visual observation of Figure 2 shows that the general rate of profit follows a
pattern similar to the productivity of capital, the latter being less volatile than the rate of
profit.6 Therefore, the dynamics of the general rate of profit seems structurally
determined by the productivity of capital, and affected by the short-term fluctuations in
the profit share, which remains virtually constant along the period. This is confirmed by
the numbers. The drop in the productivity the capital from the 1946-1973 period to the
1974-1983 period explains 78% of the fall in the rate of profit, while the minor decrease
in the profit share explains only 22%. Therefore, the declining profitability manifested
during the Keynesian period is explained by the technological component of the rate of
5 The Marxian productivity of capital, a social and total measure, is at odds with the orthodox concept, a
physical and partial measure. (Cámara, 2010) 6 The dynamics of the productivity of capital shown in the graph includes the fluctuations in the capacity
utilization rate. A measure of the productivity of capital that abstracts from it would show an even less
volatile behavior.

7
profit, confirming the expectations of the Marxian law of the tendency of the rate of
profit to fall. The scant recovery of the general rate of profit during the neoliberal period
is also explained mostly by the productivity of capital, which accounts for 84% of the
6.6% relative increase in profitability, while the profit share remains nearly constant –it
grows only 1% in relative terms– and explains only 16% of the recovery.7
Figure 2. General rate of profit, productivity of capital, and profit share.
United States, 1946-2009, index numbers: 1960-5 = 100
60
70
80
90
100
110
19
46
19
48
19
50
19
52
19
54
19
56
19
58
19
60
19
62
19
64
19
66
19
68
19
70
19
72
19
74
19
76
19
78
19
80
19
82
19
84
19
86
19
88
19
90
19
92
19
94
19
96
19
98
20
00
20
02
20
04
20
06
20
08
Rate of profit Productivity of capital Profit share Source: Cámara (2009a).
In a comparison between the Keynesian and neoliberal periods, it is observed
that the profit share is only 4% lower in the last one, while the productivity of capital is
14% lower. This means that the low general rate of profit is still explained by its
technological component, in spite of being the main contributor to its recovery, and that
the structural profitability constraint to accumulation and growth has a technological
nature. Of course, this cannot be interpreted from a physical-technical perspective, but
rather in Marxian terms as a persistent problem of overaccumulation of capital; in other
words, the amount of capital (accumulated value) remains excessive in relation to the
surplus value created with the existing conditions of valorization. Therefore, the current
7 This behavior of the profit share would contradict a characterization of neoliberalism as a period of
diminished power of the working class and imposition of the capitalist class of higher levels of
exploitation. However, a closer look to the dynamics of real wages and the distribution of income among
wage-earners reaffirms this characterization. (Cámara, 2009b: 10-12)

8
crisis took place in a structural enduring context of overaccumulation of capital,
inherited from the 1970s structural crisis.
Figure 3. General rate of profit, different levels of aggregation.
United States, 1946-2009
12%
15%
18%
21%
24%
27%
19
46
19
48
19
50
19
52
19
54
19
56
19
58
19
60
19
62
19
64
19
66
19
68
19
70
19
72
19
74
19
76
19
78
19
80
19
82
19
84
19
86
19
88
19
90
19
92
19
94
19
96
19
98
20
00
20
02
20
04
20
06
20
08
Business sector Corporate businesses Nonfinancial corporate businesses Source: Cámara (2009a).
The analysis of the general rate of profit in lower levels of aggregation confirms
the long-term dynamics of profitability just described for the whole U.S. capitalist
economy. Figure 3 shows the general rate of profit of the corporate business sector and
the corporate nonfinancial business sector, along with the whole economy measure.
Besides the lower level of both new estimates, the long-term patterns are similar; in
particular, the two-phase periodization of the profitability trends is preserved. Actually,
for the corporate businesses and the corporate nonfinancial businesses, the fall in the
rate of profit amounts to 24% and 25% in relative terms, respectively, very close to the
figure of all capitalist businesses. The neoliberal recovery in the general rate of profit is
a relative 8.8% and 10.1%, respectively, only slightly higher than in the extensive
sector.
2.2 Keynesian and neoliberal accumulation trends
In Marxist economic theory, there is direct relationship between the conditions
of valorization and the process of capital accumulation. In this vein, the vigorous
process of accumulation during Keynesianism is consequence of the high levels of the
general rate of profit. Analogously, the low profitability characteristic of the neoliberal

9
period is the key explanation of the undermined process of accumulation of the last
decades. In Figure 4, both the rate of profit and the rate of accumulation are represented.
It is evident that the rate accumulation collapsed along with the falling rate of profit in
the second half of the 1960s and the 1970s, marking the end of the Keynesian period.
However, the slight recovery of the general rate of profit during the neoliberal period is
not transmitted at all to the rate of accumulation, which keeps a downward tendency, in
spite of the upswing during the 1990s boom associated to the investment in
technological and communication technologies.
Figure 4. General rate of profit and rate of accumulation.
United States, 1946-2009
0%
1%
2%
3%
4%
5%
6%
5%
10%
15%
20%
25%
30%
19
46
19
48
19
50
19
52
19
54
19
56
19
58
19
60
19
62
19
64
19
66
19
68
19
70
19
72
19
74
19
76
19
78
19
80
19
82
19
84
19
86
19
88
19
90
19
92
19
94
19
96
19
98
20
00
20
02
20
04
20
06
20
08
Rate of profit Rate of accumulation
Source: Cámara (2009a). The rate of profit is plotted in the left axis and the rate of accumulation is
plotted in the right axis. The rate of accumulation is defined as the ratio between total nonresidential net
investment and total capital advanced in the economy.
The lack of a direct relationship between both rates during the neoliberal period
is consequence of the transformed mediation between profitability and accumulation
that also shapes the dynamics of the accumulation process. In order to discern between
both relationships, the rate of accumulation –defined as the rate of capital expansion,
that is, the ratio of net investment (NI) and capital (K)– is disaggregated between the
rate of profit and the investment coefficient –defined as the ratio between net
investment and surplus value (P)–, which can be interpreted as a measure of the
mediation between profitability and accumulation:

10
P
NI
K
P
K
NI
The rate of accumulation collapsed from an average level of 4.2% during the
Keynesian period (1946-1973) to an average level of 3.0% during neoliberalism,
representing a relative plunge of 29%. As stated above, the falling rate of profit explains
the greater part of it, as much as 56%, but the decline in the investment coefficient
explains the remaining 44%, given the 13.9% relative decline of this variable between
the Keynesian and neoliberal periods. Therefore, the neoliberal accumulation trends
differ from the Keynesian ones not only in the lower level of accumulation, but also in
the diminished propensity of capital to invest profits productively. This feature also
structurally contextualizes the current crisis.
The dynamics of the investment coefficient of the U.S. capitalist economy, as
well as the lower levels of aggregation,8 are plotted in Figure 5. Beyond the lower
average level of the coefficient during the neoliberal period and the predictable
volatility of the variable, it is worth noting that the investment coefficient shows two
distinct trends during the Keynesian and neoliberal periods. In the first one,
characterized by high profitability and propensity to invest, the coefficient shows an
upward trend, reflecting that the response of capitalists to the falling profitability was an
increase in the productive investment effort. Quite the reverse, the neoliberal response
to the mild recovery of the general profit rate consisted in a diminished proportion of
the surplus value invested productively. Again, the divergent described trends allow to a
contrasting characterization of the Keynesian and neoliberal processes of accumulation.
Graphically, the observed pattern of the investment coefficient for the whole
economy is replicated in the lower levels of aggregation; both show an upward trend
during Keynesianism and a downward trend during neoliberalism. However, they do not
display the same steep decline than the overall investment coefficient; the corporate
business sector diminished only in 2.0% its investment effort in relative terms, while
this figure was 6.9% for the corporate nonfinancial businesses. This could be wrongly
interpreted as if these sectors retain higher profits or as if some of the profits generated
8 The investment coefficients of the lower levels of aggregation must be interpreted bearing in mind that
the profits obtained in an economic sector need not to be invested in the same sector. Similarly, the profits
generated in the U.S. economy could be invested abroad. Anyway, the investment coefficient is for sure
an appropriate measure of the capacity of retaining profits for investment at any level of aggregation, that
is, the mediation between profitability and accumulation.

11
in the noncorporate business sector were productively accrued in the corporate
businesses –particularly, in the financial ones–. Yet, a closer look into the distinct
components of profits prevents this conclusion.
Figure 5. Investment coefficient, different levels of aggregation.
United States, 1946-2009
0%
5%
10%
15%
20%
25%
30%
19
46
19
48
19
50
19
52
19
54
19
56
19
58
19
60
19
62
19
64
19
66
19
68
19
70
19
72
19
74
19
76
19
78
19
80
19
82
19
84
19
86
19
88
19
90
19
92
19
94
19
96
19
98
20
00
20
02
20
04
20
06
20
08
Business sector Corporate businesses Corporate nonfinancial businesses
Source: Cámara (2009a). The investment coefficient is defined as the ratio between total nonresidential
net investment and total surplus value.
Surplus value can be divided into of taxes, net interest, dividends and retained
earnings. While the last three are available to capitalists for accumulation, taxes are
collected by the government and used up in government consumption and investment;
they are a detraction of the profits susceptible of accumulation. The neoliberal
restructuring of the world economy as a consequence of the 1970s crisis brought about a
reduction in the tax burden on capitalist income, mainly in order to alleviate the falling
in the rate of profit and to recover the capitalist perceived profitability. The U.S.
government implemented a tax policy that cut the burden on profits from 52.3% in
1946-1973 to 46.1% in 1983-2009, that is, an 11.7% relative decrease. (Figure 6) While
indirect taxes were fundamentally unchanged (it increased their detraction from profits
from 32.4% to 33.1% in the mentioned periods), the tax reforms focused on corporate

12
taxes, which diminished their pressure on profits from 19.9% in 1946-1973 to 13.1% in
1983-2009.9
Figure 6. Tax burden on profits, different levels of aggregation.
United States, 1946-2009
40%
45%
50%
55%
60%
65%
70%
19
46
19
48
19
50
19
52
19
54
19
56
19
58
19
60
19
62
19
64
19
66
19
68
19
70
19
72
19
74
19
76
19
78
19
80
19
82
19
84
19
86
19
88
19
90
19
92
19
94
19
96
19
98
20
00
20
02
20
04
20
06
20
08
Business sector Corporate businesses Corporate nonfinancial sector Source: Cámara (2009a). The tax burden is calculated as the ratio between the sum of indirect taxes,
corporate taxes and business transfer payments, and total surplus value.
As a consequence, the after-tax profit rate of the corporate businesses and the
corporate nonfinancial businesses recovered from their previous tendential fall –as
opposed to the general rate of profit– and averaged almost the same during the
Keynesian and the neoliberal periods. However, the same did not happen with the rate
of accumulation, which averaged, respectively, 18.4% and 22.2% lower in relative
terms during the neoliberal period. Of course, the discrepancy is to be found in the
investment coefficient. Thus, a better measure of the investment effort of capitalists is
the ratio between net investment and after-tax profits. As Table 1 shows, the relative
decrease of the investment effort for the corporate business sector and the corporate
nonfinancial business sector is similar to the total economy one once the effect of
taxation is considered (-20.4% and -24.1%, respectively, compared to a -23.0%). More
importantly, the transformation of the accumulation trends between the Keynesian and
neoliberal periods are more manifest.
9 The NIPAs do not provide information on the taxes charged to the proprietors‟ and rental income of
self-employed, partnerships and unincorporated business, which conform the noncorporate business
sector. Therefore, the after-tax measures presented below do not deduct these taxes.

13
Table 1. Pre-tax and after-tax investment effort, different levels of aggregation.
United States, 1946-1973 and 1983-2009
Pre-tax investment effort After-tax investment effort
1946-
1973
1983-
2009
%
(relative)
1946-
1973
1983-
2009
%
(relative)
Business sector 17.2% 14.8% -13.9% 35.9% 27.7% -23.0%
Corporate business
sector 17.4% 17.1% -2.0% 48.8% 38.9% -20.4%
Corporate nonfinancial
business sector 17.6% 16.6% -6.1% 48.4% 36.7% -24.1%
Source: Cámara (2009a). The pre-tax investment coefficient is defined as the ratio between total
nonresidential net investment and total surplus value, while the after-tax investment coefficient is defined
as the ratio between total nonresidential net investment and total surplus value less indirect and corporate
taxes.
The transformed neoliberal accumulation regime is explained by the renewed
hegemony of finance, that is, the restoration of the power of capital as property (lending
and shareholding capital) with respect to capital as a function (industrial and
commercial capital).10
The financial hegemony has substantially transformed the
distribution of the after-tax profits among its components: retained earnings, dividends,
and net interest. (Figure 7) In a first instance, the rise of the nominal interest rates in
1979, aimed to curb inflation in order to protect the interest of the lending capital
without regard of the financial conditions of the productive investment of industrial
companies, intensified the growing tendency of the interest burden on profits that
initiated in the early 1970s. Thus, the net interest share in the after-tax profits rocketed
from an average of 9.9% in 1946-1973 to 31.0% in 1983-2009. In a second instance, the
increased power of the shareholding capital during the neoliberal period manifested in
an upsurge of the portion of corporate profits paid as dividends, especially since the
1990s. Thus, dividends represented 20.2% of after-tax profits in the Keynesian period,
but 29.1% in the neoliberal period. As a consequence, retained earnings –that is, the
portion of profits manifestly intended for accumulation– diminished its share in after-
tax profits from 70.0% to 39.9%. The propensity to invest productively the dividend and
the interest income is lower than the propensity to invest retained earnings, and that
appears to be the main explanation for the diminished overall investment effort.
10
Duménil and Lévy (2003) describe “a specific power configuration within capitalism, in which the
power and income of the upper fractions of ruling classes have been restored after a period of decline. It
can be described as a new financial hegemony.” (ibid: 2) It consists of an increase in the power of finance
–the upper fraction of the ruling classes and their institutions of power–, implemented through the
financial ownership of companies, that is, lending and shareholding capital. (ibid: 2-4)

14
Figure 7. Net interest, dividends and retained earnings.
United States, 1946-2009, % of after-tax profits
0%
10%
20%
30%
40%
50%
60%
70%
80%
90%
100%1
94
61
94
81
95
01
95
21
95
41
95
61
95
81
96
01
96
21
96
41
96
61
96
81
97
01
97
21
97
41
97
61
97
81
98
01
98
21
98
41
98
61
98
81
99
01
99
21
99
41
99
61
99
82
00
02
00
22
00
42
00
62
00
8
Net interest Dividends Retained earnings Source: Cámara (2009a).
2.3 A crisis of neoliberalism?
This section has characterized the structural dynamics of profitability and
accumulation in the postwar era, and particularly during neoliberalism, in order to
portray the structural context of the current crisis. On the one hand, it has been shown
that the last decades are characterized by a low general profitability as a consequence of
the materialization of the tendency of the profit rate to fall since the mid-1960s, and,
more importantly, the failure to recover the general rate of profit within the neoliberal
order. To this effect, the contribution of the technological component to this recovery
has been scarce, so the overaccumulation problem that led to the 1970s crisis is still
unresolved in the U.S. economy. Furthermore, the attack on real wages has proved
unsatisfactory for a recuperation of the rate of profit via income distribution. On the
other hand, the last decades are also depicted by the neoliberal regime of accumulation,
characterized by a diminished investment effort due to the restoration of the power of
finance (lending and shareholding capital) in relation to the productive (industrial and
commercial) capital.
As a result, neoliberalism is structurally characterized by weak conditions of
valorization and accumulation in the productive sphere. In addition, the Keynesian
15
preeminence of the productive sphere has given was way to the neoliberal financial
hegemony. Consequently, the neoliberal era can be viewed as a long wave of slow
economic growth. (Cámara and Mariña, 2010) This structural context has exacerbated
the crisis-prone nature of capitalism and has intensified macroeconomic instability. On
the one hand, the low general profitability has spurred the search of profits in the most
profitable productive sectors (information and communication technologies,
construction, etc.), which has provoked sectoral over-investment,11
and in non-
productive forms of valorization related to the finance and real estate, inherently
unstable. On the other hand, the economic authorities have been lenient, and also have
encouraged through economic policy, with the subsequent economic disequilibria
(private indebtedness, twin deficits, etc.) and bubbles formation (dot.com and housing
bubble).
In conclusion, it is possible to assert that the current crisis can be characterized
as a crisis of neoliberalism. The severity of the crisis and the meager structural
conditions, together with the absence of a candidate that may spark growth temporarily,
point to the need of a structural transformation of the capitalist economy; it is a
structural crisis of neoliberalism.
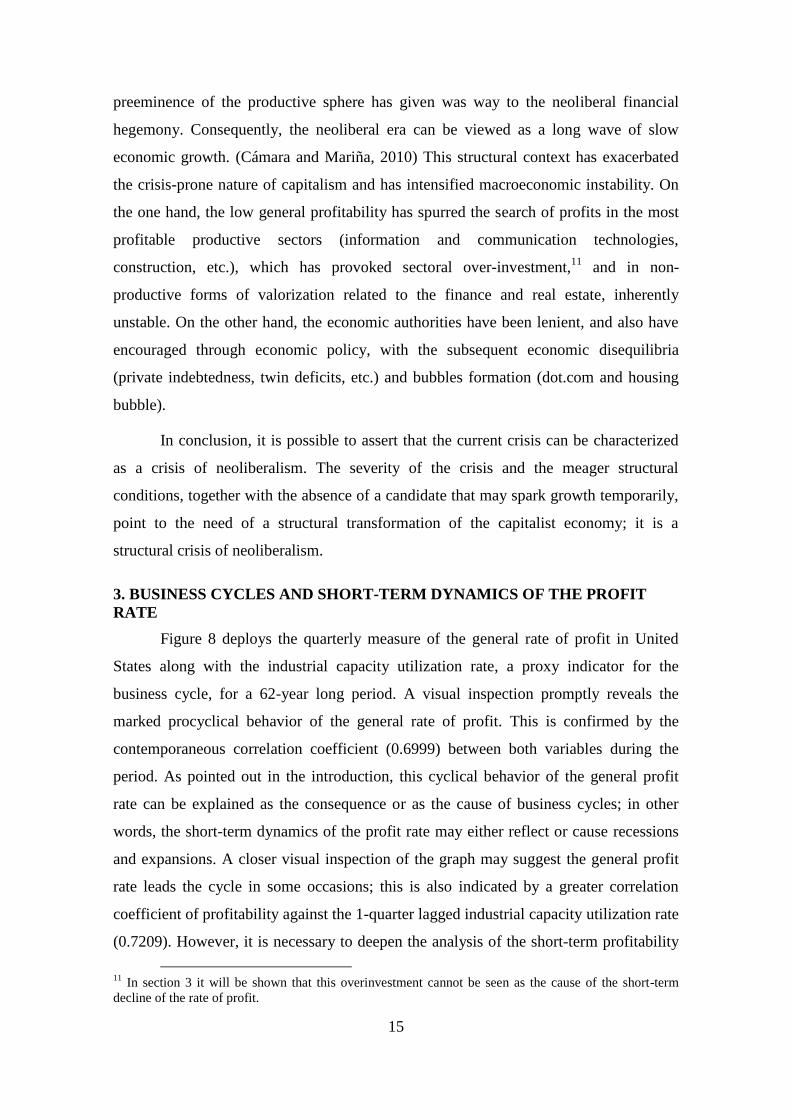
3. BUSINESS CYCLES AND SHORT-TERM DYNAMICS OF THE PROFIT
RATE
Figure 8 deploys the quarterly measure of the general rate of profit in United
States along with the industrial capacity utilization rate, a proxy indicator for the
business cycle, for a 62-year long period. A visual inspection promptly reveals the
marked procyclical behavior of the general rate of profit. This is confirmed by the
contemporaneous correlation coefficient (0.6999) between both variables during the
period. As pointed out in the introduction, this cyclical behavior of the general profit
rate can be explained as the consequence or as the cause of business cycles; in other
words, the short-term dynamics of the profit rate may either reflect or cause recessions
and expansions. A closer visual inspection of the graph may suggest the general profit
rate leads the cycle in some occasions; this is also indicated by a greater correlation
coefficient of profitability against the 1-quarter lagged industrial capacity utilization rate
(0.7209). However, it is necessary to deepen the analysis of the short-term profitability
11
In section 3 it will be shown that this overinvestment cannot be seen as the cause of the short-term
decline of the rate of profit.

16
dynamics to draw more solid conclusions. In the subsequent analysis, attention is paid
to the last 15 years, the 1995-2010 period, which encompasses the 2001 crisis as the
immediate antecedent of the current one.
Figure 8. Industrial capacity utilization rate and general rate of profit.
United States, 1948Q1-2010Q2
11%
13%
15%
17%
19%
21%
23%
25%
27%
68%
71%
74%
77%
80%
83%
86%
89%
92%
19
48
Q1
19
50
Q1
19
52
Q1
19
54
Q1
19
56
Q1
19
58
Q1
19
60
Q1
19
62
Q1
19
64
Q1
19
66
Q1
19
68
Q1
19
70
Q1
19
72
Q1
19
74
Q1
19
76
Q1
19
78
Q1
19
80
Q1
19
82
Q1
19
84
Q1
19
86
Q1
19
88
Q1
19
90
Q1
19
92
Q1
19
94
Q1
19
96
Q1
19
98
Q1
20
00
Q1
20
02
Q1
20
04
Q1
20
06
Q1
20
08
Q1
20
10
Q1
Industrial capacity utilization rate General profit rate
Source: Cámara (2009a),12
and Industrial Production and Capacity Utilization, Board of Governors of the
Federal Reserve System (FRS). The industrial capacity utilization rate is directly available since 1967,
and it is extrapolated backwards using the manufacturing capacity utilization rate. The industrial capacity
utilization rate is plotted in the left axis and the general rate of profit is plotted in the right axis.
3.1 From the 2001 crisis to the current one
The last two recessions of the U.S. economy that initiated in March 2001 and
December 2007, according to the Business Cycle Dating Committee of the National
Bureau of Economic Research, were preceded by a decline of the general rate of
profit.13
(Figure 9) In the late 1990s, the general rate of profit reached its peak level in
the third quarter of 1997, well before the beginning of the crisis, and bottomed in the
last quarter of 2001, at the end of it. The economic activity barely slowed in 1998-2000
according to the industrial capacity utilization rate; also, the growth of the capitalist
12
Cámara (2009a) describes the estimation methods only for annual data, but not for quarterly data, for
which a methodological document is pending. 13
This fact was first noted by Weisskopf (1979). Recently, Bakir and Campbell (2009: 336) have
confirmed that “profit rates fall before, and usually well before, the output contraction that constitutes a
recession.”

17
sphere of the economy only suffered a mild deceleration and kept a vigorous pace until
the 2001 crisis. In relative terms, the corporate businesses‟ and the corporate
nonfinancial businesses‟ general rates of profit plunged 25.5% and 30.4%, respectively,
from peak to trough. The general rate of profit recovered since the 2001 crisis until the
third quarter of 2006, when started to plunge again in the late-expansion period of the
business cycle, just over a year before the start of the current recession. The industrial
activity remained strong until the end of 2007, but the business sector gross value added
decelerated slightly since this quarter, before it plummeted in 2008. In relative terms,
the corporate businesses‟ and the corporate nonfinancial businesses‟ general rates of
profit plunged 32.3% and 27.4%, respectively, from peak to trough, which occurred in
the last quarter of 2008 and the second of 2009, respectively.
Figure 9. Industrial capacity utilization rate and general rate of profit, different
levels of aggregation.
United States, 1995Q1-2010Q2
13%
14%
15%
16%
17%
18%
19%
20%
21%
68%
70%
72%
74%
76%
78%
80%
82%
84%
19
95
Q1
19
95
Q3
19
96
Q1
19
96
Q3
19
97
Q1
19
97
Q3
19
98
Q1
19
98
Q3
19
99
Q1
19
99
Q3
20
00
Q1
20
00
Q3
20
01
Q1
20
01
Q3
20
02
Q1
20
02
Q3
20
03
Q1
20
03
Q3
20
04
Q1
20
04
Q3
20
05
Q1
20
05
Q3
20
06
Q1
20
06
Q3
20
07
Q1
20
07
Q3
20
08
Q1
20
08
Q3
20
09
Q1
20
09
Q3
20
10
Q1
Industrial capacity utilization rate
Coporate businesses' general rate of profit
Coporate nonfinancial businesses' general rate of profit
Source: Cámara (2009a), and Industrial Production and Capacity Utilization, Board of Governors of the
Federal Reserve System (FRS). The industrial capacity utilization rate is plotted in the left axis and the
general rate of profit is plotted in the right axis.
In order to establish a stronger relation between the profitability dynamics and
the business cycle, it is necessary to examine more concrete measures of profitability,
given that the general rate of profit is not necessarily the most appropriate measure of

18
profitability when analyzing the short-term business fluctuations. The after-tax rate of
profit is an adequate first approximation, given that fiscal policy is a powerful tool of
economic authorities for implementing anticyclical policies. However, the after-tax
profitability measure shows just about the same behavior; first, the peaks and troughs of
the after-tax rates of profit are identical; second, although the fall in the rate of profit
moderates in absolute terms (3.4% and 3.9% versus 5.2% and 6.0%, respectively, in the
Clinton business cycle; and 3.5% and 2.3% versus 6.4% and 5.1%, respectively, in the
Bush business cycle), it deepens in relative terms (34.6% and 41.0% in the 1990s, and
37.8% and 27.5% in the 2000s).
As a consequence, it is possible to conclude that fiscal policy was rather
ineffective in the mitigation of the profitability pressures to corporations in the last two
business cycles. As a matter of fact, the reduction of the fiscal burden on corporate
profits was virtually offset by the relative increase in indirect taxes. Table 2 shows the
tax burden in relation to profits and its decomposition between direct and indirect taxes.
It is noteworthy that the overall tax burden increased in both cycles –especially in the
Clinton one–, so contributing a further fall in the rates of profit; thus, it explains 17.2%
and 13.5% of the corporate sector and corporate nonfinancial sector, respectively, fall in
the after-tax rate of profit during the Clinton business cycle, and 8.0% and 0.1%,
respectively, during the Bush business cycle.
Table 2. Tax burden on profits, different levels of aggregation.
United States, Clinton and Bush business cycles
Corporate sector Corporate nonfinancial sector
Total
Corporate
taxes
Indirect
taxes Total
Corporate
taxes
Indirect
taxes
Clinton
business
cycle
Peak 51.9% 19.0% 33.0% 51.2% 14.7% 36.5%
Trough 57.8% 13.9% 44.0% 58.6% 8.8% 49.8%
Bush
business
cycle
Peak 53.2% 22.4% 30.8% 54.9% 18.1% 36.8%
Trough 57.0% 12.8% 44.2% 54.9% 10.3% 44.6%
Source: Cámara (2009a). The total tax burden is calculated as the ratio between the sum of corporate
taxes, on the one side, and indirect taxes and business transfer payments, on the other side, and total
surplus value. The peak and trough for the Clinton business cycle correspond to the third quarter of 1996
and the fourth quarter of 2001, respectively. The peak for the Bush business cycle corresponds to the third
quarter of 2006, while the trough corresponds to the fourth quarter of 2008 for the corporate sector and to
the second quarter of 2009 for the corporate nonfinancial sector.

19
While a cyclical fall in profitability precedes the last two recessions, there are
striking differences to be remarked. First, the lead in the fall during the Bush business
cycle is of 14 quarters, while the lead in the Bush cycle is only 5 quarters. Therefore, the
similar absolute and relative profitability fall in the last cycle took place in a much
shorter period, was steeper. Second, the trough in the profit rate in the Bush cycle was
reached two quarters later for the corporate nonfinancial sector measure, indicating a
quicker recovery of the productive profits made in the financial sector. This may be
related with the greater financial and banking component of the current recession, as
well as with the rescue package of the last quarter of 2008, that dealt fundamentally
with the financial system. Finally, it is most striking that the trough of the Bush business
cycle profit rate was reached, at a not so low value, similar to the 2001 and 1980-2 low
values of the rates of profit, given the severity of the current recession; and at a very
soon point in time, considering that the profit rate normally regains an upward path at
the beginning of the expansion, though this second point could be explained by a not so
long as expected recession given the vigorous policy response or by a transitory
profitability recovery that would soon vanish in the likely event of a second slump,
configuring a double-dip recession. Related to it, it is also striking that the upturn of the
profit rate has been quite sharp in spite of the mild economic recovery, which may point
to the strength shown by the capital class in relation to labor in the class struggle for the
configuration of the crisis exit policies.14
3.2 Short-term distribution and profitability dynamics
Weisskopf (1979) pioneered the short-term empirical analysis of the rate of
profit. In his work, he proposed an analytical framework (Weisskopf, 1978) suitable to
discern the forces that drive the fluctuations of the rate of profit along the business
cycles, where the rate of profit can be decomposed into the profit share (P/Y), the
capacity utilization ratio (Y/Y*), and the potential productivity of capital (Y*/K), where
Y* is the potential new value:
K
Y
Y
Y
Y
P
K
P *
*
14
These points do not favor the prognosis advanced by Bakir and Campbell (2009, section III) about the
likely cyclical behavior of the profit rates in United States in the aftermath of the last recession.

20
The rising organic composition variant (ROC) explanation, associated to the
over-investment theory of crisis, the rising strength of labor variant (RSL) explanation,
related to the profit squeeze theory of crisis, and the realization failure variant (RF)
explanation, related to the underconsumption theory of crisis, would be supported by a
reduction of the potential productivity of capital, profit share and capacity utilization
ratio, respectively. His empirical investigation, as well as recent one (Bakir and
Campbell, 2006), concluded that most of the short-term fluctuations of the profit rate
were explained by the profit share component. This conclusion can be extended for the
last two business cycles, the different measures of profitability, and the different levels
of aggregation, as Figure 10 and Table 3 show.
Figure 10. Profit share, capacity utilization rate and the potential productivity of
capital, corporate business sector.
United States, 1995Q1-2010Q2
65%
68%
71%
74%
77%
80%
83%
86%
89%
24%
25%
26%
27%
28%
29%
30%
31%
32%
19
95
Q1
19
95
Q3
19
96
Q1
19
96
Q3
19
97
Q1
19
97
Q3
19
98
Q1
19
98
Q3
19
99
Q1
19
99
Q3
20
00
Q1
20
00
Q3
20
01
Q1
20
01
Q3
20
02
Q1
20
02
Q3
20
03
Q1
20
03
Q3
20
04
Q1
20
04
Q3
20
05
Q1
20
05
Q3
20
06
Q1
20
06
Q3
20
07
Q1
20
07
Q3
20
08
Q1
20
08
Q3
20
09
Q1
20
09
Q3
20
10
Q1
Profit share Potential productivity of capital Capacity utilization rate
Source: Cámara (2009a). The capacity utilization rate is assumed to be equal to the industrial capacity
utilization rate provided by the Industrial Production and Capacity Utilization, Board of Governors of the
Federal Reserve System (FRS). Shaded areas correspond with the periods of decline of the general rate of
profit of the corporate sector. The profit share is plotted in the left axis, and the capacity utilization rate
and the potential productivity of capital are plotted in the right axis.
During the Clinton business cycle, the fall in the general rate of profit (-5.18%,
in absolute terms) of the corporate business sector was explained mostly by the fall in
the profit share (-6.68%), while the negative contribution of the decline in the capacity
utilization rate was minor (-2.80%) and the potential productivity of capital had a

21
positive contribution (1.30%). As shown in the graph, similar conclusions (on the
opposite directions) can be drawn for the subsequent recovery. During the Bush
business cycle, the short-term profitability dynamics are alike, except for a slight
negative contribution of the potential productivity of capital. The after-tax rate of profit
dynamics is also mostly explained by the „modified‟ profit share in both cycles; the only
remarkable fact is that the utilization capacity rate plays a more important role in the
nonfinancial corporations‟ measure.
Table 3. Absolute fall of the rate of profit, the profit share, the capacity utilization
rate and the potential productivity of capital, different levels of aggregation.
United States, Clinton and Bush business cycles
Clinton business cycle Bush business cycle
P/K P/Y Y/Y* Y*/K P/K P/Y Y/Y* Y*/K
General
rate of
profit
Corporate sector -5.18 -6.68 -2.80 1.30 -6.44 -3.35 -1.86 -1.24
Corporate
nonfinancial sector -6.00 -4.24 -2.65 0.89 -5.12 -2.97 -2.21 0.07
After-
tax rate
of profit
Corporate sector -3.38 -2.69 -1.28 0.60 -3.53 -2.16 -0.82 -0.55
Corporate
nonfinancial sector -3.95 -3.13 -1.24 0.42 -2.32 -1.09 -1.25 0.03
Source: Cámara (2009a). The capacity utilization rate is assumed to be equal to the industrial capacity
utilization rate provided by the Industrial Production and Capacity Utilization, Board of Governors of the
Federal Reserve System (FRS). The fall in the rate of profit for the Clinton business cycle goes from the
third quarter of 1996 to the fourth quarter of 2001. The fall in the rate of profit for the Bush business
cycle goes from the third quarter of 2006 to the fourth quarter of 2008, for the corporate sector, and to the
second quarter of 2009, for the corporate nonfinancial sector. The profit share component of the after-tax
rate of profit is defined as the ratio of after-tax profits and the new value net of taxes.
In conclusion, both the underconsumption and, specially, the overinvestment
theses can be ruled out as the main explanations of the cyclical behavior of the rate
profit. Rather, it is the profit share dynamics that exerts a downward and upward
pressure on profitability, configuring the profit rate business cycles. Bakir and Campbell
(2006) confirmed Weisskopf (1979) results arguing that the profit share fall during the
Keynesian business cycles were caused by the greater increase of real wages than
productivity, while the effect of relative price changes had a less significant
contribution. Also, they found that the drop in the profit share in the neoliberal business
cycles is essentially explained by the effect of relative price changes, being it a specific
feature of neoliberalism associated to the diminished class power of labor.
A last word should be said about the recent recovery in the profit rate. As shown
in Figure 10, the upturn of the profit rate has been lead –both in time and importance–

22
by the abrupt profit share increase, starting as soon as the first quarter of 2009. Again,
this stands as a proof of the weak power of the working class in the class struggle for the
configuration of the exit crisis economic policies.
3.3 Interest rate and profit rate cycles
Another instrument of anticyclical economic policy that impacts the perceived
profitability of capitalist businesses is the monetary policy and, specifically, the interest
rate fixation by the monetary authorities. Business finance from bank loans and
corporate bonds, while they invest in financial instruments excess cash and retained
earnings; the net interest paid is seen then as a detraction of profits. This instrument
seems of great importance in the last business cycles, as the sharp drop of interest rates
during the 2001 crisis that fed the housing bubble contributed to the economic recovery,
and the increase in interest rates since 2004 contributed to the slowdown and burst of
the housing bubble that deepened the effects of the cyclical recession. (Cámara and
Mariña, 2010) As a matter of fact, the cyclical movements of the profit rate have shaped
drastically the evolution of the interest burden on profits since 2001.15
(Figure 11)
Figure 11. Interest burden and short-term interest rate, different levels of
aggregation.
United States, 1995Q1-2010Q2
0%
1%
2%
3%
4%
5%
6%
7%
5%
11%
17%
23%
29%
35%
41%
47%
19
95
Q1
19
95
Q3
19
96
Q1
19
96
Q3
19
97
Q1
19
97
Q3
19
98
Q1
19
98
Q3
19
99
Q1
19
99
Q3
20
00
Q1
20
00
Q3
20
01
Q1
20
01
Q3
20
02
Q1
20
02
Q3
20
03
Q1
20
03
Q3
20
04
Q1
20
04
Q3
20
05
Q1
20
05
Q3
20
06
Q1
20
06
Q3
20
07
Q1
20
07
Q3
20
08
Q1
20
08
Q3
20
09
Q1
20
09
Q3
20
10
Q1
Corporate businesses Corporate nonfinancial businesses Short-term interest rate Source: Cámara (2009a). The short-term profit rate corresponds to the market yield on U.S. Treasury
securities at 3-month constant maturity, from the Selected Interest Rates provided by the Industrial
15
Actually, there is a six-quarter lag of both measures of interest burden in relation of the short-term
interest rate, according to the correlation coefficients.

23
Production and Capacity Utilization, Board of Governors of the Federal Reserve System (FRS). The
interest burden is defined as the ratio between net interests paid and after-tax profits. The interest burden
is plotted in the left axis, and the short-term profit rate is plotted in the right axis.
The rapid and sharp response of the Federal Reserve to the 2001 crisis lowering
the federal funds rate had an immediate effect on short-term interest rates, which caused
an outstanding decline of the interest burden on corporate after-tax profits (a 26.0%
absolute reduction for corporate businesses and a 23.4% for corporate nonfinancial
businesses, which is itself explained by a decline in the net interest paid of 72.6% and
15.7% in relative terms). Certainly, it played a role in the recovery of the corporations‟
net profitability. Nevertheless, the rise of the reference interest rates since the last half
of 2004, and accelerated in 2005 and 2006 caused exactly the reverse effect. Thus, the
interest burden in both levels of aggregation grew 38.0% and 18.6% in absolute terms,
respectively. Undoubtedly, it added to the already falling general and after-tax
profitability
3.4 The profit rate fluctuations and the business cycle: cause or consequence?
Besides the procyclical behavior of the profit rate, this section has shown that a
significant cyclical decline of the profit rate have substantially preceded the last two
recessions. This is strong evidence to support the role of the profit rate as a precipitating
factor of both recessions. One the one hand, the decline in the profit share, presumably
explained by unfavorable to capital relative price dynamics, generated an abrupt
descend in the general and after-tax rate of profit that lead to the current crisis. On the
other hand, the increase in the interest rates in the 2004-2006 period incremented
heavily the interest burden on profits, exerting more downward pressure on net
profitability. Of course, one cannot ignore other precipitating factors of the crisis related
to this cyclical dynamics; for instance, the drop in interest rates since 2001 not only
alleviated the profitability pressures, but also provoked the demand-led stimulus
associated to the housing bubble, and the reverse happened with the subsequent rise.
Nonetheless, the cyclical slump of the rate of profit must be seen as an important
precipitating factor of the deepest economic downturn in the U.S. since the 1930s.
4. CONCLUSIONS
The paper has shown that profitability plays an important role in the advent of
the current crisis both in the long and the short-term. In the long-term perspective, an
explanation of the crisis related to the tendential fall of the rate of profit was ruled out,

24
given that it has a slight recovery in the last decades. Nonetheless, the neoliberal era is
also characterized by a failure to recover the average level of the rate of profit to the
Keynesian standards. Besides low profitability, neoliberalism features an inhibition of
productive accumulation, which further jeopardizes economic growth. In the short-term
perspective, the cyclical decline of the profit rate, caused by the distributive component,
was a precipitating factor of the current crisis. In addition, the cyclical movements of
the interest rate imposed a greater drain on profits, worsening the net profitability
conditions of capitalist businesses.
BIBLIOGRAPHY
Astarita, Rolando (2009), “La tasa de ganancia y las crisis en el análisis marxista”,
Unpublished manuscript, August 2009. Available at
http://rolandoastarita.com/novDebate%20teoria%20marxista%20de%20la%20crisis.
htm [Last accessed in August 9, 2010]
Bakir, Erdogan and Al Campbell (2006), “The Effect of Neoliberalism on the Fall in the
Rate of Profit in Business Cycles”, Review of Radical Political Economics, vol. 38,
num., 3, summer, pp. 365-373.
___________ (2009), “The Bush Business Cycle Profit Rate: Support in a Theoretical
Debate and Implications for the Future”, Review of Radical Political Economics,
vol. 41, num., 3, summer, pp. 335-342.
Cámara, Sergio (2009a), “Construction of Series for the Long-Run Analysis of the U.S.
Economy. Profitability, Technology of Production and Income Distribution”,
Reporte de investigación No. SAEC012, Departamento de Economía, División de
Ciencias Sociales y Humanidades, Universidad Autónoma Metropolitana-
Azcapotzalco, Mexico.
___________(2009b), “Reestructuración y crisis neoliberal. Una perspectiva desde Estados
Unidos”, paper presented at the V Coloquio Internacional de SEPLA, Sao Paulo,
Brazil, June 11-12.
___________(2010), “Producción, explotación, acumulación y reproducción. Un modelo
macroeconómico básico de la teoría laboral del valor”, in Mateo (ed.), Otra teoría
económica es posible. Ensayos críticos de economía política, Editorial Popular,
Madrid, Spain, forthcoming.
Cámara, Sergio and Abelardo Mariña (2010), “Naturaleza y perspectivas de la actual crisis:
una caracterización marxista de largo plazo”, Política y Cultura, Universidad
Autónoma Metropolitana-Azcapotzalco, num. 34, forthcoming.
Carchedi, Guglielmo (2009), “The Return from the Grave, or Marx and the Current Crisis”,
Unpublised manuscript, Amsterdam, Netherlands. Available at
http://www.scribd.com/doc/17174428/Carchedi-G-Return-From-the-Grave. [Last
accessed in September 20, 2009]
Duménil, Gérard, Glick, Mark and José Rangel (1987), “The Rate of Profit in the United
States”, Cambridge Journal of Economics, vol. 11, num. 4, pp. 331-360.

25
Duménil, Gérard y Dominique Lévy (2003). “Neoliberal Dynamics, Imperial Dynamics”,
EconomiX, PSE: Paris. Available at http://www.jourdan.ens.fr/levy/dle2003f.pdf.
[Last accesed in April 30, 2009]
___________ (2004a), “"The Nature and Contradictions of Neoliberalism", in Panitch,
Leys, Zuegue, Konings (eds.), The Globalization Decade. A Critical Reader, Merlin
Press, Fernwood Publishing, London, United Kingdom, pp. 245-274.
___________ (2004b), “Neoliberal Income Trends. Wealth, Class and Ownership in the
USA”, in New Left Review, vol. 30, pp. 105-33.
Harman, Chris (2009), “The slump of the 1930s and the crisis today”, International Socialist
Journal, num. 127. Available at http://www.isj.org.uk/index.php4?id=506&issue=121
[Last accessed in August 12, 2010]
Howard, Michael C. and John E. King, (1992), A history of marxian economics: Volume II,
1929-1990. Princeton University Press, Princeton, New Jersey, United States.
Kliman, Andrew (2009), “The Persistent Fall in Profitability Underlying the Current Crisis:
New Temporalist Evidence”, Unpublished manuscript, 106 pp. Available at
http://akliman.squarespace.com/storage/Persistent%20Fall%20whole%20primo%20
10.17.09.pdf [Last accessed in August 9, 2010]
Moseley, Fred (1991), The falling rate of profit in the post-war United States economy.
Macmillan Press, London, United Kingdom, 1992.
Shaikh, Anwar (1992), “The falling rate of profit as the cause of long waves: theory and
evidence”, in Kleinknecht, Mandel and Wallerstein (eds.), New findings in long wave
research. St. Martin‟s Press, New York, United States, pp. 174-195.
Weisskopf, Thomas E. (1978), “Marxist perspectives on cyclical crises”, in U.S. capitalism
in crisis, Union for Radical Political Economics (ed.), Union for Radical Political
Economics, New York, United States, pp. 241-60.
___________ (1979), “Marxian crisis theory and the rate of profit in the postwar U.S.
economy”, Cambridge Journal of Economics, vol. 3, num. 4, pp. 341-378.