short and sweet?: job quality in temporary work chris forde and gary slater leeds university...
Post on 21-Dec-2015
213 views
TRANSCRIPT

Short and sweet?: Job Quality in Temporary Work
Chris Forde and Gary SlaterLeeds University Business School and
University of Bradford
Prepared for presentation at University of Sheffield Economics Department Seminar Series, 30th May 2007

Background
EU directives on non-standard employment• fixed-term contract (UK: 2002)• temporary agency work (EC proposed 2002; stalled)
Concerns over the quality of jobs in terms of pay and conditions (equal treatment principle)
Recent focus in UK on agency working in particular:• government resistance• large market for temporary employment agencies• fivefold increase in agency working 1984-2000• previous studies not able to examine agency work separately
(e.g. Booth et al. 2002)
Key questions: 1. Who takes temporary jobs?2. What is the quality of temporary jobs?- what are they worth?- non-monetary aspects of quality: anxiety, effort, work strain, satisfaction
3. Is there a case for extending regulation to agency workers?

Structure of presentation
Temporary work in theory• characteristics and rewards
A note on wage estimation Data sources Comparative analysis: characteristics & pay Non-monetary aspects of job quality Comparative analysis: job quality Summary and conclusions

Temporary working in theory
1. Who takes temporary jobs?
Temporary labour as a buffer: ‘voluntary sorting’ in labour market
• attractive to those with weak attachment• young, singles, women, older workers more likely• i.e. do not want to invest in firm-specific training
Agency workers in particular may be used as a screening device; reduce costs of hiring ‘risky’ workers (Houseman et al, 2003)
• association between agency work and disadvantaged labour market groups and those with poor work histories
Industry emphasises role of agency working in assisting labour market ‘outsiders’
Temporary working in theory (2)
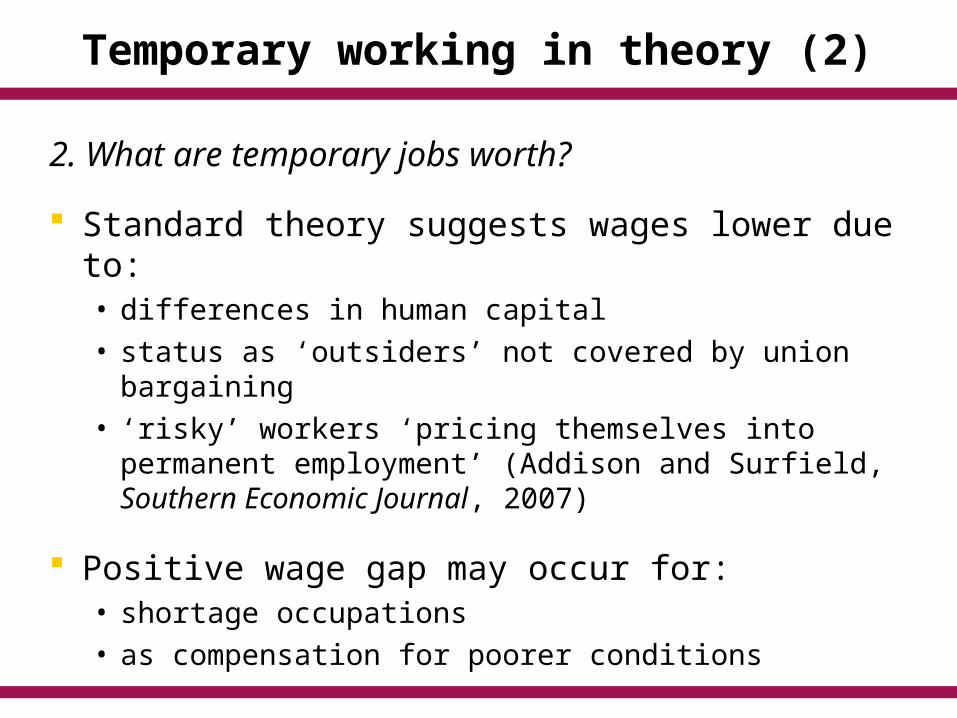
2. What are temporary jobs worth?
Standard theory suggests wages lower due to:• differences in human capital• status as ‘outsiders’ not covered by union bargaining• ‘risky’ workers ‘pricing themselves into permanent
employment’ (Addison and Surfield, Southern Economic Journal, 2007)
Positive wage gap may occur for:• shortage occupations• as compensation for poorer conditions
Previous research
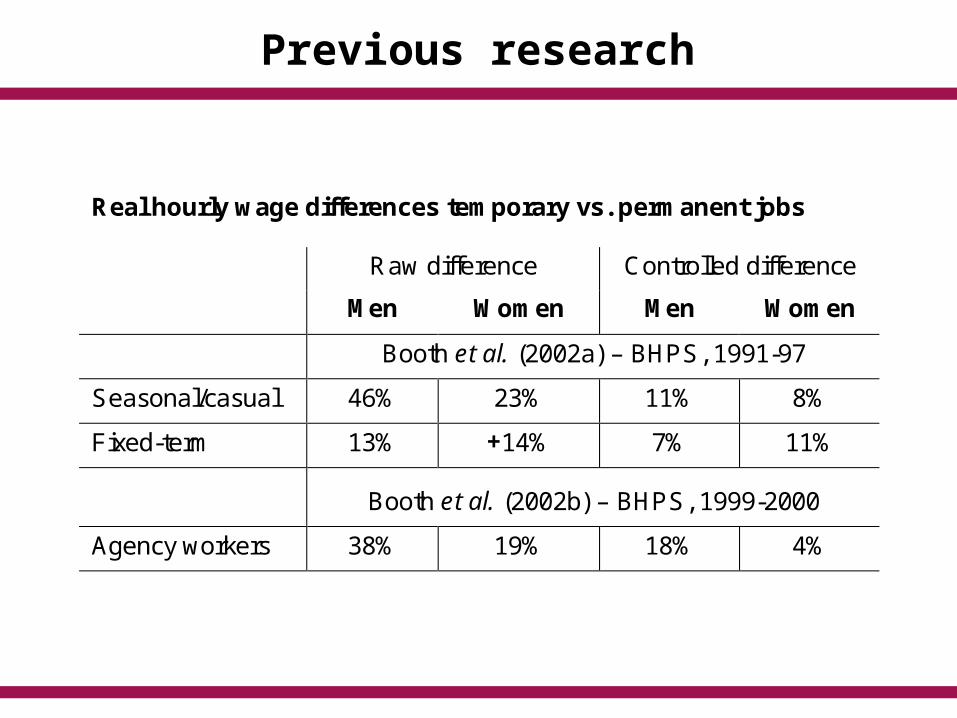
Real hourly wage differences temporary vs. permanent jobs
Raw difference Controlled difference
Men Women Men Women
Booth et al. (2002a) – BHPS, 1991-97
Seasonal/casual 46% 23% 11% 8%
Fixed-term 13% +14% 7% 11%
Booth et al. (2002b) – BHPS, 1999-2000
Agency workers 38% 19% 18% 4%
Wage estimation
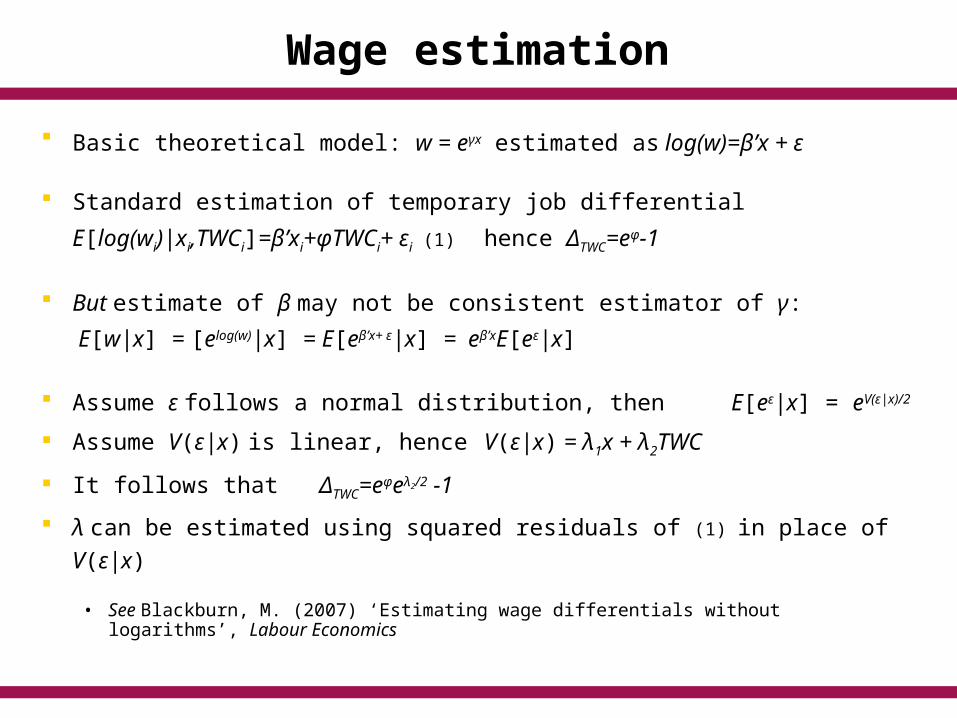
Basic theoretical model: w = eγx estimated as log(w)=β’x + ε
Standard estimation of temporary job differential
E[log(wi)|xi,TWCi]=β’xi+φTWCi+ εi (1) hence ΔTWC=eφ-1
But estimate of β may not be consistent estimator of γ:
E[w|x] = [elog(w)|x] = E[eβ’x+ ε|x] = eβ’xE[eε|x]
Assume ε follows a normal distribution, then E[eε|x] = eV(ε|x)/2
Assume V(ε|x) is linear, hence V(ε|x) = λ1x + λ2TWC
It follows that ΔTWC=eφeλ2/2 -1
λ can be estimated using squared residuals of (1) in place of V(ε|x)
• See Blackburn, M. (2007) ‘Estimating wage differentials without logarithms’, Labour Economics
OLS estimates of error dependence
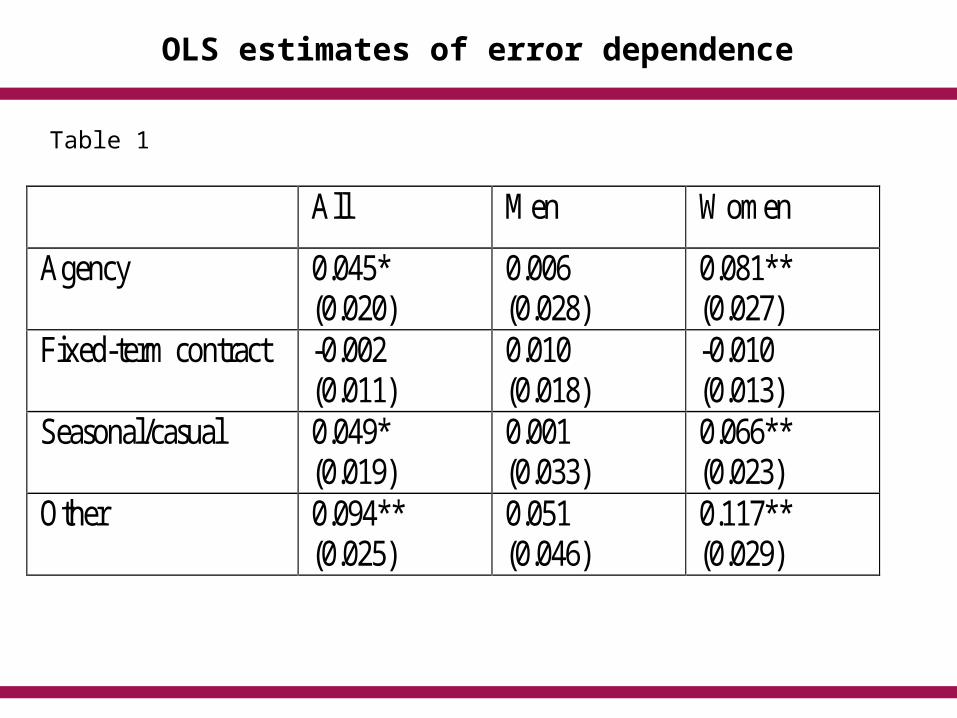
Table 1
All Men Women
Agency 0.045* (0.020)
0.006 (0.028)
0.081** (0.027)
Fixed-term contract -0.002 (0.011)
0.010 (0.018)
-0.010 (0.013)
Seasonal/casual 0.049* (0.019)
0.001 (0.033)
0.066** (0.023)
Other 0.094** (0.025)
0.051 (0.046)
0.117** (0.029)

Data sources
UK Labour Force Survey
• administered quarterly to a sample of 60,000 households• Spring 2006 LFS used to examine who takes agency jobs• short panel element to LFS• longitudinal five-quarter datasets from Spring 2001 to Spring 2005
pooled to examine wages
Working in Britain 2000• cross-section of 2,466 working individuals aged 20-59/64• large range of questions on non-monetary aspects of job quality • work status questions identical to LFS
Both focus on contract status of employees

Table 2: Temporary employment in Britain (employees, Spring 2006, Labour Force Survey)
Number Proportion of temporary employment
Proportion of total employment
Temporary agency employees
244,930 18.9 1.0
Fixed-term contract employees
603,443 46.6 2.6
Seasonal/casual employees
301,385 23.3 1.3
Other temporary employees
145,997 11.3 0.6
All temporary employees
1,295,735 100 5.5
Permanent employees
22,368,214 - 94.5
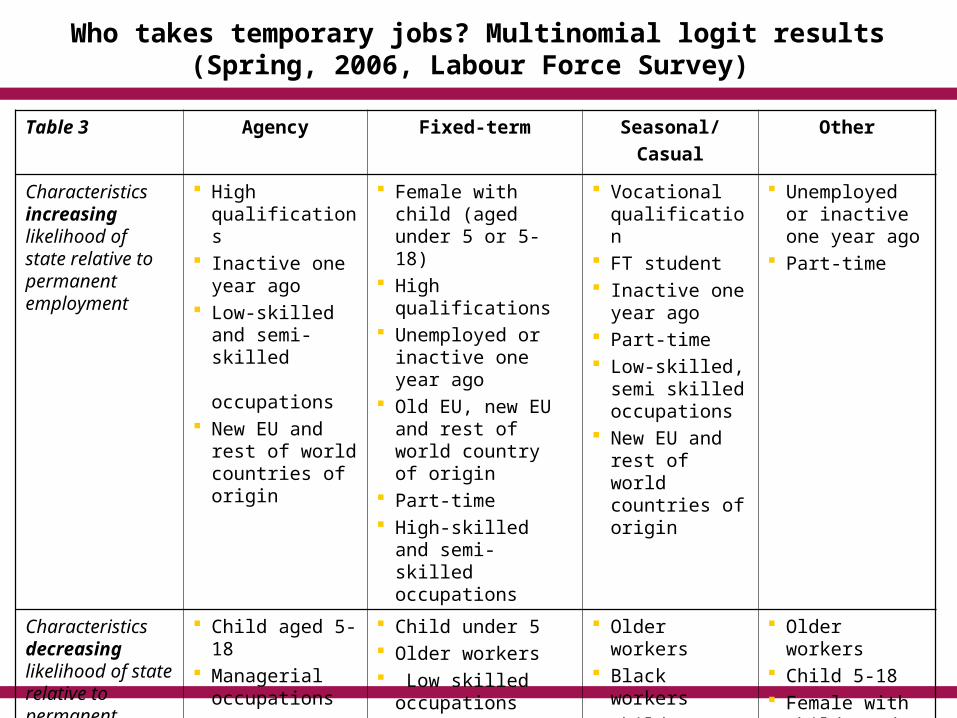
Who takes temporary jobs? Multinomial logit results (Spring, 2006, Labour Force Survey)
Table 3 Agency Fixed-term Seasonal/
Casual
Other
Characteristics increasing likelihood of state relative to permanent employment
High qualifications
Inactive one year ago
Low-skilled and semi-skilled occupations
New EU and rest of world countries of origin
Female with child (aged under 5 or 5-18)
High qualifications Unemployed or
inactive one year ago Old EU, new EU and
rest of world country of origin
Part-time High-skilled and
semi-skilled occupations
Vocational qualification
FT student Inactive one
year ago Part-time Low-skilled,
semi skilled occupations
New EU and rest of world countries of origin
Unemployed or inactive one year ago
Part-time
Characteristics decreasing likelihood of state relative to permanent employment
Child aged 5-18 Managerial
occupations
Child under 5 Older workers Low skilled
occupations
Older workers Black workers Child 5-18 Married Managerial
occupations
Older workers Child 5-18 Female with
child (under 5 or aged 5-18)
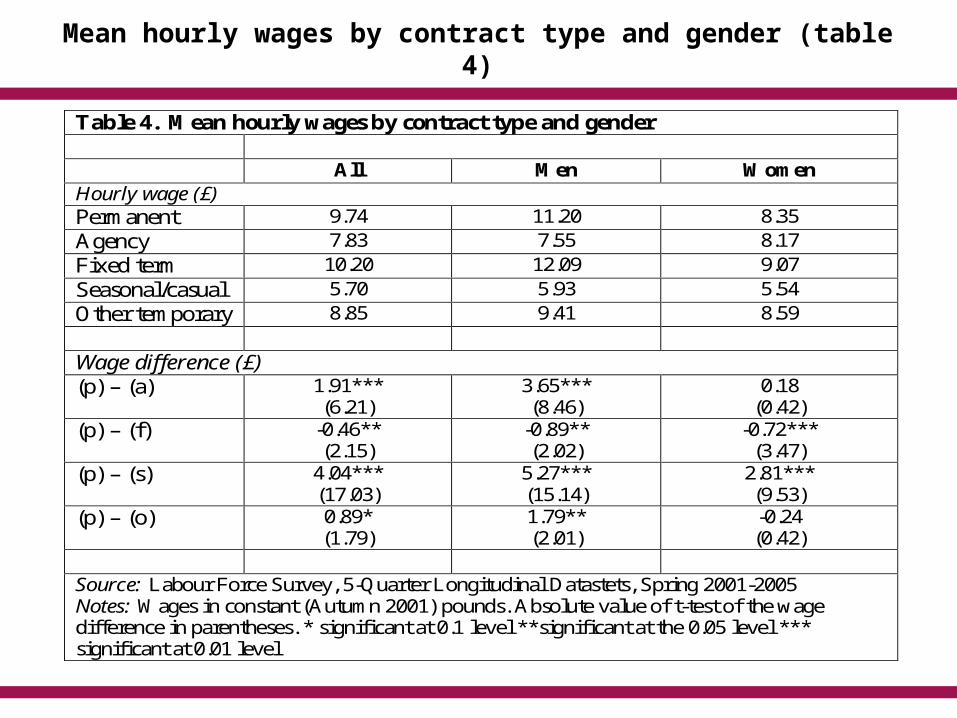
Mean hourly wages by contract type and gender (table 4)
Table 4. Mean hourly wages by contract type and gender All Men Women Hourly wage (£) Permanent 9.74 11.20 8.35 Agency 7.83 7.55 8.17 Fixed term 10.20 12.09 9.07 Seasonal/casual 5.70 5.93 5.54 Other temporary 8.85 9.41 8.59 Wage difference (£) (p) – (a) 1.91***
(6.21) 3.65*** (8.46)
0.18 (0.42)
(p) – (f) -0.46** (2.15)
-0.89** (2.02)
-0.72*** (3.47)
(p) – (s) 4.04*** (17.03)
5.27*** (15.14)
2.81*** (9.53)
(p) – (o) 0.89* (1.79)
1.79** (2.01)
-0.24 (0.42)
Source: Labour Force Survey, 5-Quarter Longitudinal Datastets, Spring 2001-2005 Notes: Wages in constant (Autumn 2001) pounds. Absolute value of t-test of the wage difference in parentheses. * significant at 0.1 level **significant at the 0.05 level *** significant at 0.01 level
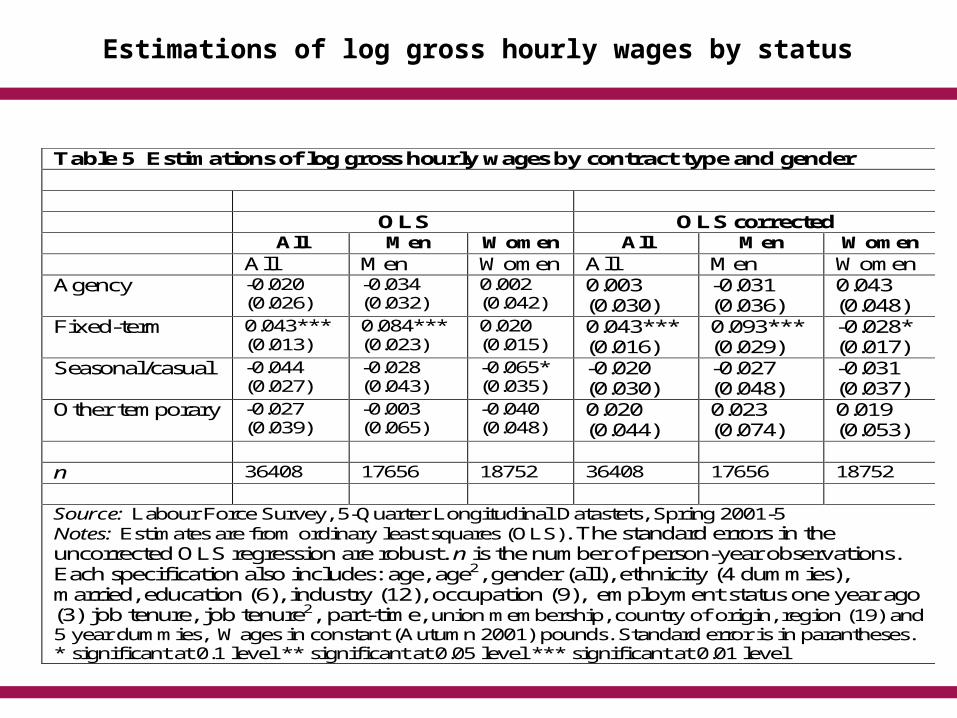
Estimations of log gross hourly wages by status
Table 5 Estimations of log gross hourly wages by contract type and gender
OLS OLS corrected All Men Women All Men Women All Men Women All Men Women Agency -0.020
(0.026) -0.034 (0.032)
0.002 (0.042)
0.003 (0.030)
-0.031 (0.036)
0.043 (0.048)
Fixed-term 0.043*** (0.013)
0.084*** (0.023)
0.020 (0.015)
0.043*** (0.016)
0.093*** (0.029)
-0.028* (0.017)
Seasonal/casual -0.044 (0.027)
-0.028 (0.043)
-0.065* (0.035)
-0.020 (0.030)
-0.027 (0.048)
-0.031 (0.037)
Other temporary -0.027 (0.039)
-0.003 (0.065)
-0.040 (0.048)
0.020 (0.044)
0.023 (0.074)
0.019 (0.053)
n 36408 17656 18752 36408 17656 18752 Source: Labour Force Survey, 5-Quarter Longitudinal Datastets, Spring 2001-5 Notes: Estimates are from ordinary least squares (OLS). The standard errors in the uncorrected OLS regression are robust. n is the number of person-year observations. Each specification also includes: age, age2, gender (all), ethnicity (4 dummies), married, education (6), industry (12), occupation (9), employment status one year ago (3) job tenure, job tenure2, part-time, union membership, country of origin, region (19) and 5 year dummies, Wages in constant (Autumn 2001) pounds. Standard error is in parantheses. * significant at 0.1 level ** significant at 0.05 level *** significant at 0.01 level
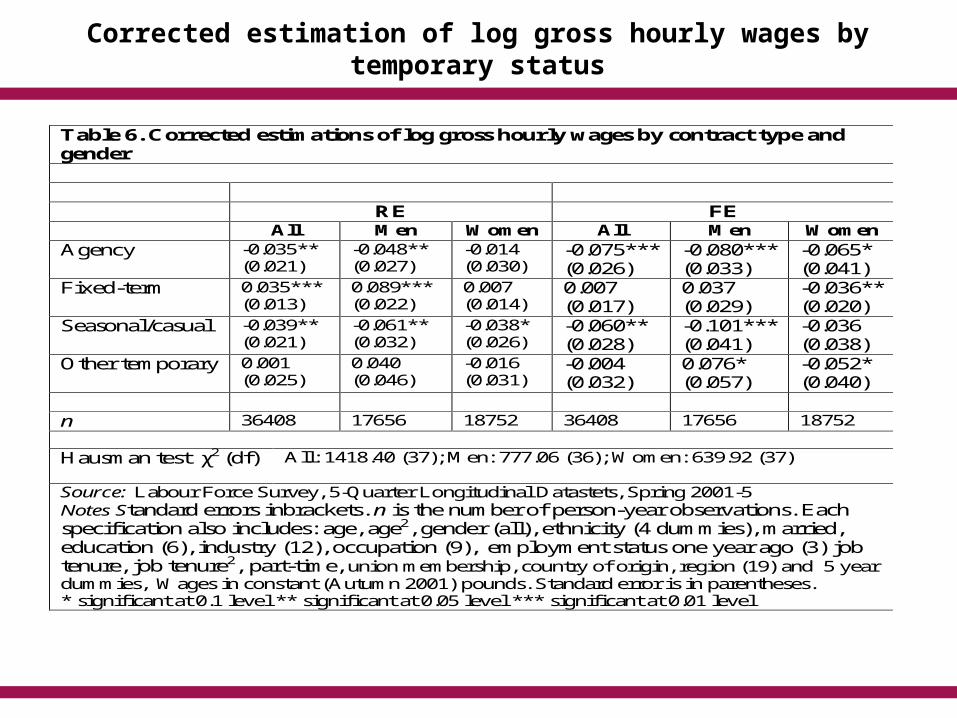
Corrected estimation of log gross hourly wages by temporary status
Table 6. Corrected estimations of log gross hourly wages by contract type and gender
RE FE All Men Women All Men Women Agency -0.035**
(0.021) -0.048** (0.027)
-0.014 (0.030)
-0.075*** (0.026)
-0.080*** (0.033)
-0.065* (0.041)
Fixed-term 0.035*** (0.013)
0.089*** (0.022)
0.007 (0.014)
0.007 (0.017)
0.037 (0.029)
-0.036** (0.020)
Seasonal/casual -0.039** (0.021)
-0.061** (0.032)
-0.038* (0.026)
-0.060** (0.028)
-0.101*** (0.041)
-0.036 (0.038)
Other temporary 0.001 (0.025)
0.040 (0.046)
-0.016 (0.031)
-0.004 (0.032)
0.076* (0.057)
-0.052* (0.040)
n 36408 17656 18752 36408 17656 18752 Hausman test χ2 (df) All: 1418.40 (37); Men: 777.06 (36); Women: 639.92 (37)
Source: Labour Force Survey, 5-Quarter Longitudinal Datastets, Spring 2001-5 Notes Standard errors inbrackets. n is the number of person-year observations. Each specification also includes: age, age2, gender (all), ethnicity (4 dummies), married, education (6), industry (12), occupation (9), employment status one year ago (3) job tenure, job tenure2, part-time, union membership, country of origin, region (19) and 5 year dummies, Wages in constant (Autumn 2001) pounds. Standard error is in parentheses. * significant at 0.1 level ** significant at 0.05 level *** significant at 0.01 level

Non-monetary aspects of job quality
Follow Green (2006) and Clark (2005) Non-monetary aspects of job quality
important Job quality a measure of worker well-being Also a focus of the EC:
• directives emphasise quality of temporary jobs• EC (2001) develops 10-point indicator, incl.:
wages (and transition to higher paid jobs) job satisfaction stress; strain

Job quality: anxiety
Anxiety a focus in health literature• relation between temporary jobs, anxiety and
depression
Measure used reflects anxiety about status Reflects precarious position under UK
labour market regulation Self-completion questions
• 4 point scale: “not at all anxious - very anxious”
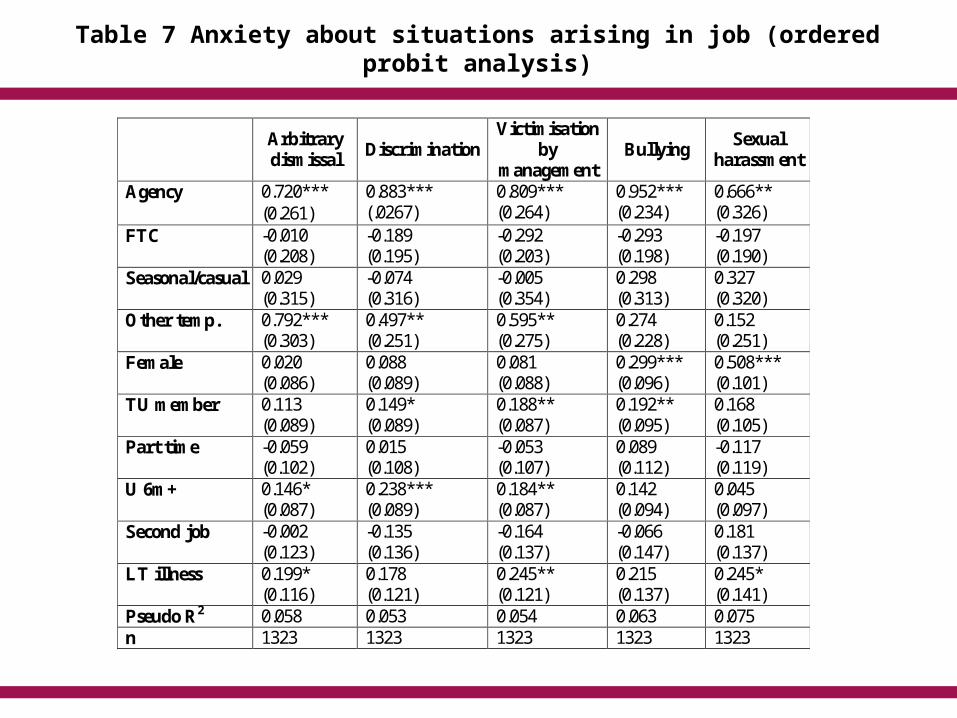
Table 7 Anxiety about situations arising in job (ordered probit analysis)
Arbitrary dismissal
Discrimination Victimisation
by management
Bullying Sexual
harassment
Agency 0.720*** (0.261)
0.883*** (.0267)
0.809*** (0.264)
0.952*** (0.234)
0.666** (0.326)
FTC -0.010 (0.208)
-0.189 (0.195)
-0.292 (0.203)
-0.293 (0.198)
-0.197 (0.190)
Seasonal/casual 0.029 (0.315)
-0.074 (0.316)
-0.005 (0.354)
0.298 (0.313)
0.327 (0.320)
Other temp. 0.792*** (0.303)
0.497** (0.251)
0.595** (0.275)
0.274 (0.228)
0.152 (0.251)
Female 0.020 (0.086)
0.088 (0.089)
0.081 (0.088)
0.299*** (0.096)
0.508*** (0.101)
TU member 0.113 (0.089)
0.149* (0.089)
0.188** (0.087)
0.192** (0.095)
0.168 (0.105)
Part time -0.059 (0.102)
0.015 (0.108)
-0.053 (0.107)
0.089 (0.112)
-0.117 (0.119)
U 6m+ 0.146* (0.087)
0.238*** (0.089)
0.184** (0.087)
0.142 (0.094)
0.045 (0.097)
Second job -0.002 (0.123)
-0.135 (0.136)
-0.164 (0.137)
-0.066 (0.147)
0.181 (0.137)
LT illness 0.199* (0.116)
0.178 (0.121)
0.245** (0.121)
0.215 (0.137)
0.245* (0.141)
Pseudo R2 0.058 0.053 0.054 0.063 0.075 n 1323 1323 1323 1323 1323

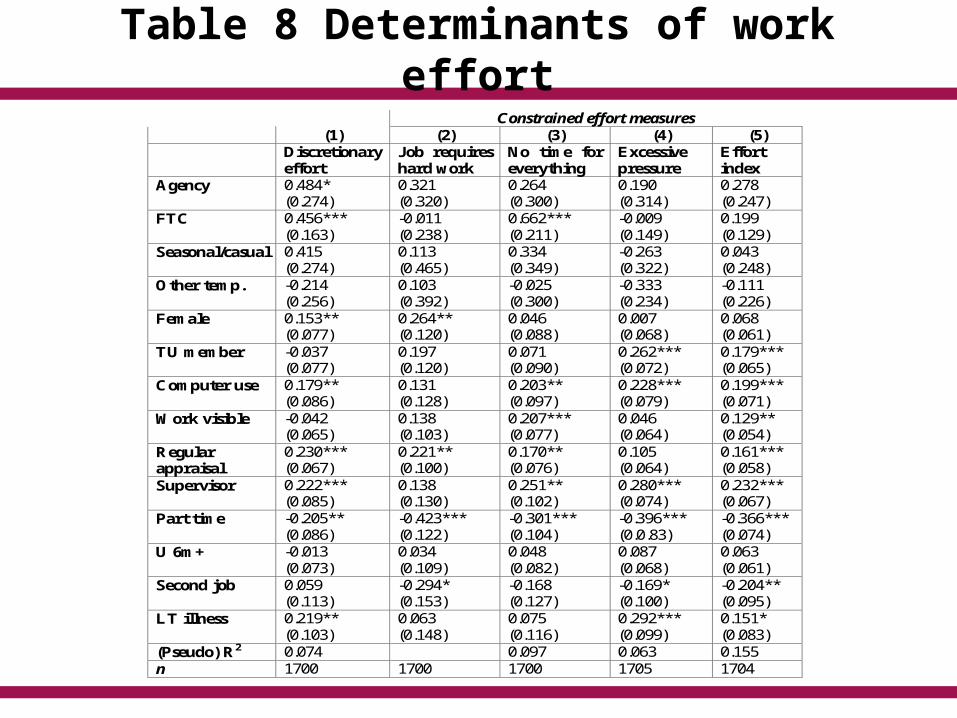
Much anecdotal evidence of ‘drive’ in agency work
Use Green’s distinction:• discretionary effort• constrained effort
Work psychology literature suggests agency jobs do not suffer ‘role overload’; roles clear (Guest, 2006; Parker et al., 2002)
Fits economic theory
Job quality: effort
Constrained effort measures (1) (2) (3) (4) (5)
Discretionary effort
Job requires hard work
No time for everything
Excessive pressure
Effort index
Agency 0.484* (0.274)
0.321 (0.320)
0.264 (0.300)
0.190 (0.314)
0.278 (0.247)
FTC 0.456*** (0.163)
-0.011 (0.238)
0.662*** (0.211)
-0.009 (0.149)
0.199 (0.129)
Seasonal/casual 0.415 (0.274)
0.113 (0.465)
0.334 (0.349)
-0.263 (0.322)
0.043 (0.248)
Other temp. -0.214 (0.256)
0.103 (0.392)
-0.025 (0.300)
-0.333 (0.234)
-0.111 (0.226)
Female 0.153** (0.077)
0.264** (0.120)
0.046 (0.088)
0.007 (0.068)
0.068 (0.061)
TU member -0.037 (0.077)
0.197 (0.120)
0.071 (0.090)
0.262*** (0.072)
0.179*** (0.065)
Computer use 0.179** (0.086)
0.131 (0.128)
0.203** (0.097)
0.228*** (0.079)
0.199*** (0.071)
Work visible -0.042 (0.065)
0.138 (0.103)
0.207*** (0.077)
0.046 (0.064)
0.129** (0.054)
Regular appraisal
0.230*** (0.067)
0.221** (0.100)
0.170** (0.076)
0.105 (0.064)
0.161*** (0.058)
Supervisor 0.222*** (0.085)
0.138 (0.130)
0.251** (0.102)
0.280*** (0.074)
0.232*** (0.067)
Part time -0.205** (0.086)
-0.423*** (0.122)
-0.301*** (0.104)
-0.396*** (0.0.83)
-0.366*** (0.074)
U 6m+ -0.013 (0.073)
0.034 (0.109)
0.048 (0.082)
0.087 (0.068)
0.063 (0.061)
Second job 0.059 (0.113)
-0.294* (0.153)
-0.168 (0.127)
-0.169* (0.100)
-0.204** (0.095)
LT illness 0.219** (0.103)
0.063 (0.148)
0.075 (0.116)
0.292*** (0.099)
0.151* (0.083)
(Pseudo) R2 0.074 0.097 0.063 0.155 n 1700 1700 1700 1705 1704
Table 8 Determinants of work effort
Job quality: work strain
WiB contains measures of psychological well-being (Warr, 1990)
Self-reported 6 point scale of frequency of worry/exhaustion caused by job
Individual items and index to capture multi-dimensional aspect (alpha=0.77)

Table 9. Measures of work strain
(1) (2) (3) (4)
Worry about job
after work Difficult to
unwind Exhausted at
end of day Work strain
index Agency -0.377*
(0.218) -0.187 (0.236)
-0.401* (0.240)
-0.487 (0.439)
FTC -0.136 (0.144)
-0.054 (0.167)
-0.035 (0.147)
-0.236 (0.373)
Seasonal/casual -0.218 (0.332)
-0.429 (0.303)
-0.172 (0.290)
-1.685*** (0.596)
Other temp. -0.202 (0.242)
-0.240 (0.243)
0.207 (0.200)
-0.214 (0.659)
Female -0.018 (0.069)
0.020 (0.069)
0.025 (0.068)
0.023 (0.166)
TU member -0.092 (0.076)
-0.073 (0.074)
0.043 (0.070)
-0.119 (0.173)
Effort index 0.499*** (0.035)
0.515*** (0.038)
0.554*** (0.032)
1.501*** (0.074)
Discretion 0.059* (0.033)
-0.028 (0.033)
-0.064** (0.032)
-0.067 (0.076)
Supervisor 0.155** (0.073)
0.054 (0.073)
0.000 (0.073)
0.128 (0.181)
Part time -0.180** (0.087)
-0.182** (0.088)
-0.214** (0.086)
-0.454** (0.194)
U 6m+ 0.032 (0.072)
0.026 (0.070)
0.084 (0.065)
0.114 (0.154)
Second job -0.115 (0.109)
0.055 (0.113)
-0.089 (0.111)
-0.233 (0.244)
LT illness 0.210** (0.105)
0.403*** (0.090)
0.334*** (0.092)
1.128*** (0.244)
(Pseudo) R2 0.125 0.109 0.103 0.365 n 1710 1710 1710 1665

Useful subjective indicator of job quality Rose (2006) distinguishes between ‘intrinsic’, ‘extrinsic’
and ‘relational’ aspects of satisfaction
Little existing research focused on temporary workers
Expectations for some aspects clear:• job security• promotion prospects
Other less obvious:• nature of work• hours worked• relations with colleagues/supervisors
May be differences between forms of temporary work
Job quality: satisfaction
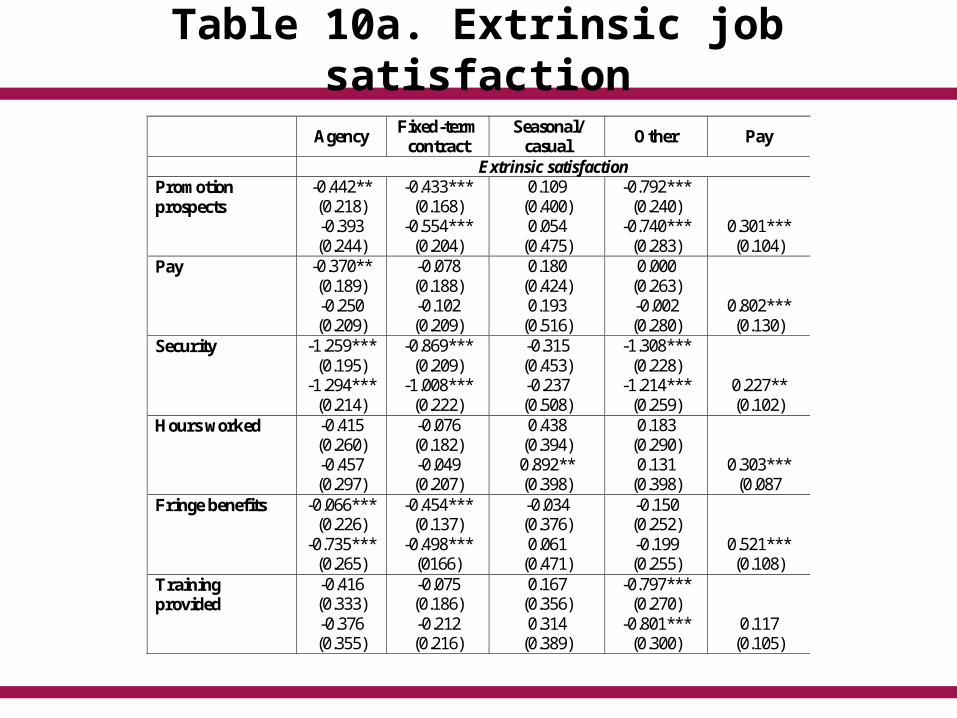
Table 10a. Extrinsic job satisfaction
Agency Fixed-term
contract Seasonal/
casual Other Pay
Extrinsic satisfaction Promotion prospects
-0.442** (0.218) -0.393 (0.244)
-0.433*** (0.168)
-0.554*** (0.204)
0.109 (0.400) 0.054
(0.475)
-0.792*** (0.240)
-0.740*** (0.283)
0.301*** (0.104)
Pay
-0.370** (0.189) -0.250 (0.209)
-0.078 (0.188) -0.102 (0.209)
0.180 (0.424) 0.193
(0.516)
0.000 (0.263) -0.002 (0.280)
0.802*** (0.130)
Security -1.259*** (0.195)
-1.294*** (0.214)
-0.869*** (0.209)
-1.008*** (0.222)
-0.315 (0.453) -0.237 (0.508)
-1.308*** (0.228)
-1.214*** (0.259)
0.227** (0.102)
Hours worked -0.415 (0.260) -0.457 (0.297)
-0.076 (0.182) -0.049 (0.207)
0.438 (0.394) 0.892** (0.398)
0.183 (0.290) 0.131
(0.398)
0.303*** (0.087
Fringe benefits -0.066*** (0.226)
-0.735*** (0.265)
-0.454*** (0.137)
-0.498*** (0166)
-0.034 (0.376) 0.061
(0.471)
-0.150 (0.252) -0.199 (0.255)
0.521*** (0.108)
Training provided
-0.416 (0.333) -0.376 (0.355)
-0.075 (0.186) -0.212 (0.216)
0.167 (0.356) 0.314
(0.389)
-0.797*** (0.270)
-0.801*** (0.300)
0.117 (0.105)

Table 10b. Intrinsic job satisfaction
Agency Fixed-term
contract Seasonal/
casual Other Pay
Ability to use initiative
-0.682*** (0.249)
-0.806*** (0.112)
-0.182 (0.196) -0.296 (0.215)
-0.086 (0.289) -0.234 (0.339)
-0.300 (0.199) -0.271 (0.217)
0.421*** (0.112)
Work itself
-0.467* (0.268)
-0.486** (0.237)
-0.285 (0.201) -0.427* (0.233)
-0.055 (0.310) -0.137 (0.389)
-0.049 (0.208) -0.071 (0.231)
0.330*** (0.100)
Amount of work
-0.362 (0.272) -0.245 (0.029)
-0.040 (0.174) -0.154 (0.202)
0.452 (0.339) 0.592* (0.328)
-0.145 (0.231) -0.177 (0.257)
0.283*** (0.093)
Variety in work
0.122 (0.192) 0.202
(0.227)
0.007 (0.194) -0.094 (0.222)
0.440 (0.278) 0.469
(0.339)
-0.420*** (0.142)
-0.411** (0.170)
0.411*** (0.099)
Challenge job sets
0.054 (0.260) 0.097
(0.297)
-0.052 (0.212) -0.150 (0.245)
-0.004 (0.287) -0.107 (0.358)
-0.317 (0.209) -0.165 (0.214)
0.498*** (0.094)
Responsibility in job
-0.447* (0.239)
-0.525** (0.264)
-0.077 (0.204) -0.194 (0.239)
-0.317 (0.300) -0.444 (0.373)
-0.273 (0.209) -0.237 (0.211)
0.452*** (0.096)
Chance to develop self
-0.185 (0.301) -0.337 (0.301)
-0.044 (0.191) -0.152 (0.210)
0.135 (0.360) -0.001 (0.430)
-0.715*** (0.233)
-0.655*** (0.236)
0.278*** (0.099)
Chance for personal
achievement
-0.344 (0.214) -0.442* (0.226)
-0.027 (0.221) -0.172 (0.233)
0.252 (0.280) 0.218
(0.361)
-0.430** (0.194)
-0.413** (0.199)
0.453*** (0.100)

Table 10c. Relational and overall job satisfaction
Agency Fixed-term
contract Seasonal/
casual Other Pay
Relational satisfaction Friendliness of work colleagues
-0.380 (0.286) -0.448 (0.295)
-0.241 (0.180) -0.241 (0.208)
-0.138 (0.524) -0.060 (0.590)
-0.131 (0.265) -0.052 (0.287)
-0.107 (0.095)
Relations with the boss
-0.450** (0.181)
-0.483*** (0.214)
0.128 (0.232) 0.139
(0.245)
0.034 (0.278) 0.062
(0.332)
-0.493** (0.236)
-0.528** (0.255)
0.078 (0.097)
Ability of management
-0.906 (0.288) -0.072 (0.096)
0.022 (0.193) 0.026
(0.216)
0.146 (0.298) 0.197
(0.347)
-0.153 (0.218) -0.212 (0.241)
0.183* (0.096)
Overall Overall satisfaction
-0.480** (0.211)
-0.492** (0.097)
-0.179 (0.169) -0.297 (0.242)
0.522 (0.348) 0.670* (0.363)
-0.701*** (0.234)
-0.804*** (0.265)
0.348*** (0.097)
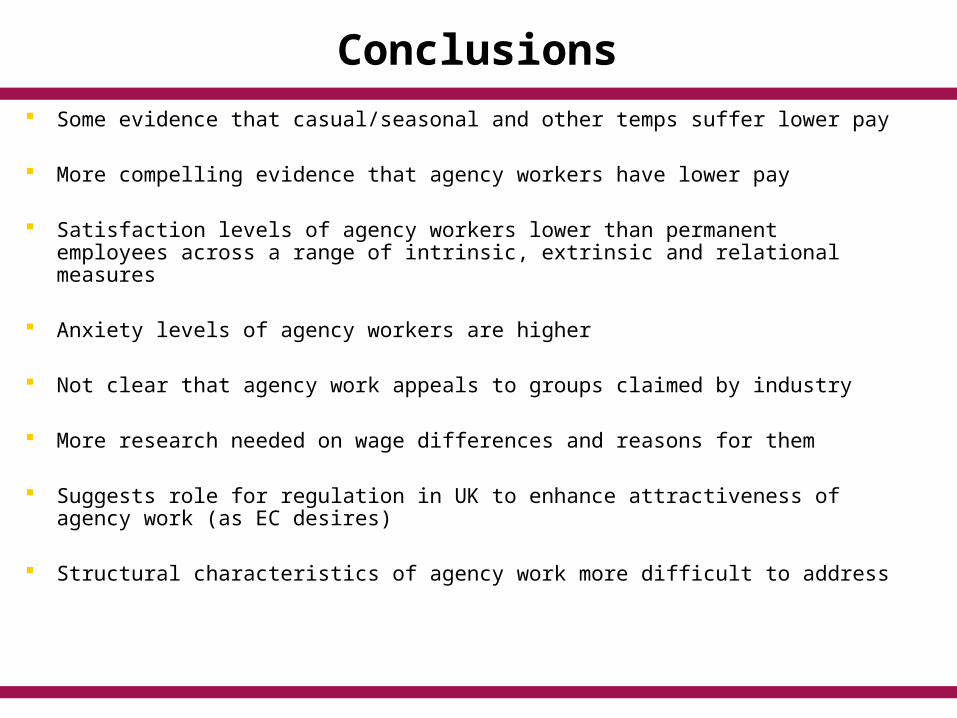
Conclusions
Some evidence that casual/seasonal and other temps suffer lower pay
More compelling evidence that agency workers have lower pay
Satisfaction levels of agency workers lower than permanent employees across a range of intrinsic, extrinsic and relational measures
Anxiety levels of agency workers are higher
Not clear that agency work appeals to groups claimed by industry
More research needed on wage differences and reasons for them
Suggests role for regulation in UK to enhance attractiveness of agency work (as EC desires)
Structural characteristics of agency work more difficult to address