short communication a hydraulic model as a useful tool in ... · pdf filea water-pipe network...
TRANSCRIPT

Introduction
A water-pipe network constitutes one of the key ele-ments of the water supply system and, at the same time, isusually the most expensive part of this system. Its purposeis to supply water in the required quantity and of properquality under correct pressure and at a time convenient forevery user. The prerequisite for meeting the above condi-tions is the proper design and execution of the new, as wellas the operation of the existing network. At the same time,the correct operation and control of operation of the waterline has a key influence on the water distribution costs, and
thus on the final water price. A versatile tool that can beused both at the stage of designing a new network and dur-ing the operation of an existing one is the hydraulic model.The use of computers and available software programsoffers virtually unlimited possibilities for solving water dis-tribution-related problems, which would have not been pos-sible to achieve using traditional methods (e.g. the capabil-ity to simulate the quality of water in the grid). Computersimulation of network operation facilitates the making ofimportant decisions about ongoing tasks in a water supplycompany. Among those distinguished by high functionalityare especially dynamic models that accurately reflect thenetwork operation under variable water withdrawal condi-tions.
Pol. J. Environ. Stud. Vol. 23, No. 3 (2014), 995-1001
Short CommunicationA Hydraulic Model as a Useful Tool
in the Operation of a Water-Pipe Network
Urszula Kępa*, Ewa Stańczyk-Mazanek
Institute of Environmental Engineering, Czestochowa University of Technology,Brzeźnicka 60a, 42-200 Częstochowa, Poland
Received: 25 July 2013Accepted: 2 April 2014
Abstract
Our paper presents a model of the water-pipe network for the Kawie Góry supply zone. The zone under
analysis is part of the network operated by the PWiK (Water-Pipe and Sewage Company) in Czestochowa.
The model was made in the Epanet program using numerical and operational data.
The water-pipe network under examination supplies water to a family housing estate and is fed from a
field water-supply reservoir. The total population of the area is approx. 1,500 people, the length of the water-
pipe network is 11,704 running meters, and the pipe diameter range is 100-150 mm. The pipes are made of
grey cast-iron, PE, and PVC. Based on the selected measurement points, calibration of the model was per-
formed. Within the validation of the model, sensitivity analysis was made.
Then, a series of simulations were performed to illustrate the network operation for variable water sup-
ply and demand conditions. Multi-period analysis was employed for modeling. The developed model made it
possible to determine the magnitude of pressure in the network points, and flows in particular sections for
operational parameters under consideration. The prepared model can also provide a base for alternative net-
work management variants, for example in the case of failure or increased water demand and enable the fore-
casting of possible water shortage locations. In the event of the development of the network, in turn, it will
enable the optimal design of new lines.
Keywords: water-pipe network, hydraulic model, model calibration and validation
*e-mail: [email protected]
Modeling involves the development of a mathematicalmodel (using e.g. numerical methods) that will render thecourse of a given process as faithfully as possible. In thecase of water-pipe networks, the point is that the behaviorof water in the lines be reproduced in the most faithful man-ner, while considering parameters such as: water with-drawals, pressure and its losses, flows, velocities, waterquality, etc. Taking measurements including the abovequantities over the entire operated network is essentiallyimpossible due to both the cost and duration of such analy-ses. The development and calibration of a model is moreeffective and provides the capability to simulate the opera-tion of such a network [1, 2]. At the same time, the analysisof the network records made within modeling facilitateschecking the input data describing the network for correct-ness. At the same time, relating the data obtained frommodelling to the spatial information system (GIS) makes itbetter depicted [3].
The numerical analysis of the network also facilitates itsassessment in terms of operation. The available programsenable the simulation of network operation after a specifictime; it is then possible to cover the network points indicat-ed by the model by special supervision. Modeling is help-ful when planning overhauls or flushing individual waterline sections. In turn, analysis of the behavior of the net-work during failures in its vulnerable sections makes it pos-sible to make sure that the system equilibrium will not bedisrupted and that water supply to the users will not becompromised. In that case, the model will allow alternativefailure mitigation solutions to be tested [4, 5].
Modeling is especially important in the case of redevel-opment or extension of an existing network. It is then pos-sible to analyze different variants of proposed solutions andto select the most advantageous one in an expeditious man-ner. We are able to determine the effects of loading downthe existing system and to capture any errors that occurredwhile designing new sections. The model will enable us toavoid oversizing a network or designing a network of toosmall a capacity against the demand. Therefor, it will bringabout measurable savings at the construction stage, as itwill enable the selection of the most economical variant andwill eliminate any errors that might otherwise show up onlyat the execution or operation stages [6, 7].
Analyses and simulation computations could be con-ducted both for already existing or modernized networksand in the design of new networks. The use of numericalmethods for modelling and simulation of water-pipe net-works is of paramount importance for the optimization ofoperation of these networks. The growth and increasinglywide application of numerical methods stems chiefly fromthe need for the assessment, as well as proposing bettersolutions of the functioning of the water distribution sub-system under operational conditions. Available specializedprograms such as Epanet, Piccolo, Mike Urban, Geosecma,or Woda, make use of hydraulic analysis algorithms thatallow a network of any size and complexity to be analyzed.They enable local pressure losses on bends and reducers tobe allowed for and provide the capability to model eitherthe constant or variable speed of pump operation. A very
great interest and increasingly common use of numericalmethods for the computation of water-pipe networks isobserved both at home and abroad [8, 9].
Purpose and Scope of the Study
The purpose of the study was to make a dynamichydraulic model of a selected zone of the water-pipe net-work based on variable time standards, which was to besubsequently used for the analysis of network operation.
The scope of the work encompassed the following:• collecting input data for the model• entering the data in the program and making the model• testing the sensitivity of the model• calibrating the model based on field measurements• carrying out a series of network operation simulations
for variable water supply and demand conditions.
Input Data for the Model
The Kawie Góry supply area is situated within the area ofthe water-pipe network operated by the Czestochowa DistrictWater-Pipe and Sewage Company (PrzedsiębiorstwoWodociągów i Kanalizacji Okręgu CzęstochowskiegoS.A.) with its ofice at 14/20 Jaskrowska St. inCzestochowa. The company supplies an area of about 1,000km2 with water and has the second longest network inPoland. The total length of the whole network is more than2,200 km.
The Kawie Góry water-pipe zone under examinationincludes a family housing estate that borders the Północ andRząsawa quarters of Czestochowa. The housing estate hasa separated supply zone: water is supplied to the wholezone via a pumping station from the Kawie Góry fieldwater-supply reservoirs of a total capacity of 10,000 m3.The total length of the network in the examined area is 11.7km, the number of water service lines is 368, and the num-ber of users supplied by the water-pipe network is 1,472people. The buildings in the zone under consideration areconnected to the urban sewage system, while hot utilitywater is prepared locally. The zone area has no developedservices; essentially, there are no industrial plants or publicfacilities here. The main users of water are households; inaddition, some water is used by a car showroom or forwatering greenery in an allotment garden.
Data for the water-pipe network, such as the arrange-ment of pipes, diameters, material, utilities, land ordinates,and the area supply method were obtained from the grindoperator. Based on data from 2010-11, the average andmaximum water demands in the examined area were calcu-lated while considering the specificity of particular users.The withdrawal variation coefficients also were deter-mined. Characteristic water demand quantities were as fol-lows:
qdav = 95-103 l/Person×day
Ndmax = 3.5 for the year 2010 and 1.9 for the year 2011
Nhmax = 2.7 for the year 2010 and 1.8 for the year 2011
996 Kępa U., Stańczyk-Mazanek E.
The Hydraulic Model, Testing
and Calibration of the Model
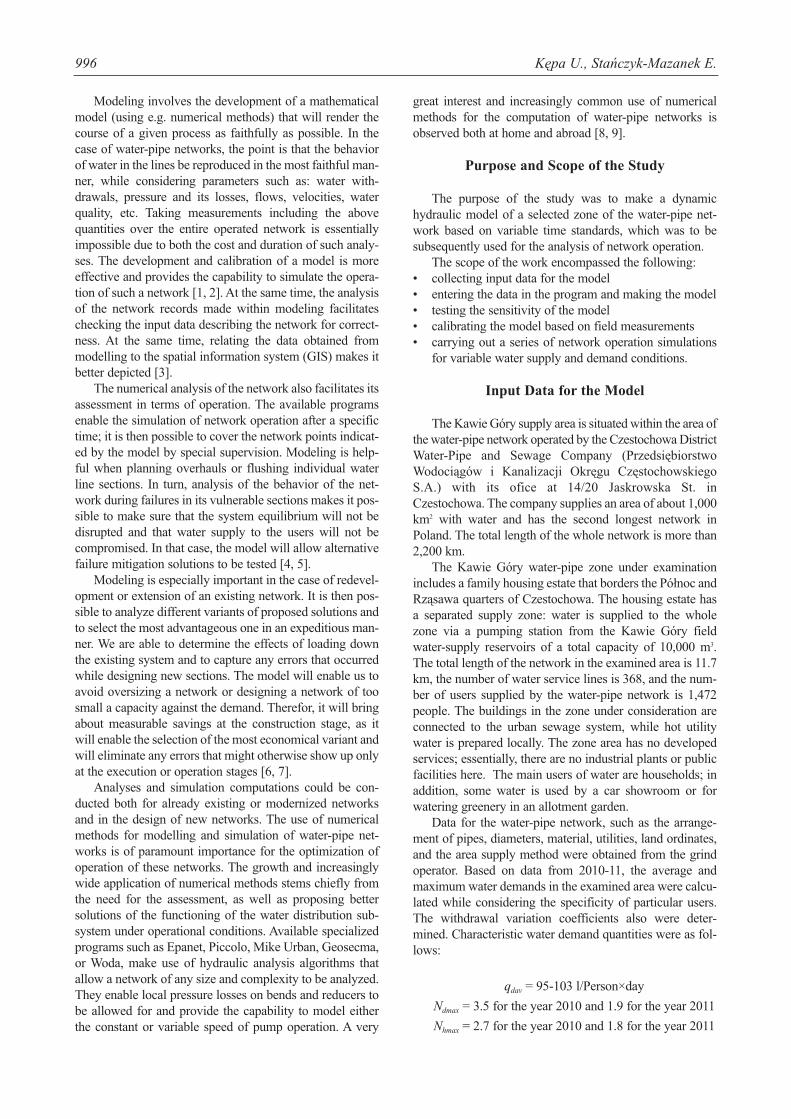
The hydraulic model was made within the Epanet 2 pro-gram. This is a software program designed for simulatingwater distribution systems, developed by the United StatesEnvironmental Protection Agency in 1994. The program isfree of charge, and many chargeable applications for math-ematical simulation of hydraulic systems make use of theEpanet's algorithms. In order to simplify the arduous Crosscomputational procedure, the so-called gradient algorithm-hybrid, or a hybrid node-loop iteration method (gradientmethod) was employed [10]. The multi-period analysis wasused for modeling. The basic pattern of water demand dis-tribution is based on the water consumption measurementsduring the calibration day. The developed grid model con-sists of 123 nodes interconnected with 130 pipe sections.The diameter range is φ 100-150 mm. The pipe material iscast iron, PE, and PVC. A schematic of the network struc-ture is shown in Fig. 1. The developed model is character-ized by a high degree of detail.
As per today, there are no guidelines in Poland thatwould specify the conformance criteria to be met when cal-
ibrating hydraulic models. Such prescriptions have beendeveloped, however, in the UK and the USA. Accordingly,it is assumed in the UK that 100% of the pressure valuesfrom measurement data shall be contained within ±2.0 m ofthe water column (WC). In the USA, in turn, the permissi-ble pressure deviation values shall be contained within ±1.4m WC for 90% of measurements [11].
The created model was subjected to calibration basedon select measurement points. Because of the degree ofdetail of the model, the required number of points should be2% of nodes at the minimum [11]. During field tests, pres-sure measurements were taken at 4 nodes on the networkand at the exit from the pumping station (4% of nodes). Themeasurement points were selected using the computationalalgorithm developed by R. Straubel and B. Holznagel [12].For the calibration of the model, fire hydrant flow tests alsowere used, which were conducted according to [13].
During calibration, by varying the parameter values inthe preset ranges and making simulation computations ofthe model, the pressures and flow in the network lines andnodes were calculated, which were then compared with theflow and pressures measured at the measurement points. Asa result of this comparison, the mean absolute deviation
A Hydraulic Model as a Useful Tool ... 997
99
99
99
99
147147
147147147147
147147
147147147
100
147147
147147
147147
147147
147
147
147147
147
99
99
102
999999
99
99
99
99102
10299
102
99
102
102
102
102
99
99
99
99
99
99 99
99 99
99
147147
147
147
147
147
147
100
99
102
147
147
147102
147
10210251
147
147
147
150
99
150
102
15099
150
150
150
99
99
9999
150
99
9999
99
154
150
102
150
99
102 150
147
147147147
147147
150
150102
147147
99
145
99
147
99147
147147102
102102
102102
147
102
#N/A#N/A
Day 1, 12:00 AM
Fig. 1. Schematic of the water-pipe network. Pipe diameters.
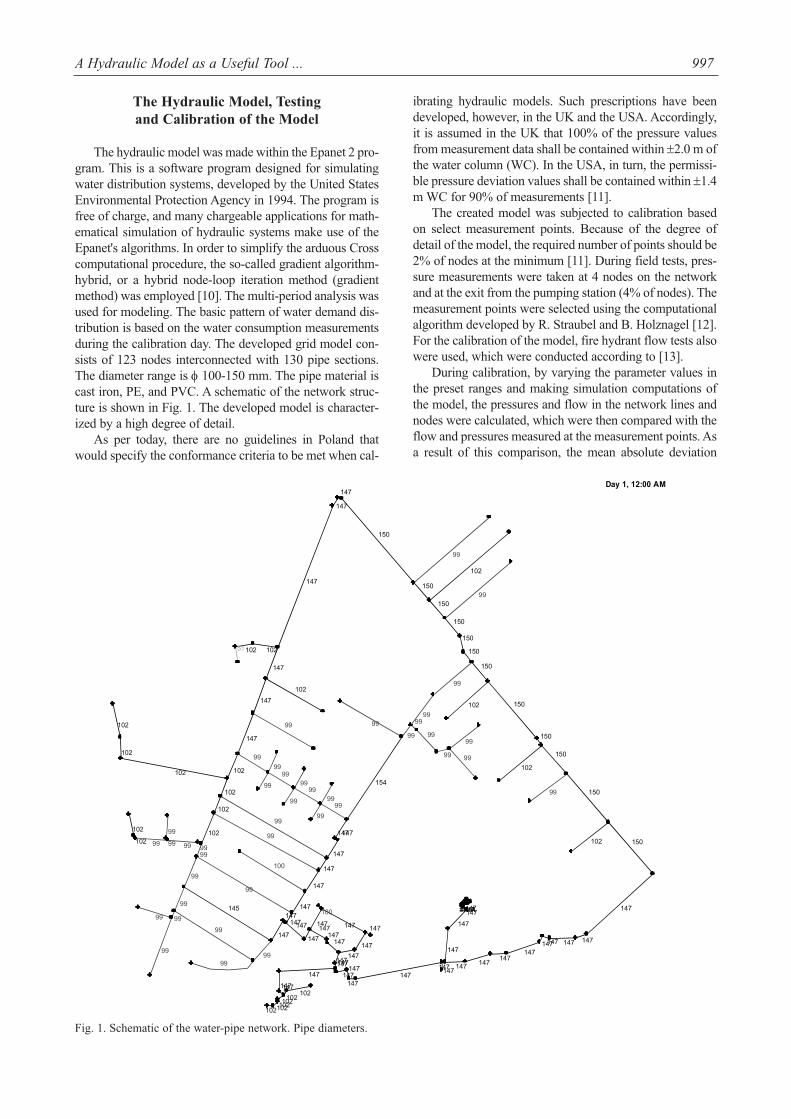
between all pressure value pairs were determined. The dif-ference between the observed and simulated values did notexceed 0.009 MPa (0.9 WC) for all nodes, and the meansquare error ranged from 0.66 to 1.05. This is indicative ofgood reproduction of the actual conditions prevailing in thesimulated network. The value of the coefficient of correla-tion between the mean observed and simulated values was
0.999; so the correlation should be described as practicallyfull. Fig. 2 shows the scatter of observed and simulated val-ues for all measurements at the examined nodes.
In turn, within the validation of the model, a sensitivityanalysis was made. In the first place, subject to changeswere the values of the roughness coefficients of the lines.Then, the operation of the model at an enhanced water
998 Kępa U., Stańczyk-Mazanek E.
146627594Series6
Correlation Plot for Pressure
Observed6055504540353025
Computed
60585654525048464442403836343230282624
Fig. 2. The correlation between the compared values for the observed nodes for the pressure parameter.
0.00
0.00
0.02
0.03
0.050.14
0.150.100.100.10
0.060.06
0.000.050.05
0.00
0.160.16
0.160.16
0.160.16
0.000.16
0.27
0.270.270.27
0.05
0.02
0.06
0.05
0.000.000.00
0.04
0.03
0.00
0.000.00
0.000.03
0.05
0.03
0.07
0.01
0.00
0.04
0.03
0.03
0.04
0.05
0.00
0.00 0.00
0.00 0.00
0.00
0.040.04
0.06
0.08
0.08
0.10
0.04
0.00
0.01
0.00
0.11
0.02
0.020.00
0.02
0.010.000.01
0.00
0.01
0.01
0.01
0.01
0.03
0.00
0.040.01
0.05
0.05
0.05
0.00
0.02
0.010.02
0.09
0.01
0.000.03
0.00
0.02
0.07
0.00
0.08
0.01
0.00 0.10
0.11
0.110.110.11
0.110.11
0.05
0.070.00
0.110.11
0.01
0.03
0.00
0.27
0.00
0.000.000.000.000.000.00
0.000.00
0.16
0.00
0.000.00
49.74
47.93
47.4847.4848.9349.03
47.97
49.9249.95
49.95 45.50
45.42
44.12
52.02
52.97
52.97
42.07
37.48
35.94
41.08 34.07
39.18
39.18 38.03
35.77
32.22 32.03
35.0334.78
37.83
39.73
42.49
43.94
43.99
43.32
34.42
45.22
38.52
45.5046.2147.62
47.87
43.5243.6743.67
42.10
50.41
42.05
54.22
43.32
49.77
43.02
42.7242.82
36.82
34.6334.23
32.0732.86
35.22
30.92
33.63
39.46
38.2438.24
31.5436.95
32.25
39.07
31.16
42.14
31.8231.2229.6329.5329.18
29.3428.9029.90
42.03
35.88
49.9351.54 45.29
50.24
48.58
46.24
45.67
44.9444.94
43.7643.33
42.1741.7738.97
38.2737.57
41.7641.70
40.2739.7339.1639.19
38.3038.2032.1632.1632.16
32.10
26.0625.8725.8725.97
40.2843.68
42.0641.0341.03 41.98
41.0841.0641.0842.13
0.000.00
Pressure
10.00
20.00
40.00
60.00
m
Velocity
0.05
0.10
0.50
1.00
m/s
Day 1, 7:00 PM
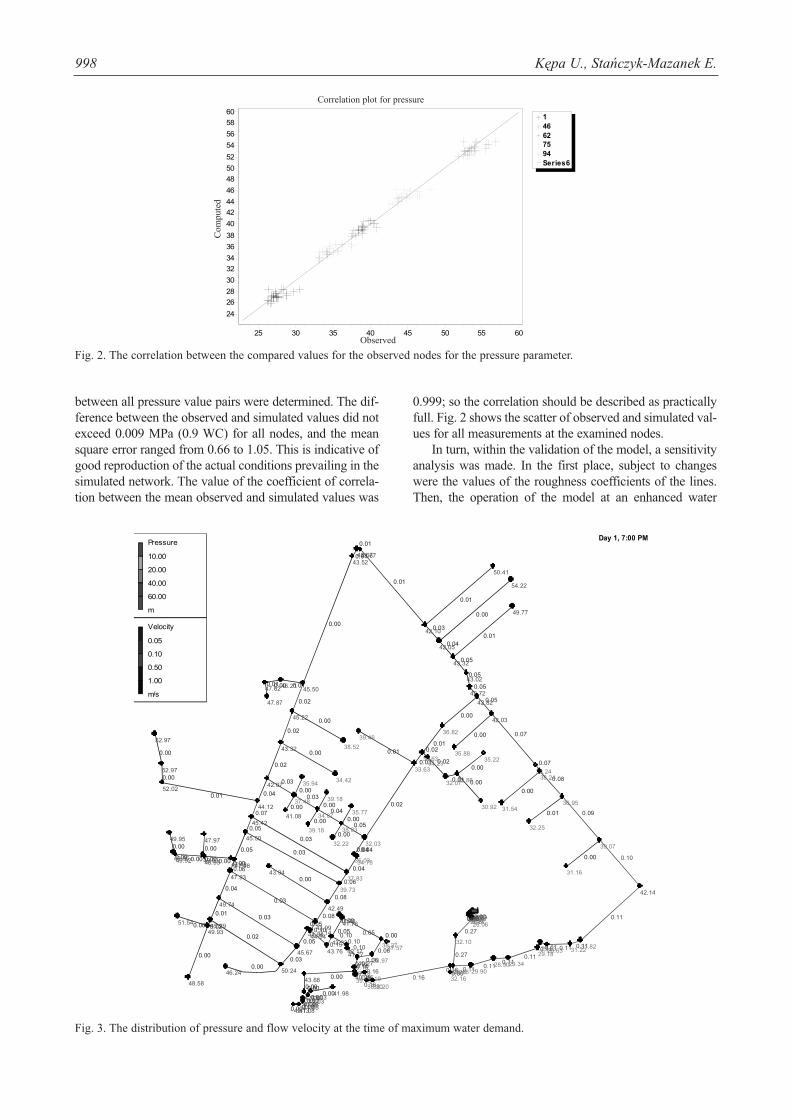
Fig. 3. The distribution of pressure and flow velocity at the time of maximum water demand.
Correlation plot for pressure
Observed
Com
pute
d

demand was analyzed. On the basis of the performed cali-bration and validation it was accepted that the developedmodel was correct and provides a reliable reflection of thewater-pipe network under study.
Simulation of Water-Pipe Network Operation
Using the calibrated water-pipe network model, a seriesof simulations were carried out to demonstrate the opera-tion of the network for variable water supply and demandconditions. The following network operation variants wereexamined: the standard water demand conditions, activatedfire-fighting water flow in selected hydrants, a 24-hour-period with increased water demand, and cut-off water flowon select sections with the standard water demand. Theobtained results made it possible, among other things, toplan overhauls on select network sections, to select linesrequiring flushing to prevent any deposits from building up,or to make sure that the planned cut-off of flow in one ofthe main lines will not cause any disruptions in water sup-ply to the users. The three selected network operation sta-tuses are shown below.
Fig. 3 shows the simulated magnitudes of pressure atindividual points and water flow velocity for the lines at thetime of the highest water demand. It was observed that at allnetwork points the pressure magnitude varied in the rangeof 29-54 m WC, and the water flow velocities were verylow. Analyzing the variability of the demand was found thatpressure fluctuations in the most remotely located pointsdidn't exceed 2.8 m WC at the standard water demand con-ditions (the difference between the pressure in the hours ofthe smallest and largest demand).
Fig. 4 represents the distribution of pressure and flowvelocity in the case of cutting off the flow on the selectedsection (e.g. because of repair work) for the time of themaximum water demand. Some increase in flow velocity inparticular sections can be noticed; however, these are stillvalues below the minimum velocity recommended forwater-pipe networks, i.e. 0.5 m/s. It was found that, in spiteof the zone being supplied from a single direction only, themagnitude of pressure in the points allowed uninterruptedwater uptake by the users.
Fig. 5 shows in turn the distribution of the pressure andflow velocity of water for the time of the maximum water
A Hydraulic Model as a Useful Tool ... 999
0.00
0.00
0.00
0.02
0.020.02
0.020.010.000.00
0.000.00
0.000.000.01
0.00
0.000.00
0.000.00
0.000.00
0.000.00
0.27
0.270.270.27
0.02
0.02
0.03
0.04
0.000.000.00
0.02
0.01
0.00
0.000.00
0.000.01
0.04
0.01
0.05
0.01
0.00
0.08
0.03
0.02
0.01
0.01
0.00
0.00 0.00
0.00 0.00
0.00
0.070.07
0.06
0.05
0.05
0.04
0.07
0.00
0.02
0.00
0.27
0.06
0.060.00
0.07
0.010.000.01
0.08
0.09
0.09
0.09
0.01
0.11
0.00
0.110.01
0.12
0.13
0.13
0.18
0.02
0.170.02
0.25
0.01
0.000.15
0.00
0.06
0.23
0.00
0.24
0.01
0.00 0.26
0.27
0.270.270.27
0.270.27
0.21
0.220.00
0.270.27
0.01
0.01
0.00
0.27
0.00
0.000.000.000.000.000.00
0.000.00
0.00
0.00
0.000.00
48.87
47.07
46.6246.6248.0748.17
47.11
49.0649.09
49.09 44.64
44.57
43.28
51.17
52.12
52.12
41.23
36.64
35.10
40.24 33.23
38.34
38.34 37.19
34.93
31.38 31.18
34.1833.93
36.97
38.87
41.62
43.07
43.12
42.49
33.59
44.39
37.69
44.6845.4046.81
47.06
42.7342.8842.88
41.34
49.66
41.33
53.49
42.60
49.05
42.32
42.0242.13
36.06
33.8033.40
31.2532.04
34.40
30.10
32.79
38.62
37.6737.68
30.9836.44
31.74
38.65
30.75
41.83
31.6231.0429.4829.4029.06
29.2628.8429.87
41.36
35.21
49.0650.67 44.42
49.37
47.71
45.37
44.80
44.0744.07
42.8742.44
41.2740.8738.07
37.3736.67
40.8740.81
39.3738.8238.2438.27
37.3737.2732.1632.1632.16
32.10
26.0625.8725.8725.97
39.3742.77
41.1540.1240.12 41.07
40.1740.1540.1741.22
0.000.00
Pressure
10.00
20.00
40.00
60.00
m
Velocity
0.05
0.10
0.50
1.00
m/s
Day 1, 7:00 PM
Fig. 4. The distribution of pressure magnitude and flow velocity for the time of the maximum water demand; the flow cut-off in select-ed section (grey arrow).
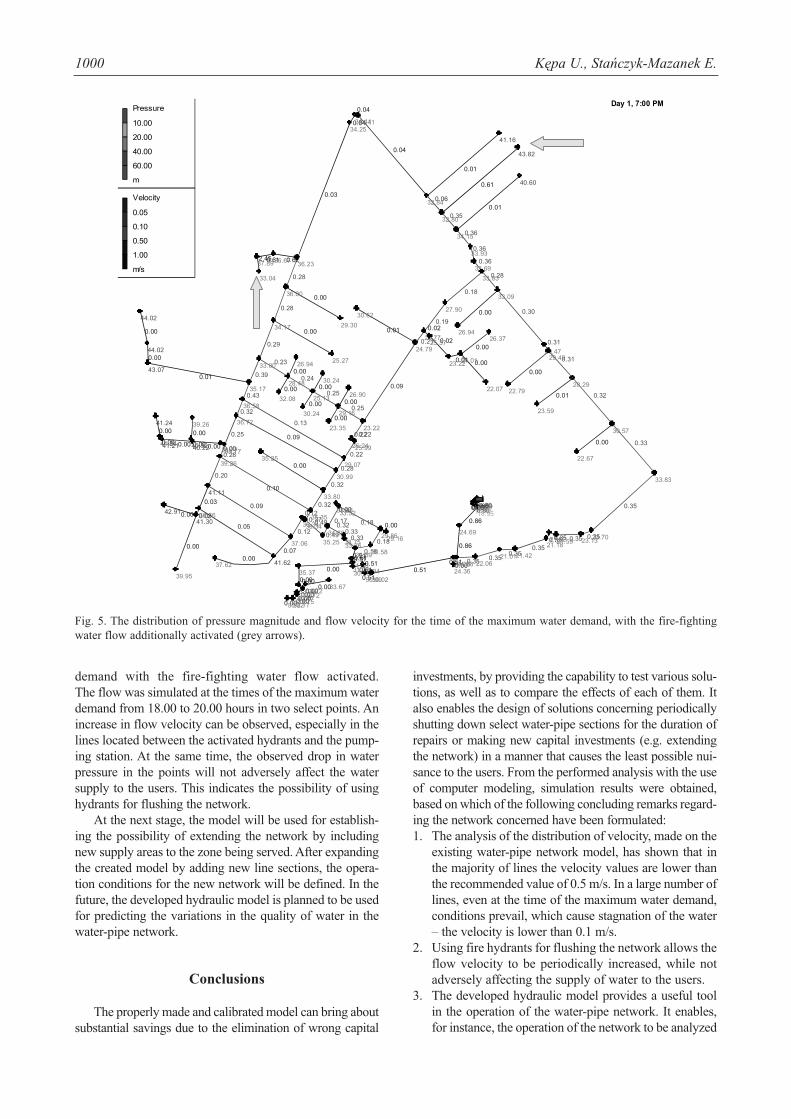
demand with the fire-fighting water flow activated. The flow was simulated at the times of the maximum waterdemand from 18.00 to 20.00 hours in two select points. Anincrease in flow velocity can be observed, especially in thelines located between the activated hydrants and the pump-ing station. At the same time, the observed drop in waterpressure in the points will not adversely affect the watersupply to the users. This indicates the possibility of usinghydrants for flushing the network.
At the next stage, the model will be used for establish-ing the possibility of extending the network by includingnew supply areas to the zone being served. After expandingthe created model by adding new line sections, the opera-tion conditions for the new network will be defined. In thefuture, the developed hydraulic model is planned to be usedfor predicting the variations in the quality of water in thewater-pipe network.
Conclusions
The properly made and calibrated model can bring aboutsubstantial savings due to the elimination of wrong capital
investments, by providing the capability to test various solu-tions, as well as to compare the effects of each of them. Italso enables the design of solutions concerning periodicallyshutting down select water-pipe sections for the duration ofrepairs or making new capital investments (e.g. extendingthe network) in a manner that causes the least possible nui-sance to the users. From the performed analysis with the useof computer modeling, simulation results were obtained,based on which of the following concluding remarks regard-ing the network concerned have been formulated:1. The analysis of the distribution of velocity, made on the
existing water-pipe network model, has shown that inthe majority of lines the velocity values are lower thanthe recommended value of 0.5 m/s. In a large number oflines, even at the time of the maximum water demand,conditions prevail, which cause stagnation of the water– the velocity is lower than 0.1 m/s.
2. Using fire hydrants for flushing the network allows theflow velocity to be periodically increased, while notadversely affecting the supply of water to the users.
3. The developed hydraulic model provides a useful toolin the operation of the water-pipe network. It enables,for instance, the operation of the network to be analyzed
1000 Kępa U., Stańczyk-Mazanek E.
0.00
0.00
0.05
0.07
0.120.49
0.490.320.330.33
0.180.18
0.000.180.17
0.00
0.510.51
0.510.51
0.510.51
0.000.51
0.86
0.860.860.86
0.12
0.02
0.28
0.25
0.000.000.00
0.20
0.10
0.00
0.000.00
0.000.09
0.32
0.13
0.43
0.01
0.00
0.39
0.23
0.24
0.25
0.25
0.00
0.00 0.00
0.00 0.00
0.00
0.220.22
0.28
0.32
0.32
0.37
0.22
0.00
0.03
0.00
0.35
0.29
0.280.00
0.28
0.620.612.45
0.03
0.04
0.04
0.04
0.01
0.06
0.61
0.350.01
0.36
0.36
0.36
0.18
0.02
0.190.02
0.32
0.01
0.000.21
0.00
0.09
0.31
0.00
0.31
0.01
0.00 0.33
0.35
0.350.350.35
0.350.35
0.28
0.300.00
0.350.35
0.01
0.09
0.00
0.86
0.00
0.000.000.000.000.000.00
0.000.00
0.51
0.00
0.000.00
41.11
39.26
38.7738.7740.2240.32
39.26
41.2141.24
41.24 36.72
36.58
35.17
43.07
44.02
44.02
33.00
28.48
26.94
32.08 25.13
30.24
30.24 29.16
26.90
23.35 23.22
26.2425.99
29.07
30.99
33.80
35.25
35.35
34.17
25.27
36.00
29.30
36.2336.6737.89
33.04
34.2534.4134.41
32.84
41.16
32.80
43.82
34.15
40.60
33.93
33.6933.83
27.90
25.7725.37
23.2224.01
26.37
22.07
24.79
30.62
29.4729.49
22.7928.29
23.59
30.57
22.67
33.83
23.7023.1321.5921.5221.18
21.4221.0122.06
33.09
26.94
41.3042.91 36.66
41.62
39.95
37.62
37.06
36.3436.34
35.2534.88
33.7533.3630.58
29.8629.16
33.3233.26
31.8931.4030.8630.94
30.0930.0224.3624.3624.38
24.69
18.9518.8018.8418.97
31.9735.37
33.7532.7232.72 33.67
32.7732.7532.7733.82
0.000.00
Pressure
10.00
20.00
40.00
60.00
m
Velocity
0.05
0.10
0.50
1.00
m/s
Day 1, 7:00 PM
Fig. 5. The distribution of pressure magnitude and flow velocity for the time of the maximum water demand, with the fire-fightingwater flow additionally activated (grey arrows).

at increased water withdrawals or during planned over-hauls. For example, it has been verified that cutting offthe flow on a select network section will not adverselyaffect network operation; despite some decrease inwater-pipe pressure, the water will reach all the users inthe required quantity and under the proper pressure.
Acknowledgements
Our research was financed by BS-PB-401/301/12funds.
References
1. GOSIEWSKA E. Well "programmed" company.Wodociągi-Kanalizacja, 1, 13, 2004 [In Polish].
2. SROCZAN E., URBANIAK A. IT tools for water supplyand sewerage systems. Wodociągi-Kanalizacja, 1, 17, 2004
[In Polish].3. KWIETNIEWSKI M. Monitoring and GIS in the modern
operation of water and wastewater systems. Gaz, Woda iTechnika Sanitarna, 4, 9, 2005 [In Polish].
4. BAŁUT A., URBANIAK A. The selection criteria ofnumerical modeling tools for water supply networks. Gaz,Woda i Technika Sanitarna, 6, 11, 2009 [In Polish].
5. KLAWCZYŃSKA A. Modelling of the water distributionsystem. Wodociągi-Kanalizacja, 9, 30, 2006 [In Polish].
6. RUTKOWSKI T. From modeling by simulation to control.Wodociągi-Kanalizacja, 10, 12, 2005 [In Polish].
7. ZIMOCH I. The use of computer modeling to support theoperation process of the water supply system. Ochronaśrodowiska 3, 31, 2008 [In Polish].
8. HAIFENG J., WEI W., KUNLUN X. Hydraulic model formulti-sources reclaimed water pipe network based onEpanet and its applications in Beijing, China, Frontiers ofEnvironmental Science and Engineering in China, 2, 57,2008.
9. KOTOWSKI A., PAWLAK A., WÓJTOWICZ P. Modellingof urban water supply system on the example of housingestate in Rzeszów, Baranówka. Ochrona Środowiska, 2, 43,2010 [In Polish].
10. ROSSMAN L.A. Epanet 2 users manual, U.S. Epa,Cincinati 2000.
11. BAŁUT A., URBANIAK A. Verification and validation –the necessary steps of forming simulation model of watersupply network. Gaz, Woda i Technika Sanitarna, 4, 160,2012 [In Polish].
12. STUDZIŃSKI J. The use of monitoring data in the manage-ment urban water supply network, article written in theimplementation of the development project of the Ministryof Science and Higher Education No. R11 001 01, availableat: www.wr.utp.edu.pl/kiz/wzor_polski.doc [In Polish].
13. WALSKI T. M., CHASE D. V., SAVIC D. A., GRAYMANW., BECKWITH S., KOELLE E. Advanced water distribu-tion modeling and management, Haestad Press, Waterbury,2003.
A Hydraulic Model as a Useful Tool ... 1001
