short-term energy outlook market prices and uncertainty report - eia
TRANSCRIPT

U.S. Energy Information Administration | Short‐Term Energy Outlook March 2013 1
March 2013
Short-Term Energy Outlook Market Prices and Uncertainty Report
Crude Oil Prices: Crude oil prices declined in the latter half of February and into the first week of
March (Figure 1). The Brent front month futures contract settled at $111.15 per barrel on
March 7, $5.61 per barrel lower than its settlement price on February 1. The West Texas
Intermediate (WTI) crude oil front month futures price followed a similar price path to
Brent, declining by $6.21 per barrel since February 1 to settle at $91.56 on March 7.
Economic uncertainty in Europe as well as manufacturing data from China that was
below market expectations contributed to the recent crude oil price declines. The
unemployment rate for Eurozone countries increased to 11.9 percent in February, an
increase over last month and a record high. Additionally, the uncertain outcome of the
recent government elections in Italy has put into question future economic recovery and
reforms. In China, the February Purchasing Managers Index (a leading indicator for the
manufacturing sector) unexpectedly declined from January and is now just slightly
above the dividing line indicating likely expansion or contraction. This is a regular monthly companion to the EIA Short‐Term Energy Outlook (http://www.eia.gov/forecasts/steo/) Contact: James Preciado ([email protected])

U.S. Energy Information Administration | Short‐Term Energy Outlook March 2013 2
Backwardation (when near‐term prices are higher than further dated ones) in the Brent
futures curve peaked on February 8, when the 1st‐13th spread settled at $9.44 per barrel
(Figure 2). This was the second highest settle for the Brent 1st‐13th spread in the last year,
the highest occurring on March 1, 2012. Recent weakness in expectations for future
economic growth in Europe and in China have helped reduce tightness in the world
waterborne crude oil market, but backwardation in the market is still high compared to
historical levels.
The 1st‐13th spread for the WTI futures curve was flat for most of February and the first
week in March. The spread settled $1.14 per barrel on March 7. The first five months of
the WTI futures curve remain in contango while the next eight months are in
backwardation.
Currency: Expectations for the growth of the eurozone economy over the last month
were adversely affected by weak economic statistics as well as the uncertainty
surrounding the recent election in Italy. From February 13, when Brent crude oil prices
achieved their recent high, to March 7, Brent has declined by $7.57 per barrel, or about 6
percent (Figure 3). Over the same period, the euro‐dollar exchange rate has declined by
about 3 percent (since euros are quoted in dollars, the euro‐dollar exchange rate moves
inversely to the value of the U.S. dollar). These price movements are consistent with
investors lowering expectations for eurozone economic growth, leading to lower crude
oil and other commodity prices, and prefering assets with less exposure to Europe, thus
creating higher demand for other currencies such as the U.S. dollar.

U.S. Energy Information Administration | Short‐Term Energy Outlook March 2013 3
Energy and Non‐Energy Commodities: The energy component of the Goldman Sachs
Commodity Index (GSCI) increased by nearly 8 percent from December 1 to February 14
(Figure 4). Over the same time period, the non‐energy commodities sub‐index declined
by almost 5 percent. The rise of energy commodities in the face of declining prices in
other commodities may largely reflect reduced supply from major exporters (most
immediately affecting crude oil) and refinery outages around the Atlantic basin
(affecting gasoline prices especially). Recently, the two indexes have both moved
downward together.
Volatility: Front month implied volatility for both the Brent and WTI crude oil
benchmarks remained well below levels seen for most of 2012. They moved lower in the
first half of February before moving higher in the middle of the month. Brent implied
volatility settled at 18.3 percent and WTI implied volatilty settled at 19.5 percent on
March 7, nearly unchanged from their levels on February 1 (Figure 5). Recent economic
uncertainty in Europe and China has caused a leveling off of the declining volatility
trend seen in crude oil markets since October.

U.S. Energy Information Administration | Short‐Term Energy Outlook March 2013 4
Market‐Derived Probabilities: The June 2013 WTI futures contract averaged $91.59 per
barrel for the five trading days ending March 7 and has a probability of exceeding $100
per barrel at expiration of approximately 18 percent. The same contract for the five
trading days ending February 1 had a probability of exceeding $100 of 43 percent
(Figure 6). Given the elevated price of Brent relative to WTI, the probability of Brent
futures contracts expiring above the same dollar thresholds are higher.
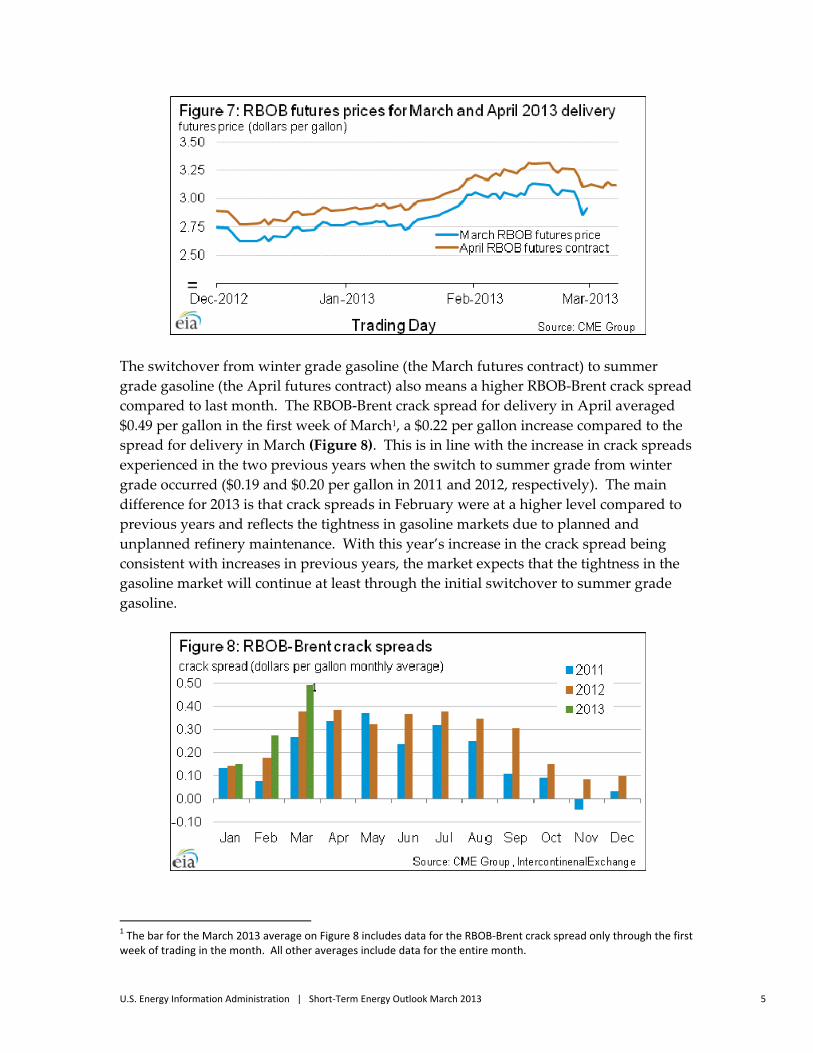
Gasoline Prices: The first trading day of March marks the switchover of the front month RBOB
gasoline futures contract from delivery in March to delivery in April and the change
from winter grade to summer grade gasoline. Summer grade gasoline trades at a
premium to winter grade gasoline as reflected in the persistent difference between the
March and April futures contracts (Figure 7). The April RBOB futures contract settled at
$3.12 per gallon on March 7, $0.08 per gallon lower than the settlement for that contract
on February 1.
U.S. Energy Information Administration | Short‐Term Energy Outlook March 2013 5
The switchover from winter grade gasoline (the March futures contract) to summer
grade gasoline (the April futures contract) also means a higher RBOB‐Brent crack spread
compared to last month. The RBOB‐Brent crack spread for delivery in April averaged
$0.49 per gallon in the first week of March1, a $0.22 per gallon increase compared to the
spread for delivery in March (Figure 8). This is in line with the increase in crack spreads
experienced in the two previous years when the switch to summer grade from winter
grade occurred ($0.19 and $0.20 per gallon in 2011 and 2012, respectively). The main
difference for 2013 is that crack spreads in February were at a higher level compared to
previous years and reflects the tightness in gasoline markets due to planned and
unplanned refinery maintenance. With this year’s increase in the crack spread being
consistent with increases in previous years, the market expects that the tightness in the
gasoline market will continue at least through the initial switchover to summer grade
gasoline.
1 The bar for the March 2013 average on Figure 8 includes data for the RBOB‐Brent crack spread only through the first week of trading in the month. All other averages include data for the entire month.
U.S. Energy Information Administration | Short‐Term Energy Outlook March 2013 6
Volatility: Historical and implied volatilty for the front month RBOB futures contract
moved higher in February, while remaining lower than levels seen in the second half of
2012. Historical volatility increased by 7.8 percentage points compared to February 1 to
settle at 25.0 percent on March 7, while implied volatility increased by 2.6 percentage
points to settle at 22.2 percent over the same time (Figure 9).
Market‐Derived Probabilities: The June 2013 RBOB futures contract averaged $3.04 per
gallon for the five trading days ending March 7 and has a probability of exceeding $3.35
per gallon (typically leading to a retail price of $4.00 per gallon) at expiration of
approximately 16 percent. The same contract for the five trading days ending February
1 had a probability of exceeding $3.35 of 21 percent (Figure 10).
Heating oil Prices: The front month heating oil futures contract settled at $2.98 per gallon on March
7, a decrease of 0.18 per gallon from February 1. The front month futures crack spread

U.S. Energy Information Administration | Short‐Term Energy Outlook March 2013 7
between heating oil and Brent settled at $0.33 per gallon on March 7, a decline from its
levels in early February (Figure 11).
The recent drop in the price of the front month heating oil contract was partially due to
the drop in crude oil prices but a loosening of the international middle distillate market
also played a part. The heating oil‐Brent crack spread hit its lowest point since June 2012
on March 4. Economic worries surrounding China and countries in Europe, where
middle distillates are used more heavily as transportation fuels compared to the U.S.,
may be applying extra downside pressure to heating oil prices compared to gasoline
prices.
The heating oil market is currently showing considerably less backwardation than the
Brent futures curve over the next year. The front month‐13th month time spread for the
heating oil‐Brent crack spread (which shows anticipated tightness in the middle
distillate market compared to crude oil) settled at ‐0.19 per gallon on March 4, hitting the
lowest point in over a year. This indicates the market is providing very little incentive to
sell heating oil and other middle distillates out of inventories right now and is a sign
that the heating oil market is currently well supplied (Figure 12).

U.S. Energy Information Administration | Short‐Term Energy Outlook March 2013 8
Volatility: Heating oil historical volatility and implied volatility both increased from
early February to the first week in March (Figure 13). Historical realized 30‐day
volatility was 15.0 percent on March 7, a rise of 0.6 percentage points since February 1,
while implied volatility settled at 20.4 percent on March 7, an increase of 3.7 percentage
point from February 1. The moves are consistent with the increased volatility seen in
crude oil prices over the same period.
Market‐Derived Probabilities: The June 2013 heating oil futures contract averaged $3.02
per gallon for the five trading days ending March 7 and has a probability of exceeding
$3.50 per gallon at expiration of approximately 5 percent. The same contract for the five
trading days ending February 1 had a probability of exceeding $3.50 of 13 percent
(Figure 14).

U.S. Energy Information Administration | Short‐Term Energy Outlook March 2013 9
Natural Gas Prices: The front month futures price settled at $3.58 per MMBtu on March 7, increasing
$0.28 per MMBtu from the price on February 1 (Figure 15).
Colder weather than last year contributed to increases in residential and commercial
consumption and higher overall natural gas consumption over the past month.
According to EIA, storage level is 361 Bcf lower than last year, but 269 Bcf higher than 5‐
year average. Prices have been oscillating in a relatively narrow range.
New England Basis: The New England basis, or the difference of spot prices between
Henry Hub and New England, has been unusually volatile, even though this winter has
been warmer than normal in terms of heating‐degree‐days (HDDs).
The basis movement has been unprecedented by several measures. First, the high
average basis in the four winter months (November to February) is $6.85 in 2012‐13,
more than double the previous historical highs of $2.83 in 2007‐08, $2.79 in 2010‐11 and
$2.10 in 2003‐04. This occurred even though the winter 2010‐11 was much colder than
winter 2012‐13. In addition, the frequency of basis exceeding $10 is a record‐high 28
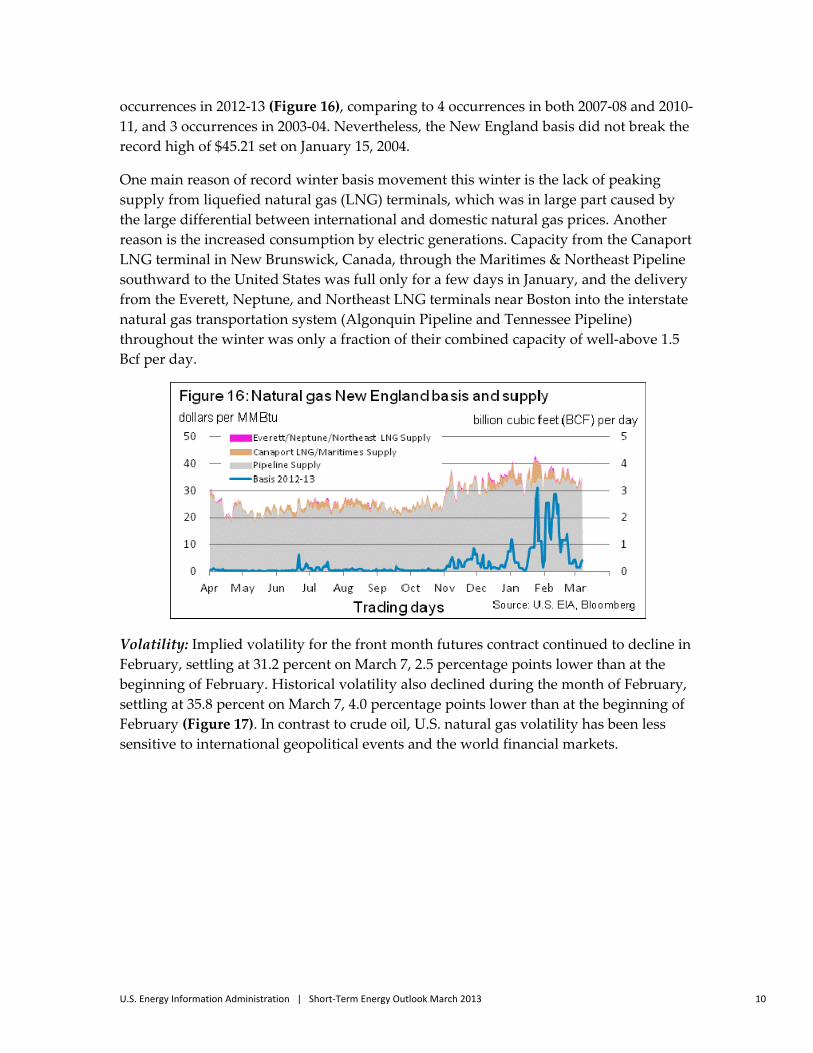
U.S. Energy Information Administration | Short‐Term Energy Outlook March 2013 10
occurrences in 2012‐13 (Figure 16), comparing to 4 occurrences in both 2007‐08 and 2010‐
11, and 3 occurrences in 2003‐04. Nevertheless, the New England basis did not break the
record high of $45.21 set on January 15, 2004.
One main reason of record winter basis movement this winter is the lack of peaking
supply from liquefied natural gas (LNG) terminals, which was in large part caused by
the large differential between international and domestic natural gas prices. Another
reason is the increased consumption by electric generations. Capacity from the Canaport
LNG terminal in New Brunswick, Canada, through the Maritimes & Northeast Pipeline
southward to the United States was full only for a few days in January, and the delivery
from the Everett, Neptune, and Northeast LNG terminals near Boston into the interstate
natural gas transportation system (Algonquin Pipeline and Tennessee Pipeline)
throughout the winter was only a fraction of their combined capacity of well‐above 1.5
Bcf per day.
Volatility: Implied volatility for the front month futures contract continued to decline in
February, settling at 31.2 percent on March 7, 2.5 percentage points lower than at the
beginning of February. Historical volatility also declined during the month of February,
settling at 35.8 percent on March 7, 4.0 percentage points lower than at the beginning of
February (Figure 17). In contrast to crude oil, U.S. natural gas volatility has been less
sensitive to international geopolitical events and the world financial markets.

U.S. Energy Information Administration | Short‐Term Energy Outlook March 2013 11
Market Derived Probabilities: The probability that the June 2013 contract will settle
higher than $4.00 per MMBtu remained almost unchanged at 20 percent when compared
to market conditions on the five trading days ending February 1, as a result of the
increase in price and decrease in volatility and time till expiration (Figure 18).
Futures and Swaps: As supplements to the New York Mercantile Exchange (Nymex)
natural gas futures market, financial swaps are traded on Nymex, Intercontinental
Exchange (ICE), and other over‐the‐counter (OTC) markets. Futures contracts can be
used to deliver physical natural gas at Henry Hub. In contrast, financial swaps are
financially settled based on end‐of‐day futures prices. Open interest of the combined
Nymex/ICE swaps market is more than double that of the futures open interest (Figure
19).

U.S. Energy Information Administration | Short‐Term Energy Outlook March 2013 12
Many analysts follow the net trading positions of Managed Money investors reported in
the weekly report Commitment of Traders (COT), issued by the Commodity Futures
Trading Commission (CFTC), for indications of market sentiment. However, the net
positions of different trader categories are not always the same in different markets. For
example, while managed money traders have usually been net short in the futures
market over the past three years, the same trading group has been net long in the swaps
markets for most of that same time (Figure 20). It is important to note when conducting
analyses of futures trading that substantial trading occurs in the over‐the‐counter
markets.