si jacs revised-2017-1-09 - temple university · nm were considered for statistical analysis of the...
TRANSCRIPT
S1
Supporting Information
Effect of interlayer spacing on the activity of layered manganese
oxide bilayer catalysts for the oxygen evolution reaction
Qing Kang1,2,4, Loranne Vernisse 1,2, Richard C. Remsing1,2,3 Akila C. Thenuwara1,2, Samantha L.
Shumlas1,2, Ian G. McKendry1,2, Michael L. Klein1,2,3, Eric Borguet1,2, Michael J. Zdilla1,2, and Daniel
R. Strongin1,2,*
1 Department of Chemistry, Temple University, Beury Hall, 1901 North 13th Street, Philadelphia,
Pennsylvania 19122, United States
2 Center for the Computational Design of Functional Layered Materials (CCDM), Temple University,
Philadelphia, Pennsylvania 19122, United States
3 Institute for Computational Molecular Science, Temple University, SERC, 1925 North 12th Street,
Philadelphia, Pennsylvania 19122, United States
4 Present address: School of Materials Science and Engineering, Key Laboratory of Advanced Energy
Storage Materials of Guangdong Province, South China University of Technology, Guangzhou 510641,
P.R. China
Corresponding Author: [email protected]

S2
Figure S1. TEM image of a single-layer PEI/NS sample.
S3
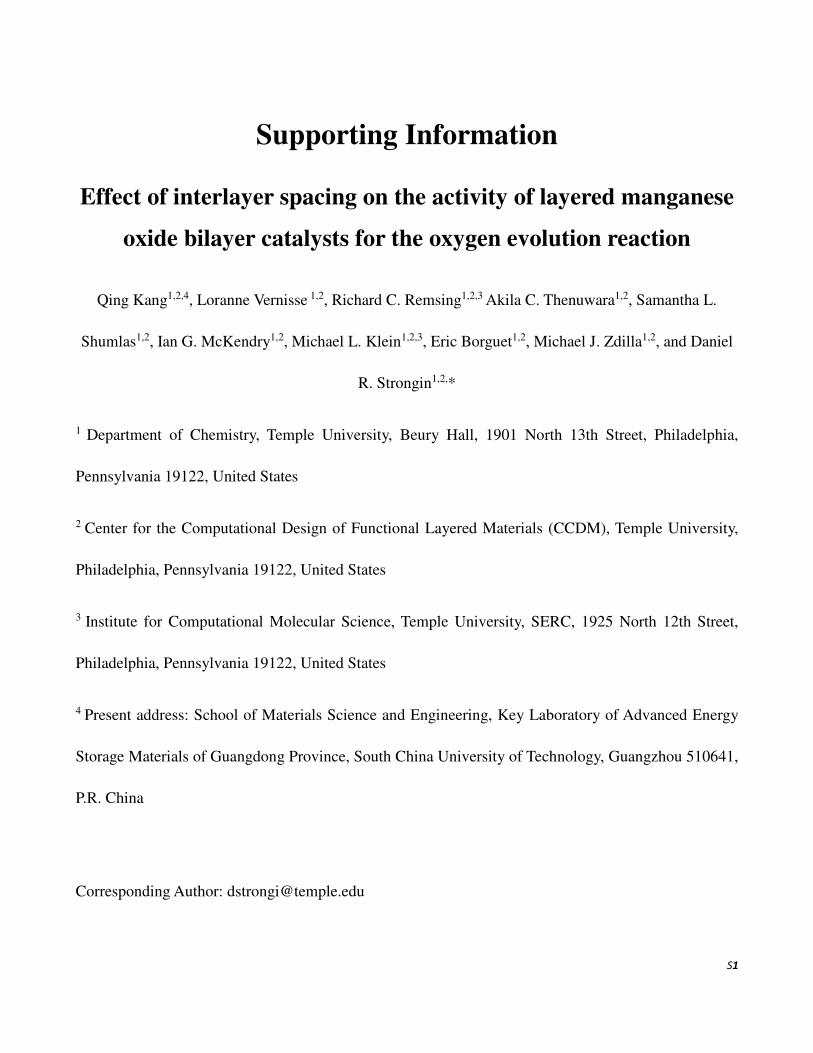
AFM experiments
For AFM analysis, the monolayer and bilayer materials were assembled on highly ordered pyrolytic
graphite (HOPG) which provided a much flatter and featureless supporting substrate than FTO. PEI was
not used prior to the material deposition in order to avoid the tip and surface contamination. The MnO2
NS were deposited on a freshly cleaved HOPG surface using a drop-retract protocol. A drop of the MnO2
suspension (100 mL) was first drop-cast on the HOPG surface. The droplet was removed after a 10 min.
exposure and the ultrathin NS film was dried in air in the AFM isolation chamber. For bilayer NS/M+/NS
(M+ = Li+, Na+, K+, Rb+, and Cs+) film, the deposition protocol consisted of similar steps:
Step I: Drop-cast deposition of 100 mL NS suspension, removed the droplet after 10 min., and dried the
film in air.
Step II: Drop-cast deposition of 100 mL 0.5 mM MCl solution, removed the droplet after 10 min., and
dried the film in air.
Step III: Drop-cast deposition of 100 mL NS suspension, removed the droplet after 10 min., and dried
the film in air.
Figure S2. AFM image of bilayer NS/Cs+/NS showing monolayer NS (in green frames), bilayer NS (in
yellow frames) and multilayer NS (in blue frames).
Figure S2 shows that some monolayer and multilayer NS existed along with the NS/Cs+/NS bilayer
sample. After a statistical analysis of different images, it was determined that the bilayer structure
accounted for at least 75% of the features (5% monolayer NS and 20% multilayer NS where the # of
NS was greater than 2 in the structure).
S4
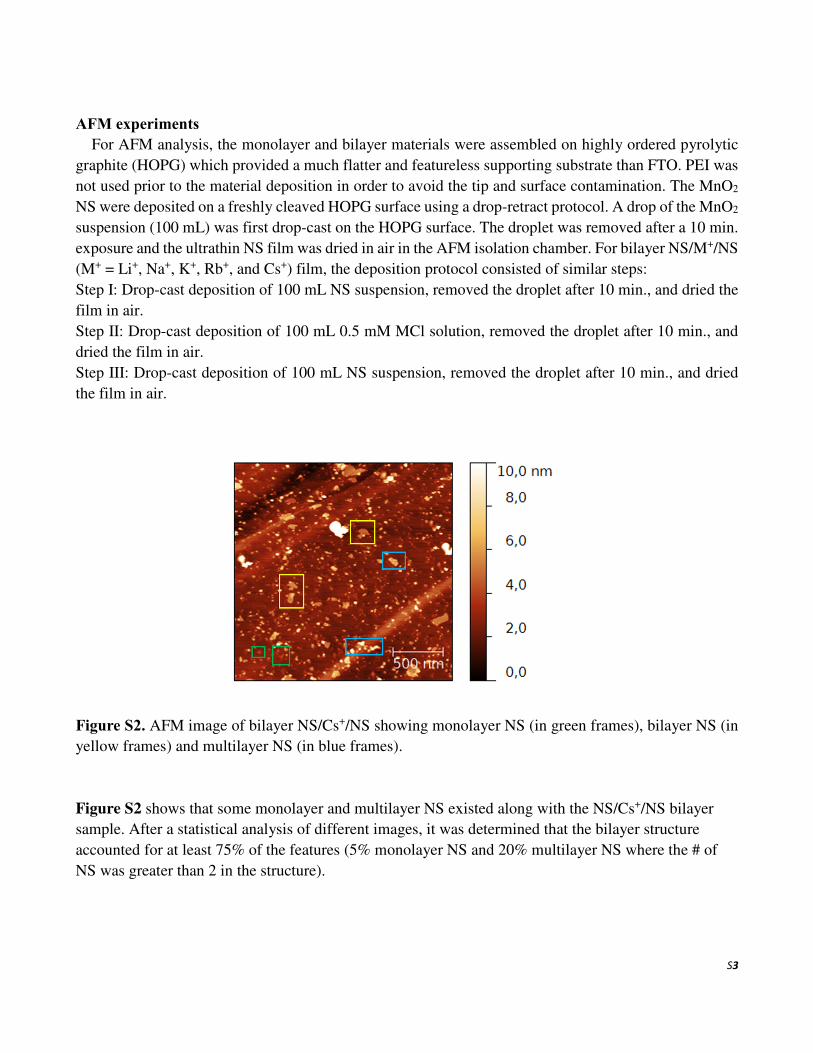
Figure S3. (a) AFM image of bilayer NS/Na+/NS showing rare instances where small NS appeared to
be adsorbed on large NS.

S5
Figure S4. AFM images of bilayer (a) NS/Li+/NS, (b) NS/Na+/NS, (c) NS/Rb+/NS, and (d) NS/Cs+/NS
films.
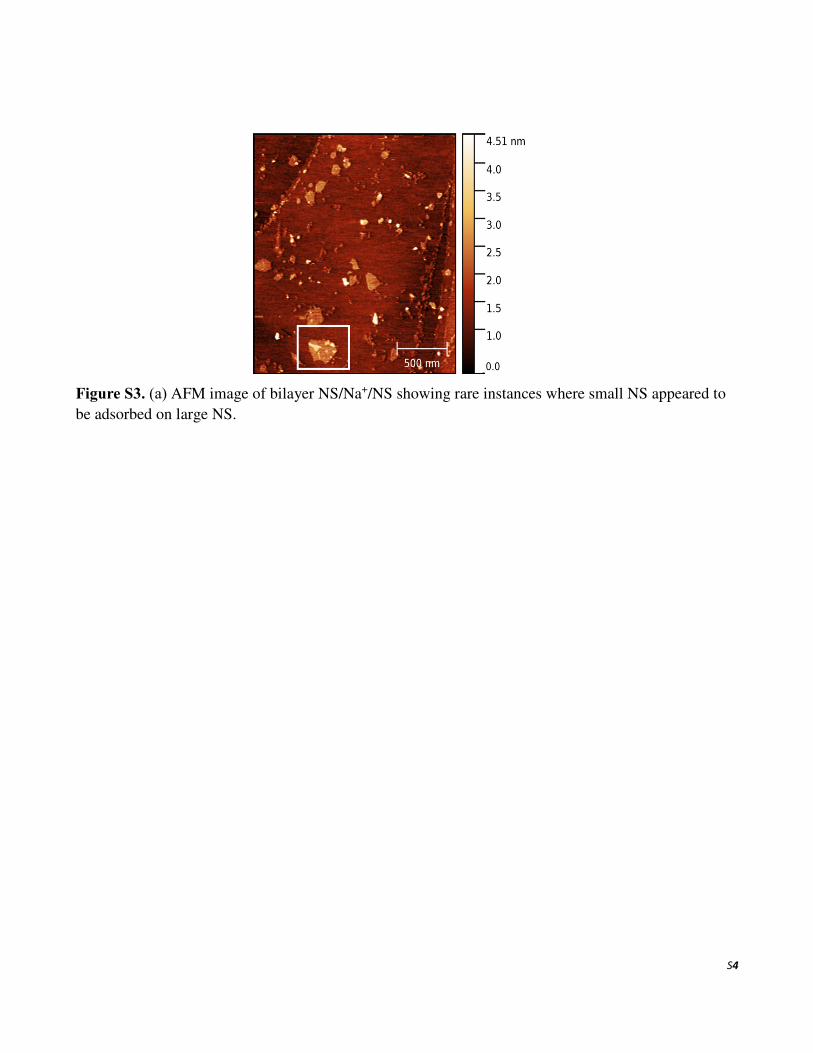
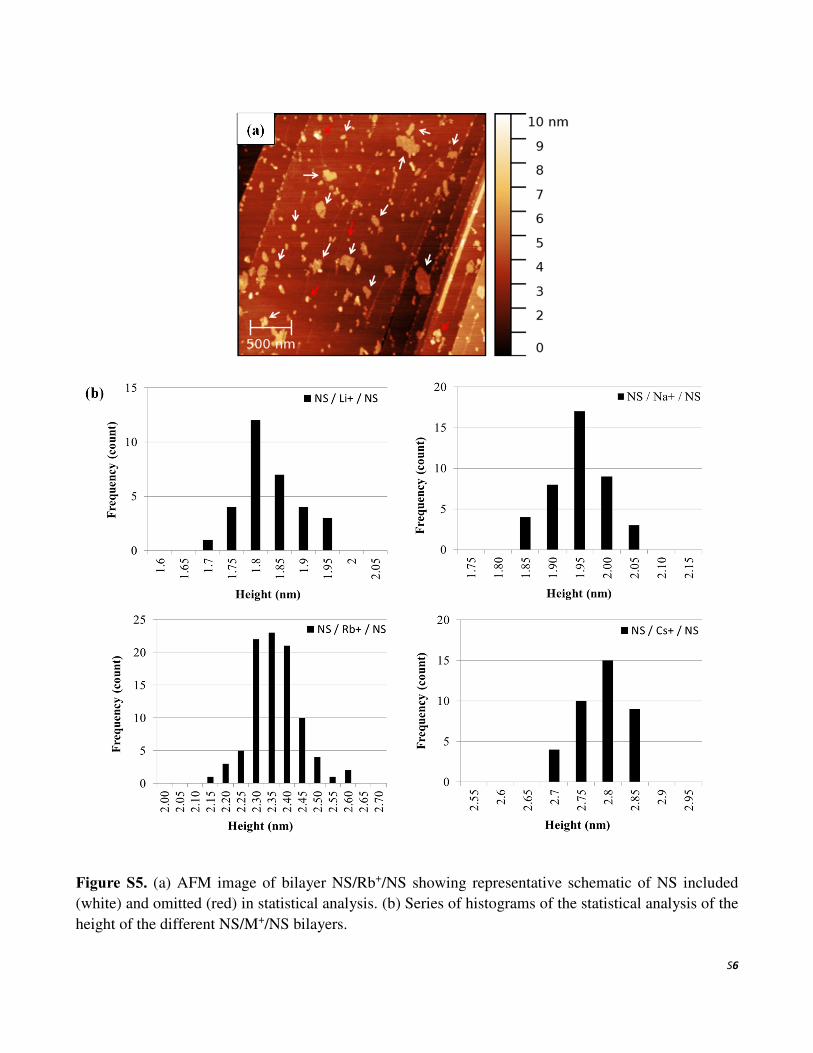
Multiple images per sample were recorded. For analysis, all objects within an image were measured.
Given the presence of a minority amount of multilayer NS (individual layered structures with more than
2 NS), only objects with a height close to the height of interest were taken into account and included in
the statistical analysis. For example, only objects within the 1-3.5 nm range with a lateral size above 50
nm were considered for statistical analysis of the bilayer NS height. A representative schematic of NS
included and omitted in statistical analysis is shown Figure S5a. This protocol was repeated for each
image to obtain the final values. Histograms showing the frequency of NS/M+/NS bilayer heights are
shown in Figure S5b.
S6
Figure S5. (a) AFM image of bilayer NS/Rb+/NS showing representative schematic of NS included
(white) and omitted (red) in statistical analysis. (b) Series of histograms of the statistical analysis of the
height of the different NS/M+/NS bilayers.
S7
Ion Adsorption to MnO2 Nanosheets
Much of the conclusions made regarding the assembly of the bilayer structures can be tied to the
driving forces for ion adsorption to the MnO2 surface. To understand these forces, we investigated the
adsorption of cations to a single MnO2 surface using molecular dynamics (MD) simulations. The
simulations were performed in the same manner as those in the main text, however, only a single MnO2
sheet was present in the system. We then characterized the structure and thermodynamics of these
systems.
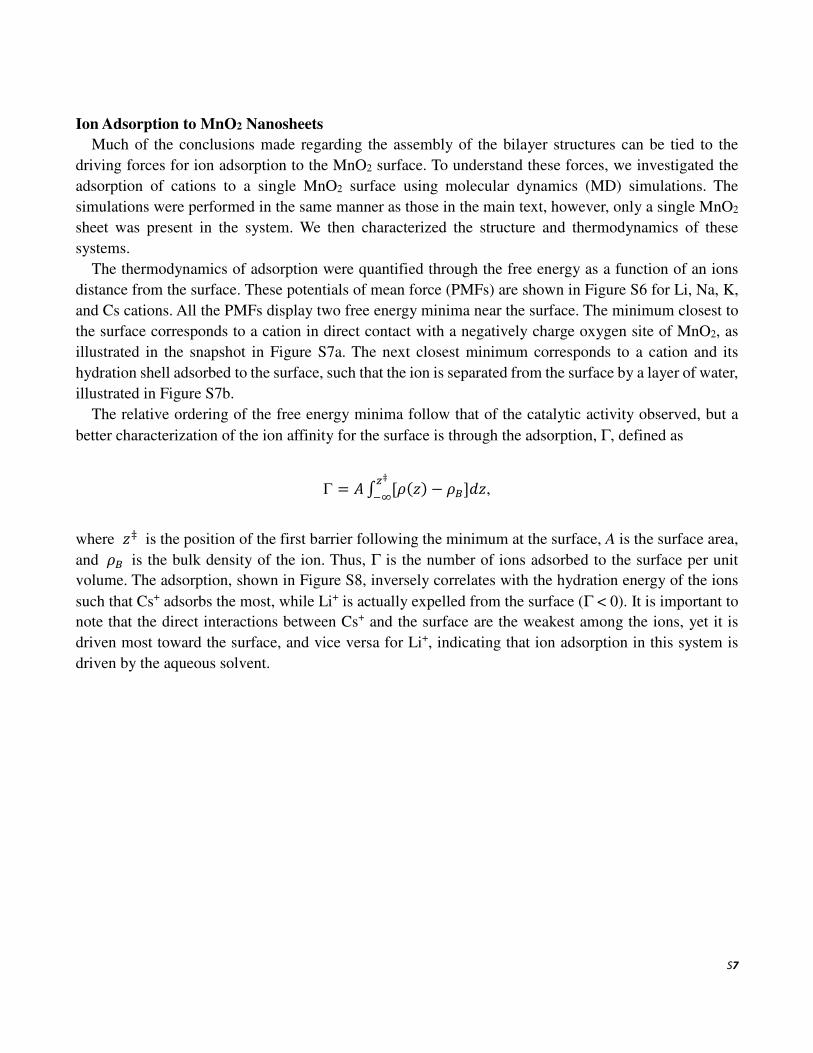
The thermodynamics of adsorption were quantified through the free energy as a function of an ions
distance from the surface. These potentials of mean force (PMFs) are shown in Figure S6 for Li, Na, K,
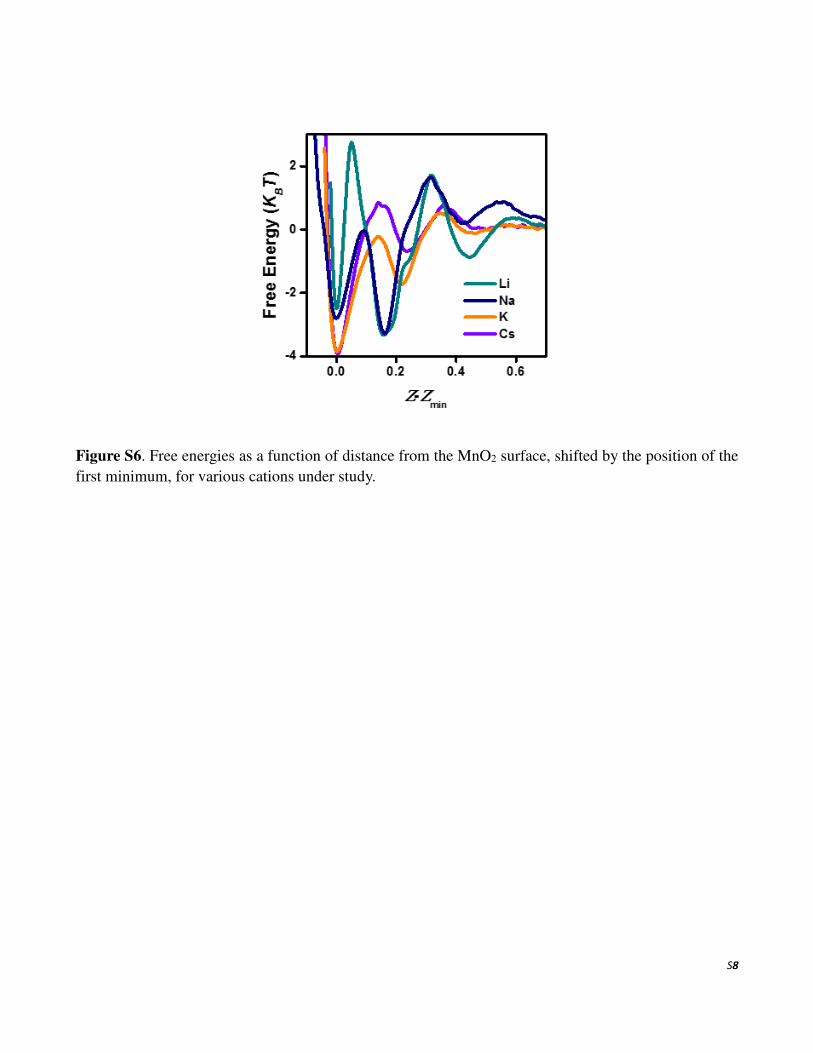
and Cs cations. All the PMFs display two free energy minima near the surface. The minimum closest to
the surface corresponds to a cation in direct contact with a negatively charge oxygen site of MnO2, as
illustrated in the snapshot in Figure S7a. The next closest minimum corresponds to a cation and its
hydration shell adsorbed to the surface, such that the ion is separated from the surface by a layer of water,
illustrated in Figure S7b.
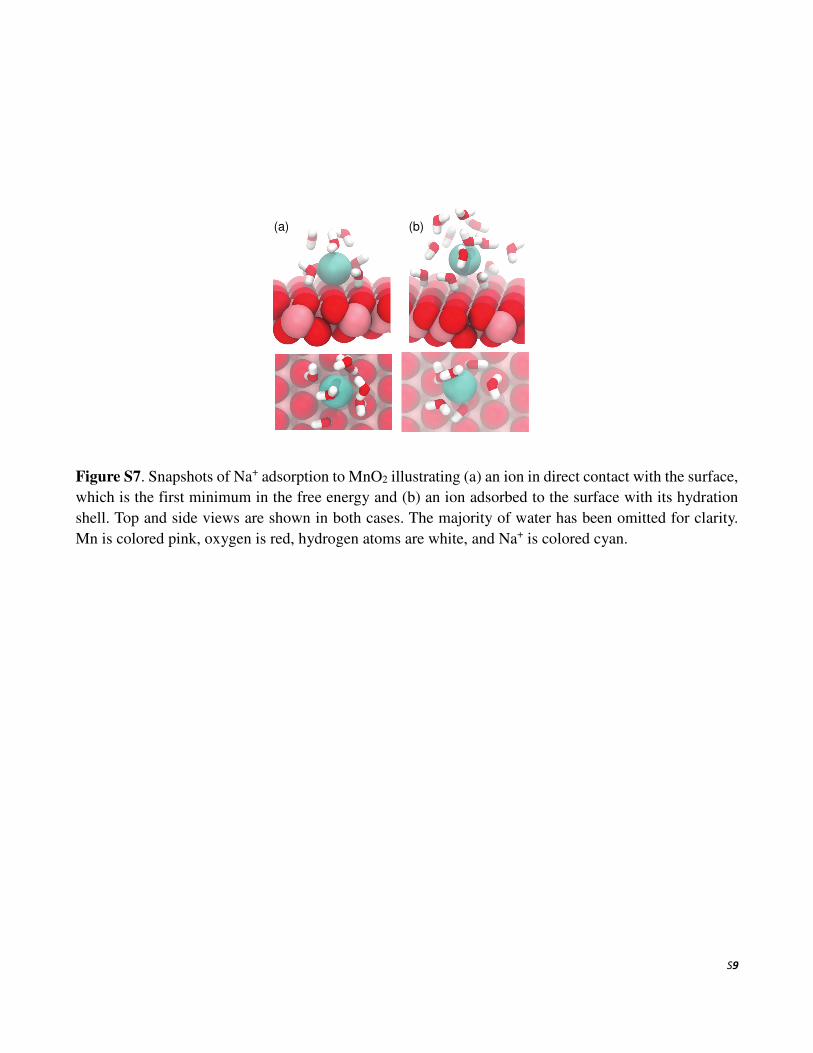
The relative ordering of the free energy minima follow that of the catalytic activity observed, but a
better characterization of the ion affinity for the surface is through the adsorption, Γ, defined as
Γ = �� [���� − �]�� ‡
��,
where �‡ is the position of the first barrier following the minimum at the surface, A is the surface area,
and � is the bulk density of the ion. Thus, Γ is the number of ions adsorbed to the surface per unit
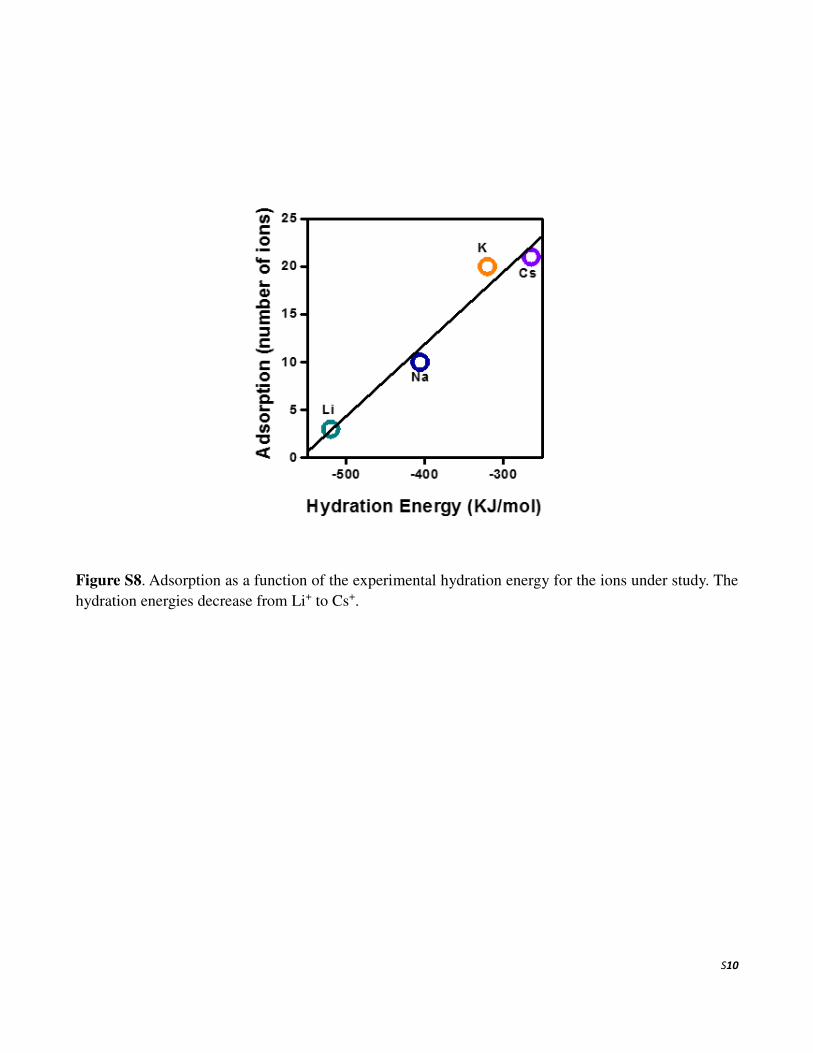
volume. The adsorption, shown in Figure S8, inversely correlates with the hydration energy of the ions
such that Cs+ adsorbs the most, while Li+ is actually expelled from the surface (Γ < 0). It is important to
note that the direct interactions between Cs+ and the surface are the weakest among the ions, yet it is
driven most toward the surface, and vice versa for Li+, indicating that ion adsorption in this system is
driven by the aqueous solvent.
S8
Figure S6. Free energies as a function of distance from the MnO2 surface, shifted by the position of the
first minimum, for various cations under study.
S9
Figure S7. Snapshots of Na+ adsorption to MnO2 illustrating (a) an ion in direct contact with the surface,
which is the first minimum in the free energy and (b) an ion adsorbed to the surface with its hydration
shell. Top and side views are shown in both cases. The majority of water has been omitted for clarity.
Mn is colored pink, oxygen is red, hydrogen atoms are white, and Na+ is colored cyan.
(a) (b)
S10
Figure S8. Adsorption as a function of the experimental hydration energy for the ions under study. The
hydration energies decrease from Li+ to Cs+.
S11
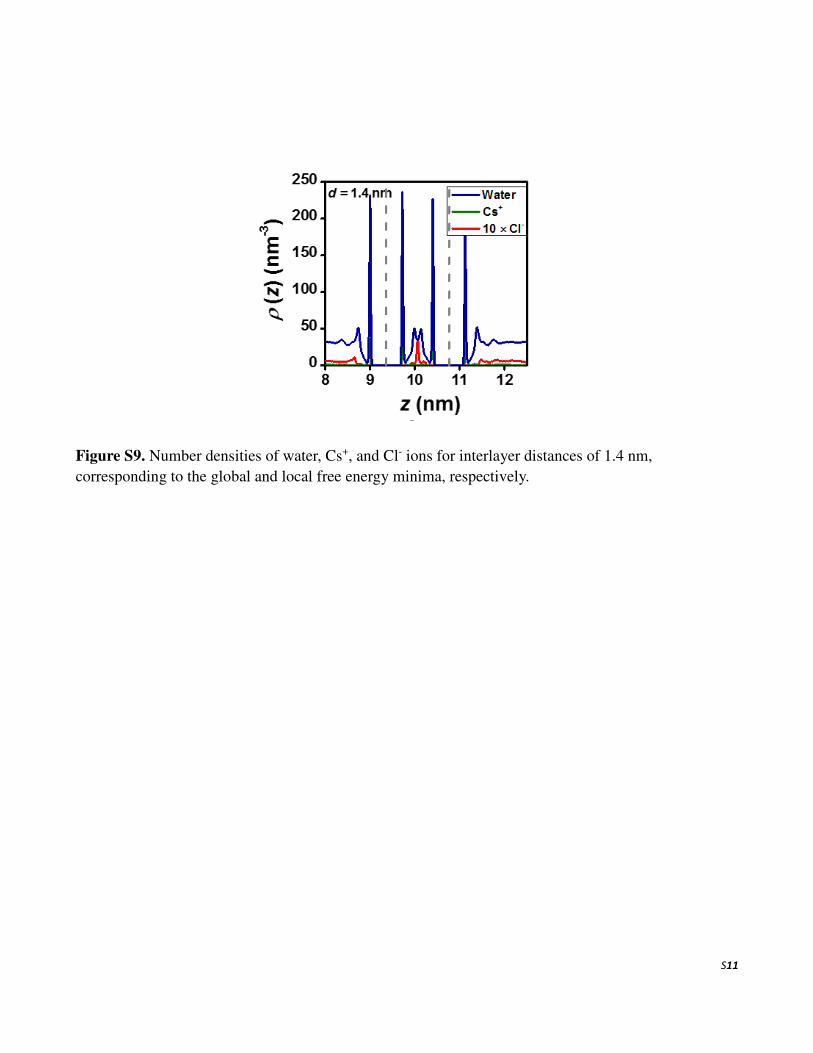
Figure S9. Number densities of water, Cs+, and Cl- ions for interlayer distances of 1.4 nm,
corresponding to the global and local free energy minima, respectively.
S12
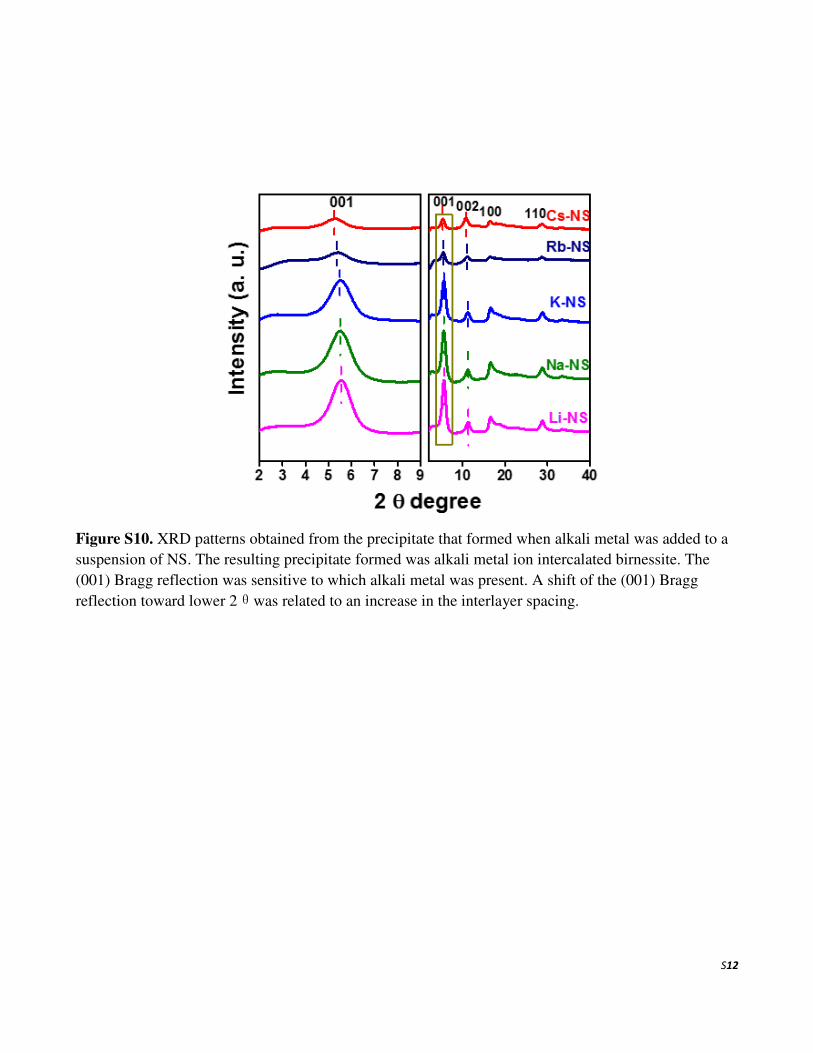
Figure S10. XRD patterns obtained from the precipitate that formed when alkali metal was added to a
suspension of NS. The resulting precipitate formed was alkali metal ion intercalated birnessite. The
(001) Bragg reflection was sensitive to which alkali metal was present. A shift of the (001) Bragg
reflection toward lower 2θwas related to an increase in the interlayer spacing.
S13
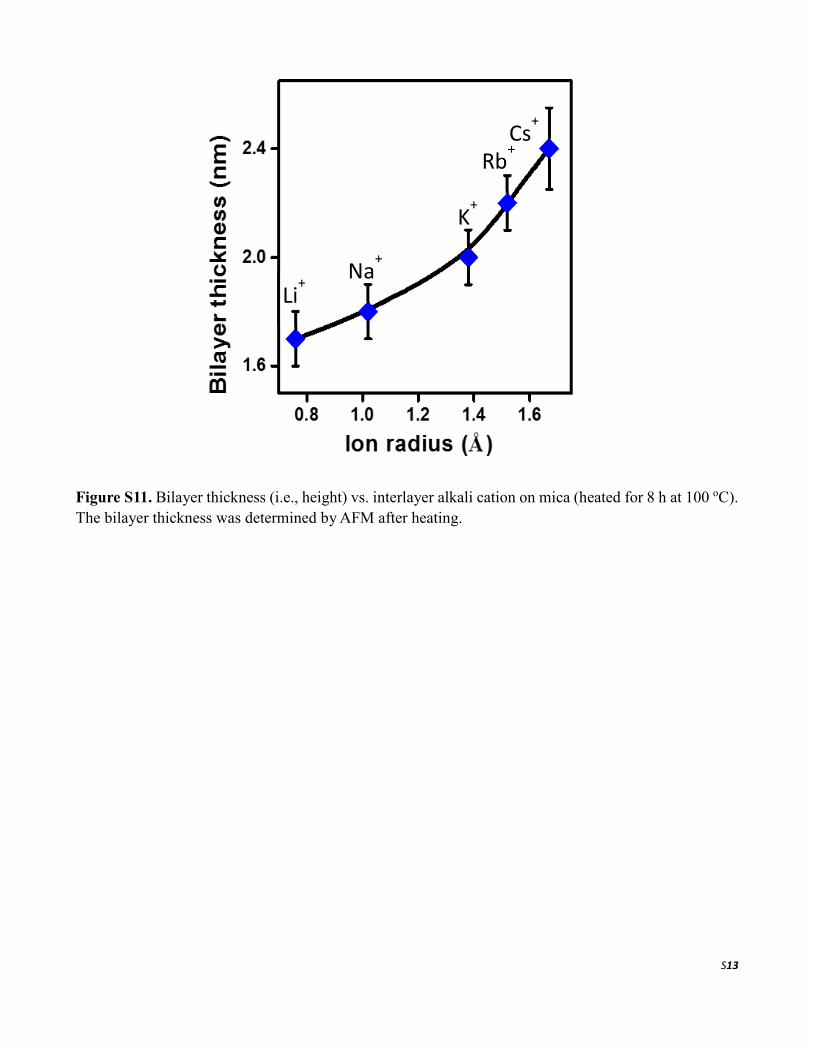
Figure S11. Bilayer thickness (i.e., height) vs. interlayer alkali cation on mica (heated for 8 h at 100 oC).
The bilayer thickness was determined by AFM after heating.
Li+
Na+
K+
Rb+
Cs+
S14
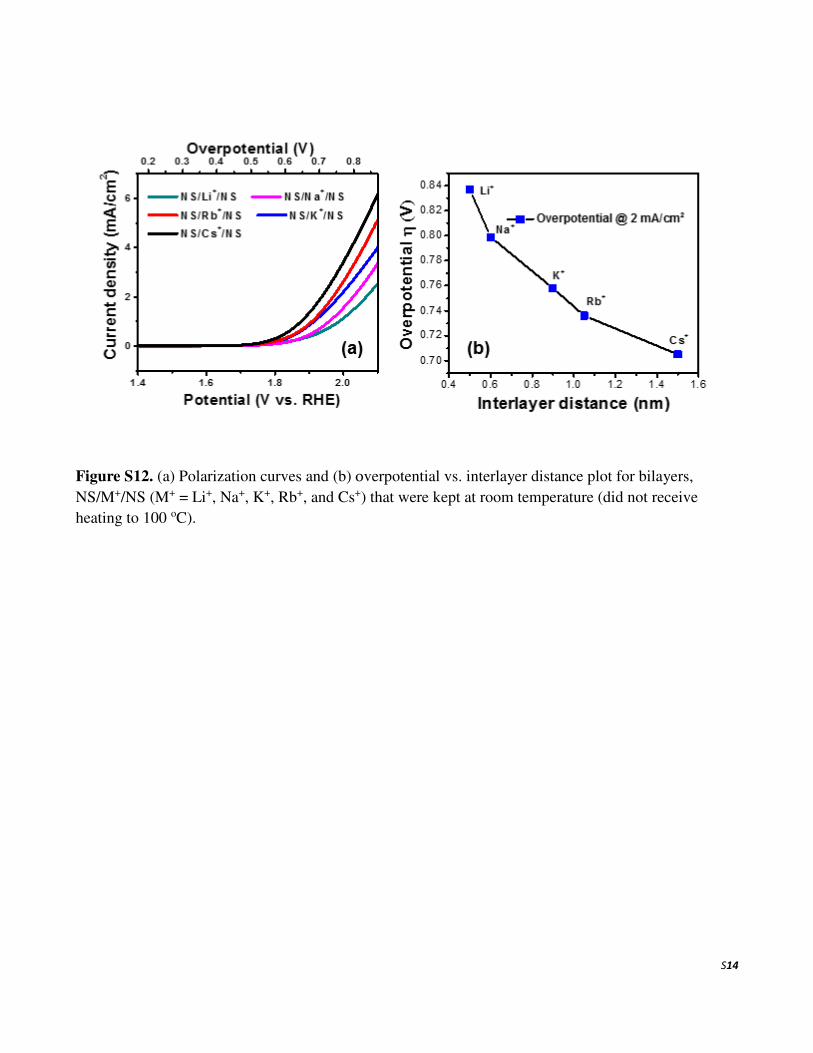
Figure S12. (a) Polarization curves and (b) overpotential vs. interlayer distance plot for bilayers,
NS/M+/NS (M+ = Li+, Na+, K+, Rb+, and Cs+) that were kept at room temperature (did not receive
heating to 100 oC).
S15
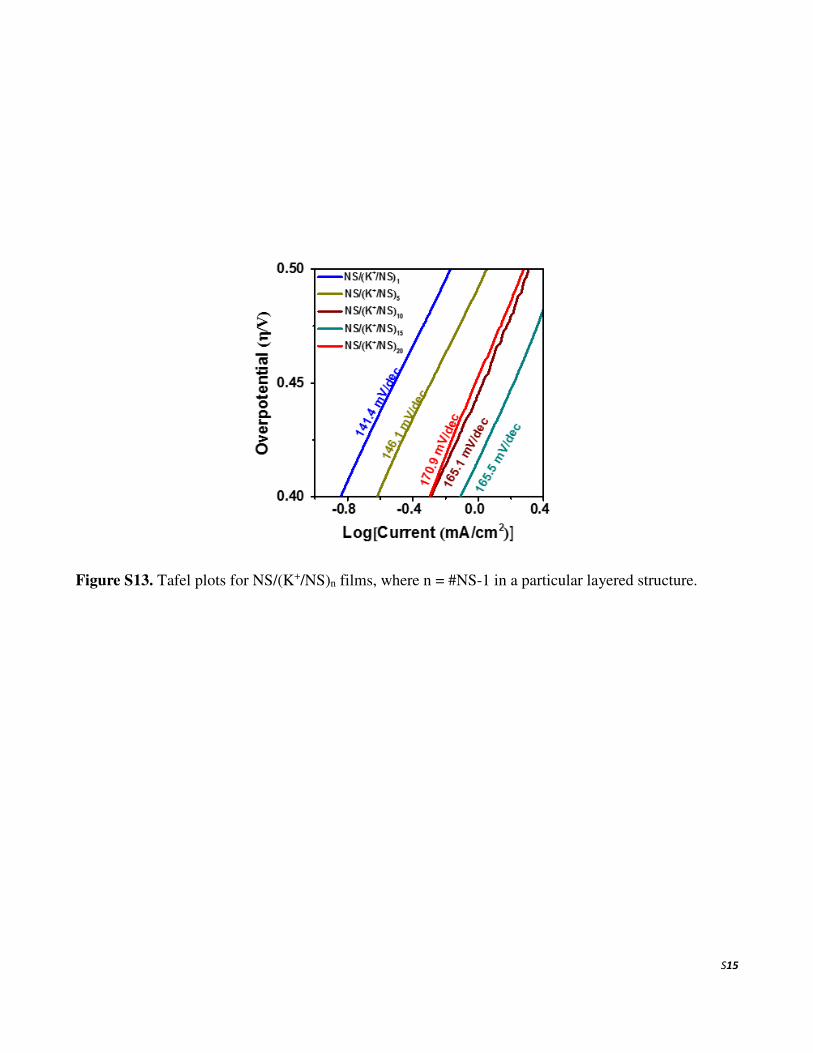
Figure S13. Tafel plots for NS/(K+/NS)n films, where n = #NS-1 in a particular layered structure.
S16
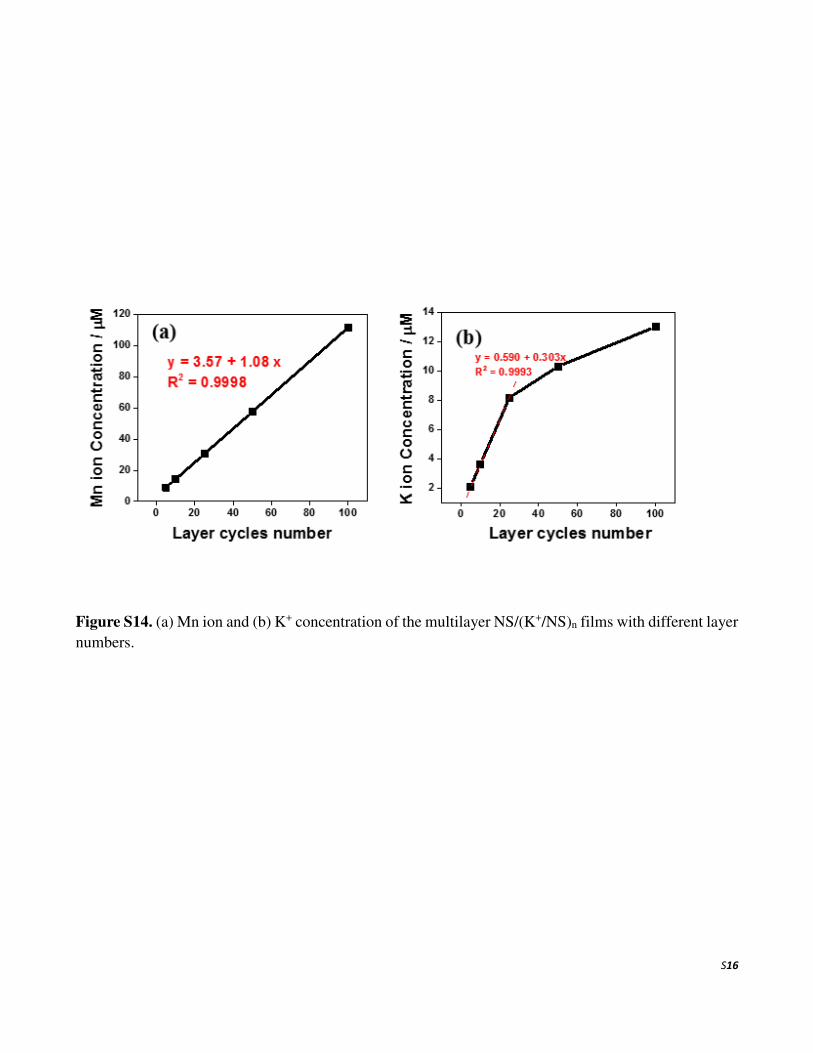
Figure S14. (a) Mn ion and (b) K+ concentration of the multilayer NS/(K+/NS)n films with different layer
numbers.
S17
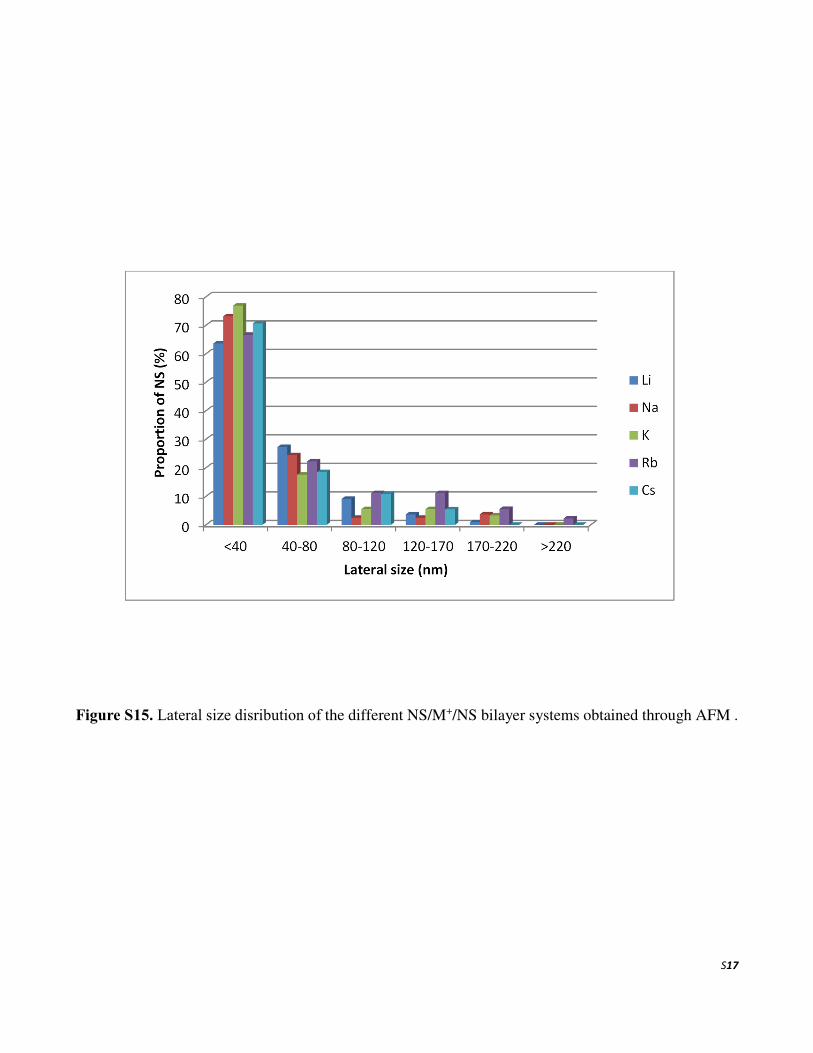
Figure S15. Lateral size disribution of the different NS/M+/NS bilayer systems obtained through AFM .
S18
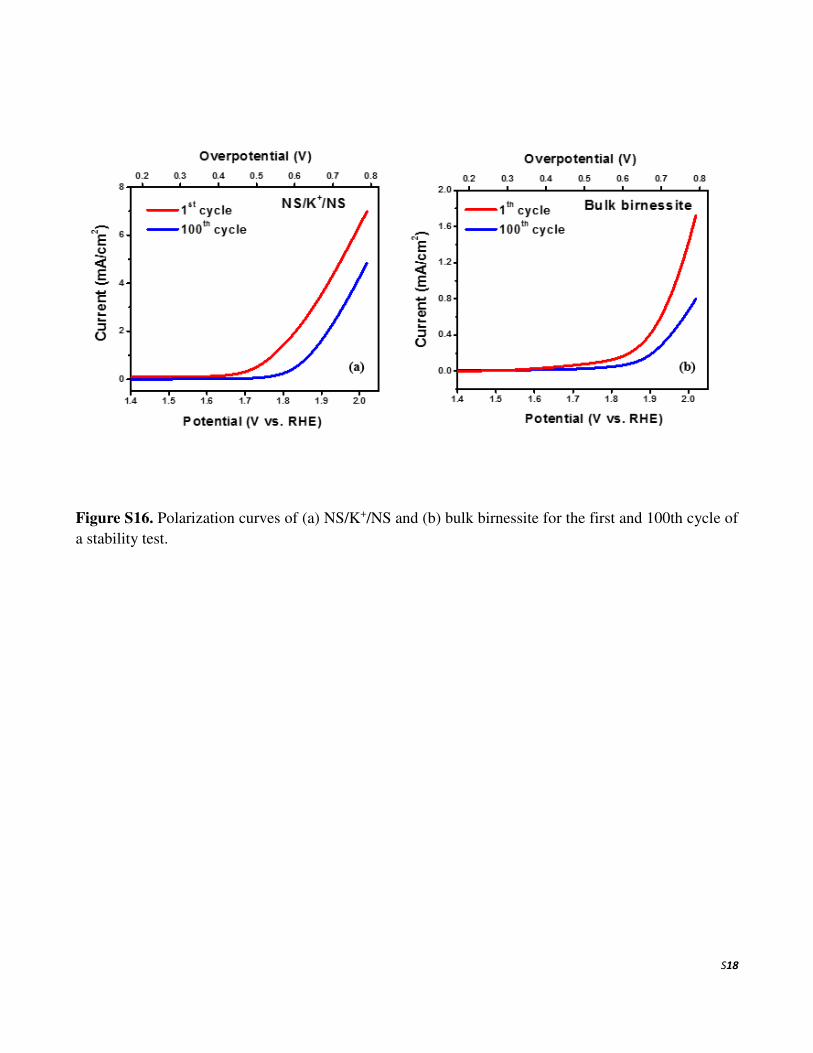
Figure S16. Polarization curves of (a) NS/K+/NS and (b) bulk birnessite for the first and 100th cycle of
a stability test.
S19
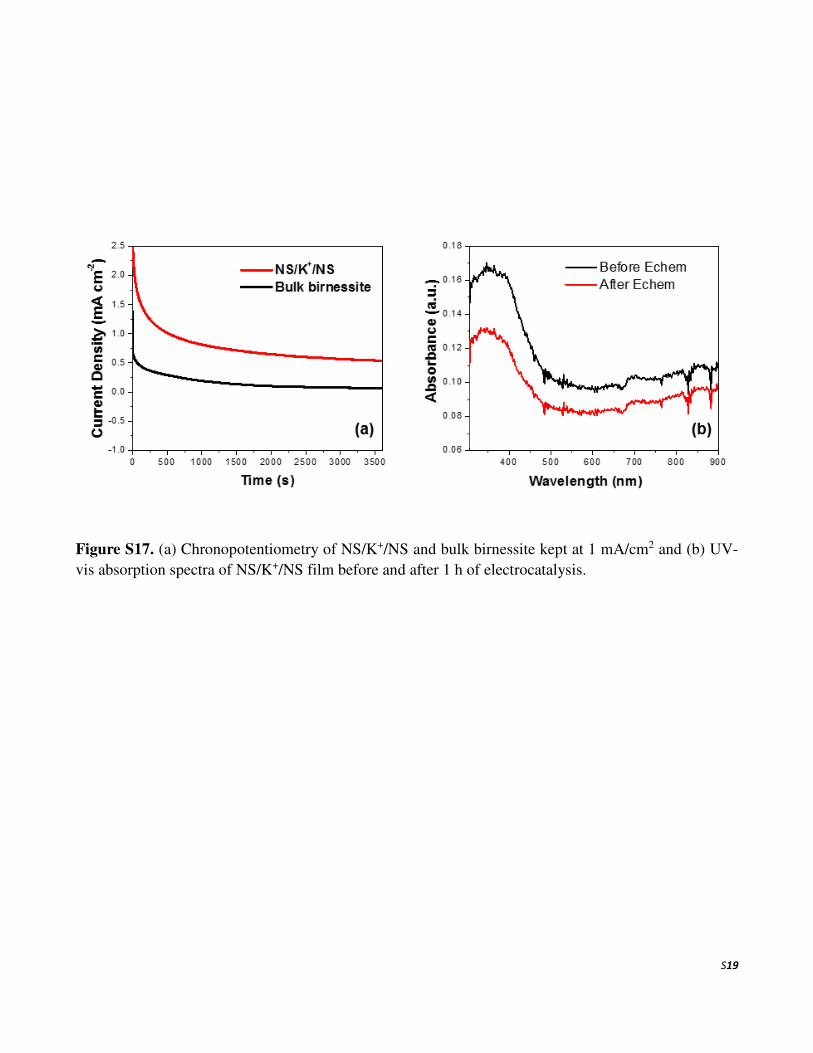
Figure S17. (a) Chronopotentiometry of NS/K+/NS and bulk birnessite kept at 1 mA/cm2 and (b) UV-
vis absorption spectra of NS/K+/NS film before and after 1 h of electrocatalysis.