signal processing for ultrasonic testing of stainless
TRANSCRIPT

SE0100070
SKI Report 00:9
Signal Processing for Ultrasonic Testingof Stainless Steel with Coarse Structure
Sven DahlgrenLars Ericsson
Mars 2000
ISSN 1104-1374 * $ISRNSKI-R--00/9-SE ** £ SKi

PLEASE BE AWARE THATALL OF THE MISSING PAGES IN THIS DOCUMENT
WERE ORIGINALLY BLANK

SKI Report 00:9
Signal Processing for Ultrasonic Testingof Stainless Steel with Coarse Structure
Sven Dahlgren1
Lars Ericsson2
]ABB TRCP.O. Box 121SE-183 22 TabySweden
2Uppsala UniversitySignal and SystemsP.O. Box 528SE-751 20 UppsalaSweden
Mars 2000
SKI Project Number 96160
This report concerns a study which hasbeen conducted for the Swedish NuclearPower Inspectorate (SKI). The conclusionsand viewpoints presented in the reportare those of the authors and do notnecessarily coincide with those of the SKI.

Contents
I Summary 1
II Sammanfattning 3
1 Introduction 5
2 Noncoherent Detection - Theory 7
3 Development of NCD Tuning Algorithms 103.1 Performance Measure Based on Signal-to-Noise Ratio 103.2 Performance Measure Based on Signal Entropy 12
4 Project Structure 134.1 Phase 1 134.2 Phase 2 14
4.2.1 Transducers 144.3 Phase 3 14
4.3.1 Objects 144.3.2 Transducers 16
5 Results 175.1 Phase 1 175.2 Phase 2 20
5.2.1 Inspection Procedure 205.2.2 Signal Processing Results 20
5.3 Phase 3 245.3.1 Data Acquisition 245.3.2 Filter Construction 245.3.3 Signal Processing Results 27
6 Investigation of Temporal Resolution 34
7 Conclusions 36
8 References 37

I SummaryUltrasonic testing of materials with coarse grains often gives poor signal-to-noise-ratiodue to back-scattering from the grain boundaries. The influence of the back-scattering,being strongly dependent on the size of the grains and the wavelength used, can bereduced by suitable choice of inspection frequencies used. The actual choice can be madeflexible using broad band probes in combination with digital signal processing.Furthermore, with such an approach it might be possible both to detect and size defectsfrom the same scan.
One well-known signal processing method is Split Spectrum Processing (SSP). Thismethod can significantly reduce grain noise, but finding the optimal choice of parametersinvolved is difficult. The introduction of the Consecutive Polarity Coincidence (CPC) asSSP target extraction algorithm more or less solved this problem but other draw-backssuch as reduced temporal resolution is inherent in SSP.
Based on the experiences with SSP a new approach to grain noise reduction, based onnoncoherent detection (NCD), was developed at Uppsala University. The technique isevaluated in this investigation. The NCD algorithm has for a long time been used withinthe field of telecommunication and is based upon detection of bandpass signals inadditive Gaussian noise.
To adapt the algorithm for use in NDE a two parameter transient model is used. Theconstruction of an NCD filter includes three steps:
- estimation of the autocorrelation of the noise
- specification of the two parameters, lower and upper frequency, of the signalprototype
- computation of the filter
During the project two algorithms, based on signal entropy and signal-to-noise-ratioenhancement (SNRE), have been developed to determine the two parameters in anautomated procedure. UT-data to evaluate the NCD algorithm were collected in threephases:
Phase 1. Manual scanning was performed on CSS-block with ideal reflectors(laboratory environment). Tuning of the two NCD parameters was donemanually. The B-scans acquired by higher frequency probes processed withNCD filtering showed a similar detection capability as the one achieved with areference probe with lower frequency.
Phase 2. Manual scanning was performed on welded CSS-material with simulatedmechanical fatigue cracks in the weld (field measurements). Automatic tuningwas done using the entropy algorithm. After NCD filtering signals, reasonableto interpret as tip signals from the simulated cracks, were enhanced.

Phase 3. Automatic scanning was performed on welded CSS-blocks with simulatedthermal fatigue cracks in the weld (laboratory measurements). Automatictuning was done using the SNRE algorithm. Three blocks examined weresections cut from butt-welded 60 mm thick cast stainless steel pipe. The crackin each block had an intended height of 30-40% of the block thickness. Cornersignals from the crack in one of the blocks were selected as reference echoesfor the NCD filter construction. The following observations were made:
- The two defects in the other blocks were detected, but generally no sizingwas possible.
- The enhancement was in some cases significant after filtering.
- The conditions for filter construction were not ideal for the technique. Thespectrum of the material noise exhibited a very distinct dip, probably due tosurface roughness, which decreased the likelihood of successful filterdesign. A crack, rather than an ideal reflector, had to be used as a referencereflector during the filter construction. There is a risk that the constructedfilter then will be too specialized emphasizing a very narrow spectralregion. The performance of such a filter, when applied to other cracksmight be very poor. The conditions mentioned might explain the poorsignal-to-noise ration encountered in some cases.
Through the project comparisons have been made with the SSP/CPC algorithm. Thetime resolution, after processing, has been exemplified to be significantly lower forSSP/CPC processing than for NCD processing. The signal-to-noise-ratio enhancementwas similar or better for the NCD algorithm than for the SSP/CPC algorithm.
Scans with probes using sufficiently low center frequency to detect artificial or simulatedfatigue cracks in CSS-material have been done. The scans, repeated with probes withconsiderably higher center frequency, have after NCD filtering shown similar detectioncapability.
II SammanfattningUltraljudprovning av grovkornigt material ger lågt signal-brus-förhållande på grund avljudets spridning mot korngränserna. Påverkan från spridningen, som kraftigt beror påkornstorlek och använd våglängd hos ljudet, kan reduceras med lämpligt val användaprovningsfrekvenser. Det faktiska valet kan göras flexibelt genom att användabredbandiga sökare i kombination med signalbehandling. Med en sådan lösning kaneventuellt detektering och storleksbestämning utföras med samma avsökning.
En väl känd signalbehandlingsmetod är Split Spectrum Processing (SSP). Denna metodkan kraftigt minska kornbruset, men det är svårt att finna den optimala inställningen hosde ingående parametrarna. Genom att införandet av Consecutive Polarity Coincidencesom extraktionsalgoritm i SSP löstes detta problem. Problemet med försämradtidsupplösning, som berör alla SSP metoder, kvarstod.
Med utgångspunkt från erfarenheter, som erhållits från SSP metoder, utvecklades vidUppsala Universitetett nytt sätt att minska kornbruset baserat på Non-CoherentDetection (NCD). Tekniken utvärderas i denna undersökning. NCD algoritmen har längeanvänts inom telekommunikationsområdet och baseras på att detektera en familj avsignaler med okänd fas, dolda i gaussiskt brus.
För att anpassa algoritmen till förhållanden som gäller vid materialprovning infördes enmodell med två parametrar för att definiera utseendet på det eko man önskar detektera.Ett NCD filter bestäms i tre steg:
- bestämning av brusets autokorrelation
- bestämning av värdena på signalprototypens undre och övre gränsfrekvens
- beräkning av filtret
Under projektets gång har två algoritmer tagits fram för att på ett automatiserat sättkunna fastställa parametrarnas värden. Den ena baseras på signalens entropi, den andrapå förbättring i signal-brus-förhållande. Insamling av ultraljuddata för att kunnautvärdera NCD algoritmen skedde i tre faser:
Fas 1. Manuell avsökning utfördes på gjutet rostfritt block med ideala reflektorer(laboratoriemiljö). Bestämning av de två NCD parametrarnas värden gjordesmanuellt. En sökare som använde högre frekvenser, kombinerad med NCDfilter visade likartad detekteringsförmåga som en referenssökare som användelägre frekvenser.
Fas 2. Manuell avsökning utfördes på svetsat gjutet rostfritt gods. Svetsen innehöllsimulerade mekaniska utmattningssprickor (faltmätningar). Bestämning avNCD parametrarnas värden utfördes automatiskt med hjälp av entropialgoritmen. Efter NCD filtrering förstärktes signaler, som är rimliga att tolkassom spetssignaler från sprickorna.
Fas 3. Automatisk avsökning utfördes på svetsat gjutet gods med simuleradetermiska utmattningssprickor i svetsen (laboratoriemiljö). Bestämning av NCDparametrarnas värden gjordes med algoritmen baserad på förbättring i signal-brus-förhållande. Tre block som avsöktes var urfrästa från ett 60 mm tjocktgjutet rostfritt stålrör med stumsvets. Den konstgjorda sprickan i varje blockhade en avsedd höjd som svarade mot 30-40% av godstjockleken.Hörnsignaler från sprickan i ett av blocken valdes som referenssignaler vidkonstruktion av NCD filtren. Följande iakttagelser gjordes:
- De två sprickorna i de andra blocken detekterades. Däremot kunde intesprickorna generellt höjdbestämmas.
- Förhöjningen av signal-brus-förhållandet efter filtrering var i några fallbetydande.
- Förutsättningarna för att konstruera filtren var inte idealiska.Materialbrusets spektrum innehöll en tydlig dipp, som troligen berodde påojämnheter i avsökningsytan, vilket minskade möjligheten för lyckadprovning. Som referensreflektor måste användas en spricka i stället för enideal reflektor. Risken finns då att filtret blir alltför specialiserat och attendast ett smalt område framhävs i spektrum. Värdet av att använda ettsådant filter mot andra sprickor kan vara mycket begränsat. Dessaförutsättningar kanske förklarar varför signal-brus-förhållandet i vissa fallblev litet.
Jämförelse har gjorts mellan SSP/CPC och NCD algoritmerna. Det har visat sig atttidsupplösningen efter signalbehandling är betydligt sämre för SSP/CPC än för NCD.Brusreduceringen efter signalbehandling blev likartad eller bättre för NCD än förSSP/CPC.
Avsökning har skett med sökare med tillräckligt låg mittfrekvens så, att cylinderborrhåloch simulerade utmattningssprickor i gjutna rostfria matezial kunnat detekteras.Upprepad avsökning med sökare med betydligt högre mittfrekvens kombinerad medNCD filtrering, visade likartad detekteringsförmåga.

1 IntroductionMaterials with distinct coarse grains are difficult to inspect ultrasonically due to thescattering from the grain boundaries. In ultrasonic inspection using pulse-echo back-scattering from the grain boundaries appear in the received image as speckle, oftenreferred to as grain noise. In order to reduce grain noise and make ultrasonic testingfeasible the wavelength of the ultrasound must be large compared to the average size ofthe grains, ie., the frequency must be sufficiently low. Thus, the most suitable frequencyrange for the ultrasonic transducer utilised for the inspection is determined by thematerial.
Therefore, in order to get adequate inspection results a special transducer should bemanufactured for each material composition. In practice, this procedure is not possibleand a suitable transducer must be selected from a limited set. In general, the result will beultrasonic signals with lower signal to noise ratio or lower resolution than when atransducer with an optimised frequency response is employed.
Furthermore, even if a transducer very well suited to the inspected material is available, itmay still be necessary to employ transducers with different frequency responses fordetection and sizing of defects. The limitations imposed by the material force thetransducer designer to make a trade-off between sensitivity to grain noise and temporalresolution. Thus, during inspection one transducer has to be utilised for detection, andthen the detected defects have to be re-inspected with another transducer.
The ideal solution to the problems mentioned would be to have a transducer with avariable frequency response. Unfortunately, such transducers can not be manufactured.An alternative, feasible, approach is to utilise a transducer with a frequency range aswide as possible and then apply digital signal processing in order to modify the frequencycontents of the received ultrasonic signals. The effective frequency response of theultrasonic system can then be adapted to different materials and the same ultrasonicsignals may be used for both detection and sizing.
One such signal processing method, known as split spectrum processing (SSP) [New82],has been the target for research for about 15 years and promising results have beenpublished in a large number of scientific papers. In our previous work the SSP techniquehas been extensively evaluated [Bor94, Eri92] and further developed [Eri95]. Theevaluations of common target extractors, such as Polarity Thresholding [Bil90] andAmplitude Minimization [New82] have proven that grain noise can be significantlysuppressed by means of SSP. However, some drawbacks were also noticed: theparameter tuning is very difficult, the temporal resolution is considerably reduced, andthe processing is quite time consuming. The introduction of the Consecutive PolarityCoincidence (CPC) extraction algorithm [Eri95] more or less solved the parametertuning problem, but the other remained.
Based on the experiences with SSP a new approach to grain noise reduction, based onthe concept of noncoherent detection (NCD), was developed at Uppsala University[Gus95]. The SSP and NCD algorithms can be seen as representatives for two different

approaches to solve the clutter suppression problem: physical reasoning vs. modelling ofmaterial noise and defect response. The NCD algorithm has for a long time been usedwithin the field of telecommunication and its operation is well understood anddocumented [Pro89]. Initial experiments indicated that the adaptation of the algorithm toultrasonic testing was successful and that the technique had large potential.
In order to evaluate the newly introduced NCD technique and compare its performancewith the established SSP a project was initiated by the Swedish Nuclear PowerInspectorate (SKI). The results, developments and experiences achieved during theproject are presented in this report. Results and insights from the work have also beenpublished at a few conferences [Eri98a, Eri98b, Eri98c].

2 Noncoherent Detection - TheoryThe noncoherent detector, which is well known from telecommunication, is designed fordetection of bandpass signals, s(t)=A(t)cos(27tfo+(l>), in additive Gaussian noise. As theterm noncoherent implies, the algorithm is capable of detecting signals with unknownphase, 0. From a NDE perspective, the noncoherent detector is designed to detect afamily of transients defined by the set of transients obtained by continuously varying theangle <j) over the interval [0,2n). Since it is impossible to exactly specify what transientsto expect after propagation and reflection in NDE, the design of family detectors seemsattractive. Examples of transients with the same envelope, A(t), and centre frequency, fo,but different phase angles, 0=0° and 0=90°, are shown in Fig. 1. These anglescorrespond to the transient being either symmetric or anti-symmetric.
Fig 1. Transients with phase angles <j>=O°(left) and ^=90° (right).
Application of the NCD algorithm in ultrasonics differ from telecommunication in thatnot only the phase, 0, is unknown but also the envelope, A(t), and carrier frequency, fo,of the transients. Thus, the ultrasonic response signals must be modelled by a transientprototype that can be adapted to the inspection setup, and which is general enough to beuseful for all target echoes within the inspected volume. In the project a simple two-parameter transient model has been used.
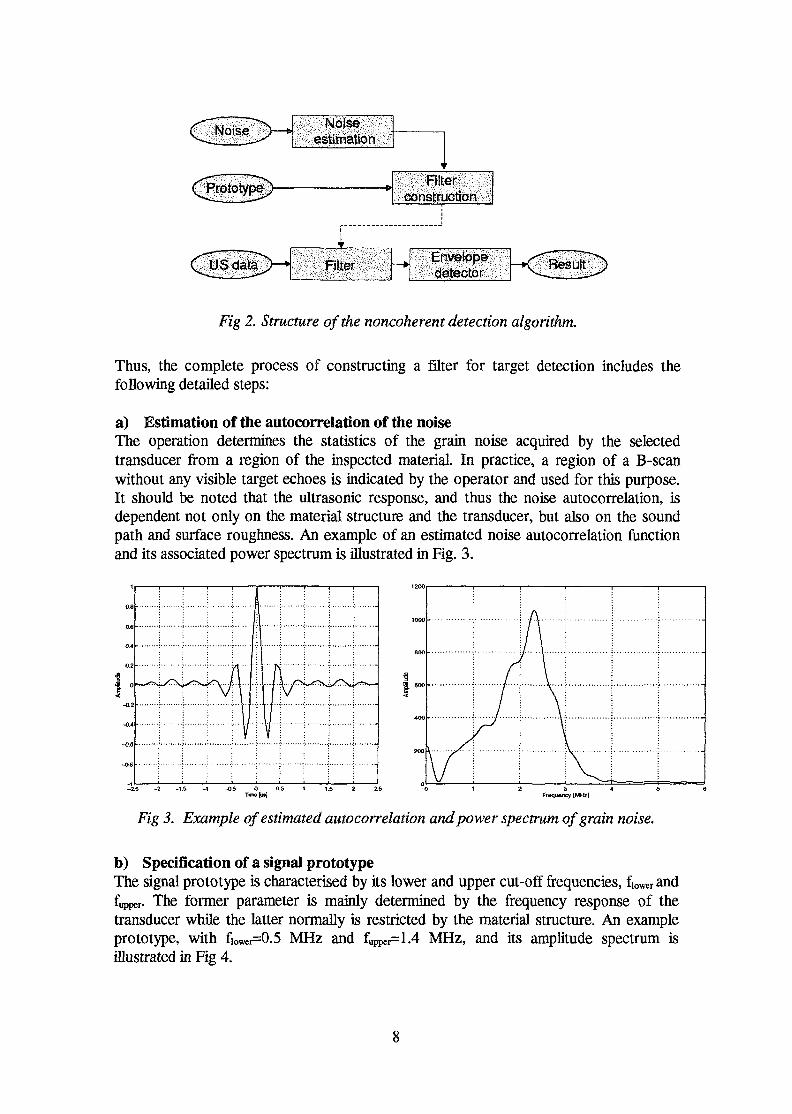
The NCD algorithm includes specification of the transient prototype, estimation of thegrain noise statistics, followed by the computation of an optimal filter. The structure ofthe algorithm is displayed in Fig. 2. It should be noted that the filter construction processis part of the calibration procedure for the utilised transducer. The actual processing ofthe acquired ultrasonic data, employing the resulting filter, is very simple and may beperformed in real time.
Nojseestimation
Prototype Filterconstruction
1 FilterEnvelopedetector
Fig 2. Structure of the noncoherent detection algorithm.
Thus, the complete process of constructing a filter for target detection includes thefollowing detailed steps:
a) Estimation of the autocorrelation of the noiseThe operation determines the statistics of the grain noise acquired by the selectedtransducer from a region of the inspected material. In practice, a region of a B-scanwithout any visible target echoes is indicated by the operator and used for this purpose.It should be noted that the ultrasonic response, and thus the noise autocorrelation, isdependent not only on the material structure and the transducer, but also on the soundpath and surface roughness. An example of an estimated noise autocorrelation functionand its associated power spectrum is illustrated in Fig. 3.
OS
0.6
0,4
0.2
0
-O.2
-0.*
-0.6
-O.8
; I• |
1
-J
; y
1
fV
1000
800
600
400
200V
/../
AA\\
V
-2.S -2 -1.5 - I -0.6Frequency [MHzJ
Fig 3. Example of estimated autocorrelation and power spectrum of grain noise.
b) Specification of a signal prototypeThe signal prototype is characterised by its lower and upper cut-off frequencies, fiower andfupper- The former parameter is mainly determined by the frequency response of thetransducer while the latter normally is restricted by the material structure. An exampleprototype, with fiOWer=0.5 MHz and fupPer=1.4 MHz, and its amplitude spectrum isillustrated in Fig 4.

7
5
r3
2
1
: /
/T\.
' \
\
1
t
\
Fig 4. Example of signal prototype, and its spectrum, fiower=0.5 MHz, fuPPer=1.4 MHz.
c) Computation of filter for target echo detectionThe filter is computed by extending the autocorrelation sequence into a Toeplitz matrixand then multiplying its inverse by the signal prototype. The result is a filter thatamplifies the frequency bands where the signal-to-noise ratio is high and suppresses theremaining frequency bands. The impulse and frequency responses of the filterconstructed from the correlation matrix and signal prototype given above are plotted inFig 5.
5 -2 -1.5 -1 -0.5 0 0.5 1 1.5 2 ZSFrequency [MHz]
Fig 5. Filter calculated from the noise correlation matrix and the signal prototype fromabove.
The parameters of the signal prototype must be tuned so that the transient covers thesame spectral region as the target echoes that should be detected. While this operationmay be performed manually by the operator it is not viable in an industrial environment.An automated procedure, based on a well-defined performance measure, was thereforedeveloped during the project.

3 Development of NCD Tuning AlgorithmsAn attractive property of the NCD algorithm is that small variations in the transientparameter values result in only small variations in the filter output. Consequently, near-optimal parameter values can easily be determined automatically using a suitableperformance measure. The type of performance measure to be used during filterconstruction depends on whether target echoes can be localized in the acquiredultrasonic data or not. If a special calibration block is available, the exact defect locationsshould be known. In this case the actual signal-to-noise ratio (SNR), ie. target echoenergy divided by noise power, can be computed and used as a performance measure.Otherwise a blind performance measure, such as the signal entropy suggested below,must be utilised. Regardless of the performance measure used during the filterconstruction procedure the basic idea is the same: the prototype parameters (fiOWer andfupper) are varied in a systematic manner and the performance of the resulting filter isevaluated by applying it to the selected ultrasonic data.
3.1 Performance Measure Based on Signal-to-Noise RatioWhen a known test block is available, the filter calibration data would typically be a B-scan containing one defect echo surrounded by material noise. The coordinates of thedefect and noise regions are then supplied to the filter construction algorithm so that theSNR enhancement (SNRE) can be automatically calculated for each set of prototypeparameters. By plotting the SNRE as a function of the parameters a "map" is obtainedwhich shows how the performance of the resulting filter varies, see Fig. 6 for anexample.
The reference defect should be such that the ultrasonic response has a wide, smooth,spectrum. Suitable choices are side-drilled holes or deep artificial notches. By using acomplicated defect, such as a rough crack, there is a risk that the constructed filter willbe too specialized, e.g., emphasize a very narrow spectral region. There is then a riskthat echoes from other, different, cracks will be lost, or that the signal-to-noise ratioenhancement will be mediocre.
10

Fig 6. Signal-to-noise ratio enhancement as a function of prototype parameters.
From the map obtained during the filter construction process the filter providing the bestpossible SNRE for a given prototype bandwidth, ie., temporal resolution, can be found.Fig. 7, which was constructed from the map in Fig. 6, shows the SNRE as a function ofprototype bandwidth. The curve clearly shows that a trade-off has to be made betweengrain noise suppression capability and temporal resolution. By storing the filterscorresponding to the different prototype bandwidths in the computer, it is possible tochange the bandwidth in real-time while watching the result. Consequently, the sameB-scan data may be used both for detection and defect sizing by merely turning a knob tochange the trade-off between SNRE and temporal resolution.
3.5
3
25
2
1.5
: \
\
\
02 0.4 0.6 0.8 1 t.2 1.4 1.6 1.8 2BartwMln (MHz]
Fig 7. Signal-to-noise ratio enhancement as a function of prototype bandwidth.
11

3.2 Performance Measure Based on Signal EntropyIf, for some reason, the defect location can not be established in the B-scan used for filtercalibration the SNRE is not a feasible performance measure. In such cases a blindmethod has to be used for measuring the noise reduction obtained for each set ofprototype parameters.
A useful blind performance measure may be found by studying an "ideal B-scan": a fewdistinct echoes and nothing more. The output from the algorithm should assume itsminimum (or maximum) value for such a B-scan and then monotonically move awayfrom that value as the noise level is increased. One method that fulfils these requirementscan be found by utilising the concept of entropy, originating in thermodynamics. Ininformation theory, the entropy is a measure of information contained in the signal.Information-rich signals, which have high entropy, are characterised by a high degree ofdisorder, while ordered signals, such as the "ideal B-scan" have minimum entropy.
The entropy, H, of a B-scan could be defined as [Pro89]:
H=-JjP(xi)logP(xi)
where P(x) is the amplitude distribution of the signal, i.e., P(xO is the probability for eachdiscrete amplitude level.
The amplitude distribution of the B-scan was estimated by means of a histogram with100 levels, created from the filtered B-scan. Before generating the histogram, the B-scanwas rectified and scaled so that its maximum amplitude was set to 1. By plotting theentropy as a function of the prototype parameters a "map" is obtained which shows howthe performance of the resulting filter varies, see Fig. 8 for an example. From the mapobtained during the filter construction process the filter providing the lowest entropy fora given prototype bandwidth, Le. temporal resolution, can be found.
Uppsr cut-off frequency [MHz] O.S 0 Lower cut-off frequency (MHz)
Fig 8. Signal entropy as a function of prototype parameters.
12

4 Project StructureThe evaluation of the NCD algorithms has taken place in three phases.
Phase 1 Experimental evaluation on UT-data acquired on cast stainless steel with idealreflectors. Tests were made in laboratory environment (at Uppsala). Report96160/ ABB TRC R-T97-47.
Phase 2 Experimental evaluation on UT-data acquired on welded cast stainless steelwith simulated mechanical fatigue cracks. The base material was as in phase 1.Inspection was performed under field condition in limited time (at Ringhals).Report 96160/ ABB TRC R-T97-115.
Phase 3 Experimental evaluation on UT-data acquired on cast stainless steel withsimulated thermal fatigue cracks. Data were acquired in laboratoryenvironment (at TRC). Report 96160/ ABB TRC R-T98-69.
The test specimens and the transducers used are described in the following subsections.
4.1 Phase 1Congressional probes were scanned on a flat cast stainless steel block, 150x200x295mm, with side-drilled holes placed at depth 40 mm from one of its sides. The probes usedare given in Table 1. The frequency interval given in Table 1 refers to the -lOdB levelmeasured on a VI-block.
Table 1. Probes used in phase 1.
1.2.3.4.5.6.7.
Supplier
PanametricsKarl DeutschPanametricsPanametricsRTDKrautkramerKrautkramer
Type
AccuscanS12HB4
M106V325-SU
TRLl-AustVRY45
WSY 45-4
No ofcrystals
1111221
Size ofelement
[nun]025.4012.7012.709.520x3410x2010x10
Nominalfrequency
fMHzl1.04
2.252.25
11.84
FrequencyintervalrMHzl0.7-1.42.5-5.11.2-3.62.0-3.70.8-1.31.4-2.82.2-4.9
Angle[°]
0000
454545
Wavetype
LLLLLLL
13

4.2 Phase 2The specimen was a cut-out from a pump-case in a PWR. The block was fixed in anupright position with the weld in horizontal. The scanning surface was curved withnearly cylindrical form at the weld (radius 680 mm). The inspected cracks (1, 5 and 3)had their tips at depths 0/30, 35/85 and 125/155 mm below the scanning surface (seeTable 2). Cracks 2 and 4 were not included in this investigation.
Table 2. Specification of defects.
DefectNo
1
2
3
4
5
PositionalongWeld
235-355
720-800
450-570
900-960
65-165
Positionthrough
wall
Nearwall -outer
Farwall -inner
Embeddedmidwall
EmbeddedFarwall -
inner
Embeddednearwall -
outer
Radialposition
Weldcentreline
Lowerfusion face
Weldcentreline
Weld body
Weld toe onlower side
Ligament/surface
breaking
0 - breakingouter surface
0 - breakinginner surface
55
3
35 mm
Length
120
80
120
60
100
Heightmm
30
16
30
10
50
%a/T
16
9
16
5
27
Morphology
Smooth fatigue crack(coupon type)
Smooth lack ofsidewall fusion
Single rough crack
Rough cluster ofsmall cracks
Smooth fatigue crack(coupon type)
Skew
0
0
+7
Any
0
Tilt
0
0
0
Any
0
4.2.1 TransducersThe probes used in phase 1 had flat contact surface. In order to achieve good contactwith the scanning surface the transducers used in phase 2 consisted of two 2.25 MHzprobes (Panametrics probes of V-type and size 25x12 mm with lower and upperfrequencies (-6 dB) around 1.4 MHz and 3.1 MHz ) mounted on curved wedges ofperspex and served as separate transmitter and receiver for longitudinal waves. Theprobes were skewed to generate focus at depth 110 mm with refracted angles around 35°and 45°. For the higher refraction angle also a wedge focusing at 35 mm depth wasmade. These were the only angled transducers available with which side-drilled hole, ondepth 50 mm in the testblock used in phase 1, could be identified without processing.
4.3 Phase 3
4.3.1 ObjectsIn this phase thermal fatigue cracks in CSS-material were inspected. The four specimensexamined given in Fig. 9 belong to a collection of specimens all consisting of sections cutfrom butt-welded 60 mm thick cast stainless steel pipe. The pipe material was from twodifferent heats of cast 304 material. Investigations done by Pacific Northwest NationalLaboratory (PNNL) on many of these objects suggested a correlation between soundvelocity in the thickness direction of the plate and its microstructure. Higher soundvelocity followed with an equi-axed microstructure.
14

B5HFig. 9A-D. Test blocks used during evaluation.
15

The microstructure in the specimens included in this investigation has not been identifiedwith one exception; B-505. In this object the plate on one side of the weld had equi-axedstructure and the plate on the other columnar structure. The relative change of velocity inthe thickness direction in the materials surrounding the weld in this object was also foundin all the specimens examined in this investigation. Scanning on sides with the highervelocity yielded lower S/N-ratio compared to scanning on the opposite side of the weld.The materials with the higher velocities, or lower velocities, were believed to have thesame microstructure. In the weld in three of the specimen surface-breaking cracksparallel to the centerline had been made. The intended heights of the cracks were 30-40% of the thickness.
4.3.2 TransducersThe wedges used in this phase were either supplied with 2.25 MHz probes (see phase 2)or with two 0.5 MHz (Panametrics, V-type, size 25x12 mm). The wedges were nowadjusted to the radius of the block (around 400 mm) and allowed longitudinal waves withrefracted angles 45° focused at depth 35 mm.
16

5 Results
5.1 Phase 1Scans were acquired using the probes in Table 1 to examine the side-drilled holes or theback wall of the block. The sampling frequency used was 40 MHz and the resolution 8bits. The processing of the acquired UT-data was done in MATLAB™. Tuning of theNCD parameters was performed manually at this stage of the project.
In the original B-scan, Fig. 10A acquired with probe 3 (Ml06) scanned on one side ofthe block the backwall echo (sound-path 200 mm) is nearly impossible to observe. AfterNCD processing, Fig. 10B, it is easier to detect.
100 150Depth [mm;
100 150 200 250Depth (mm]
Fig 10A. Bottom echo sound path 200 Fig 1 OB. Bottom echo sound path 200mm. Probe 3. mm, after NCD filtering. Probe 3.
1
/f\7 •] \7 : \: \
\\
1.5Fiequency [MHz]
Fig IOC. NCD filter for probe 3: Bottom echo sound path 200 mm
17

When the scanning above is repeated with probe 1 (Accuscan), see Fig. 11 A, B, thechange in the original and processed B-scan is moderate.
iV
100 150Depm [mm]
50 100 150 200Depth [mm]
Fig 11 A. Bottom echo sound path 200 Fig 11B. Bottom echo sound path 200 mmmm. Probe 1. after NCD filtering. Probe 1.
1\\
1.5Frcquoncy [MHzl
Fig 11C. NCD filter for probe 1: Bottom echo sound path 200 mm
By comparing the NCD filters used, (see Fig. 10C and 11C) it is clear that both filtersoperate with frequencies below 2 MHz and emphasize frequencies around 0.5 MHz. Thismight explain the effect of the enhancement being more important for probe 3, where thedominant part of its frequency content is filtered out, see Table 1, compared to probe 1.Although the same reflector, the backwall, the same material and nearly the samefrequencies used, there is a difference between the B-scan pictures (compare Fig. 10Band 11B). The relatively strong echo of the backwall in the last case is mainly believed tobe due to the larger area of probe 1.
At a much shorter sound-path higher frequencies exist in the defect signal, which is alsoreflected in the NCD filter. When probe 2 (S12HB4) is scanned over three side-drilledholes (sound-path around 40 mm) the processed B-scan (see Fig. 12 A, B) utilised the
18

filter shown in figure 12C covering the frequencies as in Table 1. A significantenhancement of the defects is obtained using NCD filtering.
0 10 20 30 40 50 60 70 80 90
Fig 12A. Three side-drilled holes, atprobe positions 50 mm (010), 100 mm
(08) and 150 mm (05). Probe 2.
10 20 30 40 50 60 70 80 90Depth [mm\
Fig 12B. Three side-drilled holes afterNCD filtering. Probe 2.
In Fig. 12D the similai' enhancement is obtained using SSP with the target extractoralgorithm CPC [ERI95]. The choice of relative window bandwidth, 2.0, used to obtainthis figure is used consistently within this report.
Fig 12C. NCD filter for probe 2: SDH
160B
<.
A f \ &&*£AHK.
\ -:»:'*X8*
0 10 20 30 40 50 60 70 80 90Oeplh [mm]
Fig 12D. Three side-drilled holes afterSPP/CPC processing. Probe 2.
19

•I
BllliHI?Hlllll
• V . ; : $ ^ ' ? 1 " V ' ' ^ • 1 " V S : > : ' • • : • ' • ' . : - • • • • • • ' . • : • • • / ' • - ' • •
y & , , ' . • • : < % ! § ! ! . ' • ' • . : . . . : • • • • • : • • • . •• • • : ; • * " ' "
10 20 30 40 50 IDepth [mm]
70 80 90
Fig 12E. Three side-drilled holes, 010, 8 and 5 mm. Probe 1.
The same scan using probe 1 needs no processing the defects being clearly observed inFig. 12E, which should be compared with the result above in Fig. 12B using higherfrequencies in combination with NCD filtering.
5.2 Phase 2
5.2.1 Inspection ProcedureScans were made perpendicular to the weld. The defects were scanned from both sideswhen possible. Due to the design of the block only one crack could be fully examinedfrom both sides.
The probes were moved manually along one side of a movable ruler carrying an encoder.Data were acquired every 0.5 mm.
The refracted angles used gave a maximal sound path around 220 mm, corresponding toa time-of-flight around 75 |is, for the deepest defect. The program used - to makeacquired data available for processing - maximized the number of samples to 1024. Thesampling rate was constant during the inspections (12.5 MHz) and was determined bythe longest sound path.
5.2.2 Signal Processing ResultsThe acquired B-scans were processed as described in chapter 3.2. The prototype cut-offfrequencies were allowed to vary between 0.4 MHz and 3 MHz, with bandwidthconstrained to be at least 0.5 MHz. For each B-scan a filter corresponding to a minimumin the entropy surface was then used for the final processing. The results before and afterNCD processing are presented below. It should be noted that the figures present theenvelopes of the ultrasonic signals.
20

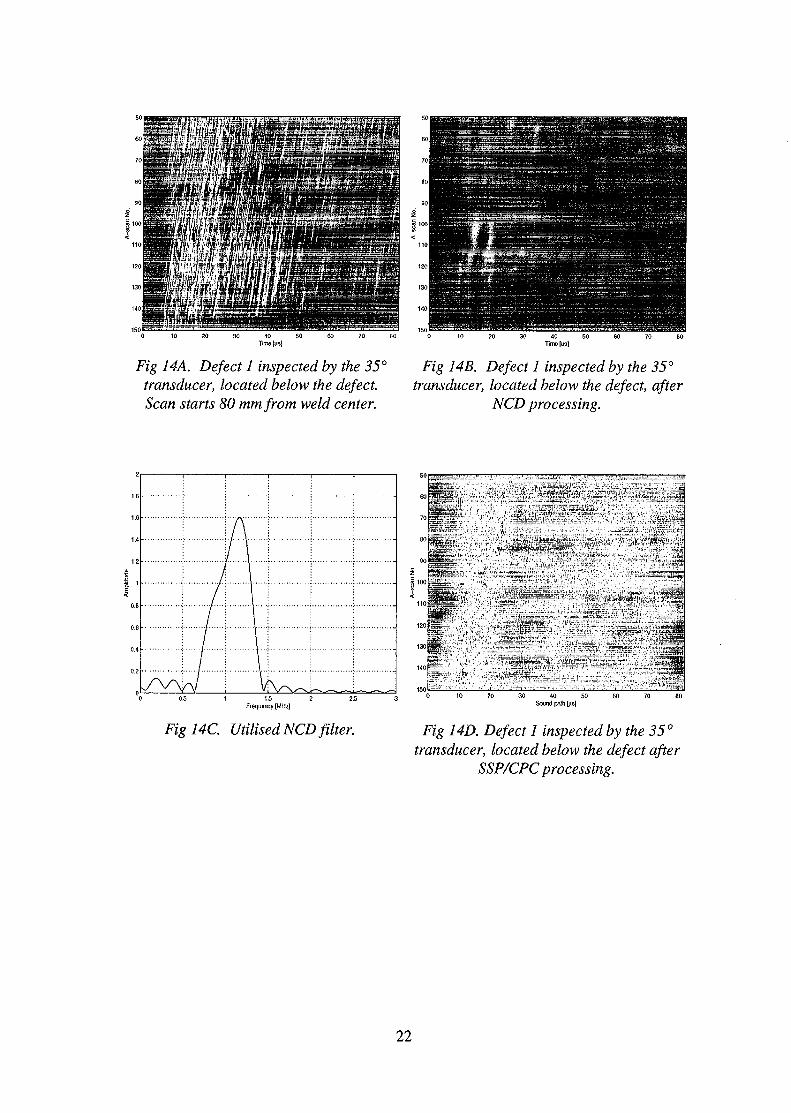
Only defects 1 and 5 were detected. Scans from both sides of the weld towards defect 1are shown in Fig. 13A and 14A. In the processed scans in Fig. 13B and 14B, one of thestronger echoes originated from the lower tip of the defect. This was confirmed byplotting circular arcs centered at the transducer positions related to these echoes. Thearcs with radii in agreement with actual sound path gave intersections near the locationof the tip, having assumed constant sound velocity. The filters used are shown in Fig.13C and 14C respectively. For comparison processing with CPC algorithms are shown inFig. 13D and 14D respectively.
*"!
O 10 20 30 40 50 60Time (us)
70 50
Fig 13A. Defect 1 inspected by the 35°transducer, located above the defect.Scan starts 60 mm from weld center.
Fig i35. De/ecf i inspected by the 35°transducer, located above the defect, after
NCD processing.
I
! Ai/\
\\
\Y
\1.5 2
Frequency [MHz]
Fig 13C. Utilised NCD filter.
20
40
60
eo
100
120
140
160
180
3
10 20
-
C
J
30
r
40
-
50 60 70 80Sound palh \\ts]
Fig 13D. Defect 1 inspected by the 35 °transducer, located above the defect after
SSP/CPC processing.
21
Time Jus]
Fig 14A. Defect 1 inspected by the 35°transducer, located below the defect.Scan starts 80 mm from weld center.
Time [us]
Fig 14B. Defect 1 inspected by the 35°transducer, located below the defect, after
NCD processing.
1.6 •
1.4 •
1.2 •
h-i
0.8 •
o.e •
0.4 •
0.2 •
/ •
/
7
1.5 2Frequency [MHz]
Fig 14C. Utilised NCD filter. Fig 14D. Defect 1 inspected by the 35 °transducer, located below the defect after
SSP/CPC processing.
22

In this way also the upper tip of defect 5 using the same probe could be confirmed, seeFig. 15 A, B (A-scan number approx. 120). NCD filter used is shown in Fig. 15C andresult using SSP/CPC processing is seen in Fig. 15D. In the scan below the weld with thesame probe the tip was easily observed in the original scan (not presented here).
30 40Tims [us)
/-> .
36 40 50 60 70Tima {usj
Fig 15A. Defect 5 inspected by the 35° Fig 15B. Defect 5 inspected by the 35°transducer, located above the defect. transducer, located above the defect, afterScan starts 80 mm from weld center. NCD processing.
1.5Frequency [MHz]
Figl5C. Utilised NCD filter.
• v + •
30 40 50Sound path [tis]
Fig i5D. De/ecf 5 inspected by the 35 °transducer, located above the defect after
SSP/CPC processing.
The positions of the echo appearing in the upper part of Fig. 15B (A-scans numberapprox. 60) agrees with the expected position of the lower tip signal for this probe.However, this signal could not be confirmed from scans on the opposite side of the weldwith this probe. Scanning with the probe using higher refracted angle was of no help.
23

5.3 Phase 3
5.3.1 Data AcquisitionScanning was performed both parallel and perpendicular to the welds and from the leftand right side of the welds (see Fig. 9). The B-scans along the weld consisted of A-scanswith one millimeter spacing and started with the exit point of the probe 20 mm along theweld from the block side shown in Fig. 9. Every A-scan contained 1024 samples and wassampled at a rate of 20 MHz, based on expected sound paths, starting at time-of-flightequal to 0 (is.
5.3.2 Filter ConstructionThe filters were constructed by optimizing the SNRE algorithm with the crack in blockB-519 as the reference defect (see chapter 3.1).
One observation that was made during the filter construction was that the spectrum ofthe material noise, which should be similar to the frequency response of the transducer,exhibited a very distinct dip around 1.5 MHz. The effect was similar for all blocks used,see Fig. 16 as an example. The presence of the dip, which is probably due to the surfaceroughness, decreases the likelihood of successful inspection results.
0 0.5 1 1.5 2 2.5 3 a5 4 t5 5
Fig. 16. Amplitude spectrum of material noise acquired from the right side of blockB-519 by the 2.25 MHz transducer.
The ambition was to detect and size the defects applying the NCD algorithms to UT-dataacquired with the transducers mentioned with the higher center frequency. Theimprovements achieved with NCD filtering are shown for an ideal reflector in thefollowing example. In one of the specimen a 6 mm notch was scanned using both0.5 MHz and 2.25 MHz as centre frequencies, Fig. 17. The notch is located at a soundpath of 80 mm. As expected the B-scan acquired with the higher centre frequencyexhibits a much higher grain noise level than the 0.5 MHz B-scan. It is also obvious thatthe temporal resolution provided by the 0.5 MHz transducer is too low for resolving theupper and lower edges of the notch. Using different prototype bandwidths, 0.3 MHz and0.7 MHz, when processing the data acquired with the probe with higher center frequency
24

the result achieved is shown in Fig. 18. Evidently, by utilising a low bandwidth theprocessed B-scan exhibits a signal-to-noise ratio at least as high as could be obtained bythe 0.5 MHz transducer. Additionally, by increasing the prototype bandwidth thetemporal resolution can be made high enough to resolve the upper and lower edges ofthe notch. In the latter case, the signal-to-noise ratio is still substantially higher than inthe original data.
Sound path [mm]
Fig. 17. Notch, located close to welding zone, inspected by 2.25 MHz (left figure)0.5 MHz (right figure) transducers.
and
20 V) GO 80 100 120 140Sound palh [mm]
Fig. 18. The 2.25 MHz B-scan from Fig. 17, after processing by NCD. The left figureshows the result obtained by setting the prototype bandwidth to 0.3 MHz, and the right
figure the result with the parameter set to 0.7 MHz.
25

Initially the notches in block B-505 were used as reference defects for the filterconstruction. None of them were placed in the weld. After processing, with the filtersconstructed with these reference defects, it was possible to identify the tip signal fromone side in one of the three blocks. With the same filters we could not secure thedetection of the defects by enhancing the corner signal from the defects. Filters were thenconstructed in the same material using the corner reflections from the end sides of theplates. Still without having improved the detection performance.
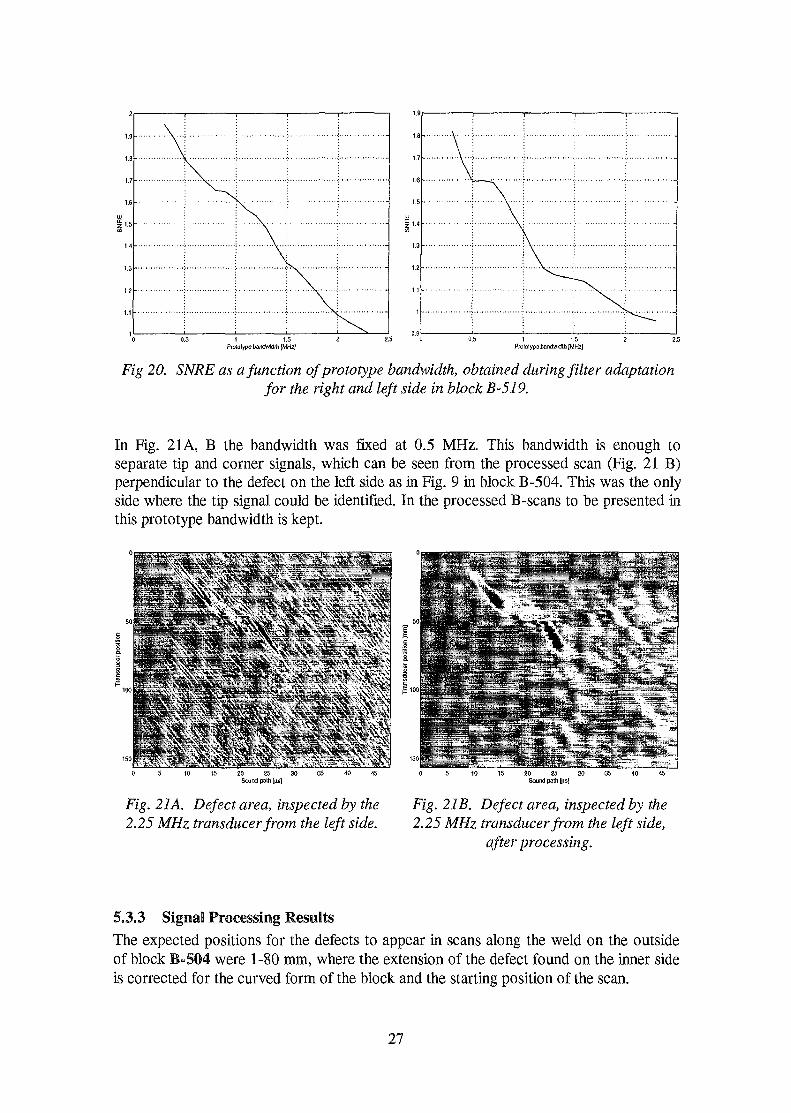
Due to lack of artificial defects with relevant locations, i.e. in the weld, the crack inspecimen B-519 was chosen as a reference defect. The frequency responses of the filtersfrom the two sides are shown in Fig. 19. The spectrum covering the lower frequencies isfrom the side with the higher velocity in the thickness direction. Changes in SNRE versuschanges in prototype bandwidth for both sides in this block is shown in Fig. 20. Thesefilters were then applied to UT-data acquired on the blocks B-504 and B-515. The rightsides of the blocks had the lower S/N-ratio compared to the left sides.
0 0.2 0.4 0.6 0.8 I 12 1.4 1.6 1,8 2 0 0.2 0.4 0.6 Hi 1 ^2 1.4 1.6 1.8 2
Fig. 19. The frequency responses of the NCD filters constructed from the right and leftside of the weld in block B-519.
26
1.9
1.8
1.7
1.6
1.5
h1.3
1.2
1.1
PmUlype ban*vtth (MHi)0.5 1 1.5
Protolypa bandwidth IMHzJ
Fig 20. SNRE as a function of prototype bandwidth, obtained during filter adaptationfor the right and left side in block B-519.
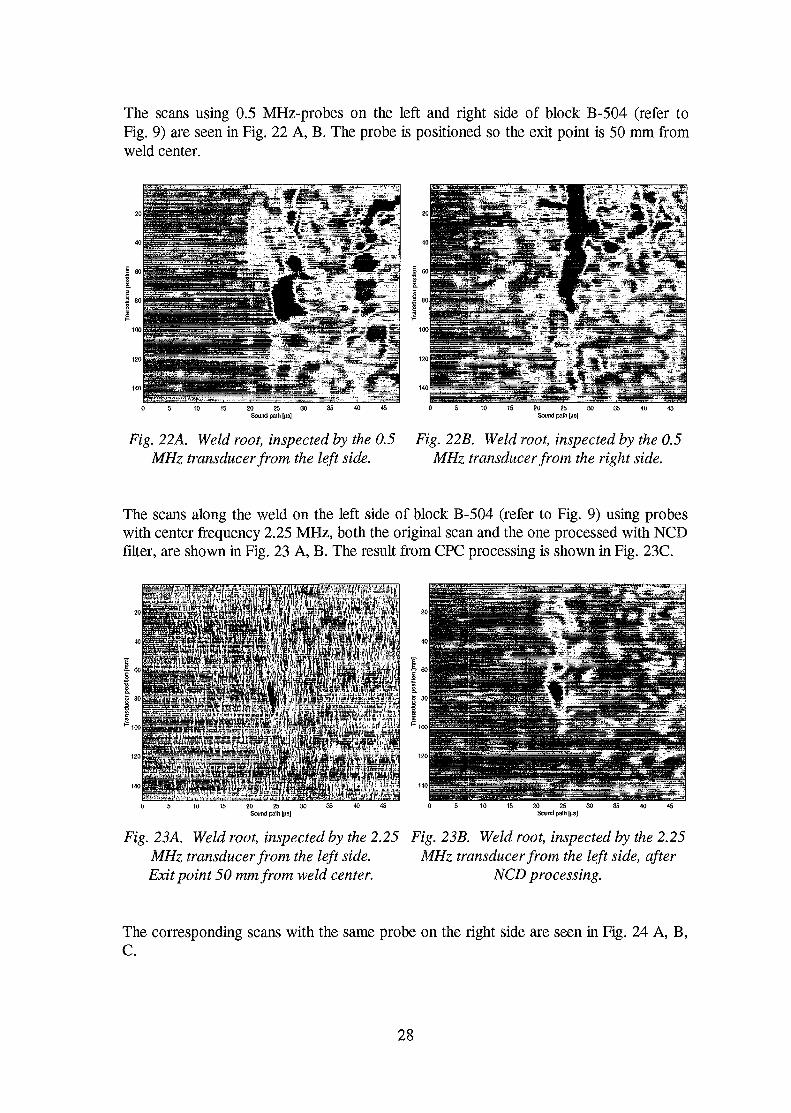
In Fig. 21A, B the bandwidth was fixed at 0.5 MHz. This bandwidth is enough toseparate tip and corner signals, which can be seen from the processed scan (Fig. 21 B)perpendicular to the defect on the left side as in Fig. 9 in block B-504. This was the onlyside where the tip signal could be identified. In the processed B-scans to be presented inthis prototype bandwidth is kept.
20 25 30Sound pslh [na]
^. 27A. Defect area, inspected by the2.25 MHz transducer from the left side.
a
I(=100
Sound path [|i3]
Fig. 21B. Defect area, inspected by the2.25 MHz transducer from the left side,
after processing.
5.3.3 Signal Processing Results
The expected positions for the defects to appear in scans along the weld on the outsideof block B-504 were 1-80 mm, where the extension of the defect found on the inner sideis corrected for the curved form of the block and the starting position of the scan.
27
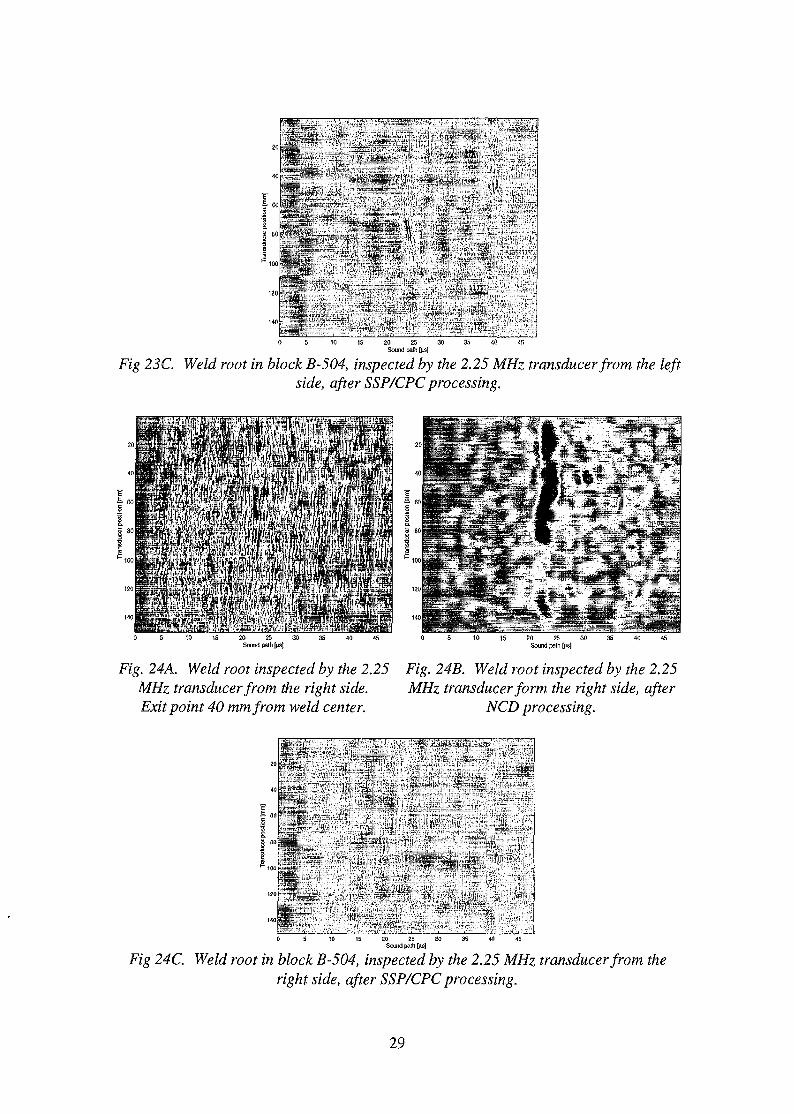
The scans using 0.5 MHz-probes on the left and right side of block B-504 (refer toFig. 9) are seen in Fig. 22 A, B. The probe is positioned so the exit point is 50 mm fromweld center.
Fig. 22A. Weld root, inspected by the 0.5 Fig. 22B. Weld root, inspected by the 0.5MHz transducer from the left side. MHz transducer from the right side.
The scans along the weld on the left side of block B-504 (refer to Fig. 9) using probeswith center frequency 2.25 MHz, both the original scan and the one processed with NCDfilter, are shown in Fig. 23 A, B. The result from CPC processing is shown in Fig. 23C.
Sound path [fis]
Fig. 23A. Weld root, inspected by the 2.25 Fig. 23B. Weld root, inspected by the 2.25MHz transducer from the left side. MHz transducer from the left side, afterExit point 50 mm from weld center. NCD processing.
The corresponding scans with the same probe on the right side are seen in Fig. 24 A, B,C.
28
23C roor in block B-504, inspected by the 2.25 MHz transducer from the leftside, after SSP/CPC processing.
10 15 20 25 30 35 40 45
Fig. 24A. Weld root inspected by the 2.25 Fig. 24B. Weld root inspected by the 2.25MHz transducer from the right side. MHz transducer form the right side, after-Exit point 40 mm from weld center. NCD processing.
10 15 20 25 30 35 Vi 45
Fig 24C. Weld root in block B-504, inspected by the 2.25 MHz transducer from theright side, after SSP/CPC processing.
29
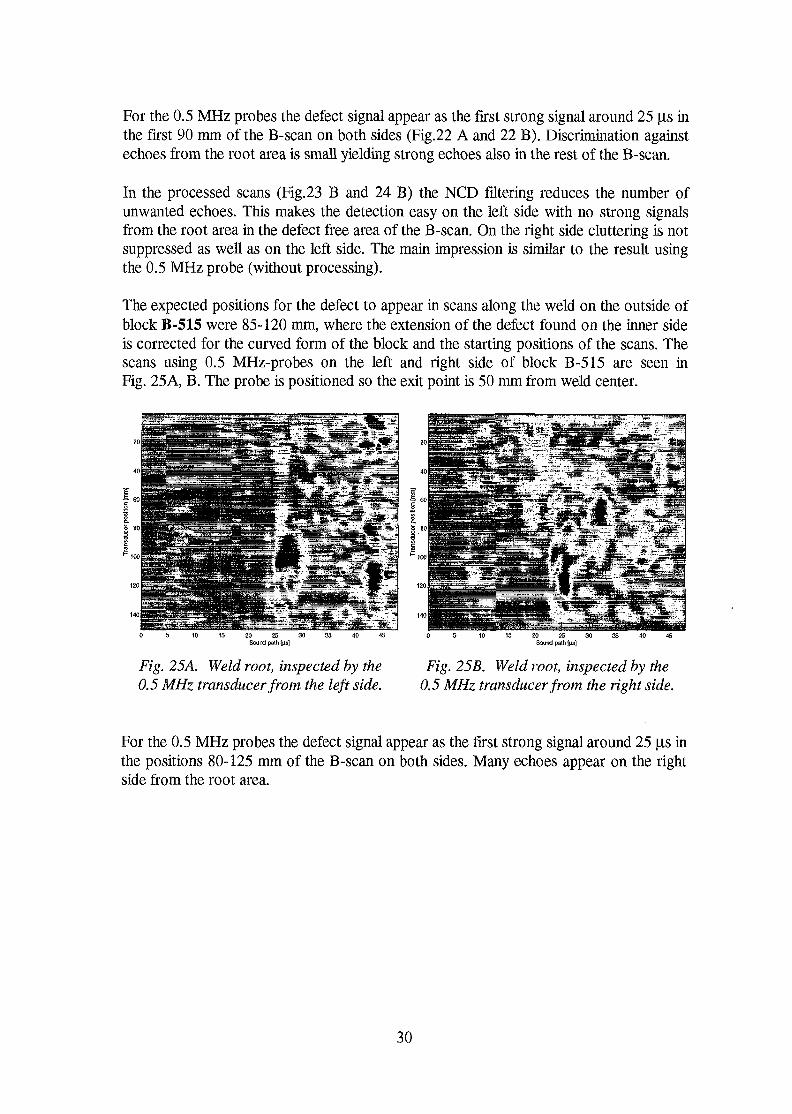
For the 0.5 MHz probes the defect signal appear as the first strong signal around 25 |us inthe first 90 mm of the B-scan on both sides (Fig.22 A and 22 B). Discrimination againstechoes from the root area is small yielding strong echoes also in the rest of the B-scan.
In the processed scans (Fig.23 B and 24 B) the NCD filtering reduces the number ofunwanted echoes. This makes the detection easy on the left side with no strong signalsfrom the root area in the defect free area of the B-scan. On the right side cluttering is notsuppressed as well as on the left side. The main impression is similar to the result usingthe 0.5 MHz probe (without processing).
The expected positions for the defect to appear in scans along the weld on the outside ofblock B-515 were 85-120 mm, where the extension of the defect found on the inner sideis corrected for the curved form of the block and the starting positions of the scans. Thescans using 0.5 MHz-probes on the left and right side of block B-515 are seen inFig. 25A, B. The probe is positioned so the exit point is 50 mm from weld center.
Sound path (us]30 35 40 45
Fig. 25A. Weld root, inspected by the0.5 MHz transducer from the left side.
Fig. 25B. Weld root, inspected by the0.5 MHz transducer from the right side.
For the 0.5 MHz probes the defect signal appear as the first strong signal around 25 |is inthe positions 80-125 mm of the B-scan on both sides. Many echoes appeal* on the rightside from the root area.
30

The scans using probes with center frequency 2.25 MHz along the left side of blockB-515, are shown in Fig. 26 A, B (both the original and the processed scan with NCDfilter). The result from the CPC processing is shown in Fig. 26C.
0 5 10 15 20 25 30 35 40 45 35 40 45Sound path [[is]
Fig. 26A. Weld root, inspected by the2.25 MHz transducer from the left side.
Exit point 50 mm from weld center.
Fig. 26B. Weld root, inspected by the2.25 MHz transducer from the left side,
after NCD processing.
2<5C root in object B-515, inspected by the 2.25 MHz transducer from the leftside, after SSP/CPC processing.
The result from the corresponding scans on the right side of the weld of the block B-515are seen in Fig. 27 A, B, C.
31
10 15 20 25 30 35 40 45 25 30 35 40 45Sound path Qis]
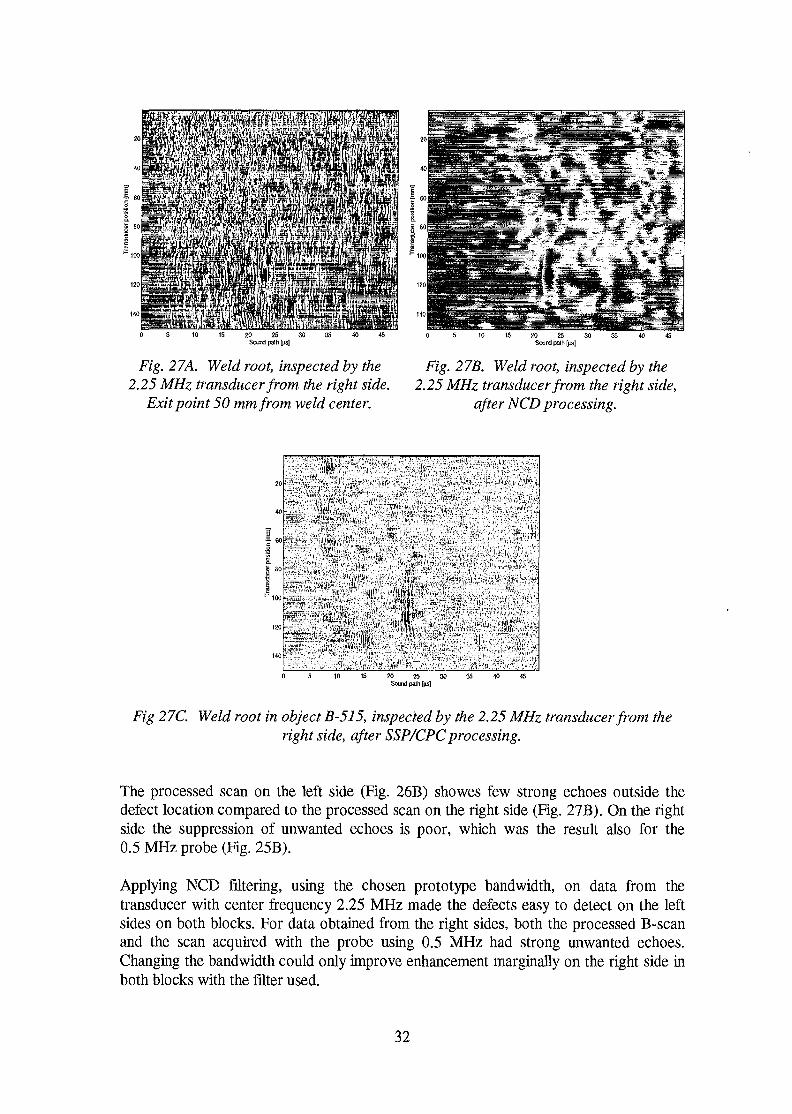
Fig. 27A. Weld root, inspected by the Fig. 27B. Weld root, inspected by the2.25 MHz transducer from the right side. 2.25 MHz transducer from the right side,
Exit point 50 mm from weld center. after NCD processing.
Fig 27C. Weld root in object B-515, inspected by the 2.25 MHz transducer from theright side, after SSP/CPC processing.
The processed scan on the left side (Fig. 26B) showes few strong echoes outside thedefect location compared to the processed scan on the right, side (Fig. 27B). On the rightside the suppression of unwanted echoes is poor, which was the result also for the0.5 MHz probe (Fig. 25B).
Applying NCD filtering, using the chosen prototype bandwidth, on data from thetransducer with center frequency 2.25 MHz made the defects easy to detect on the leftsides on both blocks. For data obtained from the right sides, both the processed B-scanand the scan acquired with the probe using 0.5 MHz had strong unwanted echoes.Changing the bandwidth could only improve enhancement marginally on the right side inboth blocks with the filter used.
32

A change of reference defect (preferably a side drilled hole) might increase theenhancement also on the right sides. With reflectors, placed in the weld on differentdepths, possible changes in the filter form can be established, which should be of valuefor improving the inspection of the tips.
33

6 Investigation of Temporal ResolutionThe temporal resolution of the highly non-linear SSP technique has previously [Bor94]been found to be inadequate for resolving closely separated targets. This could seriouslylimit the possibilities to size small defects. The experiences obtained during this projectindicate that the NCD algorithm show no such problems.
In order to quantitatively compare the temporal resolution of the two algorithms theywere both used for processing the same set of signals, containing two echoes separatedin time, see Fig. 28. An arbitrary separation between the echoes was achieved bygenerating the signals in the computer, based on measured transducer characteristics.The transducer and filters utilised in the investigation were the same as those used inFig. 12.
When utilising the NCD technique there were no problems to resolve two echoesseparated in time by 2 ^is, see Fig. 29. Further reduction of the distance resulted in asmooth transition to one, wide echo. The same signal was also processed by theSSP/CPC algorithm, see Fig. 30. Obviously, in this case the temporal resolution is notgood enough to detect both the echoes. By increasing the distance in time between theechoes the temporal resolution for the SSP/CPC, using the current parameter setting,was estimated to 6 (is, see Fig. 31. It should be noted that when decreasing the distancebelow 6 jo.s the peak corresponding to the smaller echo disappears very abruptly.
: : : : : :i : :
i : . . '
Jt i l l
70
50
40
30
20
10
—^
I
: : : . . . ;
A. ./ ...
, IS-wf P^ZI
Time [us] Time [us]
Fig 28. Two echoes separated in time by Fig 29. Two echoes separated in time by2 jis. 2 JJS, after NCD processing.
34

1 j
5
3
2
1
• • I -
i : ;i
Time [us]
Fig 30. Two echoes separated in time by2 us, after SSP/CPC processing.
Time [|ns]
Fig 31. Two echoes separated in time by6 jis, after SSP/CPC processing.
One should also note that the SSP/CPC output gives the impression of high temporalresolution due to its sharp shape. Unfortunately, this has nothing to do with theresolution but stems from the fact that SSP/CPC is detection oriented and nonlinear.
The temporal resolution of the SSP algorithm may be improved by increasing thebandwidth of the Gaussian filters in the filter bank. However, at the same time the cluttersuppression performance is deteriorated. In order to get. a temporal resolutioncomparable to the NCD the filter bandwidth had to be increased by a factor of three.Processing the ultrasonic B-scan image from Fig. 12A using this modified parametersetting resulted in the image shown in Fig. 32. Evidently, the signal to noise ratio hasbeen significantly reduced compared to Fig. 12D.
SI?
! < •
DeplhlmniJ
Time [us]
Fig 32. Same as in Fig. 12A, after processing by SSP/CPC with parameters modified toobtain improved temporal resolution.
35

7 ConclusionsThe signal processing technique referred to as noncoherent detection (NCD), recentlyadapted to the field of ultrasonics, has been evaluated concerning material noisereduction capability and temporal resolution. The performance has also been comparedto the more established split spectrum processing (SSP) technique.
Scans were performed against artificial defects and surface-breaking, simulated fatiguecracks in different blocks of cast stainless steel. Probes with sufficiently low centerfrequency were used to detect the defects. Scans were then repeated with probes using ahigher center frequency. These scans were then processed using either the SSP/CPCalgorithm or the NCD algorithm. The processed scans were than compared to theunprocessed scan acquired using the probe with low center frequency. Using the NCDalgorithm gave similar detection capability as using the low frequency probe.
The enhancement was in some cases significant after NCD filtering. Some scans, thescans on the right sides of the blocks B504 and B515, had poor signal-to-noise ratios.The signal-to-noise ratios in these cases have to be improved to meet field requirements.Possibly, a change of reflector in the filter construction giving more suitable filters mightyield the sufficient improvement.
The comparison between the NCD and SSP algorithms shows that the NCD gives asignal-to-noise ratio enhancement that is similar or better, while at the same timeproviding considerably higher temporal resolution. The time required for signalprocessing is also much shorter when using NCD due to the fact that a single filter isused instead of a large bank of filters. As an example it was noted that the processing ofa B-scan containing 150 A-scans of 1024 samples took less than one second using astandard PC (Pentium II, 266 MHz) running MATLAB™.
36

8 References
Bil90. Bilgutay N. M., Bencharit U., Murthy R., Saniie J., Analysis of a Non-linearFrequency Diverse Clutter Suppression Algorithm Ultrasonics, vol. 28, March,1990, pp 90-96.
Bor94. Borgenstam C. J., Dahlgren S., Ericsson L., Experience of UltrasonicInspection together with Signal Processing for Dissimilar Welds and Cladding,ABB TRC Report R-T94/78, 1994.
Eri92. Ericsson L., Stepinski T., Verification of Split Spectrum Technique forUltrasonic Inspection of Welded Structures in Nuclear Reactors, EuropeanJournal of NDT, vol. 2, No. 2,1992, pp 56-64.
Eri95. Ericsson L., Stepinski T., Dahlgren S., Ultrasonic Pulse Detection with SplitSpectrum Processing and Consecutive Polarity Coincidence, Proc. 13th
International Conf. on NDE in the Nuclear and Pressure Vessel Industries,Kyoto, 1995, pp 201-207.
Eri98a. Ericsson L., Gustafsson M., Perception and Entropy Inspired Ultrasonic GrainNoise Suppression, using Noncoherent Detector Statistics, Proc. 7th ECNDT,Copenhagen, 1998.
Eri98b. Ericsson L, Stepinski T., Gustafsson, M., Speckle Suppression in UltrasonicImaging, proc. Fifth International Symposium on Methods and Models inAutomation and Robotics, Mi^dzyzdroje, 1998.
Eri98c. Ericsson L, Stepinski T., Gustafsson, M. G., Suppressing Ultrasonic GrainNoise Using Noncoherent Detection, Proc. First International Conf. on NDE inRelation to Structural Integrity for Nuclear and Pressurised Components,Amsterdam, 1998.
Gus95. Gustafsson M., Statistical Aspects of the Split Spectrum Technique, PhDdissertation, Uppsala University, 1995.
New82. Newhouse V. L., Bilgutay N. ML, Saniee J., Furgason E. S., Flaw-to-GrainEcho Enhancement by Split-Spectrum Processing, Ultrasonics, vol. 20, March,1982, pp 59-68.
Pro89. Proakis J. G., Digital Communications, McGraw-Hill, 1989.
37

www.ski.se
STATENS KARNKRAFTINSPEKTIQN
Swedish Nuclear Power Inspectorate
POST/POSTAL ADDRESS SE-106 58 Stockholm
BESSK/OFFICE Klarabergsviadukten 90TELEFON/TELEPHONE +46 (0)8 698 84 00TELEFAX +46 (0)8 661 90 86
E-POST/E-MAIL [email protected]/WEB SITE WWW.ski.se