significance testing of microarray data bios 691 fall 2008 mark reimers dept. biostatistics
TRANSCRIPT

Significance Significance Testing of Testing of
Microarray DataMicroarray DataBIOS 691 Fall 2008BIOS 691 Fall 2008
Mark ReimersMark Reimers
Dept. BiostatisticsDept. Biostatistics

OutlineOutline
Multiple TestingMultiple Testing Family wide error ratesFamily wide error rates False discovery ratesFalse discovery rates
Application to microarray dataApplication to microarray data Practical issues – correlated errorsPractical issues – correlated errors Computing FDR by permutation Computing FDR by permutation
proceduresprocedures Conditioning t-scoresConditioning t-scores

Reality CheckReality Check
Goals of TestingGoals of Testing To identify genes most likely to be changed To identify genes most likely to be changed
or affectedor affected To prioritize candidates for focused follow-To prioritize candidates for focused follow-
up studiesup studies To characterize functional changes To characterize functional changes
consequent on changes in gene expressionconsequent on changes in gene expression So in practice we don’t need to be So in practice we don’t need to be
exact…exact… but we do need to be principled!but we do need to be principled!

Multiple comparisons Multiple comparisons
Suppose no genes really changedSuppose no genes really changed (as if random samples from same population)(as if random samples from same population)
10,000 genes on a chip10,000 genes on a chip Each gene has a 5% chance of exceeding Each gene has a 5% chance of exceeding
the threshold at a p-value of .05the threshold at a p-value of .05 Type I errorType I error
The test statistics for 500 genes should The test statistics for 500 genes should exceed .05 threshold ‘by chance’exceed .05 threshold ‘by chance’

Distributions of p-valuesDistributions of p-valuesRandom Data Real Microarray Data

When Might it not be When Might it not be Uniform?Uniform?
When actual distribution of test When actual distribution of test statistic departs from reference statistic departs from reference distributiondistribution
Outliers in data may give rise to more Outliers in data may give rise to more extremesextremes More small p-valuesMore small p-values
Approximate tests – often conservative Approximate tests – often conservative P-values are larger than occurrence P-values are larger than occurrence
probabilityprobability Distribution shifted rightDistribution shifted right

Distribution of Numbers of p-Distribution of Numbers of p-valuesvalues
Each bin of width w contains a Each bin of width w contains a random number of p-valuesrandom number of p-values
The expected number is NwThe expected number is Nw Each p-value has a probability w of Each p-value has a probability w of
lying in the binlying in the bin The distribution follows the Poisson The distribution follows the Poisson
lawlaw SD ~ (mean)SD ~ (mean)1/21/2
Characterizing False Characterizing False PositivesPositives
Family-Wide Error Rate (FWE)Family-Wide Error Rate (FWE) probability of probability of at least oneat least one false positive false positive
arising from the selection procedurearising from the selection procedure Strong control of FWE:Strong control of FWE:
Bound on FWE Bound on FWE independentindependent of number of number changedchanged
False Discovery Rate: False Discovery Rate: Proportion of false positives arising from Proportion of false positives arising from
selection procedureselection procedure ESTIMATE ONLY!ESTIMATE ONLY!

General Issues for Multiple General Issues for Multiple ComparisonsComparisons
FWER vs FDRFWER vs FDR Are you willing to tolerate some false positivesAre you willing to tolerate some false positives
FDR: E(FDR) or P(FDR < Q)?FDR: E(FDR) or P(FDR < Q)? Actual (random) FDR has a long-tailed Actual (random) FDR has a long-tailed
distributiondistribution But E(FDR) methods are simpler and cleanerBut E(FDR) methods are simpler and cleaner
CorrelationsCorrelations Many procedures surprise you when tests are Many procedures surprise you when tests are
correlatedcorrelated Always check assumptions of procedure!Always check assumptions of procedure!
Models for Null distribution: a matter of artModels for Null distribution: a matter of art Strong vs weak controlStrong vs weak control
Will the procedure work for any combination of Will the procedure work for any combination of true and false null hypotheses?true and false null hypotheses?

FWER - Setting a Higher FWER - Setting a Higher ThresholdThreshold
Suppose want to test N independent Suppose want to test N independent genes at overall level genes at overall level
What level What level * should each gene be tested * should each gene be tested at?at?
Want to ensure Want to ensure P( any false positive) < P( any false positive) < i.e. 1 – i.e. 1 – P( all true negatives ) P( all true negatives ) = P( any null accepted )= P( any null accepted )NN = ( 1 – = ( 1 – * ) * ) NN
Solve for Solve for * = 1 – (1 – * = 1 – (1 – ) )1/N1/N

Expectation ArgumentExpectation Argument
PP( any false positive )( any false positive ) <= E<= E( # false positives ) ( # false positives ) = N = N EE( any false positive) ( any false positive) = N = N * * So we set So we set * = * = / N / N NB. No assumptions about joint NB. No assumptions about joint
distributiondistribution

‘‘Corrected’ p-Values for Corrected’ p-Values for FWEFWE
Sidak (exact correction for Sidak (exact correction for independent tests)independent tests) ppii* = 1 – (1 – p* = 1 – (1 – pii))NN if all p if all pii are independent are independent ppii* * 1 – (1 – Np 1 – (1 – Npii + …) gives Bonferroni + …) gives Bonferroni
Bonferroni correctionBonferroni correction ppii* = Np* = Npii, if Np, if Npii < 1, otherwise 1 < 1, otherwise 1 Expectation argument Expectation argument
Still conservative if genes are co-regulated Still conservative if genes are co-regulated (correlated)(correlated)
Both are too conservative for array Both are too conservative for array use!use!

Traditional Multiple Comparisons Traditional Multiple Comparisons MethodsMethods
Key idea: sequential testingKey idea: sequential testing Order p-values: pOrder p-values: p(1)(1), p, p(2)(2), …, …
If pIf p(1)(1) significant then test p significant then test p(2) (2) , etc …, etc …
Mostly improvements on this simple Mostly improvements on this simple ideaidea
Complicated proofsComplicated proofs

Holm’s FWER ProcedureHolm’s FWER Procedure Order p-values: pOrder p-values: p(1)(1), …, p, …, p(N)(N)
If pIf p(1)(1) < < /N, reject H/N, reject H(1)(1) , then… , then…
If pIf p(2)(2) < < /(N-1), reject H/(N-1), reject H(2)(2) , then… , then…
Let k be the largest n such that pLet k be the largest n such that p(n)(n) < < /n, /n, for all n <= kfor all n <= k
Reject pReject p(1)(1) … p … p(k)(k)
Then P( at least one false positive) < Then P( at least one false positive) < Proof doesn’t depend on distributionsProof doesn’t depend on distributions

Hochberg’s FWER Hochberg’s FWER ProcedureProcedure
Find largest k: pFind largest k: p(k)(k) < < / (N – k + 1 ) / (N – k + 1 ) Then select genes (1) to (k)Then select genes (1) to (k) More powerful than Holm’s procedureMore powerful than Holm’s procedure But … requires assumptions: But … requires assumptions:
independence or ‘positive dependence’independence or ‘positive dependence’ When one type I error, could have When one type I error, could have
many many

Holm & Hochberg Holm & Hochberg Adjusted PAdjusted P
Order p-valuesOrder p-values pprr1 1 , , pprr22, …, , …, pprrMM
Holm (1979)Holm (1979) step-downstep-down adjusted p-values adjusted p-valuespp(j)(j)* = max* = maxk = 1 to jk = 1 to j {min ((M-k+1)p {min ((M-k+1)p(k)(k), 1)}, 1)}Adjust out-of-order p-values in relation Adjust out-of-order p-values in relation
to those lower (‘step-down’)to those lower (‘step-down’)
Hochberg (1988) step-upHochberg (1988) step-up adjusted p- adjusted p-valuesvalues
pp(j)(j)* = min* = mink = j to Mk = j to M {min ((M-k+1)p {min ((M-k+1)p(k)(k), 1) }, 1) }Adjust out-of-order p-values in relation Adjust out-of-order p-values in relation
to those higher (‘step-up’)to those higher (‘step-up’)

Simes’ LemmaSimes’ Lemma
Suppose we order the p-values from Suppose we order the p-values from N independent tests using random N independent tests using random data: data: pp(1)(1), p, p(2)(2), …, p, …, p(N)(N)
Pick a target threshold Pick a target threshold P( pP( p(1)(1) < < /N || p /N || p(2)(2) < 2 < 2 /N || p /N || p(3)(3) < 3 < 3 /N || … ) /N || … )
= =
P = P( min(p1,p2) < /2) + P(min(p1,p2) > /2 & max(p1,p2) < )
Area = ( – +
p2
p1

Simes’ TestSimes’ Test Pick a target threshold Pick a target threshold Order the p-values : pOrder the p-values : p(1)(1), p, p(2)(2), …, p, …, p(N)(N)
If for any k, pIf for any k, p(k)(k) < k < k /N /N Select the corresponding genes (1) to Select the corresponding genes (1) to
(k)(k) Test valid against complete Null Test valid against complete Null
hypothesis, if tests are independent hypothesis, if tests are independent or ‘positively dependent’or ‘positively dependent’
Doesn’t give strong control Doesn’t give strong control Somewhat non-conservative if Somewhat non-conservative if
negative correlations among testsnegative correlations among tests

Correlated Tests and Correlated Tests and FWERFWER
Typically tests are correlatedTypically tests are correlated Extreme case: all tests highly Extreme case: all tests highly
correlatedcorrelated One test is proxy for allOne test is proxy for all ‘‘Corrected’ p-values are the same as Corrected’ p-values are the same as
‘uncorrected’‘uncorrected’ Intermediate case: some correlationIntermediate case: some correlation
Usually probability of obtaining a p-Usually probability of obtaining a p-value by chance is in between Sidak value by chance is in between Sidak and uncorrected valuesand uncorrected values

Symptoms of Correlated Symptoms of Correlated TestsTests
P-value Histograms

Distributions of numbers of p-Distributions of numbers of p-values below thresholdvalues below threshold
10,000 genes;10,000 genes; 10,000 random drawings10,000 random drawings L: Uncorrelated R: Highly correlatedL: Uncorrelated R: Highly correlated
Permutation TestsPermutation Tests
We don’t know the true distribution of We don’t know the true distribution of gene expression measures within gene expression measures within groupsgroups
We simulate the distribution of samples We simulate the distribution of samples drawn from the same group by pooling drawn from the same group by pooling the two groups, and selecting randomly the two groups, and selecting randomly two groups of the same size we are two groups of the same size we are testing.testing.
Need at least 5 in each group to do this!Need at least 5 in each group to do this!

Permutation Tests – How Permutation Tests – How ToTo
Suppose samples 1,2,…,10 are in group Suppose samples 1,2,…,10 are in group 1 and samples 11 – 20 are from group 1 and samples 11 – 20 are from group 22
Permute 1,2,…,20: sayPermute 1,2,…,20: say 13,4,7,20,9,11,17,3,8,1913,4,7,20,9,11,17,3,8,19,,2,5,16,14,6,18,12,15,102,5,16,14,6,18,12,15,10 Construct t-scores for each gene based on Construct t-scores for each gene based on
these groupsthese groups Repeat many times to obtain Null Repeat many times to obtain Null
distribution of t-scoresdistribution of t-scores This will be a t-distribution This will be a t-distribution original original
distribution has no outliersdistribution has no outliers
Critiques of Critiques of PermutationsPermutations
Variances of permuted values for Variances of permuted values for really separate groups are inflated really separate groups are inflated
Permuted t -scores for many genes Permuted t -scores for many genes may be lower than from random may be lower than from random samples from the same populationsamples from the same population
Therefore somewhat too Therefore somewhat too conservative p-values for some conservative p-values for some genesgenes

Multivariate Permutation Multivariate Permutation TestsTests
Want a null distribution with same Want a null distribution with same correlation structure as given data correlation structure as given data but no real differences between but no real differences between groupsgroups
Permute group labels among Permute group labels among samplessamples
redo tests with pseudo-groupsredo tests with pseudo-groups repeat ad infinitum (10,000 times)repeat ad infinitum (10,000 times)

Westfall-Young ApproachWestfall-Young Approach Procedure analogous to Holm, except Procedure analogous to Holm, except
that at each stage, they compare the that at each stage, they compare the smallest p-value to the smallest p-value smallest p-value to the smallest p-value from an empirical null distribution of the from an empirical null distribution of the hypotheses being tested.hypotheses being tested.
How often is smallest p-value less than a How often is smallest p-value less than a given threshold if tests are correlated to given threshold if tests are correlated to the same extent and all Nulls are true?the same extent and all Nulls are true?
Construct permuted samples: n = 1,…,NConstruct permuted samples: n = 1,…,N Determine p-values Determine p-values ppjj
[[nn]] for each sample for each sample nn

Westfall-Young Approach – Westfall-Young Approach – 22
Construct permuted samples: n = 1,…,NConstruct permuted samples: n = 1,…,N Determine p-values Determine p-values ppjj
[[nn]] for each sample for each sample nn
To correct the i-th smallest p-value, drop To correct the i-th smallest p-value, drop those hypotheses already rejected (at a those hypotheses already rejected (at a smaller level)smaller level)
The i-th smallest p-value cannot be smaller The i-th smallest p-value cannot be smaller than any previous p-valuesthan any previous p-values
N
ppIp i
njijcorrected
i
)(min )(][
)1)...(1()(
N
ppIp
njjcorrected )(min )1(
][
)1(
Critiques of MV Permutation Critiques of MV Permutation as Nullas Null
Correlation structure of 2Correlation structure of 2ndnd order order statistics is not equivalentstatistics is not equivalent
E.g. we sometimes want to find E.g. we sometimes want to find significant correlations among genessignificant correlations among genes
The permutation distribution of The permutation distribution of correlations is NOT an adequate correlations is NOT an adequate Null distribution – why?Null distribution – why?
Use a bootstrap algorithm on Use a bootstrap algorithm on centered variablescentered variables see papers by Dudoit and van der Laansee papers by Dudoit and van der Laan

False Discovery RateFalse Discovery Rate
In genomic problems a few false In genomic problems a few false positives are often acceptable. positives are often acceptable.
Want to trade-off power .vs. false Want to trade-off power .vs. false positivespositives
Could control:Could control: Expected number of false positivesExpected number of false positives Expected proportion of false positivesExpected proportion of false positives
What to do with E(V/R) when R is 0?What to do with E(V/R) when R is 0? Actual proportion of false positivesActual proportion of false positives
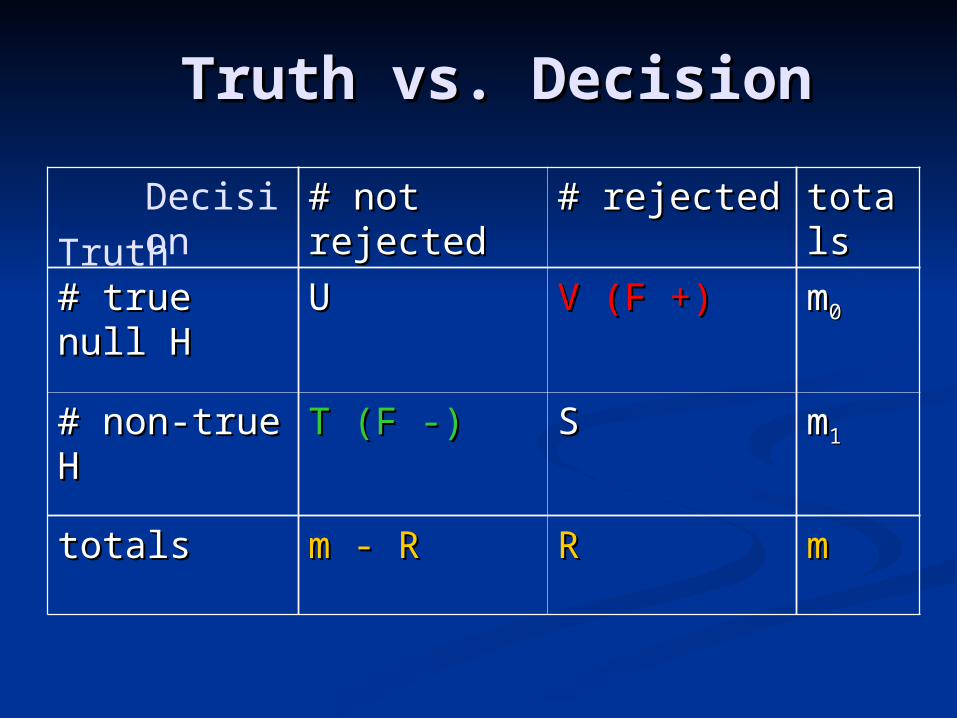
Truth vs. DecisionTruth vs. Decision
# not # not rejectedrejected
# rejected# rejected totaltotalss
# true null # true null HH
UU V (F +)V (F +) mm00
# non-true # non-true HH
T (F -)T (F -) SS mm11
totalstotals m - Rm - R RR mm
Truth
Decision
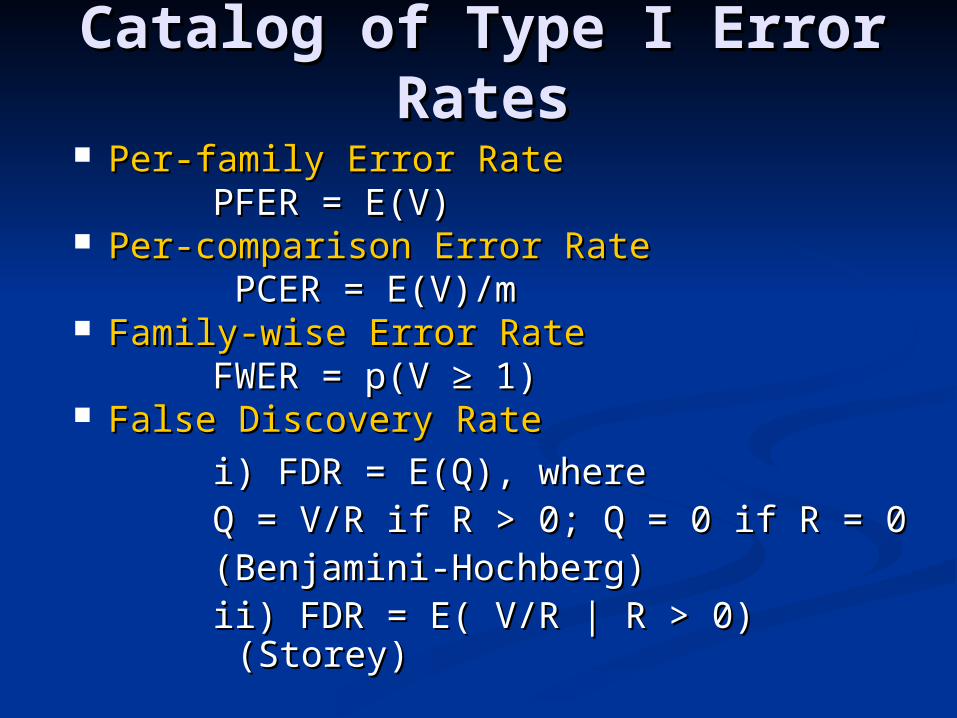
Catalog of Type I Error Catalog of Type I Error RatesRates
Per-family Error RatePer-family Error RatePFER = E(V)PFER = E(V)
Per-comparison Error RatePer-comparison Error Rate PCER = E(V)/mPCER = E(V)/m
Family-wise Error RateFamily-wise Error RateFWER = p(V ≥ 1)FWER = p(V ≥ 1)
False Discovery RateFalse Discovery Rate
i) FDR = E(Q), wherei) FDR = E(Q), whereQ = V/R if R > 0; Q = 0 if R = 0 Q = V/R if R > 0; Q = 0 if R = 0 (Benjamini-Hochberg)(Benjamini-Hochberg)ii) FDR = E( V/R | R > 0) (Storey)ii) FDR = E( V/R | R > 0) (Storey)

Benjamini-HochbergBenjamini-Hochberg
Can’t know what FDR is for a particular sampleCan’t know what FDR is for a particular sample B-H suggest procedure controlling B-H suggest procedure controlling averageaverage
FDRFDR Order the p-values : pOrder the p-values : p(1)(1), p, p(2)(2), …, p, …, p(N)(N)
If any pIf any p(k)(k) < k < k /N /N Then select genes (1) to (k)Then select genes (1) to (k)
q-value: smallest FDR at which the gene q-value: smallest FDR at which the gene becomes ‘significant’ becomes ‘significant’
NB: acceptable FDR may be much larger than NB: acceptable FDR may be much larger than acceptable p-value (e.g. 0.10 )acceptable p-value (e.g. 0.10 )
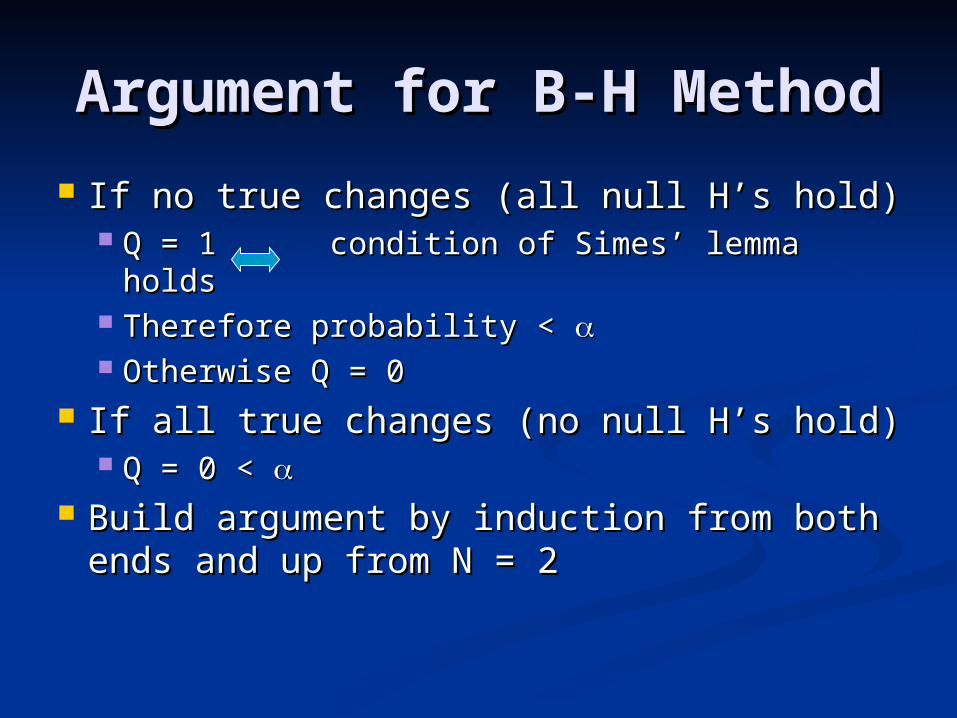
Argument for B-H Argument for B-H MethodMethod
If no true changes (all null H’s hold)If no true changes (all null H’s hold) Q = 1 condition of Simes’ lemma Q = 1 condition of Simes’ lemma
holdsholds Therefore probability < Therefore probability < Otherwise Q = 0 Otherwise Q = 0
If all true changes (no null H’s hold)If all true changes (no null H’s hold) Q = 0 < Q = 0 <
Build argument by induction from Build argument by induction from both ends and up from N = 2both ends and up from N = 2

Practical IssuesPractical Issues
Actual proportion of false positives Actual proportion of false positives varies from data set to data setvaries from data set to data set
Mean FDR could be low but could be Mean FDR could be low but could be high in your data sethigh in your data set

Distributions of numbers of p-Distributions of numbers of p-values below thresholdvalues below threshold
10,000 genes;10,000 genes; 10,000 random drawings10,000 random drawings L: Uncorrelated R: Highly correlatedL: Uncorrelated R: Highly correlated

Controlling the Number of Controlling the Number of FP’sFP’s
B-H procedure only guarantees long-B-H procedure only guarantees long-term average value of E(V/R|R>0)P(R>0) term average value of E(V/R|R>0)P(R>0) can be quite badly wrong in individual casescan be quite badly wrong in individual cases
Korn’s method gives confidence bound Korn’s method gives confidence bound on individual caseon individual case also addresses issue of correlationsalso addresses issue of correlations
Builds on Westfall-Young approach to Builds on Westfall-Young approach to control tail probability of proportion of control tail probability of proportion of false positives (TPPFP)false positives (TPPFP)

Korn’s ProcedureKorn’s Procedure To guarantee no more than k false To guarantee no more than k false
positivespositives Construct null distribution as in Westfall-Construct null distribution as in Westfall-
YoungYoung Order p-values: pOrder p-values: p(1)(1), …,p, …,p(M)(M)
Reject HReject H(1)(1), …,H, …,H(k)(k)
For next p-valuesFor next p-values Compare p-value to full null Compare p-value to full null
N.B. This gives strong controlN.B. This gives strong control Continue until one H not rejectedContinue until one H not rejected

Issues with Korn’s Issues with Korn’s ProcedureProcedure
Valid if select k first then follow Valid if select k first then follow through procedure, not if try a through procedure, not if try a number of different k and pick the number of different k and pick the one with most genes – as people one with most genes – as people actually proceedactually proceed
Only approximate FDROnly approximate FDR Computationally intensiveComputationally intensive Available in BRBAvailable in BRB

Storey’s pFDRStorey’s pFDR
Storey argues that E(Q | V > 0 ) is Storey argues that E(Q | V > 0 ) is what most people think FDR meanswhat most people think FDR means
Sometimes quite different from B-H Sometimes quite different from B-H FDRFDR Especially if number of rejected nulls Especially if number of rejected nulls
needs to be quite small in order to get needs to be quite small in order to get acceptable FDRacceptable FDR
E.G. if P(V=0) = 1/2 , then pFDR = E.G. if P(V=0) = 1/2 , then pFDR = 2*FDR2*FDR

A Bayesian A Bayesian InterpretationInterpretation
Suppose nature generates true nulls Suppose nature generates true nulls with probability with probability 00 and false nulls and false nulls with P = with P = 11
Then pFDR = P( H true | test Then pFDR = P( H true | test statistic)statistic)
Question: We rarely have an Question: We rarely have an accurate prior idea about accurate prior idea about 00
Storey suggests estimating itStorey suggests estimating it

Storey’s ProcedureStorey’s Procedure1.1. Estimate proportion of true Nulls (Estimate proportion of true Nulls (00))
Count number of p-values greater than ½ Count number of p-values greater than ½
2.2. Fix rejection region (or try several)Fix rejection region (or try several)
3.3. Estimate probability of p-value for true Estimate probability of p-value for true Null in rejection regionNull in rejection region
4.4. Form ratio: 2*{# p > ½} pForm ratio: 2*{# p > ½} p00 / {# p < / {# p < pp00}}
5.5. Adjust for small numbers (# p < pAdjust for small numbers (# p < p00))
6.6. Bootstrap ratio to obtain confidence Bootstrap ratio to obtain confidence interval for pFDRinterval for pFDR

Practical IssuesPractical Issues
Storey’s procedure may give Storey’s procedure may give reasonable estimates for reasonable estimates for 00 ~ O(1), ~ O(1), but can’t distinguish values of but can’t distinguish values of 11 that that are very smallare very small
How much does the significance test How much does the significance test depend on the choice of depend on the choice of 00??
Such differences may have a big Such differences may have a big impact on posterior probabilitiesimpact on posterior probabilities

Moderated TestsModerated Tests
Many false positives with t-test arise Many false positives with t-test arise because of under-estimate of because of under-estimate of variancevariance
Most gene variances are comparableMost gene variances are comparable (but not equal)(but not equal)
Can we use ‘pooled’ information Can we use ‘pooled’ information about all genes to help test each?about all genes to help test each?

Stein’s LemmaStein’s Lemma
Whenever you have multiple variables Whenever you have multiple variables with comparable distributions, you can with comparable distributions, you can make a more efficient joint estimator by make a more efficient joint estimator by ‘shrinking’ the individual estimates ‘shrinking’ the individual estimates toward the common meantoward the common mean
Can formalize this using Bayesian Can formalize this using Bayesian analysisanalysis Suppose true values come from prior Suppose true values come from prior
distrib.distrib. Mean of all parameter estimates is a good Mean of all parameter estimates is a good
estimate of prior meanestimate of prior mean

SAMSAM
Statistical Analysis of MicroarraysStatistical Analysis of Microarrays Uses a ‘fudge factor’ to shrink Uses a ‘fudge factor’ to shrink
individual SD estimates toward a individual SD estimates toward a common valuecommon value ddii = (x = (x1,i1,i – x – x2,i 2,i / ( s/ ( sii + s + s00))
Patented!Patented!

limmalimma
Empirical Bayes formalismEmpirical Bayes formalism Depends on prior estimate of Depends on prior estimate of
number of genes changednumber of genes changed Bioconductor’s approach – free! Bioconductor’s approach – free!

limmalimma Distribution Distribution ModelsModels
Sample statistics:Sample statistics:
PriorsPriors Coefficients:Coefficients: Variances:Variances:

Moderated T StatisticModerated T Statistic
Moderated variance estimate:Moderated variance estimate:
Moderated tModerated t
Moderated t has t distribution on Moderated t has t distribution on dd00+d+dgg df. df.