silverstone master issuer plc residential … · 2010-1 a1 three-month usd ... silverstone master...
TRANSCRIPT

1
Final Terms dated 27 October 2010
(to the base prospectus dated 22 October 2010)
SILVERSTONE MASTER ISSUER PLC (Incorporated with limited liability in England and Wales with registered number 6612744)
Residential Mortgage Backed Note Programme Issue of Series 2010-1 Notes
Series Class Interest rate Initial principal
amount Issue price
Bullet redemption dates
Final Maturity date
2010-1 A1 Three-month USD LIBOR + 1.40 per cent. Floating rate
$550,000,000 100% 21 October 2013
21 January 2055
2010-1 A2 Three-month EURIBOR + 1.50 per cent. Floating rate
€1,100,000,000 100% 21 October 2015
21 January 2055
2010-1 A3 Three-month USD LIBOR + 1.50 per cent. Floating rate
$300,000,000 100% 21 October 2015
21 January 2055
2010-1 Z Three-month Sterling LIBOR + 1.50 per cent. Floating rate
£123,000,000 100% Not Applicable 21 January 2055
Terms used herein shall be deemed to be defined as such for the purposes of the conditions set forth in the base prospectus dated 22 October 2010 which constitutes a base prospectus (the base prospectus) for the purposes of the Prospectus Directive (Directive 2003/71/EC) (the Prospectus Directive). This document constitutes the final terms (the final terms) of the notes described herein for the purposes of Article 5.4 of the Prospectus Directive, is supplemental to, and must be read in conjunction with the base prospectus. This document is not a prospectus for purposes of Section 12(a)(2) or any other provision of or rule under the United States Securities Act of 1933, as amended. Full information on the issuer and the offer of the notes is only available on the basis of the combination of the final terms and the base prospectus. The base prospectus is available for viewing at the registered office of the issuer at Fifth Floor, 6 Broad Street Place, London EC2M 7HJ.
Arranger for the programme
Nationwide Building Society
Dealers for the 2010-1 Issue BofA Merrill Lynch Deutsche Bank AG UBS Investment Bank
2
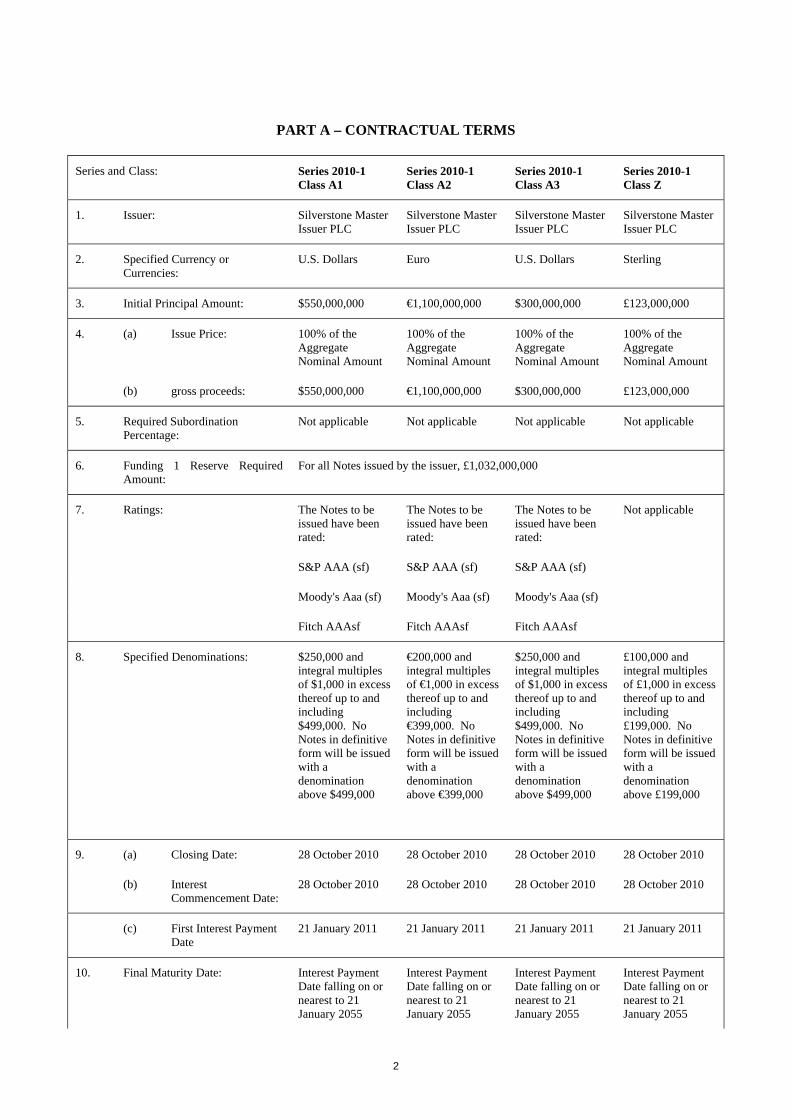
PART A – CONTRACTUAL TERMS Series and Class: Series 2010-1
Class A1 Series 2010-1 Class A2
Series 2010-1 Class A3
Series 2010-1 Class Z
1. Issuer: Silverstone Master Issuer PLC
Silverstone Master Issuer PLC
Silverstone Master Issuer PLC
Silverstone Master Issuer PLC
2. Specified Currency or Currencies:
U.S. Dollars Euro U.S. Dollars Sterling
3. Initial Principal Amount: $550,000,000 €1,100,000,000 $300,000,000 £123,000,000
4. (a) Issue Price: 100% of the Aggregate Nominal Amount
100% of the Aggregate Nominal Amount
100% of the Aggregate Nominal Amount
100% of the Aggregate Nominal Amount
(b) gross proceeds: $550,000,000 €1,100,000,000 $300,000,000 £123,000,000
5. Required Subordination Percentage:
Not applicable Not applicable Not applicable Not applicable
6. Funding 1 Reserve Required Amount:
For all Notes issued by the issuer, £1,032,000,000
7. Ratings: The Notes to be issued have been rated:
The Notes to be issued have been rated:
The Notes to be issued have been rated:
Not applicable
S&P AAA (sf) S&P AAA (sf) S&P AAA (sf)
Moody's Aaa (sf) Moody's Aaa (sf) Moody's Aaa (sf)
Fitch AAAsf Fitch AAAsf Fitch AAAsf
8. Specified Denominations: $250,000 and integral multiples of $1,000 in excess thereof up to and including $499,000. No Notes in definitive form will be issued with a denomination above $499,000
€200,000 and integral multiples of €1,000 in excess thereof up to and including €399,000. No Notes in definitive form will be issued with a denomination above €399,000
$250,000 and integral multiples of $1,000 in excess thereof up to and including $499,000. No Notes in definitive form will be issued with a denomination above $499,000
£100,000 and integral multiples of £1,000 in excess thereof up to and including £199,000. No Notes in definitive form will be issued with a denomination above £199,000
9. (a) Closing Date: 28 October 2010 28 October 2010 28 October 2010 28 October 2010
(b) Interest Commencement Date:
28 October 2010 28 October 2010 28 October 2010 28 October 2010
(c) First Interest Payment Date
21 January 2011 21 January 2011 21 January 2011 21 January 2011
10. Final Maturity Date: Interest Payment Date falling on or nearest to 21 January 2055
Interest Payment Date falling on or nearest to 21 January 2055
Interest Payment Date falling on or nearest to 21 January 2055
Interest Payment Date falling on or nearest to 21 January 2055

3
Series and Class: Series 2010-1 Class A1
Series 2010-1 Class A2
Series 2010-1 Class A3
Series 2010-1 Class Z
11. Interest Basis: 3-month USD LIBOR Floating Rate
3-month EURIBOR Floating Rate
3-month USD LIBOR Floating Rate
3-month Sterling LIBOR Floating Rate
12. Redemption/Payment Basis: Bullet Bullet Bullet Pass-through
13. Change of Interest Basis or Redemption/Payment Basis:
Not applicable Not applicable Not applicable Not applicable
14. (a) Listing: Application has been made by the issuer (or on its behalf) for the Notes to be admitted to trading on the London Stock Exchange's Regulated Market and listed on the Official List of the UK Listing Authority
Application has been made by the issuer (or on its behalf) for the Notes to be admitted to trading on the London Stock Exchange's Regulated Market and listed on the Official List of the UK Listing Authority
Application has been made by the issuer (or on its behalf) for the Notes to be admitted to trading on the London Stock Exchange's Regulated Market and listed on the Official List of the UK Listing Authority
Not applicable
(b) Estimate of total expenses related to admission to trading:
For all Series 2010-1 Notes, an aggregate amount of £5,150.
15. Status of the Notes: Direct, secured and unconditional obligation of the issuer
Direct, secured and unconditional obligation of the issuer
Direct, secured and unconditional obligation of the issuer
Direct, secured and unconditional obligation of the issuer
16. Date of Board approval for issuance of the Notes obtained:
22 October 2010 22 October 2010 22 October 2010 22 October 2010
17. Method of distribution: Syndicated
Syndicated
Syndicated
Non-syndicated. Nationwide Building Society intends to purchase the Series 2010-1 Class Z Notes on the Closing Date
Provisions Relating to interest (if any) Payable
18. Fixed Rate Note Provisions: Not applicable Not applicable Not applicable Not applicable
19. Floating Rate Note Provisions: Applicable Applicable Applicable Applicable
4
Series and Class: Series 2010-1 Class A1
Series 2010-1 Class A2
Series 2010-1 Class A3
Series 2010-1 Class Z
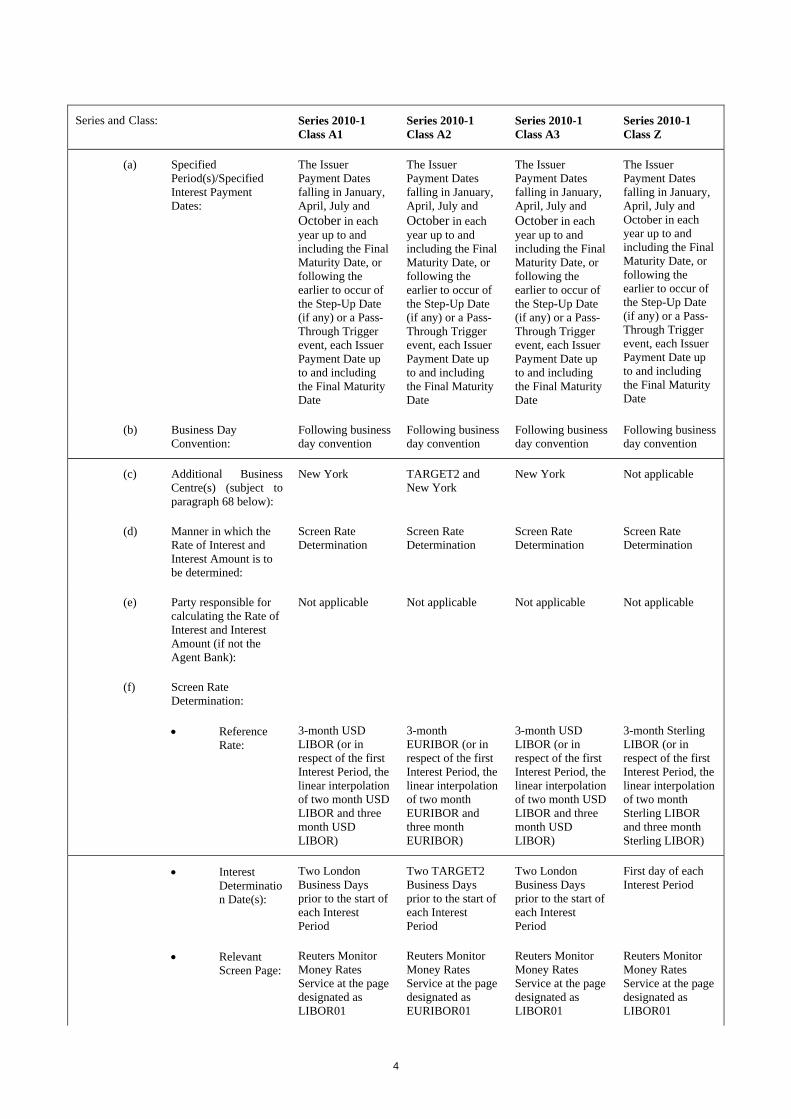
(a) Specified Period(s)/Specified Interest Payment Dates:
The Issuer Payment Dates falling in January, April, July and October in each year up to and including the Final Maturity Date, or following the earlier to occur of the Step-Up Date (if any) or a Pass-Through Trigger event, each Issuer Payment Date up to and including the Final Maturity Date
The Issuer Payment Dates falling in January, April, July and October in each year up to and including the Final Maturity Date, or following the earlier to occur of the Step-Up Date (if any) or a Pass-Through Trigger event, each Issuer Payment Date up to and including the Final Maturity Date
The Issuer Payment Dates falling in January, April, July and October in each year up to and including the Final Maturity Date, or following the earlier to occur of the Step-Up Date (if any) or a Pass-Through Trigger event, each Issuer Payment Date up to and including the Final Maturity Date
The Issuer Payment Dates falling in January, April, July and October in each year up to and including the Final Maturity Date, or following the earlier to occur of the Step-Up Date (if any) or a Pass-Through Trigger event, each Issuer Payment Date up to and including the Final Maturity Date
(b) Business Day Convention:
Following business day convention
Following business day convention
Following business day convention
Following business day convention
(c) Additional Business Centre(s) (subject to paragraph 68 below):
New York TARGET2 and New York
New York Not applicable
(d) Manner in which the Rate of Interest and Interest Amount is to be determined:
Screen Rate Determination
Screen Rate Determination
Screen Rate Determination
Screen Rate Determination
(e) Party responsible for calculating the Rate of Interest and Interest Amount (if not the Agent Bank):
Not applicable Not applicable Not applicable Not applicable
(f) Screen Rate Determination:
• Reference Rate:
3-month USD LIBOR (or in respect of the first Interest Period, the linear interpolation of two month USD LIBOR and three month USD LIBOR)
3-month EURIBOR (or in respect of the first Interest Period, the linear interpolation of two month EURIBOR and three month EURIBOR)
3-month USD LIBOR (or in respect of the first Interest Period, the linear interpolation of two month USD LIBOR and three month USD LIBOR)
3-month Sterling LIBOR (or in respect of the first Interest Period, the linear interpolation of two month Sterling LIBOR and three month Sterling LIBOR)
• Interest Determination Date(s):
Two London Business Days prior to the start of each Interest Period
Two TARGET2 Business Days prior to the start of each Interest Period
Two London Business Days prior to the start of each Interest Period
First day of each Interest Period
• Relevant Screen Page:
Reuters Monitor Money Rates Service at the page designated as LIBOR01
Reuters Monitor Money Rates Service at the page designated as EURIBOR01
Reuters Monitor Money Rates Service at the page designated as LIBOR01
Reuters Monitor Money Rates Service at the page designated as LIBOR01

5
Series and Class: Series 2010-1 Class A1
Series 2010-1 Class A2
Series 2010-1 Class A3
Series 2010-1 Class Z
(g) ISDA Determination:
• Floating Rate Option:
Not applicable Not applicable Not applicable Not applicable
• Designated Maturity:
Not applicable Not applicable Not applicable Not applicable
• Reset Date: Not applicable Not applicable Not applicable Not applicable
(h) Margin(s): + 1.40 % per annum
+ 1.50 % per annum
+ 1.50 % per annum
+ 1.50 % per annum
(i) Minimum Rate of Interest:
Not applicable Not applicable Not applicable Not applicable
(j) Maximum Rate of Interest:
Not applicable Not applicable Not applicable Not applicable
(k) Step-Up Date Interest Payment Date occurring in October 2013
Interest Payment Date occurring in October 2015
Interest Payment Date occurring in October 2015
Not applicable
• Step-Up Margin(s):
+ 2.80 % per annum
+ 3.00 % per annum
+ 3.00 % per annum
Not applicable
• Step-Up Minimum Rate of Interest:
Not applicable Not applicable Not applicable Not applicable
• Step-Up Maximum Rate of Interest:
Not applicable Not applicable Not applicable Not applicable
(l) Day Count Fraction: Actual/360 Actual/360 Actual/360 Actual/365 (fixed)
(m) Fallback provisions, rounding provisions and any other terms relating to the method of calculating interest on Floating Rate Notes, if different from those set out in the Conditions:
Not applicable Not applicable Not applicable Not applicable
20. Zero Coupon Note Provisions Not applicable Not applicable Not applicable Not applicable

6
Series and Class: Series 2010-1 Class A1
Series 2010-1 Class A2
Series 2010-1 Class A3
Series 2010-1 Class Z
General Provisions Applicable to the Notes
21. (a) Form of Notes: Rule 144A Global Notes ($480,600,000 nominal amount) registered in the name of a nominee for DTC
Reg S Global Note ($69,400,000 nominal amount) registered in the name of a nominee for the common depositary of Euroclear and Clearstream, Luxembourg
Rule 144A Global Notes (€25,500,000 nominal amount) registered in the name of a nominee for a common safekeeper for Euroclear and Clearstream, Luxembourg
Reg S Global Note (€1,074,500,000 nominal amount) registered in the name of a nominee for a common safekeeper for Euroclear and Clearstream, Luxembourg
Rule 144A Global Notes ($300,000,000 nominal amount) registered in the name of a nominee for DTC
Reg S Global Note ($0 nominal amount) registered in the name of a nominee for the common depositary of Euroclear and Clearstream, Luxembourg
Reg S Definitive Note
(b) New Global Note No No No No
22. Additional Financial Centre(s) or other special provisions relating to Interest Payment Dates (subject to paragraph 68 below):
New York TARGET2 and New York
New York Not applicable
23. Talons for future Coupons or Receipts to be attached to Definitive Notes (and dates on which such Talons mature):
No No No No
24. Details relating to Bullet Redemption Notes:
Applicable Applicable Applicable Not applicable
(a) Redemption Amount: $550,000,000 €1,100,000,000 $300,000,000 Not applicable
(b) Bullet Redemption Date:
Interest Payment Date occurring in October 2013
Interest Payment Date occurring in October 2015
Interest Payment Date occurring in October 2015
Not applicable
25. Details relating to Scheduled Redemption Notes:
Not applicable Not applicable Not applicable Not applicable
26. Optional Redemption Applicable Applicable Applicable Applicable
(a) Condition 5.4 and 5.5: Applicable Applicable Applicable Applicable
(b) Optional Redemption Date:
Each Interest Payment Date on or after the Interest Payment Date in October 2013
Each Interest Payment Date on or after the Interest Payment Date in October 2015
Each Interest Payment Date on or after the Interest Payment Date in October 2015
Each Interest Payment Date, subject to Condition 5.4
7
Series and Class: Series 2010-1 Class A1
Series 2010-1 Class A2
Series 2010-1 Class A3
Series 2010-1 Class Z
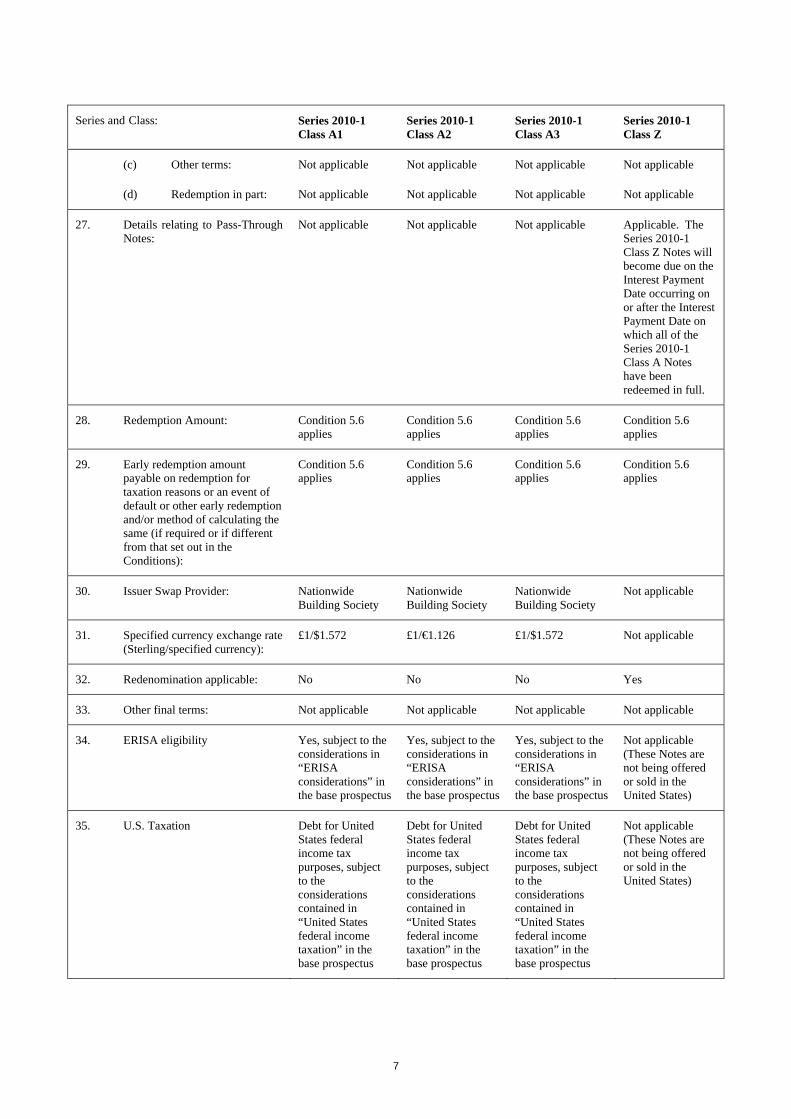
(c) Other terms: Not applicable Not applicable Not applicable Not applicable
(d) Redemption in part: Not applicable Not applicable Not applicable Not applicable
27. Details relating to Pass-Through Notes:
Not applicable Not applicable Not applicable Applicable. The Series 2010-1 Class Z Notes will become due on the Interest Payment Date occurring on or after the Interest Payment Date on which all of the Series 2010-1 Class A Notes have been redeemed in full.
28. Redemption Amount: Condition 5.6 applies
Condition 5.6 applies
Condition 5.6 applies
Condition 5.6 applies
29. Early redemption amount payable on redemption for taxation reasons or an event of default or other early redemption and/or method of calculating the same (if required or if different from that set out in the Conditions):
Condition 5.6 applies
Condition 5.6 applies
Condition 5.6 applies
Condition 5.6 applies
30. Issuer Swap Provider: Nationwide Building Society
Nationwide Building Society
Nationwide Building Society
Not applicable
31. Specified currency exchange rate (Sterling/specified currency):
£1/$1.572 £1/€1.126 £1/$1.572 Not applicable
32. Redenomination applicable: No No No Yes
33. Other final terms: Not applicable Not applicable Not applicable Not applicable
34. ERISA eligibility Yes, subject to the considerations in “ERISA considerations” in the base prospectus
Yes, subject to the considerations in “ERISA considerations” in the base prospectus
Yes, subject to the considerations in “ERISA considerations” in the base prospectus
Not applicable (These Notes are not being offered or sold in the United States)
35. U.S. Taxation Debt for United States federal income tax purposes, subject to the considerations contained in “United States federal income taxation” in the base prospectus
Debt for United States federal income tax purposes, subject to the considerations contained in “United States federal income taxation” in the base prospectus
Debt for United States federal income tax purposes, subject to the considerations contained in “United States federal income taxation” in the base prospectus
Not applicable (These Notes are not being offered or sold in the United States)
8
Series and Class: Series 2010-1 Class A1
Series 2010-1 Class A2
Series 2010-1 Class A3
Series 2010-1 Class Z
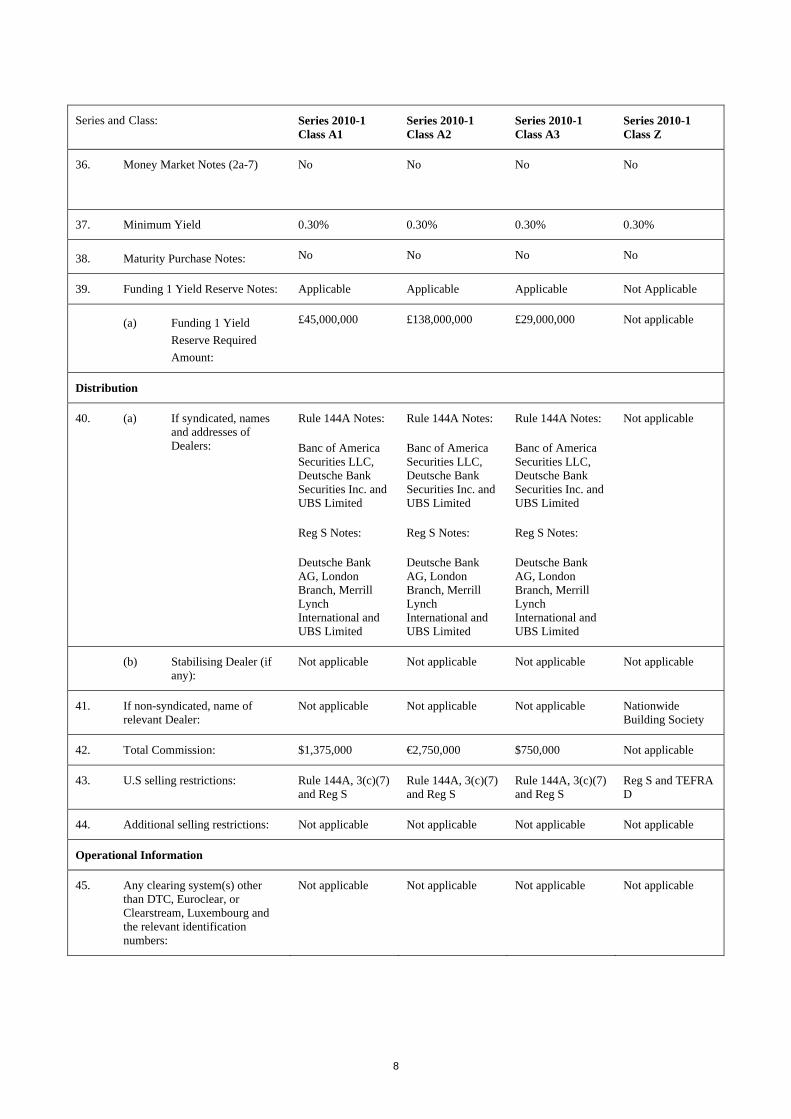
36. Money Market Notes (2a-7) No
No
No
No
37. Minimum Yield 0.30% 0.30% 0.30% 0.30%
38. Maturity Purchase Notes: No No No No
39. Funding 1 Yield Reserve Notes: Applicable Applicable Applicable Not Applicable
(a) Funding 1 Yield Reserve Required Amount:
£45,000,000 £138,000,000 £29,000,000 Not applicable
Distribution
40. (a) If syndicated, names and addresses of Dealers:
Rule 144A Notes:
Banc of America Securities LLC, Deutsche Bank Securities Inc. and UBS Limited
Reg S Notes:
Deutsche Bank AG, London Branch, Merrill Lynch International and UBS Limited
Rule 144A Notes:
Banc of America Securities LLC, Deutsche Bank Securities Inc. and UBS Limited
Reg S Notes:
Deutsche Bank AG, London Branch, Merrill Lynch International and UBS Limited
Rule 144A Notes:
Banc of America Securities LLC, Deutsche Bank Securities Inc. and UBS Limited
Reg S Notes:
Deutsche Bank AG, London Branch, Merrill Lynch International and UBS Limited
Not applicable
(b) Stabilising Dealer (if any):
Not applicable Not applicable Not applicable Not applicable
41. If non-syndicated, name of relevant Dealer:
Not applicable Not applicable Not applicable Nationwide Building Society
42. Total Commission: $1,375,000 €2,750,000 $750,000 Not applicable
43. U.S selling restrictions: Rule 144A, 3(c)(7) and Reg S
Rule 144A, 3(c)(7) and Reg S
Rule 144A, 3(c)(7) and Reg S
Reg S and TEFRA D
44. Additional selling restrictions: Not applicable Not applicable Not applicable Not applicable
Operational Information
45. Any clearing system(s) other than DTC, Euroclear, or Clearstream, Luxembourg and the relevant identification numbers:
Not applicable Not applicable Not applicable Not applicable

9
Series and Class: Series 2010-1 Class A1
Series 2010-1 Class A2
Series 2010-1 Class A3
Series 2010-1 Class Z
46. Intended to be held in a manner which would allow Eurosystem eligibility:
No
Yes
Note that the designation "yes" simply means that the notes are intended upon issue to be deposited with one of the International Central Securities Depositaries (ICSDs) as common safekeeper, and registered in the name of a nominee of one of the ICSDs acting as common safekeeper, that is, held under the New Safekeeping Structure and does not necessarily mean that the notes will be recognised as eligible collateral for Eurosystem monetary policy and intra-day credit operations by the Eurosystem either upon issue or at any or all times during their life. Such recognition will depend upon satisfaction of the Eurosystem eligibility criteria.
No
No
47. Delivery: Delivery against payment
Delivery against payment
Delivery against payment
Delivery free of payment
48. Names and addresses of additional Paying Agent(s) (if any):
Not applicable Not applicable Not applicable Not applicable

10
Series and Class: Series 2010-1 Class A1
Series 2010-1 Class A2
Series 2010-1 Class A3
Series 2010-1 Class Z
49. ISIN Code: Rule 144A Notes to be held through DTC: US82846GAA85
Reg S Notes: XS0552146465
Rule 144A Notes to be held through Euroclear/ Clearstream, Luxembourg: XS0552340787
Reg S Notes: XS0552150228
Rule 144A Notes to be held through DTC: US82846GAC42
Reg S Notes: XS0553809533
Not applicable
50. Common Code: Rule 144A Notes to be held through DTC: 055234248
Reg S Notes: 055214646
Rule 144A Notes to be held through Euroclear/ Clearstream, Luxembourg: 055234078
Reg S Notes: 055215022
Rule 144A Notes to be held through DTC: 055382727
Reg S Notes: 055380953
Not applicable
51. CUSIP: 82846GAA8 Not applicable 82846GAC4 Not applicable
Term Advance Information
52. Borrower: Silverstone Funding (No. 1) Limited
Silverstone Funding (No. 1) Limited
Silverstone Funding (No. 1) Limited
Silverstone Funding (No. 1) Limited
53. Tier of Term Advance: Term AAA Advance
Term AAA Advance
Term AAA Advance
Term NR Advance
54. Series Number: Series 2010-1 Class A1
Series 2010-1 Class A2
Series 2010-1 Class A3
Series 2010-1 Class Z
55. Designation of Term Advance: Bullet Term Advance
Bullet Term Advance
Bullet Term Advance
Pass-Through Term Advance
56. Initial Principal Amount: £349,872,773.54 £976,909,413.85 £190,839,694.66 £123,000,000
57. (a) Closing Date: 28 October 2010 28 October 2010 28 October 2010 28 October 2010
(b) Interest Commencement Date:
28 October 2010 28 October 2010 28 October 2010 28 October 2010
58. Initial interest rate per annum: 3-month Sterling LIBOR +1.42 %
3-month Sterling LIBOR +1.70 %
3-month Sterling LIBOR +1.52 %
3-month Sterling LIBOR +1.50 %
59. Funding 1 Yield Reserve Revenue Margin:
0.25% 0.25% 0.25% Not applicable
60. Step-Up Date (if any): The Funding 1 payment date occurring in October 2013
The Funding 1 payment date occurring in October 2015
The Funding 1 payment date occurring in October 2015
Not applicable
61. Stepped-up interest rate per annum:
3-month Sterling LIBOR +2.82 %
3-month Sterling LIBOR +3.20 %
3-month Sterling LIBOR +3.02 %
Not applicable

11
Series and Class: Series 2010-1 Class A1
Series 2010-1 Class A2
Series 2010-1 Class A3
Series 2010-1 Class Z
62. Funding 1 Yield Reserve Revenue Margin following the Step-Up Date:
On each Interest Payment Date following the Step-Up Date, if the Yield Reserve Percentage (defined below) is at least 2.57% then the Funding 1 Yield Reserve Revenue Margin is 0.25%, otherwise the Funding 1 Yield Reserve Revenue Margin is 2.82% minus the Yield Reserve Percentage.
The Yield Reserve Percentage is equal to A / (B x C), where A = the balance standing to the credit of the applicable Funding 1 Yield Reserve Sub-Ledger; B = the Principal Amount Outstanding of the Series 2010-1 Class A1 Notes; and C = the day count fraction for the relevant interest period
On each Interest Payment Date following the Step-Up Date, if the Yield Reserve Percentage (defined below) is at least 2.95% then the Funding 1 Yield Reserve Revenue Margin is 0.25%, otherwise the Funding 1 Yield Reserve Revenue Margin is 3.20% minus the Yield Reserve Percentage.
The Yield Reserve Percentage is equal to A / (B x C), where A = the balance standing to the credit of the applicable Funding 1 Yield Reserve Sub-Ledger; B = the Principal Amount Outstanding of the Series 2010-1 Class A2 Notes; and C = the day count fraction for the relevant interest period
On each Interest Payment Date following the Step-Up Date, if the Yield Reserve Percentage (defined below) is at least 2.77% then the Funding 1 Yield Reserve Revenue Margin is 0.25%, otherwise the Funding 1 Yield Reserve Revenue Margin is 3.02% minus the Yield Reserve Percentage.
The Yield Reserve Percentage is equal to A / (B x C), where A = the balance standing to the credit of the applicable Funding 1 Yield Reserve Sub-Ledger; B = the Principal Amount Outstanding of the Series 2010-1 Class A3 Notes; and C = the day count fraction for the relevant interest period
Not applicable
63. Details relating to Bullet Term Advances:
Applicable Applicable Applicable Not applicable
64. (a) Bullet Repayment Date
The Funding 1 payment date in October 2013
The Funding 1 payment date in October 2015
The Funding 1 payment date in October 2015
Not applicable
(b) Repayment Amount £349,872,773.54 £976,909,413.85 £190,839,694.66 Not applicable
(c) Relevant Accumulation Amount:
£349,872,773.54 £976,909,413.85 £190,839,694.66 Not applicable
12
Series and Class: Series 2010-1 Class A1
Series 2010-1 Class A2
Series 2010-1 Class A3
Series 2010-1 Class Z
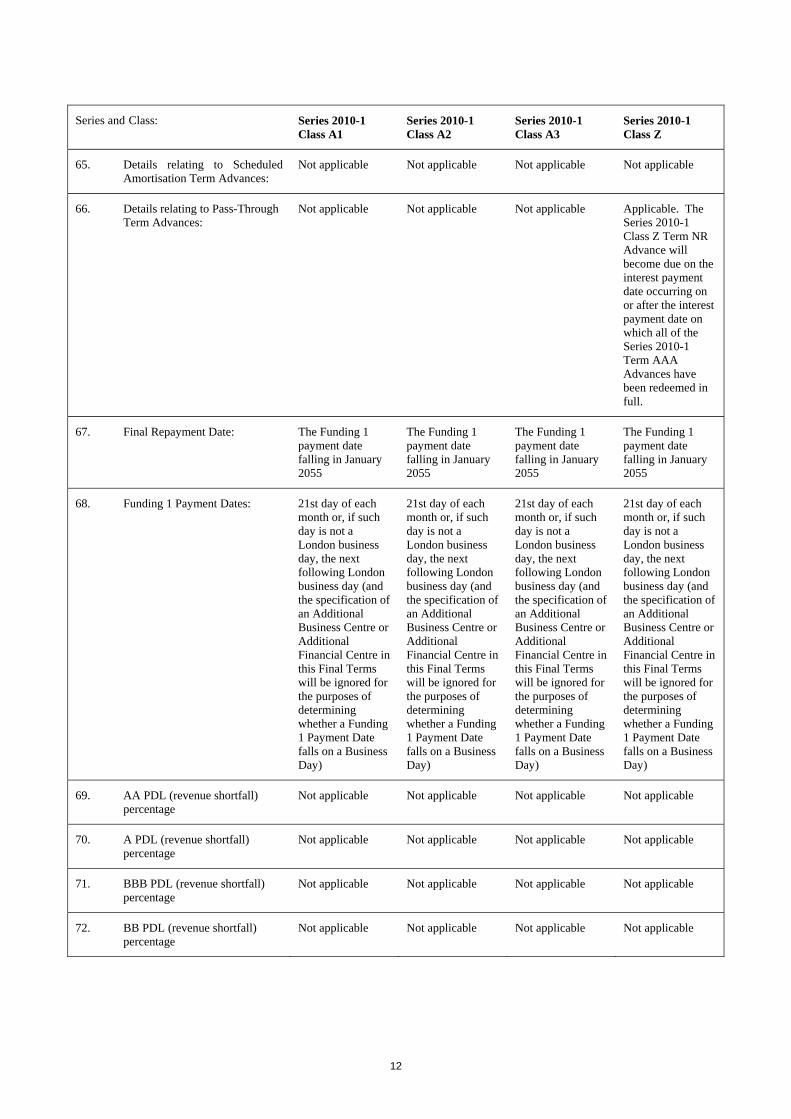
65. Details relating to Scheduled Amortisation Term Advances:
Not applicable Not applicable Not applicable Not applicable
66. Details relating to Pass-Through Term Advances:
Not applicable Not applicable Not applicable Applicable. The Series 2010-1 Class Z Term NR Advance will become due on the interest payment date occurring on or after the interest payment date on which all of the Series 2010-1 Term AAA Advances have been redeemed in full.
67. Final Repayment Date: The Funding 1 payment date falling in January 2055
The Funding 1 payment date falling in January 2055
The Funding 1 payment date falling in January 2055
The Funding 1 payment date falling in January 2055
68. Funding 1 Payment Dates: 21st day of each month or, if such day is not a London business day, the next following London business day (and the specification of an Additional Business Centre or Additional Financial Centre in this Final Terms will be ignored for the purposes of determining whether a Funding 1 Payment Date falls on a Business Day)
21st day of each month or, if such day is not a London business day, the next following London business day (and the specification of an Additional Business Centre or Additional Financial Centre in this Final Terms will be ignored for the purposes of determining whether a Funding 1 Payment Date falls on a Business Day)
21st day of each month or, if such day is not a London business day, the next following London business day (and the specification of an Additional Business Centre or Additional Financial Centre in this Final Terms will be ignored for the purposes of determining whether a Funding 1 Payment Date falls on a Business Day)
21st day of each month or, if such day is not a London business day, the next following London business day (and the specification of an Additional Business Centre or Additional Financial Centre in this Final Terms will be ignored for the purposes of determining whether a Funding 1 Payment Date falls on a Business Day)
69. AA PDL (revenue shortfall) percentage
Not applicable Not applicable Not applicable Not applicable
70. A PDL (revenue shortfall) percentage
Not applicable Not applicable Not applicable Not applicable
71. BBB PDL (revenue shortfall) percentage
Not applicable Not applicable Not applicable Not applicable
72. BB PDL (revenue shortfall) percentage
Not applicable Not applicable Not applicable Not applicable

13
Series and Class: Series 2010-1 Class A1
Series 2010-1 Class A2
Series 2010-1 Class A3
Series 2010-1 Class Z
Remarketing Arrangements
73. Do the Notes have the benefit of remarketing arrangements:
No No No No

14
PART B – OTHER INFORMATION
1. LISTING AND ADMISSION TO TRADING
Application has been made by the issuer (or on its behalf) for the Series 2010-1 Class A1 Notes, the Series 2010-1 Class A2 Notes and the Series 2010-1 Class A3 Notes (together the Series 2010-1 Class A Notes) to be admitted to trading on the London Stock Exchange's regulated market and listing on the Official List of the UK Listing Authority) with effect from 28 October 2010.
2. INTERESTS OF NATURAL AND LEGAL PERSONS INVOLVED IN THE ISSUE
Save as disclosed in these Final Terms, so far as the issuer is aware, no person involved in the issue of the Notes has an interest material to the offer.

15
Issuer Swap Provider(s)
Nationwide Building Society (Nationwide) is the Issuer Swap Provider for the Series 2010-1 Class A1 Notes, the Series 2010-1 Class A2 Notes and the Series 2010-1 Class A3 Notes. For information on the Issuer Swap Provider, please see the section titled “Nationwide Building Society” in the base prospectus. Additionally, the audited financial statements of Nationwide for the financial year ended 4 April 2010 and accompanying notes thereto may be accessed through Nationwide’s website at https://www.nationwide-members.co.uk/. The material contained on this website does not form part of this final terms.
None of Banc of America Securities LLC, Merrill Lynch International, Deutsche Bank Securities Inc., Deutsche Bank AG, London Branch or UBS Limited make any representation as to the accuracy or completeness of the Issuer Swap Provider information (or any affiliate of such person) and do not accept responsibility for such information, including, without limitation, the audited financial statements and accompanying notes available at the website address of Nationwide listed above.

16
Start-up term advance
The start-up loan to be made available to Funding 1 on the closing date in connection with Series 2010-1 will have the following terms:
Start-up loan provider: Nationwide Building Society
Initial outstanding principal balance: £300,000,000
Interest rate: 3-month sterling LIBOR plus 1.00% per annum
Other series issued
As of the closing date, the aggregate principal amount outstanding of notes issued by the issuer (converted, where applicable, into sterling at the applicable specified currency exchange rate), including the notes described herein, will be:
Class A notes £19,092,621,882
Class B notes £0
Class M notes £0
Class C notes £0
Class D notes £0
Class Z notes £1,861,200,000
Other term advances
As of the closing date, the aggregate outstanding principal amount of term advances advanced by the issuer to Funding 1 under the intercompany loan agreement, including the term advances described herein will be:
AAA £19,092,621,882
AA £0
A £0
BBB £0
BB £0
NR £1,861,200,000
Mortgages Trust and the Portfolio
Trust Property
As at the relevant closing date:
• The minimum seller share will be approximately £1,600,000,000;

17
• Funding 1's share of the trust property will be approximately £20,900,000,000 representing approximately 67% of the trust property; and
• the seller's share of the trust property will be approximately £10,500,000,000 representing approximately 33% of the trust property.
The actual amounts of the Funding 1 share of the trust property and the seller share of the trust property as at the closing date will not be determined until the closing date which will be after the date of these final terms.
Non-asset trigger event
For the purposes of paragraph (d) of the definition of non-asset trigger event, the aggregate outstanding balance of loans comprising the trust property must be (i) in respect of the period up to and including the trust calculation date in October 2014, not less than £28,000,000,000, (ii) in respect of the period from but excluding the trust calculation date in October 2014 up to and including the trust calculation date in October 2016, not less than £5,200,000,000 and (iii) in respect of the period from but excluding the trust calculation date occurring in October 2016, £0. See "The mortgages trust — Cash management of trust property — principal receipts" in the base prospectus.
The required aggregate outstanding balance of loans, as determined in accordance with the preceding paragraph, constitutes the minimum trust size.
Funding 1 Cash Accumulation Period
With respect to the Series 2010-1 Class A1 Notes, the Series 2010-1 Class A2 Notes and the Series 2010-1 Class A3 Notes, for the purposes of paragraph (b) of the definition of Funding 1 cash accumulation period, the number of months shall be 6 as at the date of these final terms.
Repayment of term advances before a trigger event and before intercompany loan acceleration or acceleration of all notes - Rule (1) – Repayment deferrals
For the purposes of paragraph (C) of Rule (1) – Repayment Deferrals, X shall be equal to 20%.
Provisions relating to the Funding 1 Swap Agreement
Funding 1 Swap Premium: Not Applicable
Party A Fixed Amount: Not Applicable
Interest payment dates for payment of Party A Fixed Amount: Not Applicable
Replenishment of General Reserve Fund
Following the occurrence of an arrears or step-up trigger event, the general reserve fund will be replenished from any Funding 1 available revenue receipts to be paid in accordance with item (q) of the Funding 1 pre-enforcement revenue priority of payments up to and including an amount equal to the sum of the Funding 1 reserve required amount and:
(a) if an arrears or step-up trigger event has occurred under item (i) only of the arrears or step-up trigger event definition, £60,000,000;
(b) if an arrears or step-up trigger event has occurred under item (ii) only of the arrears or step-up trigger event definition, £60,000,000;

18
(c) if an arrears or step-up trigger event has occurred under both items (i) and (ii) of the arrears or step-up trigger event definition, £60,000,000.
Interest only loans level tests
For the purposes of the definition of "interest only mortgage level test", C shall be 45% as at the date of these final terms which percentage may change from time to time.

19
Use of proceeds
The gross proceeds from the issue of the Series 2010-1 Notes will equal approximately £1,640,621,882 (after exchanging, where applicable, the proceeds of the notes for sterling, calculated by reference to the applicable specified currency exchange rate) and will be used by the issuer to make available term advances to Funding 1 pursuant to and in accordance with the terms of the intercompany loan agreement. Funding 1 will use the gross proceeds of each term advance to make a further contribution to the mortgages trustee on the closing date.

20
Maturity and prepayment considerations
The average lives of each class of the Series 2010-1 Notes cannot be stated, as the actual rate of repayment of the loans and redemption of the mortgages and a number of other relevant factors are unknown. However, calculations of the possible average lives of each class of the Series 2010-1 Notes can be made based on certain assumptions. For example, based on the assumptions that:
1. neither the issuer security nor the Funding 1 security has been enforced;
2. each Series and class (or sub-class) of Series 2010-1 Notes is repaid in full by its final maturity date;
3. the seller is not in breach of the terms of the mortgage sale agreement;
4. the seller does not sell any loans to the mortgages trustee after the closing date (except to the extent set out in assumption (5) below) and the loans are assumed to amortise in accordance with the assumed constant repayment rate indicated in the table below;
5. the seller sells to the mortgages trustee sufficient loans and their related security or such higher amount as may be required to be maintained as a result of the issuer advancing further term advances to Funding 1 which Funding 1 uses as consideration for an increase in its share of the trust property or to ensure that the seller's share remains at least at 5.3% of the trust property;
6. neither an asset trigger event nor a non-asset trigger event occurs;
7. no event occurs that would cause payments on scheduled amortisation term advances or pass-through term advances to be deferred (unless such advances are deferred in accordance with Rule 1 (A) or (C)) and/or no event occurs that would cause payments on the Series 2010-1 notes to be deferred;
8. the annualised CPR as at the closing date is assumed to be the same as the various assumed rates in the table below;
9. there is no balance in the Funding 1 cash accumulation ledger at the closing date;
10. the closing date is 28 October 2010;
11. the issuer exercises its option to redeem the Series 2010-1 Class A Notes on the step up date for the Series 2010-1 Class A Notes;
12. the loans in the portfolio are not subject to any defaults or losses and no loans in the portfolio have fallen into arrears;
13. no interest or fees are paid from principal receipts; and
14. the long-term, unsecured, unsubordinated and unguaranteed debt obligations of the seller are rated at least "A3" by Moody's,
the approximate average life in years of each class of the Series 2010-1 Notes, at various assumed rates of repayment of the loans, would be as follows:

21
Possible average lives of each class of Series 2010-1 Class A Notes (in years)
Constant prepayment rate (% per annum)
Series 2010-1 Class A1 Notes
Series 2010-1 Class A2 Notes
Series 2010-1 Class A3 Notes
5 2.98 4.98 4.98
10 2.98 4.98 4.98
15 2.98 4.98 4.98
20 2.98 4.98 4.98
25 2.98 4.98 4.98
30 2.98 4.98 4.98
35 2.98 4.98 4.98
Assumptions (1), (2), (3), (4), (5), (6), (7), (8), (12), (13) and (14) relate to circumstances which are not predictable.
The average lives of the notes are subject to factors largely outside the control of the issuer and consequently no assurance can be given that these assumptions and estimates will prove in any way to be realistic and they must therefore be viewed with considerable caution. For more information in relation to the risks involved in the use of these estimated average lives, see "Risk factors – The yield to maturity of the notes may be adversely affected by prepayments or redemptions on the loans" in the base prospectus.

22
Subscription and Sale
The issuer has agreed to sell, and Banc of America Securities LLC, Merrill Lynch International, Deutsche Bank Securities Inc., Deutsche Bank AG, London Branch and UBS Limited (the Dealers) have agreed to purchase, the principal amount of the Series 2010-1 Class A Notes listed in the table below. The terms of these purchases are governed by a subscription agreement among, inter alia, the Dealers and any other dealers named therein (the subscription agreement). Any Dealers that are not U.S. registered broker-dealers will agree that they will offer any Series 2010-1 Class A Notes within the United States only through U.S. registered broker-dealers.
Dealers
Principal amount of the Series 2010-1 Class A1 Notes
Principal amount of the Series 2010-1 Class A2 Notes
Principal amount of the Series 2010-1 Class A3 Notes
Banc of America Securities LLC and Merrill Lynch International
U.S.$183,333,333 €366,666,666 U.S.$100,000,000
Deutsche Bank Securities Inc. and Deutsche Bank AG, London Branch
U.S.$183,333,333 €366,666,667 U.S.$100,000,000
UBS Limited U.S.$183,333,334 €366,666,667 U.S.$100,000,000
Total: U.S.$550,000,000 €1,100,000,000 U.S.$300,000,000
The price to prospective purchasers as a percentage of the principal balance of each of the Series 2010-1 Class A1 Notes, the Series 2010-1 Class A2 Notes and the Series 2010-1 Class A3 Notes will be 100%.
The issuer has agreed to pay to the dealers in respect of each class of Series 2010-1 Class A Notes a management fee (in each case based on the aggregate principal amount of each class of Series 2010-1 Class A Notes) as set forth in the table below:
Management Fee
Series 2010-1 Class A1 Notes 0.25%
Series 2010-1 Class A2 Notes 0.25%
Series 2010-1 Class A3 Notes 0.25%
Total: 0.25%
Additional out-of-pocket expenses (other than the commissions and fees stated above) solely in relation to the Series 2010-1 Class A Notes are estimated to be approximately £1,300,000.

23
Statistical information on the expected portfolio
The statistical and other information contained in this final terms has been compiled by reference to the loans in the expected portfolio securing the notes as at 31 August 2010 (the cut-off date). Columns stating percentage amounts may not add up to 100% due to rounding. A loan will be removed from the expected portfolio if, in the period up to (and including) the closing date, the loan is repaid in full or if the loan did not comply with the terms of the mortgage sale agreement on or about the applicable sale date. Except as otherwise indicated, these tables have been prepared using the relevant true balance of the loans in the expected portfolio as at the cut-off date.
The expected portfolio as at the cut-off date consisted of 454,644 loans originated by Nationwide and secured over properties located in England, Wales, Northern Ireland and Scotland, and having an aggregate true balance of £31,740,477,312.19 as at that date. The loans in the expected portfolio at the cut-off date were originated by the seller between 3 January 1995 and 31 August 2010.
A small proportion of the mortgages in the expected portfolio as at the cut-off date were extended to the relevant borrowers in connection with the purchase by those borrowers of properties from local authorities or certain other landlords under the right-to-buy schemes governed by the Housing Act 1985 (as amended by the Housing Act 2004) or (as applicable) the Housing (Scotland) Act 1987 (as amended by the Housing (Scotland) Act 2001) or (as applicable) the Housing (NI) Order 1983 (as amended).

24
Outstanding balances as at the cut-off date
The following table shows the range of true balances as at the cut-off date.
Range of true balances as at cut-off date
Aggregate true balance as at the cut-
off date % of total
Number of mortgage accounts % of total
£0 - £24,999.99 £465,852,026.96 1.5% 31,632 9.5%
£25,000 - £49,999.99 £2,080,980,636.52 6.6% 54,977 16.5%
£50,000 - £74,999.99 £3,706,328,680.43 11.7% 59,236 17.8%
£75,000 - £99,999.99 £4,886,873,795.78 15.4% 56,057 16.8%
£100,000 - £124,999.99 £5,144,890,032.60 16.2% 45,981 13.8%
£125,000 - £149,999.99 £4,410,075,062.63 13.9% 32,256 9.7%
£150,000 - £174,999.99 £3,274,227,854.94 10.3% 20,280 6.1%
£175,000 - £199,999.99 £2,317,107,880.74 7.3% 12,423 3.7%
£200,000 - £224,999.99 £1,619,900,056.05 5.1% 7,670 2.3%
£225,000 - £249,999.99 £1,074,496,066.32 3.4% 4,545 1.4%
£250,000 - £299,999.99 £1,244,338,661.31 3.9% 4,589 1.4%
£300,000 - £349,999.99 £632,613,089.57 2.0% 1,966 0.6%
£350,000 - £399,999.99 £378,415,971.60 1.2% 1,020 0.3%
£400,000 - £449,999.99 £221,158,462.32 0.7% 523 0.2%
£450,000 - £499,999.99 £132,295,290.81 0.4% 279 0.1%
£500,000 - £549,999.99 £76,744,648.98 0.2% 148 0.0%
£550,000 - £599,999.99 £36,167,208.80 0.1% 63 0.0%
£600,000 - £649,999.99 £20,019,634.02 0.1% 32 0.0%
£650,000 - £699,999.99 £10,786,792.73 0.0% 16 0.0%
£700,000 - £749,999.99 £7,205,459.08 0.0% 10 0.0%
Totals £31,740,477,312.19 100.0% 333,703 100.0%
The maximum, minimum and average outstanding principal balance of the loans as of the cut-off date were £747,724.87, £1.01 and £95,115.95, respectively.
25
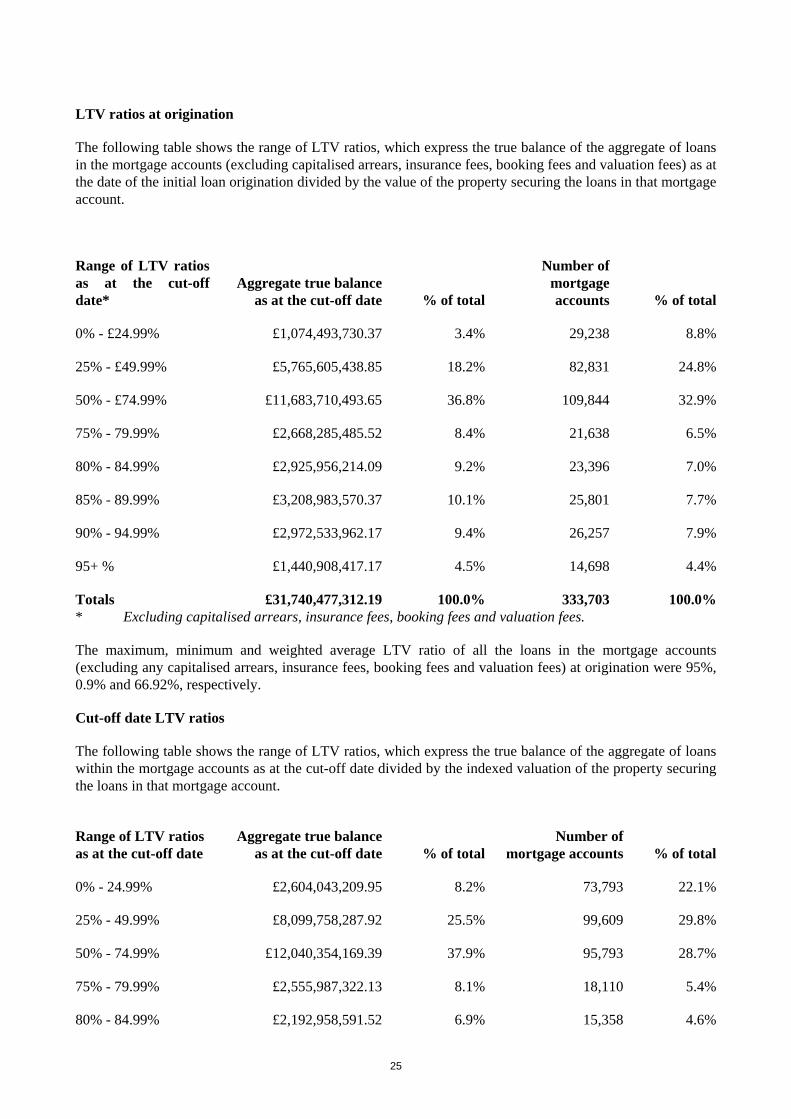
LTV ratios at origination
The following table shows the range of LTV ratios, which express the true balance of the aggregate of loans in the mortgage accounts (excluding capitalised arrears, insurance fees, booking fees and valuation fees) as at the date of the initial loan origination divided by the value of the property securing the loans in that mortgage account.
Range of LTV ratios as at the cut-off date*
Aggregate true balance as at the cut-off date % of total
Number of mortgage accounts % of total
0% - £24.99% £1,074,493,730.37 3.4% 29,238 8.8%
25% - £49.99% £5,765,605,438.85 18.2% 82,831 24.8%
50% - £74.99% £11,683,710,493.65 36.8% 109,844 32.9%
75% - 79.99% £2,668,285,485.52 8.4% 21,638 6.5%
80% - 84.99% £2,925,956,214.09 9.2% 23,396 7.0%
85% - 89.99% £3,208,983,570.37 10.1% 25,801 7.7%
90% - 94.99% £2,972,533,962.17 9.4% 26,257 7.9%
95+ % £1,440,908,417.17 4.5% 14,698 4.4%
Totals £31,740,477,312.19 100.0% 333,703 100.0% * Excluding capitalised arrears, insurance fees, booking fees and valuation fees.
The maximum, minimum and weighted average LTV ratio of all the loans in the mortgage accounts (excluding any capitalised arrears, insurance fees, booking fees and valuation fees) at origination were 95%, 0.9% and 66.92%, respectively.
Cut-off date LTV ratios
The following table shows the range of LTV ratios, which express the true balance of the aggregate of loans within the mortgage accounts as at the cut-off date divided by the indexed valuation of the property securing the loans in that mortgage account.
Range of LTV ratios as at the cut-off date
Aggregate true balance as at the cut-off date % of total
Number of mortgage accounts % of total
0% - 24.99% £2,604,043,209.95 8.2% 73,793 22.1%
25% - 49.99% £8,099,758,287.92 25.5% 99,609 29.8%
50% - 74.99% £12,040,354,169.39 37.9% 95,793 28.7%
75% - 79.99% £2,555,987,322.13 8.1% 18,110 5.4%
80% - 84.99% £2,192,958,591.52 6.9% 15,358 4.6%

26
85% - 89.99% £1,895,591,137.80 6.0% 13,389 4.0%
90% - 94.99% £1,368,910,623.95 4.3% 10,095 3.0%
95% - 96.99% £391,461,631.93 1.2% 2,974 0.9%
97% - 100% £343,036,219.09 1.1% 2,673 0.8%
100+ % £248,376,118.51 0.8% 1,909 0.6%
Totals £31,740,477,312.19 100.0% 333,703 100.0%
The maximum, minimum and weighted average LTV ratio as at the cut-off date of all the loans within the mortgage accounts were 162%, 0% and 59.46%, respectively.

27
Geographical distribution
The following table shows the distribution of properties securing the loans throughout England, Wales, Northern Ireland and Scotland as at the cut-off date. No such properties are situated outside England, Wales, Northern Ireland or Scotland. The seller's lending criteria and current credit scoring tests do not take into account the geographical location of the property securing a loan.
Regions Aggregate true balance
as at the cut-off date % of total
Number of mortgage accounts % of total
East Anglia £1,317,753,090.78 4.2% 15,082 4.5%
East Midlands £2,399,810,903.35 7.6% 28,733 8.6%
London £3,993,186,065.47 12.6% 30,501 9.1%
North West £2,555,957,216.15 8.1% 30,139 9.0%
Northern £1,166,402,436.90 3.7% 14,668 4.4%
Northern Ireland £810,405,479.19 2.6% 10,735 3.2%
Outer Metropolitan £5,051,918,199.39 15.9% 42,445 12.7%
Outer South East £4,115,015,334.92 13.0% 40,179 12.0%
Scotland £2,515,291,812.84 7.9% 31,600 9.5%
South West £2,772,677,719.90 8.7% 29,547 8.9%
Unknown £1,567,438.33 0.0% 9 0.0%
Wales £981,352,509.47 3.1% 12,714 3.8%
West Midlands £2,292,988,603.50 7.2% 26,330 7.9%
Yorkshire & Humberside £1,766,150,502.00 5.6% 21,021 6.3%
Totals £31,740,477,312.19 100.0% 333,703 100.0%
For a discussion of geographic concentration risks, see "Risk factors – The timing and amount of payments on the loans could be affected by various factors which may adversely affect payments on the notes" in the base prospectus.
House prices and incomes vary throughout England, Wales, Northern Ireland and Scotland. The table below summarises the average house price and the average income for each region for the period ended 31 December 2009 in order to produce a house price to earnings ratio for each region.
The table below has been reproduced from information published by the Department for Communities and Local Government. The issuer confirms that the table below has been accurately reproduced and that, so far as it is aware and is able to ascertain from information published by Department for Communities and Local Government, no facts have been omitted which would render the reproduced information inaccurate or misleading.

28
Regions
Average earnings
(per annum) Average
House price Price/earnings
ratio
North East £28,132 £156,825 5.57
North West £30,680 £174,305 5.68
Yorkshire and Humberside £29,952 £176,040 5.88
East Midlands £31,824 £172,415 5.42
West Midlands £32,448 £184,900 5.70
East Anglia £37,180 £233,491 6.28
London £47,060 £338,120 7.18
South East £40,664 £273,968 6.74
South West £33,540 £220,404 6.57
Wales £29,640 £165,659 5.59
Scotland £31,980 £174,433 5.45
Northern Ireland £31,928 £184,867 5.79 Source: Department for Communities and Local Government
Seasoning of loans
The following table shows the number of months since the date of origination of the initial loan up to the cut-off date.
Age of loans in months as of cut-off date
Aggregate true balance as at the cut-off date % of total
Number of mortgage accounts % of total
3 to < 6 £- 0.0% - 0.0%
6 to < 12 £441,447,579.31 1.4% 3,693 1.1%
12 to < 18 £1,001,894,786.72 3.2% 8,601 2.6%
18 to < 24 £2,384,049,736.21 7.5% 20,181 6.0%
24 to < 30 £4,211,320,342.47 13.3% 39,589 11.9%
30 to < 36 £4,769,292,344.61 15.0% 41,851 12.5%

29
36 to < 42 £4,153,217,183.63 13.1% 36,428 10.9%
42 to < 48 £2,974,732,774.49 9.4% 27,033 8.1%
48 to < 54 £2,111,034,846.40 6.7% 20,685 6.2%
54 to < 60 £1,296,040,952.83 4.1% 14,722 4.4%
60 to < 66 £1,066,481,014.10 3.4% 11,554 3.5%
66 to < 72 £1,030,646,721.73 3.2% 11,458 3.4%
72+ £6,300,319,029.69 19.8% 97,908 29.3%
Totals £31,740,477,312.19 100.0% 333,703 100.0%
The forecasted maximum, minimum and weighted average seasoning of loans as at the cut-off date will be 187, 8 and 49.46 months, respectively.
Years to maturity of loans
The following table shows the number of remaining years of the term of the loans as at the cut-off date.
Years to maturity Aggregate true balance as at the cut-off date
% of total
Number of mortgage accounts % of total
<5 £769,080,668.17 2.4% 22,436 6.7%
5 to <10 £2,483,258,014.40 7.8% 44,276 13.3%
10 to <15 £4,977,611,169.12 15.7% 65,316 19.6%
15 to <20 £8,614,256,684.85 27.1% 84,506 25.3%
20 to <25 £9,858,142,241.19 31.1% 77,203 23.1%
25 to <30 £3,253,528,806.56 10.3% 25,544 7.7%
30 to <35 £1,356,055,943.63 4.3% 10,803 3.2%
35+ £428,543,784.27 1.4% 3,619 1.1%
Totals £31,740,477,312.19 100.0% 333,703 100.0%
The maximum, minimum and weighted average remaining term of the loans as at the cut-off date was 40, 0.08 and 18.92 years, respectively.
Purpose of loan
The following table shows whether the purpose of the initial loan on origination was to finance the purchase of a new property or to remortgage a property already owned by the borrower.

30
Use of Proceeds Aggregate true balance as
at the cut-off date % of total
Number of mortgage accounts % of total
Purchase £19,074,286,524.86 60.1% 187,612 56.2%
Remortgage £12,666,190,787.33 39.9% 146,091 43.8%
Totals £31,740,477,312.19 100.0% 333,703 100.0%
Repayment terms
The following table shows the repayment terms for each individual loan as at the cut-off date. Where a customer has more than one loan in a mortgage account this is shown in the relevant row of the following table.
Repayment terms Aggregate true balance as at
the cut-off date % of total Number of loans % of total
Interest Only £5,198,558,403.79 16.4% 57,974 12.8%
Part £3,055,208,489.86 9.6% 35,232 7.7%
Repayment £23,486,710,418.54 74.0% 361,438 79.5%
Totals £31,740,477,312.19 100.0% 454,644 100.0%
31
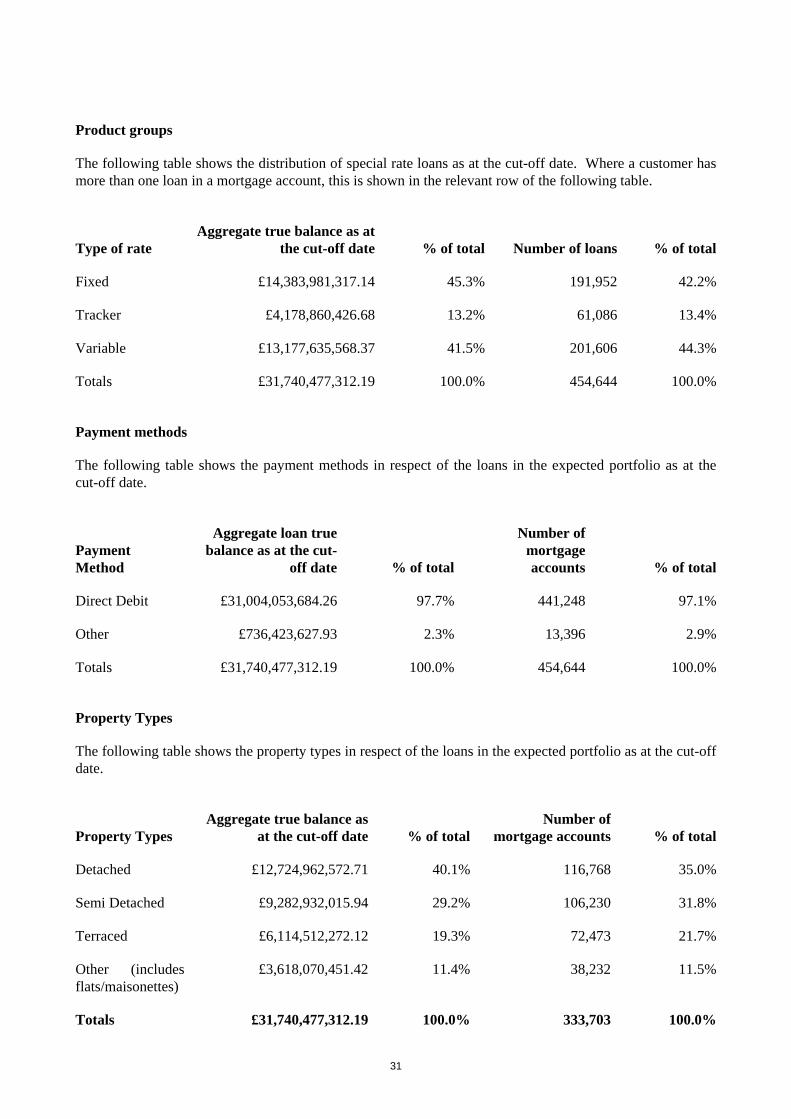
Product groups
The following table shows the distribution of special rate loans as at the cut-off date. Where a customer has more than one loan in a mortgage account, this is shown in the relevant row of the following table.
Type of rate Aggregate true balance as at
the cut-off date % of total Number of loans % of total
Fixed £14,383,981,317.14 45.3% 191,952 42.2%
Tracker £4,178,860,426.68 13.2% 61,086 13.4%
Variable £13,177,635,568.37 41.5% 201,606 44.3%
Totals £31,740,477,312.19 100.0% 454,644 100.0%
Payment methods
The following table shows the payment methods in respect of the loans in the expected portfolio as at the cut-off date.
Payment Method
Aggregate loan true balance as at the cut-
off date % of total
Number of mortgage accounts % of total
Direct Debit £31,004,053,684.26 97.7% 441,248 97.1%
Other £736,423,627.93 2.3% 13,396 2.9%
Totals £31,740,477,312.19 100.0% 454,644 100.0%
Property Types
The following table shows the property types in respect of the loans in the expected portfolio as at the cut-off date.
Property Types Aggregate true balance as
at the cut-off date % of total Number of
mortgage accounts % of total
Detached £12,724,962,572.71 40.1% 116,768 35.0%
Semi Detached £9,282,932,015.94 29.2% 106,230 31.8%
Terraced £6,114,512,272.12 19.3% 72,473 21.7%
Other (includes flats/maisonettes)
£3,618,070,451.42 11.4% 38,232 11.5%
Totals £31,740,477,312.19 100.0% 333,703 100.0%

32
Distribution of fixed rate loans
As at the cut-off date, approximately 45.3%% of the loans in the expected portfolio were fixed rate loans. The following tables shows the distribution of fixed rate loans by their fixed rate of interest as at such date, and the year in which the loans cease to bear a fixed rate of interest and instead bear a floating rate of interest.
Fixed rate loans remain at the relevant fixed rate for a period of time as specified in the offer conditions, after which they move to a variable base rate or some other rate as specified in the offer conditions. Where a customer has more than one loan in a mortgage account, this is shown in the relevant row of the following table.
Fixed rate% Aggregate true balance as at
the cut-off date % of total Number of loans
% of total fixed rate holdings
0 - 3.99 £262,377,836.52 0.8% 3,057 0.7%
4 - 4.99 £2,300,429,995.09 7.2% 32,935 7.2%
5 - 5.99 £9,239,388,476.58 29.1% 122,803 27.0%
6 - 6.99 £2,559,251,301.32 8.1% 32,456 7.1%
7 - 7.99 £22,533,707.63 0.1% 701 0.2%
8 - 8.99 £- 0.0% - 0.0%
Totals £14,383,981,317.14 45.3% 191,952 42.2%
Year in which current fixed rate period ends
Aggregate true balance as at the cut-off date % of total Number of loans
% of total loans
2010 £1,722,981,469.09 5.4% 22,041 4.8%
2011 £3,339,109,960.59 10.5% 46,455 10.2%
2012 £3,997,942,914.65 12.6% 50,581 11.1%
2013 £3,865,277,692.27 12.2% 49,404 10.9%
2014 £139,065,919.43 0.4% 2,326 0.5%
2015 £181,057,123.88 0.6% 3,502 0.8%
2016 £420,838,259.58 1.3% 6,838 1.5%
33
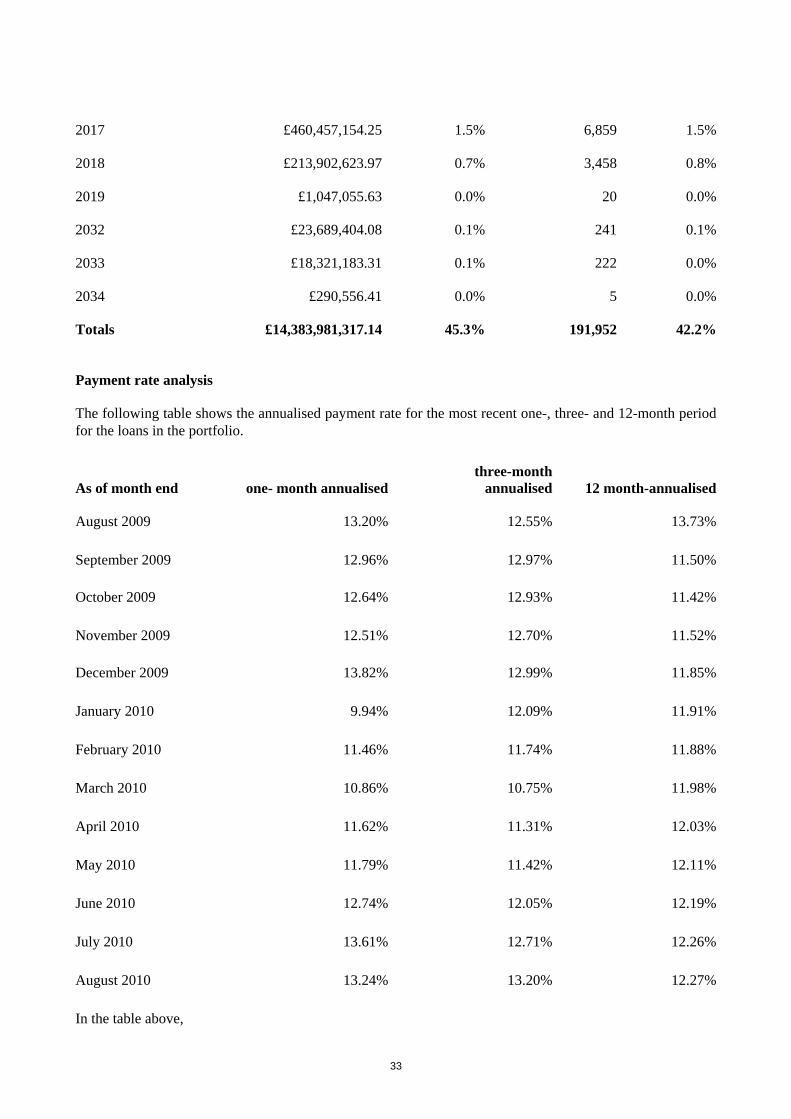
2017 £460,457,154.25 1.5% 6,859 1.5%
2018 £213,902,623.97 0.7% 3,458 0.8%
2019 £1,047,055.63 0.0% 20 0.0%
2032 £23,689,404.08 0.1% 241 0.1%
2033 £18,321,183.31 0.1% 222 0.0%
2034 £290,556.41 0.0% 5 0.0%
Totals £14,383,981,317.14 45.3% 191,952 42.2%
Payment rate analysis
The following table shows the annualised payment rate for the most recent one-, three- and 12-month period for the loans in the portfolio.
As of month end one- month annualised three-month
annualised 12 month-annualised
August 2009 13.20% 12.55% 13.73%
September 2009 12.96% 12.97% 11.50%
October 2009 12.64% 12.93% 11.42%
November 2009 12.51% 12.70% 11.52%
December 2009 13.82% 12.99% 11.85%
January 2010 9.94% 12.09% 11.91%
February 2010 11.46% 11.74% 11.88%
March 2010 10.86% 10.75% 11.98%
April 2010 11.62% 11.31% 12.03%
May 2010 11.79% 11.42% 12.11%
June 2010 12.74% 12.05% 12.19%
July 2010 13.61% 12.71% 12.26%
August 2010 13.24% 13.20% 12.27%
In the table above,

34
• one-month annualised CPR is calculated as 1 – ((1 – R) ^ 12),
• three-month annualised CPR is calculated as the average of the one-month annualised CPR for the most recent three months, and
• 12-month annualised CPR is calculated as the average of the one-month annualised CPR for the most recent 12 months,
where in each case R is (i) total principal receipts received plus the principal balance of loans repurchased by the seller (primarily due to further advances) during the relevant period, divided by (ii) the aggregate true balance of the loans in the portfolio as at the start of that period.
Write offs and recoveries of Nationwide
The following table shows write offs and recoveries of Nationwide across its mortgage book, excluding the results of its specialist lending loan books.
Year ended 4 April
Write offs £m
Recoveries £m
Net write offs £m
Mortgage balance £m
Write off balance %
Net write offs %
2006 0.9 0.8 0.1 78,300 0.0011 0.0001
2007 1.2 0.8 0.4 88,712 0.0014 0.0005
2008 * 0.4 - 0.4 105,538 0.0004 0.0004
2009 * 4.3 1.2 3.1 106,718 0.004 0.0029
2010 * 12.9 1.6 11.3 104,145 0.0124 0.0109
* Figures for 2008, 2009 and 2010 exclude loans originated by Cheshire Building Society, Derbyshire Building Society and Dunfermline Building Society
Delinquency and loss experience of the Nationwide mortgage portfolio
The following table summarises arrears experience for the loans contained in the Nationwide mortgage portfolio as at the dates specified in the table. The seller will represent and warrant on the each sale date that no loan to be transferred to the mortgages trust on such sale date will have experienced any arrears in the prior 12 months. Outstanding balances of loans in arrears and outstanding balances of arrears are reported on a net basis, excluding all loans in arrears which are performing loans. Numbers of loans in arrears are reported on a gross basis, including all loans in arrears which are performing loans. Performing loans are defined by Nationwide as loans where six months of payments have been received over the last six months.
Nationwide identifies a loan as being in arrears where an amount equal to or greater than a full month's contractual payment is past its due date.

35
Loans in the Nationwide mortgage portfolio
Financial Years Ending:
04/04/2006 04/04/2007 04/04/2008
* 04/04/2009
* 04/04/2010
*
Outstanding balance (£ millions)........................... 78,300 88,712 105,538 106,718 104,145 Number of loans outstanding ..................... 1,222,959 1,267,457 1,408,605 1,219,117 1,188,751
Outstanding balance of loans in arrears (£ millions)
Payments in arrears = 2 to <3................................. 103.5 104.0 190.1 121.2 191.4
Payments in arrears = 3 to <6................................. 30.5 25.2 41.4 193.0 271.3
Payments in arrears = 6 to <8................................. 11.3 8.8 17.9 63.5 83.8
Payments in arrears of 8 or over.............................. 10.5 8.5 14.4 72.5 181.8
Total true balance of loans in arrears 155.8 146.5 263.8 450.2 728.3
Total true balance of loans 6 months or more in arrears .......................... 21.8 17.3 32.3 136 265.6
Total true balance of loans 6 payments or more in arrears as % of the true balance ............... 0.0278% 0.0196% 0.0306% 0.1274% 0.2550%
Outstanding balance of arrears (£ millions)
Payments in arrears = 2 to <3................................. 3.1 3.2 4.3 1.9 2.7
Payments in arrears = 3 to <6................................. 1.6 1.3 2.2 5.4 6.8
Payments in arrears = 6 to <8................................. 0.8 0.7 1.3 3.1 3.3

36
Payments in arrears of 8 or over.............................. 1.5 1.4 2.0 7.5 12.9
Total balance of arrears ... 7.0 6.6 9.8 17.9 25.7
Total balance of arrears on loans 6 payments or more in arrears (£ millions)........................... 2.3 2.1 3.3 10.6 16.2
Total balance of arrears on loans 6 payments or more in arrears as % of the true balance ............... 0.0029% 0.0024% 0.0031% 0.0099% 0.0156%
Number of Loans:
Payments in arrears 3-6 months ............................. 2,061 1,858 2,801 3,436 3,358
Payments in arrears 6-9 months ............................. 565 448 811 1,081 1,383
Payments in arrears 9-12 months ........................ 209 165 355 396 707
Payments in arrears 12 + months .......................... 254 179 315 703 1,171
Total balance of arrears ... 3,089 2,650 4,282 5,616 6,619
Total number of loans with 6+ month arrears (£ millions) ...................... 1,028 792 1,481 2,180 3,261
Total number of loans with 6+ months arrears as a % of number of loans outstanding ............. 0.0841% 0.0625% 0.1051% 0.1788% 0.2743%
*Figures for 2008 and 2009 and 2010 exclude loans originated by Cheshire Building Society, Derbyshire Building Society and Dunfermline Building Society There can be no assurance that the future arrears experience with respect to the loans comprising the Nationwide mortgage portfolio will correspond to the historical experience of the loans as set forth in the foregoing table. If the property market experiences a further decline in property values so that the value of the properties in the Nationwide mortgage portfolio falls or (in the case of properties which are currently below the principal balances of the relevant loan) remains below the principal balances of the loans comprising the overall pool, the actual rates of arrears could be significantly higher than those previously experienced, as borrowers may no longer be able to refinance their loans or sell their properties and move to more affordable properties. In addition, other adverse economic conditions, whether or not they affect property values, may nonetheless affect the timely payment by borrowers of principal and interest and,

37

38
Annex A
Series issued by issuer and term advances advanced to Funding 1 in connection therewith
Issue of Series 2010-1 Notes
Term Advance Information Term Advance Interest rate Initial principal
amount Bullet redemption dates
Final Maturity date
Series 2010-1 Class A1 Term AAA Advance
Three-month Sterling LIBOR + 1.42 per cent. Floating rate
£349,872,773.54 21 October 2013
21 January 2055
Series 2010-1 Class A2 Term AAA Advance
Three-month Sterling LIBOR + 1.70 per cent. Floating rate
£976,909,413.85 21 October 2015
21 January 2055
Series 2010-1 Class A3 Term AAA Advance
Three-month Sterling LIBOR + 1.52 per cent. Floating rate
£190,839,694.66 21 October 2015
21 January 2055
Term NR Advance
Three-month Sterling LIBOR + 1.50 per cent. Floating rate
£123,000,000 Not Applicable 21 January 2055
39
Annex B
Static Pool Data
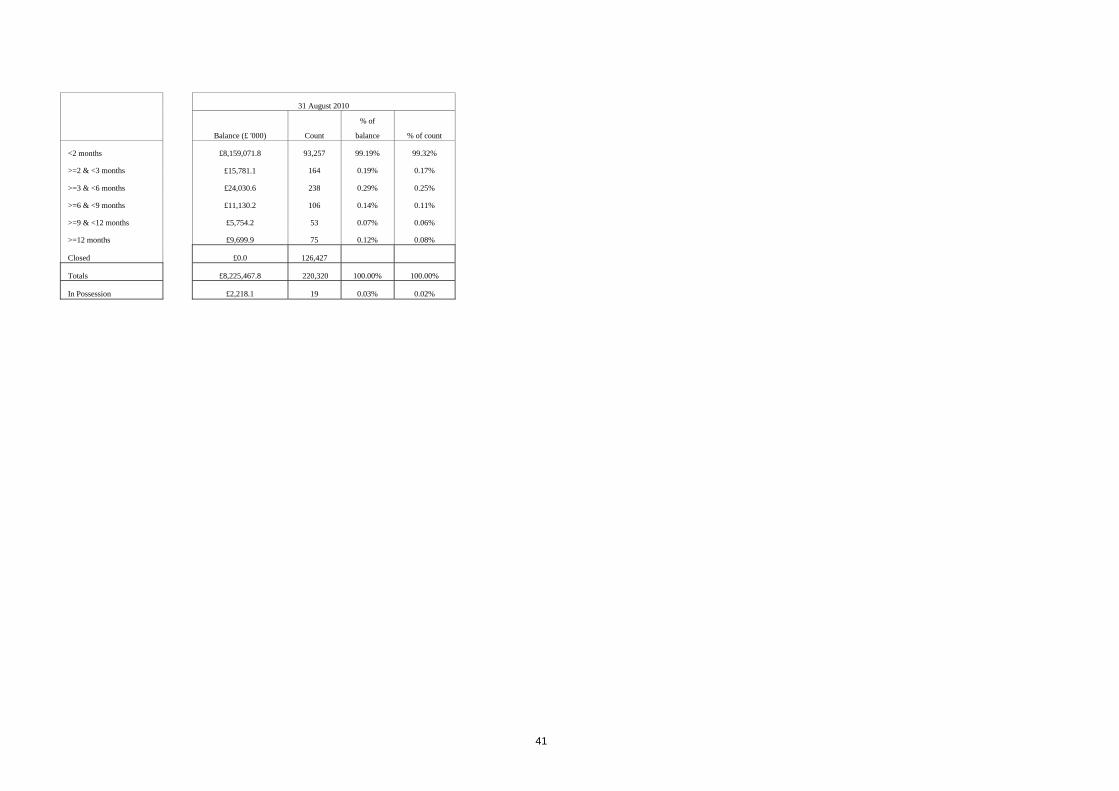
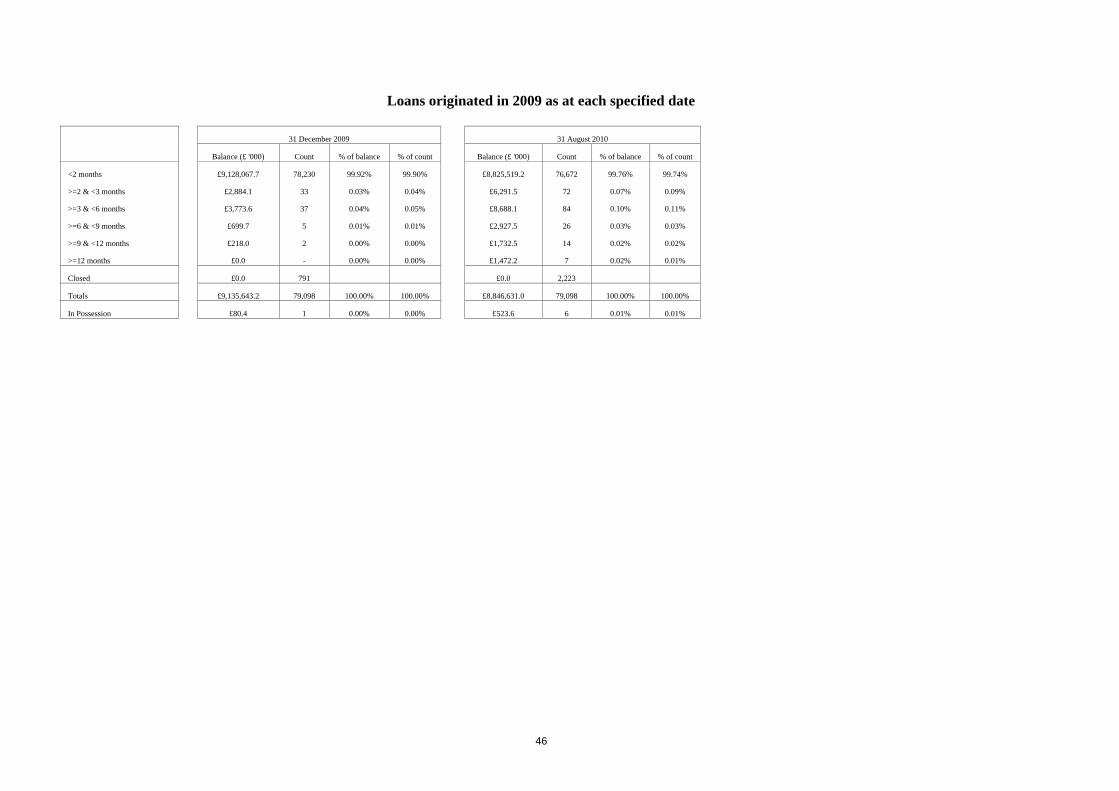
The tables in the following pages set out, to the extent material, static pool information with respect to all mortgage loans originated by Nationwide or other relevant members of the Nationwide group (other than Cheshire Building Society, Derbyshire Building Society and Dunfermline Building Society). The tables show, for originations in each year the distribution of such loans originated in that year by delinquency category as at each year end. In preparing the static pool information in the following pages, accounts entering possession have been reflected in the “In Possession” line of each table. As accounts entering possession will also be in arrears, the same accounts have been included in the figures provided for the relevant delinquency category. The issuer has not included static pool information on prepayments because changes in prepayment and payment rates are not anticipated to have a significant effect on future payments on the notes for a number of reasons: The mechanics of the mortgages trust require an extended cash accumulation period when prepayment rates fall below certain minima dictated by the rating agencies, serving to limit the extent to which slow prepayments would cause the average lives of the notes to extend. Conversely, rapid prepayments should not cause the average lives of the notes to shorten so long as the seller maintains the minimum required mortgages trust size. Furthermore, only a limited amount of note principal in relation to the mortgages trust size is actually due to be repaid on any particular interest payment date.
The sale of loans by the seller to the mortgages trustee is subject to conditions, including ones required by the rating agencies, designed to maintain certain credit-related and other characteristics of the mortgages trust. These include limits on loans in arrears in the mortgages trust at the time of sale, limits on the aggregate balance of loans sold, limits on changes in the weighted average foreclosure frequency (WAFF) and the weighted average loss severity (WALS), minimum yield for the loans in the mortgages trust after the sale and maximum LTV for the loans in the mortgages trust after the sale. See a description of these conditions in "Mortgage Sale Agreement — Conditions for sale of loans" in the base prospectus.
In the following tables, delinquency category corresponds to the number of monthly contractual repayment amounts in arrears. Delinquency rates represent the closing balances of loans in a particular category as a percentage of aggregate closing balances.

40
Arrears by Year of Origination – Nationwide Building Society
Loans originated in 2004 as at each specified date 31 December 2004 31 December 2005 31 December 2006
Balance (£ '000) Count
% of
balance % of count Balance (£ '000) Count
% of
balance % of count Balance (£ '000) Count % of balance % of count
<2 months £22,394,544.3 216,522 99.91% 99.92% £20,634,497.7 201,980 99.77% 99.78% £15,369,249.0 156,248 99.65% 99.67%
>=2 & <3 months £13,789.2 118 0.06% 0.05% £21,317.8 205 0.10% 0.10% £22,228.2 231 0.14% 0.15%
>=3 & <6 months £5,403.1 51 0.02% 0.02% £19,914.2 191 0.10% 0.09% £22,458.6 211 0.15% 0.13%
>=6 & <9 months £415.0 6 0.00% 0.00% £4,448.6 36 0.02% 0.02% £6,138.5 54 0.04% 0.03%
>=9 & <12 months £335.2 1 0.00% 0.00% £1,301.6 13 0.01% 0.01% £1,778.2 16 0.01% 0.01%
>=12 months £378.2 1 0.00% 0.00% £789.2 5 0.00% 0.00% £1,419.3 11 0.01% 0.01%
Closed £0.0 3,621 £0.0 17,890 £0.0 63,549
Totals £22,414,865.0 220,320 100.00% 100.00% £20,682,269.2 220,320 100.00% 100.00% £15,423,271.7 220,320
100.00% 100.00%
In Possession £0.0 - 0.00% 0.00% £810.8 7 0.00% 0.00% £1,134.8 9 0.01% 0.01%
31 December 2007 31 December 2008 31 December 2009
Balance (£ '000) Count
% of
balance % of count Balance (£ '000) Count
% of
balance % of count Balance (£ '000) Count % of balance % of count
<2 months £12,546,626.4 130,113 99.59% 99.63% £10,452,476.8 112,786 99.35% 99.45% £8,932,956.9 99,652 99.19% 99.33%
>=2 & <3 months £19,190.9 187 0.15% 0.14% £20,049.7 196 0.19% 0.17% £18,249.1 183 0.20% 0.18%
>=3 & <6 months £20,987.4 203 0.17% 0.16% £27,468.0 261 0.26% 0.23% £26,158.8 247 0.29% 0.25%
>=6 & <9 months £6,833.6 61 0.05% 0.05% £8,114.5 73 0.08% 0.06% £10,590.7 97 0.12% 0.10%
>=9 & <12 months £1,956.0 18 0.02% 0.01% £4,210.3 33 0.04% 0.03% £7,383.3 60 0.08% 0.06%
>=12 months £2,145.6 20 0.02% 0.02% £8,467.7 63 0.08% 0.06% £10,700.7 83 0.12% 0.08%
Closed £0.00 89,718 £0.0 106,908 £0.0 119,998
Totals £12,597,739.8 220,320 100.00% 100.00% £10,520,787.1 220,320 100.00% 100.00% £9,006,039.5 220,320 100.00% 100.00%
In Possession £2,170.5 15 0.02% 0.01% £5,009.0 36 0.05% 0.03% £2,499.3 19 0.03% 0.02%
41
31 August 2010
Balance (£ '000) Count
% of
balance % of count
<2 months £8,159,071.8 93,257 99.19% 99.32%
>=2 & <3 months £15,781.1 164 0.19% 0.17%
>=3 & <6 months £24,030.6 238 0.29% 0.25%
>=6 & <9 months £11,130.2 106 0.14% 0.11%
>=9 & <12 months £5,754.2 53 0.07% 0.06%
>=12 months £9,699.9 75 0.12% 0.08%
Closed £0.0 126,427
Totals £8,225,467.8 220,320 100.00% 100.00%
In Possession £2,218.1 19 0.03% 0.02%

42
Loans originated in 2005 as at each specified date 31 December 2005 31 December 2006 31 December 2007
Balance (£ '000) Count % of
balance
% of count
Balance (£ '000) Count % of balance % of count
Balance (£ '000) Count % of
balance
% of count
<2 months £19,338,042.8 177,914 99.93% 99.94% £17,737,675.9 165,283 99.85% 99.85% £12,638,664.6 124,251 99.76% 99.76%
>=2 & <3 months £9,394.0 74 0.05% 0.04% £12,692.2 131 0.07% 0.08% £11,824.2 124 0.09% 0.10%
>=3 & <6 months £2,857.4 24 0.01% 0.01% £10,777.4 99 0.06% 0.06% £13,515.4 128 0.11% 0.10%
>=6 & <9 months £323.0 3 0.00% 0.00% £1,889.9 18 0.01% 0.01% £2,606.4 28 0.02% 0.02%
>=9 & <12 months £156.6 2 0.00% 0.00% £343.6 4 0.00% 0.00% £1,227.7 14 0.01% 0.01%
>=12 months £109.8 1 0.00% 0.00% £1,040.7 4 0.01% 0.00% £747.8 8 0.01% 0.01%
Closed £0.0 2,121 £0.0 14,600 £0.0 55,586
Totals £19,350,883.6 180,139 100.00% 100.00% £17,764,419.6 180,139 100.00% 100.00% £12,668,586.1 180,139 100.00% 100.00%
In Possession £0.0 - 0.00% 0.00% £99.0 1 0.00% 0.00% £532.4 5 0.00% 0.00%
31 December 2008 31 December 2009 31 August 2010
Balance (£ '000) Count % of
balance
% of count
Balance (£ '000) Count % of balance % of count
Balance (£ '000) Count % of
balance
% of count
<2 months £10,734,042.8 108,776 99.57% 99.61% £9,315,325.0 97,637 99.40% 99.44% £8,437,729.0 90,657 99.36% 99.43%
>=2 & <3 months £16,805.5 156 0.16% 0.14% £15,532.1 152 0.17% 0.15% £15,379.3 143 0.18% 0.16%
>=3 & <6 months £16,869.2 160 0.16% 0.15% £22,439.4 213 0.24% 0.22% £18,564.3 180 0.22% 0.20%
>=6 & <9 months £6,071.3 58 0.06% 0.05% £8,643.5 88 0.09% 0.09% £9,685.8 95 0.11% 0.10%
>=9 & <12 months £2,812.0 29 0.03% 0.03% £2,988.8 38 0.03% 0.04% £3,424.8 36 0.04% 0.04%
>=12 months £3,383.9 27 0.03% 0.02% £6,960.9 62 0.07% 0.06% £6,904.8 64 0.08% 0.07%
Closed £0.0 70,933 £0.0 81,949 £0.0 88,964
Totals £10,779,984.8 180,139 100.00% 100.00% £9,371,889.6 180,139 100.00% 100.00% £8,491,688.0 180,139 100.00% 100.00%
In Possession £1,907.0 15 0.02% 0.01% £1,833.4 17 0.02% 0.02% £1,722.9 18 0.02% 0.02%

43
Loans originated in 2006 as at each specified date 31 December 2006 31 December 2007 31 December 2008
Balance (£ '000) Count % of balance % of count Balance (£ '000) Count % of balance % of count Balance (£ '000) Count % of balance % of count
<2 months £24,734,463.7 209,513 99.90% 99.91% £23,017,168.1 197,688 99.84% 99.83% £18,072,766.8 163,597 99.58% 99.59%
>=2 & <3 months £12,777.9 97 0.05% 0.05% £19,005.7 160 0.08% 0.08% £29,041.0 253 0.16% 0.15%
>=3 & <6 months £10,828.8 83 0.04% 0.04% £11,503.1 114 0.05% 0.06% £28,218.1 265 0.16% 0.16%
>=6 & <9 months £1,386.9 11 0.01% 0.01% £4,639.5 37 0.02% 0.02% £9,103.5 81 0.05% 0.05%
>=9 & <12 months £126.3 2 0.00% 0.00% £1,211.9 12 0.01% 0.01% £4,003.5 36 0.02% 0.02%
>=12 months £248.7 1 0.00% 0.00% £1,435.5 12 0.01% 0.01% £5,252.9 41 0.03% 0.02%
Closed £0.0 2,288 £0.0 13,972 £0.0 47,722
Totals £24,759,832.3 211,995 100.00% 100.00% £23,054,963.9 211,995 100.00% 100.00% £18,148,385.9 211,995 100.00% 100.00%
In Possession £0.0 0.00% 0.00% £574.7 6 0.00% 0.00% £3,836.5 28 0.02% 0.02%
31 December 2009 31 August 2010
Balance (£ '000) Count % of balance % of count Balance (£ '000) Count % of balance % of count
<2 months £16,000,591.5 149,123 99.37% 99.39% £14,789,272.9 140,895 99.29% 99.33%
>=2 & <3 months £27,653.7 260 0.17% 0.17% £28,440.3 252 0.19% 0.18%
>=3 & <6 months £37,403.0 337 0.23% 0.22% £39,059.0 362 0.26% 0.26%
>=6 & <9 months £12,972.2 128 0.08% 0.09% £16,255.5 150 0.11% 0.11%
>=9 & <12 months £9,394.6 83 0.06% 0.06% £7,129.1 63 0.05% 0.04%
>=12 months £13,608.9 105 0.08% 0.07% £14,729.9 130 0.10% 0.09%
Closed £0.0 61,959 £0.0 70,143
Totals £16,101,623.8 211,995 100.00% 100.00% £14,894,886.6 211,995 100.00% 100.00%
In Possession £5,022.1 41 0.03% 0.03% £4,779.2 46 0.03% 0.03%

44
Loans originated in 2007 as at each specified date 31 December 2007 31 December 2008 31 December 2009
Balance (£ '000) Count % of balance % of count Balance (£ '000) Count % of balance % of count Balance (£ '000) Count % of balance % of count
<2 months £22,845,633.5 187,208 99.94% 99.94% £21,742,014.0 181,129 99.70% 99.69% £19,305,330.4 164,968 99.37% 99.35%
>=2 & <3 months £7,562.4 68 0.03% 0.04% £21,900.4 211 0.10% 0.12% £34,451.5 304 0.18% 0.18%
>=3 & <6 months £5,278.4 44 0.02% 0.02% £26,316.5 226 0.12% 0.12% £45,127.9 395 0.23% 0.24%
>=6 & <9 months £1,280.0 6 0.01% 0.00% £8,327.7 71 0.04% 0.04% £20,004.7 177 0.10% 0.11%
>=9 & <12 months £223.7 1 0.00% 0.00% £3,243.6 24 0.01% 0.01% £8,325.8 81 0.04% 0.05%
>=12 months £24.8 1 0.00% 0.00% £4,954.4 28 0.02% 0.02% £15,062.1 114 0.08% 0.07%
Closed £0.0 2,647 £0.0 8,286 £0.0 23,936
Totals £22,860,002.9 189,975 100.00% 100.00% £21,806,756.6 189,975 100.00% 100.00% £19,428,302.3 189,975 100.00% 100.00%
In Possession £0.0 0.00% 0.00% £4,028.0 27 0.02% 0.01% £5,946.0 50 0.03% 0.03%
31 August 2010
Balance (£ '000) Count % of balance % of count
<2 months £17,978,627.5 156,778 99.30% 99.28%
>=2 & <3 months £32,809.9 300 0.18% 0.19%
>=3 & <6 months £43,890.0 414 0.24% 0.26%
>=6 & <9 months £20,345.5 178 0.11% 0.11%
>=9 & <12 months £11,561.1 91 0.06% 0.06%
>=12 months £17,964.5 152 0.10% 0.10%
Closed £0.0 32,062
Totals £18,105,198.4 189,975 100.00% 100.00%
In Possession £7,258.9 63 0.04% 0.04%

45
Loans originated in 2008 as at each specified date 31 December 2008 31 December 2009 31 August 2010
Balance (£ '000) Count % of balance % of count Balance (£ '000) Count % of balance % of count Balance (£ '000) Count % of balance % of count
<2 months £18,602,918.4 164,452 99.87% 99.88% £17,275,985.0 155,968 99.47% 99.49% £16,040,411.4 147,096 99.26% 99.28%
>=2 & <3 months £11,993.4 103 0.06% 0.06% £28,182.7 266 0.16% 0.17% £33,759.7 303 0.21% 0.20%
>=3 & <6 months £8,066.6 68 0.04% 0.04% £39,112.6 335 0.23% 0.21% £44,662.3 410 0.28% 0.28%
>=6 & <9 months £1,830.0 14 0.01% 0.01% £12,295.3 111 0.07% 0.07% £16,749.9 155 0.10% 0.10%
>=9 & <12 months £1,321.9 5 0.01% 0.00% £4,979.9 48 0.03% 0.03% £11,532.4 93 0.07% 0.06%
>=12 months £861.3 4 0.00% 0.00% £6,814.5 45 0.04% 0.03% £12,810.4 103 0.08% 0.07%
Closed £0.0 1,627 £0.0 9,500 £0.0 18,113
Totals £18,626,991.5 166,273 100.00% 100.00% £17,367,370.1 166,273 100.00% 100.00% £16,159,926.1 166,273 100.00% 100.00%
In Possession £470.4 3 0.00% 0.00% £5,102.7 35 0.03% 0.02% £6,019.9 52 0.04% 0.04%
46
Loans originated in 2009 as at each specified date 31 December 2009 31 August 2010
Balance (£ '000) Count % of balance % of count Balance (£ '000) Count % of balance % of count
<2 months £9,128,067.7 78,230 99.92% 99.90% £8,825,519.2 76,672 99.76% 99.74%
>=2 & <3 months £2,884.1 33 0.03% 0.04% £6,291.5 72 0.07% 0.09%
>=3 & <6 months £3,773.6 37 0.04% 0.05% £8,688.1 84 0.10% 0.11%
>=6 & <9 months £699.7 5 0.01% 0.01% £2,927.5 26 0.03% 0.03%
>=9 & <12 months £218.0 2 0.00% 0.00% £1,732.5 14 0.02% 0.02%
>=12 months £0.0 - 0.00% 0.00% £1,472.2 7 0.02% 0.01%
Closed £0.0 791 £0.0 2,223
Totals £9,135,643.2 79,098 100.00% 100.00% £8,846,631.0 79,098 100.00% 100.00%
In Possession £80.4 1 0.00% 0.00% £523.6 6 0.01% 0.01%

47
ISSUER
Silverstone Master Issuer PLC c/o Wilmington Trust SP Services (London) Limited
Fifth Floor 6 Broad Street Place London, EC2M 7JH
SELLER, SERVICER, CASH MANAGER, ISSUER CASH MANAGER, START-UP LOAN PROVIDER AND ISSUER SWAP PROVIDER
Nationwide Building Society Nationwide House
Pipers Way Swindon SN38 1NW
AGENT BANK, PRINCIPAL PAYING AGENT, REGISTRAR, TRANSFER AGENT AND
EXCHANGE RATE AGENT U.S. PAYING AGENT Citibank, N.A., London Branch Citibank, N.A.
Citigroup Centre Canada Square Canary Wharf
London E14 5LB
388 Greenwich Street New York NY 10013
NOTE TRUSTEE, ISSUER SECURITY TRUSTEE AND FUNDING 1 SECURITY TRUSTEE Citicorp Trustee Company Limited
Citigroup Centre Canada Square Canary Wharf
London E14 5LB
LEGAL ADVISERS TO THE LEAD MANAGERS
LEGAL ADVISERS TO THE ISSUER AND NATIONWIDE BUILDING SOCIETY
as to English and US law as to English and US law Sidley Austin LLP Allen & Overy LLP Woolgate Exchange One Bishops Square 25 Basinghall Street London E1 6AD London EC2V 5HA
as to Scots law Dundas & Wilson Saltire Court
20 Castle Terrace Edinburgh EH1 2EN
as to Northern Irish law Cleaver Fulton Rankin 50 Bedford Street
Belfast BT2 7FW

48
LEGAL ADVISERS TO THE MORTGAGES TRUSTEE
LEGAL ADVISERS TO THE NOTE TRUSTEE, ISSUER SECURITY TRUSTEE AND THE
FUNDING 1 SECURITY TRUSTEE as to Jersey law as to English law
Mourant Ozannes Clifford Chance LLP 22 Grenville Street
St Helier, Jersey JE4 8PX
10 Upper Bank Street London E14 5JJ
AUDITOR OF THE ISSUER PricewaterhouseCoopers LLP
Hay's Galleria 1 Hay's Lane
London SE1 2RD