simexmin - adimb paul heithersay.pdf · iron ore thermal coal coking coalpotash tantalum gallium...
TRANSCRIPT

Department for Manufacturing,
Innovation, Trade, Resources and Energy
Mineral Resources for Future
Generations
www.dmitre.sa.gov.au
Simexmin Ouro Preto
2014

Metal demand continues to grow rapidly
This puts severe pressure on industry to find and develop new mines
2
0
10
20
30
40
1900 1920 1940 1960 1980 2000 2020 2040
Forecast Demand Based on 3% pa growth
Historic Demand Average growth rate of
2.8% pa over last 24 years
Copper Mine Production (Mt pa Cu)
Cumulative copper
production for all history
(1000 BC to 2013 AD)
= 629 Mt Cu
In the next 24 years 635 Mt of
copper will need to be mined
… that’s equal to the total
amount produced in all
history to-date !
… and half of this was mined in the
last 24 years
Source: MinEx Consulting © May 2014 , based on historic data from USGS

Strong demand for some of the high tech metals
– but their overall market is still quite modest
3
Growth rates for minerals and metals: 2003-2013
-10%
0%
10%
20%
0,01 0,1 1 10 100 1000
Compound Annual Growth rate (tonnes basis) Bulk Minerals
Industrial Minerals
Base Metals
Light Metals
Precious Metals
High Tech
Other
Total Sales Revenue in 2013
(US$ Billion)
Cement
Iron Ore
Thermal Coal Coking Coal
Tantalum
Gallium
Germanium
Lithium
REE Copper
Aluminium
Gold
Nickel
Cobalt
Source: USGS Mineral Commodity Summaries
Uranium
PGM
Silver
Silicon
Lime
Zinc
Note: Compound Annual Growth Rate was calculated by comparing World mine production for a given commodity in 2013 against 2003.
Phosphate
Potash

Exploration is becoming more difficult & expensive
Exploration expenditures and discoveries in the Western World
4 Source: MinEx Consulting © February 2014
Note: Discoveries are Based on deposits > 100koz Au, >100 kt Cu, > 250kt Zn+Pb, >10kt Ni, >5 kt U3O8 or equivalent size Excludes Bulk Mineral discoveries and satellite deposits found within existing camps
Number of Discoveries 2013 US$ Billion
$2.4b
$18.8b
$12.3b
Even after adjusting for
unreported discoveries, in
the last 5 years a large gap
has opened up between
expenditures and the
number of deposits found

… and we having to explore under deeper cover
Depth of cover for Base Metal discoveries in the World: 1900-2013
5
Note: Based on an analysis of 818 Primary Cu, Zn, Pb and Ni deposits > 0.1 Mt Cu-equivalent
Bubble size refers to Mt Cu-eq of pre-mined Resource, as calculated using the average metal price for 2011-2013
Excludes satellite deposits within existing Camps. Excludes nickel laterite deposits
Source: MinEx Consulting © March 2014
The step increase in the
depth of cover (post 1945)
was due to innovations
in geophysics
Olympic Dam
Depth of Cover (Metres)
Talnakh Lubin
Pampa Escondida
Escondida

Innovations in GPx will play a key role in the future
Primary search method used at the prospect-scale for Base Metal discoveries (>0.1 Mt Cu-eq) in the World: 1900-2012
6 Source: MinEx Consulting © July 2013
0%
20%
40%
60%
80%
100% Serendipity
Prospector
Other
Drilling (Sole Method)
Visual
Conceptual/Geological
Geological Mapping
Extrapolated from KnownMineralisationGeochem
Geophysics + Geochem
Geophysics

Country & Social Risks are impacting on projects
It is taking longer to get a discovery into production, especially in
emerging countries
7
7.1 Years
18.1 Years
9.8 Years
Years Delay
Discovery Year
Gold
Note: Bubble size refers to the pre-mined Resource Analysis based on 686 primary gold deposits >0.1 Moz found in the World
Source: MinEx Consulting © March 2014

•We need new tools to explore undercover 100m to
1000m
•We need innovative approaches between exploration ,
mining and land owners and other stakeholders
•We need supportive governments to provide certainty
for long term decisions
•Sustained commitment to partner with industry in
recording , preserving and presenting precompetitive
data
8
As professionals in the industry we have a grand
challenge

Mines Of South Australia
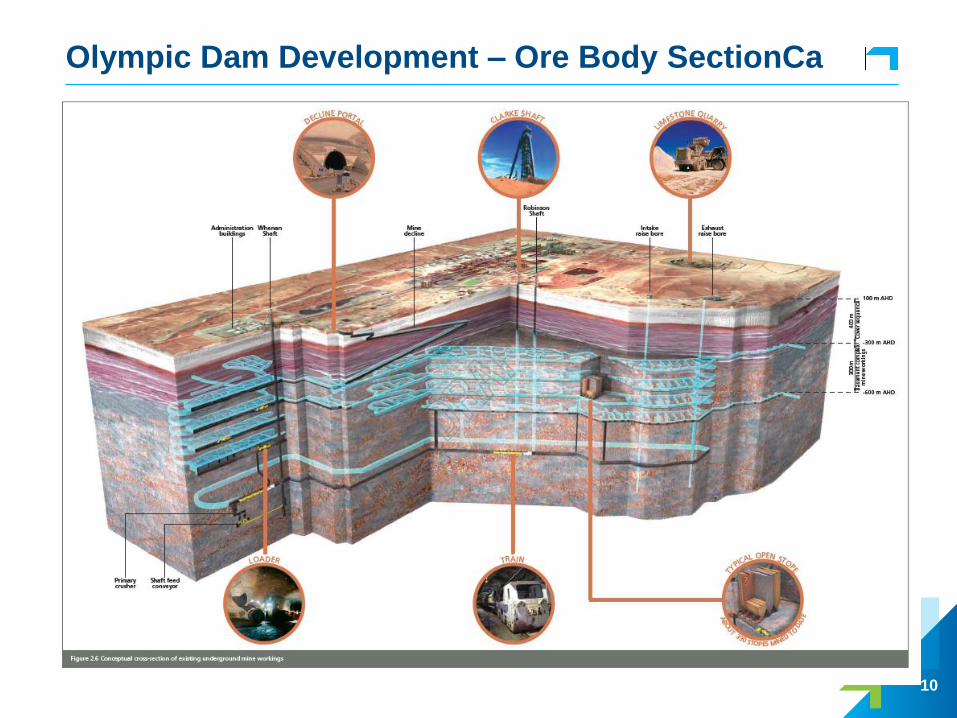
Olympic Dam Development – Ore Body SectionCa
10

Olympic Dam: a world class deposit
Slide 11
0
20
40
60
80
100
120
140
Esco
nd
ida
An
din
a
Ch
uq
uic
am
ata
El T
en
ien
te
OL
YM
PIC
DA
M
Co
lla
hu
asi
Gra
sb
erg
Oyu
To
lgo
i
Ca
na
ne
a
Pe
bb
le
0
500
1,000
1,500
2,000
2,500
OL
YM
PIC
DA
M
Alu
m S
ha
le (
Sw
ed
en
)
Elk
on
Imo
ura
ren
Kva
ne
fje
ld (
RE
E)
Hu
sa
b
McA
rth
ur
Riv
er
Inka
i
Le
tlh
aka
ne
Cig
ar
La
ke
0
50
100
150
200
250
300
Witw
ate
rsra
nd
Ca
mp
Gra
sbe
rg (
Co
pp
er)
OL
YM
PIC
DA
M
Pe
bb
le (
Co
pp
er)
Ke
rr-S
ulp
hu
rets
Mu
run
tau
Su
kho
i Lo
g
Na
talk
a
Lih
ir
Ne
wm
on
t - N
eva
da
Million tonnes Copper Thousand tonnes U3O8
Largest uranium
deposit in the world
3th largest gold
deposit in the world
Sources: Company Annual Reports, press releases and International Atomic Energy Agency (as at September 2012. Witwatersrand figure is BHP Billiton estimate and is approximate only. # Based on reported mineral “inventory” at 0.2% Cu cut-off grade. Chart depicts Mineral Resources for Olympic Dam and Escondida on a 100% basis. The Mineral Resource information on this slide pertaining to Olympic Dam and Escondida was sourced from and should be read together with and subject to the notes set out in the BHP Billiton 2012 Annual Report. The Mineral Resource information pertaining to Escondida referenced on this slide is based on information known to Richard Preece who is a Fellow of the AusIMM and a full-time employee of BHP Billiton. Mr Preece has sufficient experience which is relevant to this style of mineralisation and type of deposit under consideration and to the activity which he is undertaking to qualify as a Competent Person as defined in the 2004 Edition of the „Australasian Code for Reporting of Exploration Results, Mineral Resources and Ore Reserves‟ (The JORC Code). Mr Preece verifies that this report is based on and fairly reflects the Mineral Resource information in the supporting documentation and agrees with the form and context of the information presented.
~760
Million oz Gold
5th largest copper
deposit in the world

Olympic Dam Geology - Summary
Slide 12
Key Points
• ~350m of unmineralised ‘cover sequence’ – undeformed/unaltered Late Proterozoic to Cambrian shales,
quartzites/ sandstones and dolomites
• Deposit exposures are limited to: – diamond core:
• ~736 km from underground
• ~1,420 km in ‘basement’ (from surface)
• ~400 km of underground development
– ~400 km of underground development
• Hydrothermal Fe-oxide Cu-U-Au deposit
• Olympic Dam Breccia Complex (ODBC) – ~50 km2 at the ‘basement’
• Hosted within the ~1590 Ma Roxby Downs Granite
• Deposit wide zonation patterns – alteration (Fe+2 → Fe+3)
• magnetite+chlorite → hematite+sericite
• siderite → fluorite → barite
– sulphide mineralisation (py→cp→bn→cc→Cuo)
• hypogene, no evidence of supergene
– uraninite-coffinite-brannerite (complex zonation)
– two occurrences of gold:
• sulphides
• margins of the ‘barren’ hem-qtz breccias
• Orebody ~6km x 3km x 800m
• Still open laterally and at depth
1% Copper shell
Existing underground
Basement ~350m depth
Cover Sequence
Geology and Mineralogical Zonation of the Olympic Dam Fe-oxide Cu-U-Au-Ag Deposit, South Australia
N
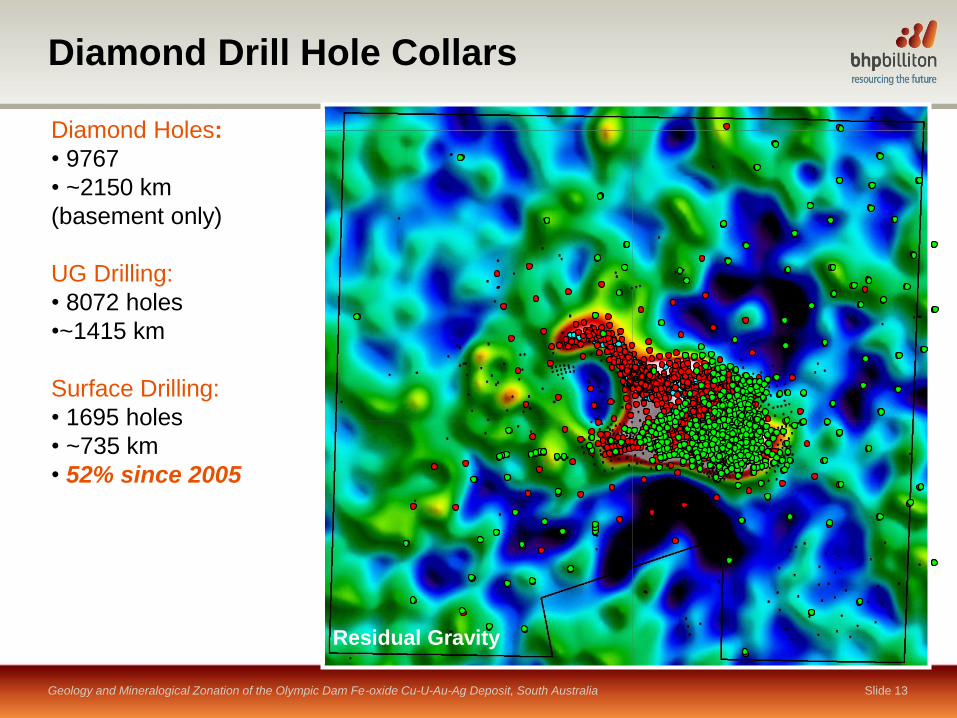
Diamond Drill Hole Collars
Slide 13
Diamond Holes:
• 9767
• ~2150 km
(basement only)
UG Drilling:
• 8072 holes
•~1415 km
Surface Drilling:
• 1695 holes
• ~735 km
• 52% since 2005
Residual Gravity
Geology and Mineralogical Zonation of the Olympic Dam Fe-oxide Cu-U-Au-Ag Deposit, South Australia

Roxby Downs Granite (RDG)
Slide 14
Roxby Downs Granite
‘biotite-out’
‘unaltered’ RDG
‘biotite-out’ • magmatic biotite chlorite
• amphibole chlorite
• magmatic magnetite hematite
• Na-plag ser (partial alteration)
0
10
20
30
40
50
60
70
2,5 3,0 3,5 4,0 4,5 5,0
Fe
(w
t%)
Bulk Dry Density (g/cm3)
Geology and Mineralogical Zonation of the Olympic Dam Fe-oxide Cu-U-Au-Ag Deposit, South Australia
2 km

Altered Roxby Downs Granite
Slide 15
Altered, weakly brecciated
‘biotite-out’
‘5 % Fe’
GRNB
‘GRNB’ (altered, weakly brecciated RDG) • Na-plag ser (almost complete)
• porosity increases
• Fe < 5 wt%
Geology and Mineralogical Zonation of the Olympic Dam Fe-oxide Cu-U-Au-Ag Deposit, South Australia

ODBC: Granite- to Hematite-Rich Breccias
Slide 16 Geology and Mineralogical Zonation of the Olympic Dam Fe-oxide Cu-U-Au-Ag Deposit, South Australia

‘Rock Type’ -350mRL
Slide 17
A
680000E 682000E
6630000N
6632000N
B
C
D
P
P
P P P
RD1988
RD2773
P P
qtz
veins
5% Fe
Geology and Mineralogical Zonation of the Olympic Dam Fe-oxide Cu-U-Au-Ag Deposit, South Australia

‘Rock Type’
Slide 18
B C
D
SW NE SW NE
SW NE
58000E mpg 58000E mpg
58000E mpg
Meters below sea level
No vertical exaggeration
mpg = OD mine plan grid
Geology and Mineralogical Zonation of the Olympic Dam Fe-oxide Cu-U-Au-Ag Deposit, South Australia

Sericite-Orthoclase (-350mRL)
Slide 19
A
680000E 682000E
6630000N
6632000N
B
C
D
HEMQ
Geology and Mineralogical Zonation of the Olympic Dam Fe-oxide Cu-U-Au-Ag Deposit, South Australia
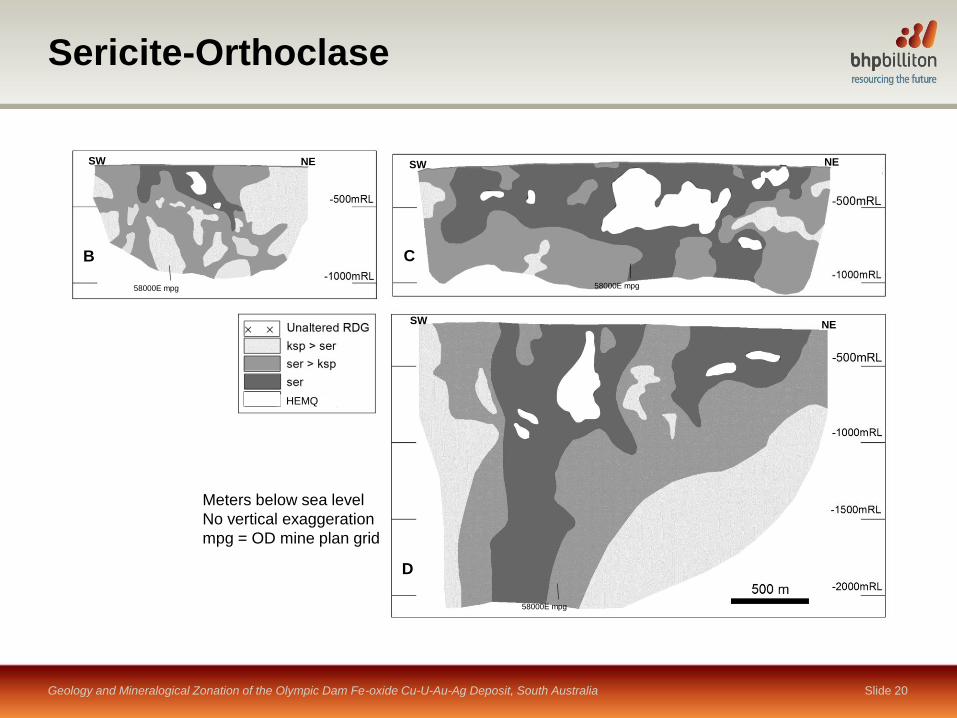
Sericite-Orthoclase
Slide 20
B C
D
SW NE SW NE
SW NE
58000E mpg 58000E mpg
58000E mpg
HEMQ
Meters below sea level
No vertical exaggeration
mpg = OD mine plan grid
Geology and Mineralogical Zonation of the Olympic Dam Fe-oxide Cu-U-Au-Ag Deposit, South Australia

Pyrite-Chalcopyrite-Bornite-Chalcocite
Slide 21
680000E 682000E
6630000N
6632000N
A
B
C
Cu-Fe Sulfides
Non-sulfide
py-cp (Cu:S 0.0-1.0)
cp-bn (Cu:S 1.0-2.5)
bn-cc (Cu:S 2.5-4.0)
5% Fe
2011 Resource Outline
Geology and Mineralogical Zonation of the Olympic Dam Fe-oxide Cu-U-Au-Ag Deposit, South Australia

Pyrite-Chalcopyrite-Bornite-Chalcocite
Slide 22
Cu-Fe Sulfides
Non-sulfide
py-cp
cp-bn
bn-cc
NE
Meters below sea level
No vertical exaggeration
mpg = OD mine plan grid
SW NE
-500
-1000
58000E mpg
SW
-500
-1000
58000E mpg
-500
-1000
SW
58000E mpg
A B
C
Geology and Mineralogical Zonation of the Olympic Dam Fe-oxide Cu-U-Au-Ag Deposit, South Australia

Sulphide Abundances (-400mRL)
Slide 23
bornite chalcopyrite pyrite
wt% sul
Geology and Mineralogical Zonation of the Olympic Dam Fe-oxide Cu-U-Au-Ag Deposit, South Australia

Hematite-Orthoclase-Sericite (-400mRL)
Slide 24
hematite orthoclase sericite
Geology and Mineralogical Zonation of the Olympic Dam Fe-oxide Cu-U-Au-Ag Deposit, South Australia

Siderite-Fluorite-Barite (-400mRL)
Slide 25
siderite fluorite barite
Geology and Mineralogical Zonation of the Olympic Dam Fe-oxide Cu-U-Au-Ag Deposit, South Australia

Mo-Pb-Zn (-400mRL)
Slide 26
Mo Pb Zn
Geology and Mineralogical Zonation of the Olympic Dam Fe-oxide Cu-U-Au-Ag Deposit, South Australia

Conclusions
Slide 27
***Comprehensive geological/geochemical/mineralogical/geometallurgical database***
• Edges of breccia complex are better defined (previously limited definition)
• Deposit wide zonation patterns for:
– sulphides(py→cp→bn→cc→Cuo, previously known)
– hematite, orthoclase-sericite
– siderite-barite-fluorite
• Remnants of advanced argillic alteration (sericite+quartz±Al-OH) (previously unknown)
• Recognition of Zn-Pb-Mo-Sn-W systematics (previously unknown)
• More evidence for distal or paragenetically early mineralisation (previously unknown)
• Exposure of extensive mafic/ultramafic dykes (previously known, but aerial extent has increased)
• Exposure of two spatially extensive sedimentary units (extent previously unknown)
• +90 minerals have been identified
• Comprehensive dataset alllow for drill dection over 10 km away from centre
Geology and Mineralogical Zonation of the Olympic Dam Fe-oxide Cu-U-Au-Ag Deposit, South Australia

© HiSeis 28
Line D 1000 m cover, migrated stack in depth

Legend of Geographical locations along NS seismic profile:
1. Drill hole Blanche 1
2. Drillhole RU39-5371 ~2.3km N from the seismic profile
The depth of the Blanche 1 drill hole
The base of Pandurra Formation based on drilling
Map Scale 1: 25 000
6 km
© HiSeis 29
De
pth
(m
)


30 km
10 km
Olympic Dam
Woomera Borefield Road North
r <50 Wm r >1000 Wm
r ~1000 Wm
r <50 Wm r <50 Wm
1 km spaced broadband survey
Olympic Dam
Graham Heinson, Stephan Thiel, and Paul
Soeffky
University of Adelaide Electrical Earth
Imaging group

rox00
0
RO
X00
1
RO
X00
3
RO
X00
5
RO
X00
6
rox00
7
RO
X00
9
RO
X01
1
RO
X01
2
RO
X01
3
RO
X01
4
rox01
5
rox01
6
RO
X01
7
RO
X01
8
RO
X01
9
RO
X02
0
RO
X02
1
RO
X02
2
RO
X02
3
RO
X02
4
RO
X02
5
RO
X02
6
RO
X02
7
rox02
9
RO
X03
1
RO
X03
3
RO
X03
5
RO
X03
7
rox03
8
OD
01
OD
02
OD
03
OD
04
OD
05
OD
06
OD
07
OD
08
OD
09
OD
10
OD
12
OD
14
OD
15
OD
16
OD
17
OD
18
OD
19
OD
20
OD
22
OD
23
OD
24
OD
25
OD
26
OD
27
OD
28
OD
29
OD
30
OD
31
OD
32
OD
34
OD
35
OD
38
OD
40
OD
41
OD
42
OD
43
OD
44
OD
45
OD
46
OD
47
OD
48
OD
49
OD
50
OD
52
OD
53
OD
54
OD
55
OD
56
OD
57
OD
58
OD
59
OD
60
OD
61
OD
62
OD
63
OD
64
OD
65
OD
66
OD
67
OD
68
OD
69
OD
70
OD
71
OD
72
OD
74
OD
75
OD
76
OD
78
OD
79
OD
80
20 30 40 50 60 70 80 90 100 110 120 130 140 150 160 170 180 190 200
0
-10000
-20000
-30000
-40000
-50000
-60000
-70000
-80000
-90000
-100000
-110000
-120000
-130000
-140000
-150000
-160000
-170000
-180000
0
-10000
-20000
-30000
-40000
-50000
-60000
-70000
-80000
-90000
-100000
-110000
-120000
-130000
-140000
-150000
-160000
-170000
-180000
Distance (Km)
De
pth
(m
)
1000
794
631
501
398
316
251
200
158
126
100
79
63
50
40
32
25
20
16
13
10
8
6
5
4
3
3
2
2
1
1
Ohm.m
Upper mantle
Brittle upper crust
Ductile lower crust
Wirrda Well - Acropolis
Olympic Dam Vulcan ? Woomera (South)
(North)
Fluid pathways

Upper mantle
Brittle upper crust
Ductile lower crust
Wirrda Well Acropolis
Olympic Dam
Vulcan ?
Fluid pathways

Previous drilling on the eastern Gawler craton,
‘Olympic Province’ provides example of
current practice under deep cover
Decision to drill based on 2
channels of data
Many false +ves
Expensive
Sparse, inconsistent data
Minimal iterative knowledge to inform follow-up drilling
Image courtesy of Simon van der Wielen

Coiled Tubing Drill Rig
Autonomous Sonde
Lab-at-RigTM
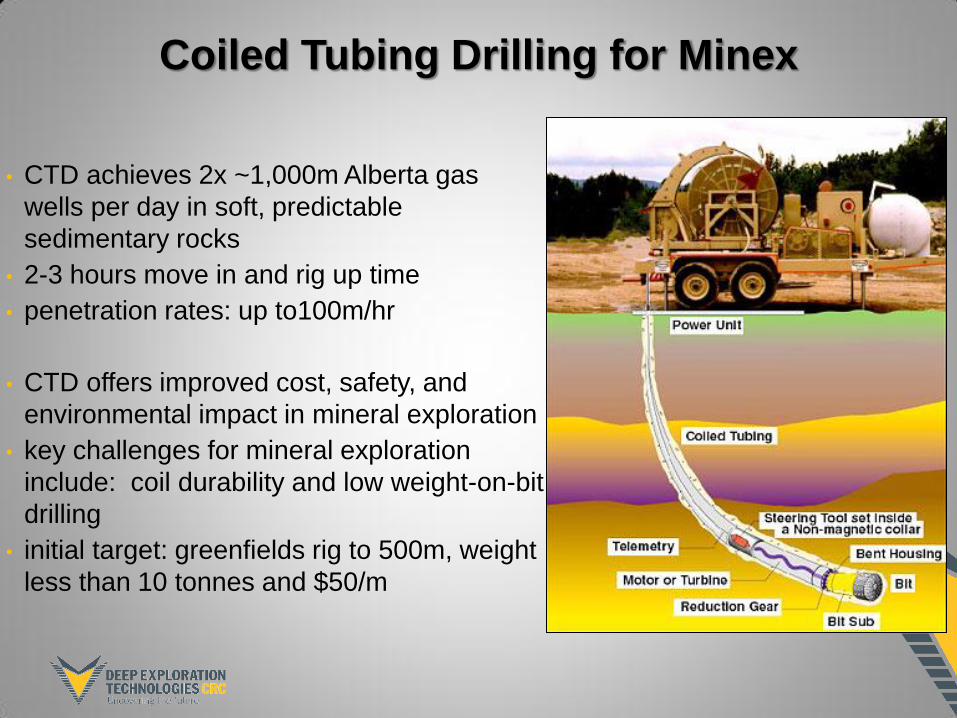
• CTD achieves 2x ~1,000m Alberta gas
wells per day in soft, predictable
sedimentary rocks
• 2-3 hours move in and rig up time
• penetration rates: up to100m/hr
• CTD offers improved cost, safety, and
environmental impact in mineral exploration
• key challenges for mineral exploration
include: coil durability and low weight-on-bit
drilling
• initial target: greenfields rig to 500m, weight
less than 10 tonnes and $50/m
Coiled Tubing Drilling for Minex
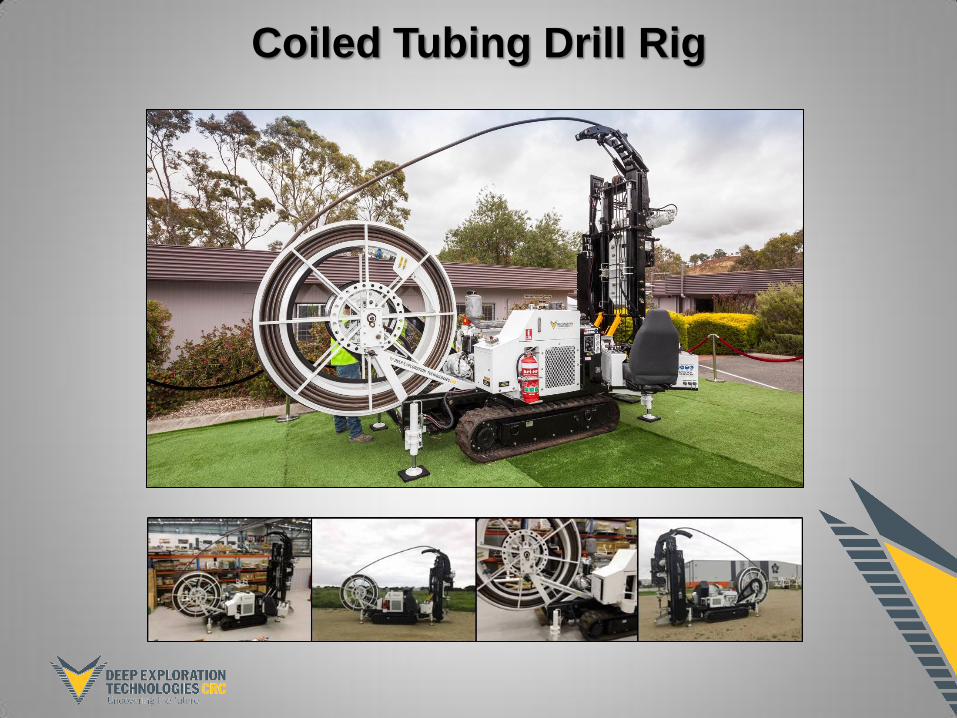
Coiled Tubing Drill Rig

Downhole sensing: Autonomous Sonde
Alternative
Configurations!
Logging while
pulling rods Sonde deployed
before rod pull
New
config
ura
tions


Image courtesy of Simon van der Wielen
Olympic Domain DET CRC Deep
Prospecting Strategy
Identify target based on geophysics and prior
drilling
Subtle feature in regional gravity survey

Olympic Domain DET CRC Deep
Prospecting Strategy
Systematically sample target area with cheap,
rapid drilling + real time analyses
Hole on gravity high ‘fails’
but pathfinder geochemistry in all holes
hints at a broader pattern and informs follow up
drilling
5km grid pattern
Pathfinder element X Anomaly Background
Pathfinder element X Anomaly Background
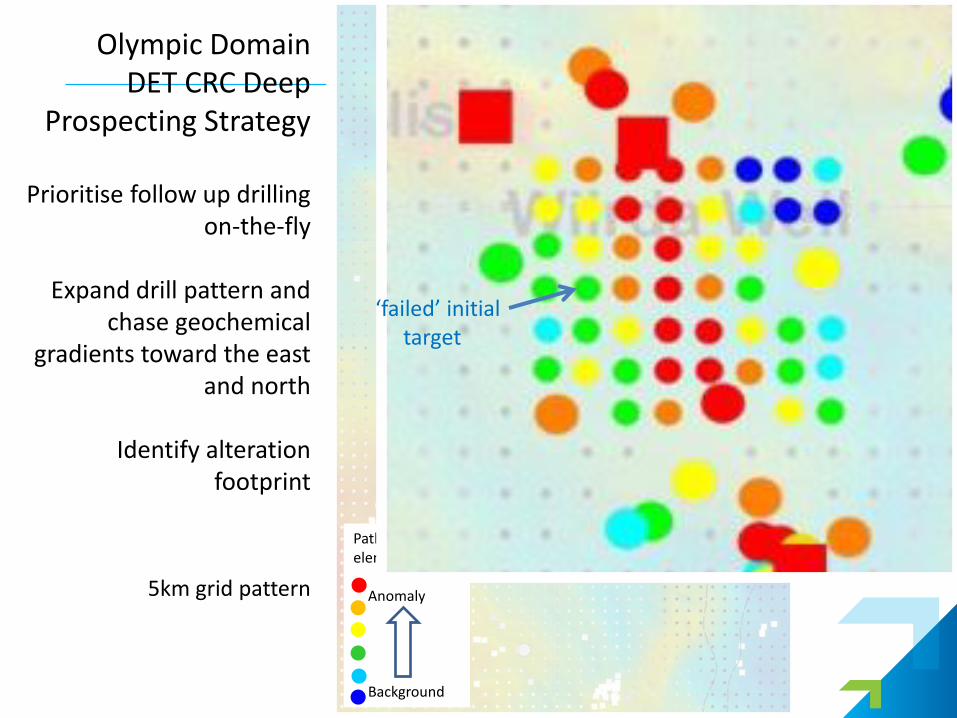
Olympic Domain DET CRC Deep
Prospecting Strategy
Prioritise follow up drilling on-the-fly
Expand drill pattern and
chase geochemical gradients toward the east
and north
Identify alteration footprint
5km grid pattern
‘failed’ initial target

Pathfinder element X Anomaly Background
Olympic Domain DET CRC Deep
Prospecting Strategy
Prioritise infill drilling on-the-fly
Identify hot-spots within
the footprint for deep targeting with high level of
confidence
5km grid pattern
‘failed’ initial target
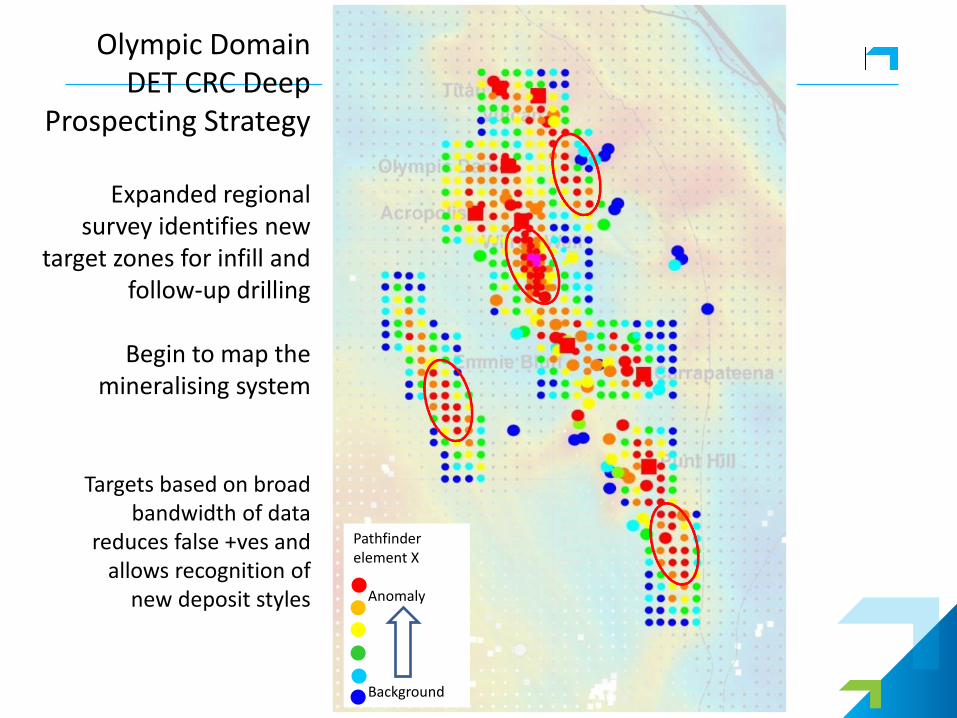
Olympic Domain DET CRC Deep
Prospecting Strategy
Expanded regional survey identifies new
target zones for infill and follow-up drilling
Begin to map the
mineralising system
Pathfinder element X Anomaly Background
Targets based on broad bandwidth of data
reduces false +ves and allows recognition of
new deposit styles

Conclusion
•Metal demand is rapidly increasing
•Strong demand for some of the high tech metals
– but their overall market is still quite modest
•Exploration is becoming more difficult &
expensive
•… and we having to explore under deeper cover
•Country & Social Risks are impacting on projects
•Innovations in Geophysics and rapid deep Drilling
will be essential a key role in the future
45