simon elisha @ pivotal
TRANSCRIPT
2 © 2014 Pivotal Software, Inc. All rights reserved. 2 © 2014 Pivotal Software, Inc. All rights reserved.
Connecting Data with Customers Bridging the Gap Between Data Science & Customers
Simon Elisha, CTO & Director of Field Engineering, A/NZ @simon_elisha
3 © 2014 Pivotal Software, Inc. All rights reserved.
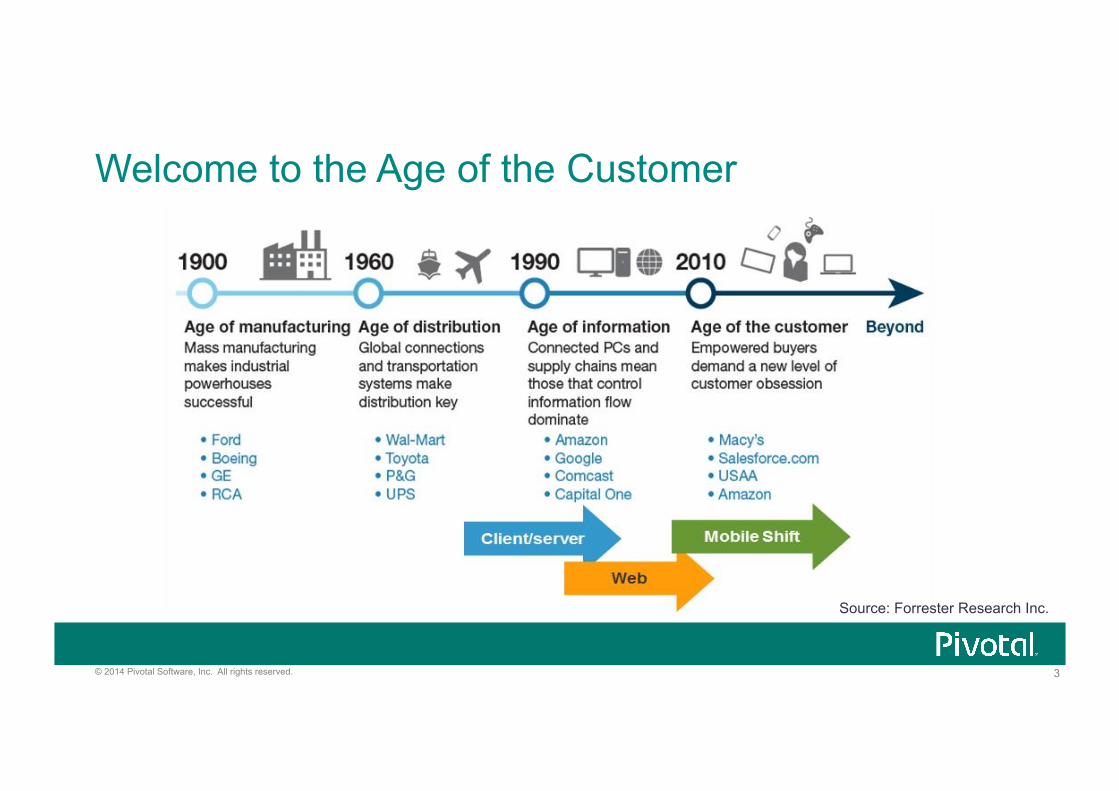
Welcome to the Age of the Customer
Source: Forrester Research Inc.
4 © 2014 Pivotal Software, Inc. All rights reserved. 4 © 2014 Pivotal Software, Inc. All rights reserved.
Title in Upper & LC Bold Type Subtitle 24 Point Arial Title Case
Additional Line 18 Point Arial
5 © 2014 Pivotal Software, Inc. All rights reserved.
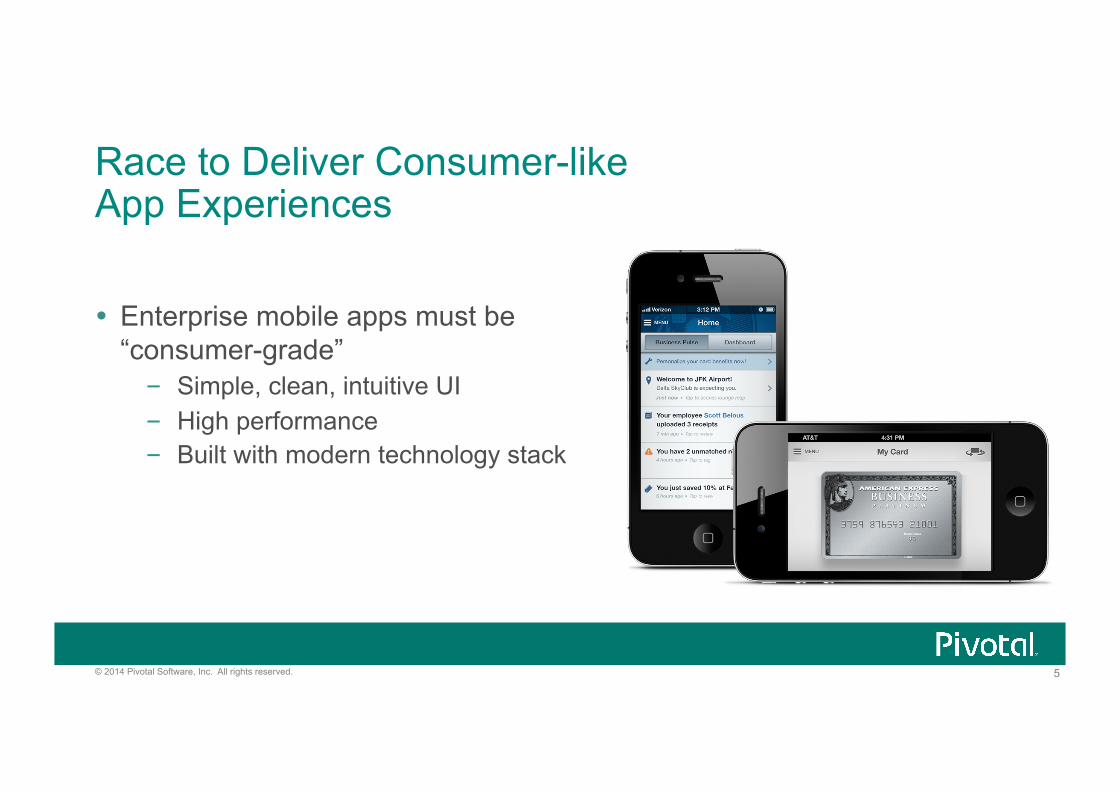
Race to Deliver Consumer-like App Experiences
Enterprise mobile apps must be “consumer-grade”
– Simple, clean, intuitive UI – High performance – Built with modern technology stack
6 © 2014 Pivotal Software, Inc. All rights reserved.
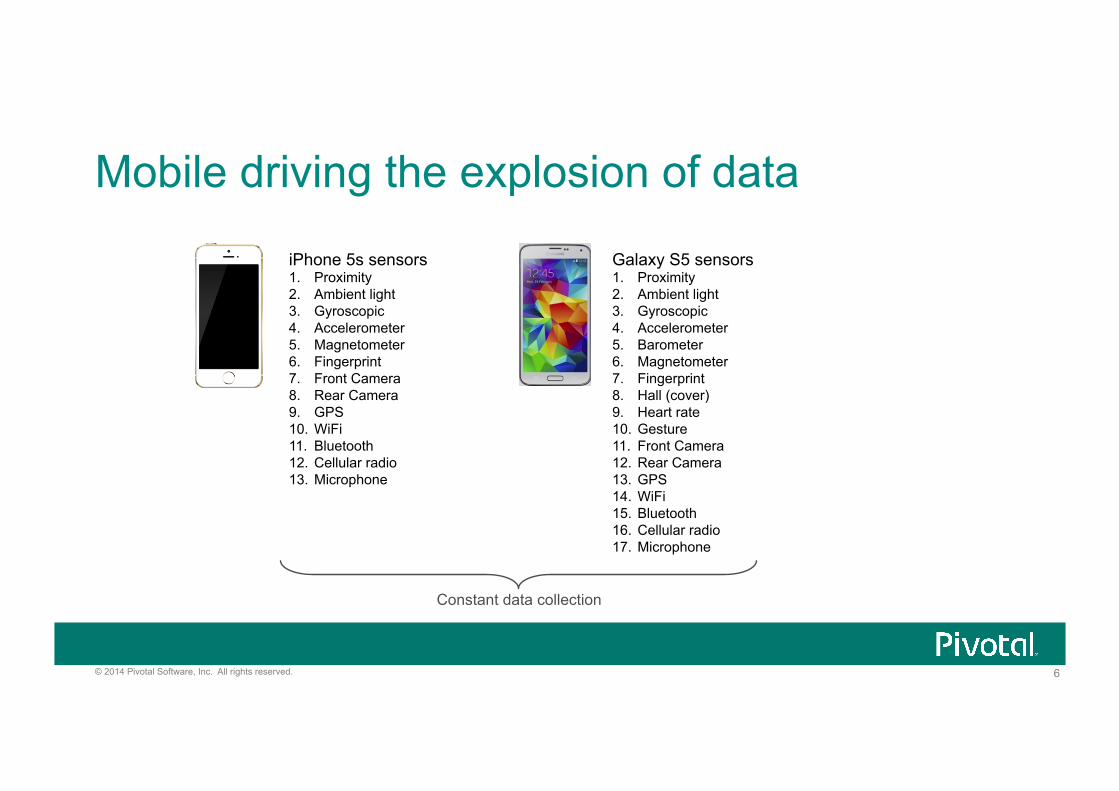
Mobile driving the explosion of data
iPhone 5s sensors 1. Proximity 2. Ambient light 3. Gyroscopic 4. Accelerometer 5. Magnetometer 6. Fingerprint 7. Front Camera 8. Rear Camera 9. GPS 10. WiFi 11. Bluetooth 12. Cellular radio 13. Microphone
Galaxy S5 sensors 1. Proximity 2. Ambient light 3. Gyroscopic 4. Accelerometer 5. Barometer 6. Magnetometer 7. Fingerprint 8. Hall (cover) 9. Heart rate 10. Gesture 11. Front Camera 12. Rear Camera 13. GPS 14. WiFi 15. Bluetooth 16. Cellular radio 17. Microphone
Constant data collection
7 © 2014 Pivotal Software, Inc. All rights reserved.
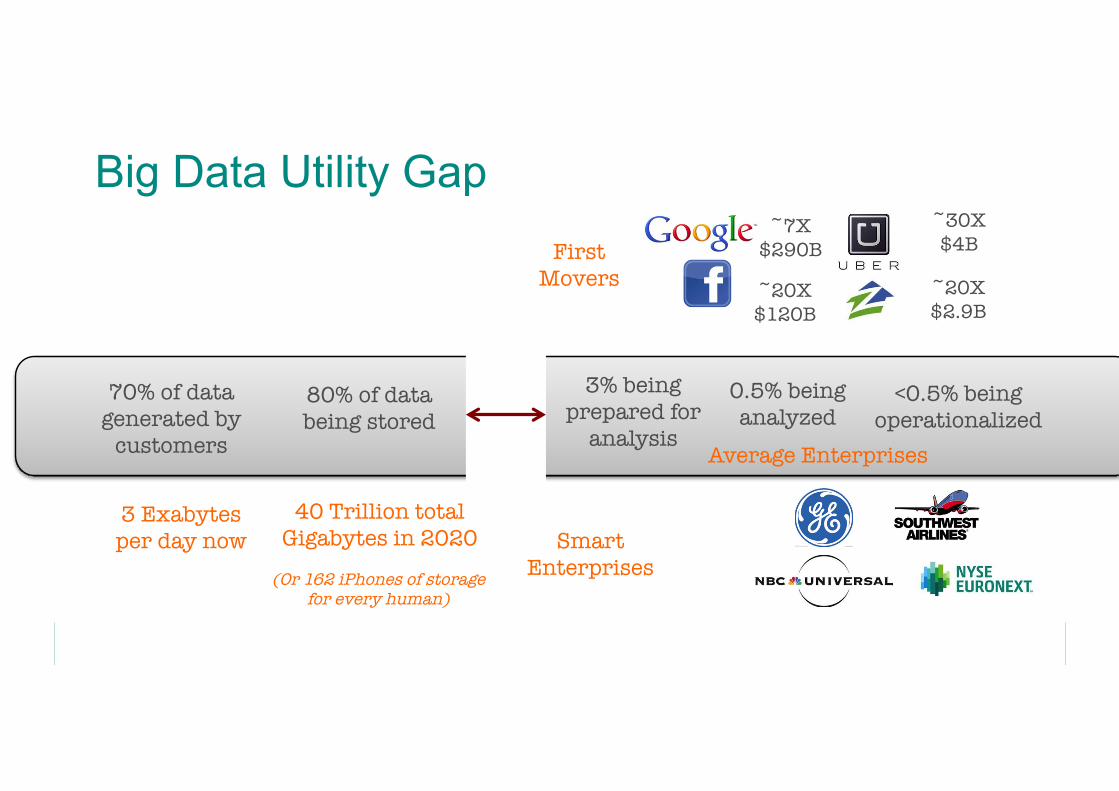
Big Data Utility Gap
70% of data generated by
customers
80% of data being stored
3% being prepared for
analysis
0.5% being analyzed
<0.5% being operationalized
3 Exabytes per day now
40 Trillion total Gigabytes in 2020
First Movers
Smart Enterprises
~20X $2.9B
~30X$4B
~7X $290B
~20X $120B
Average Enterprises
(Or 162 iPhones of storage for every human)
8 © 2014 Pivotal Software, Inc. All rights reserved.
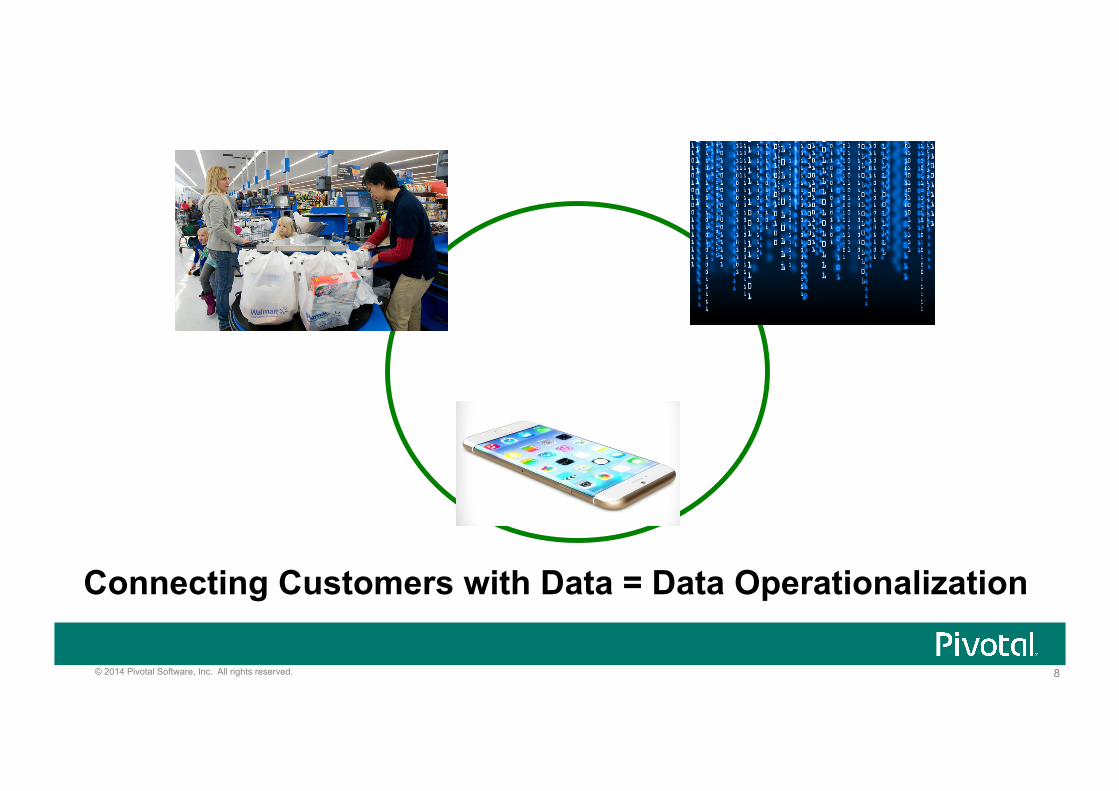
Connecting Customers with Data = Data Operationalization
9 © 2014 Pivotal Software, Inc. All rights reserved.
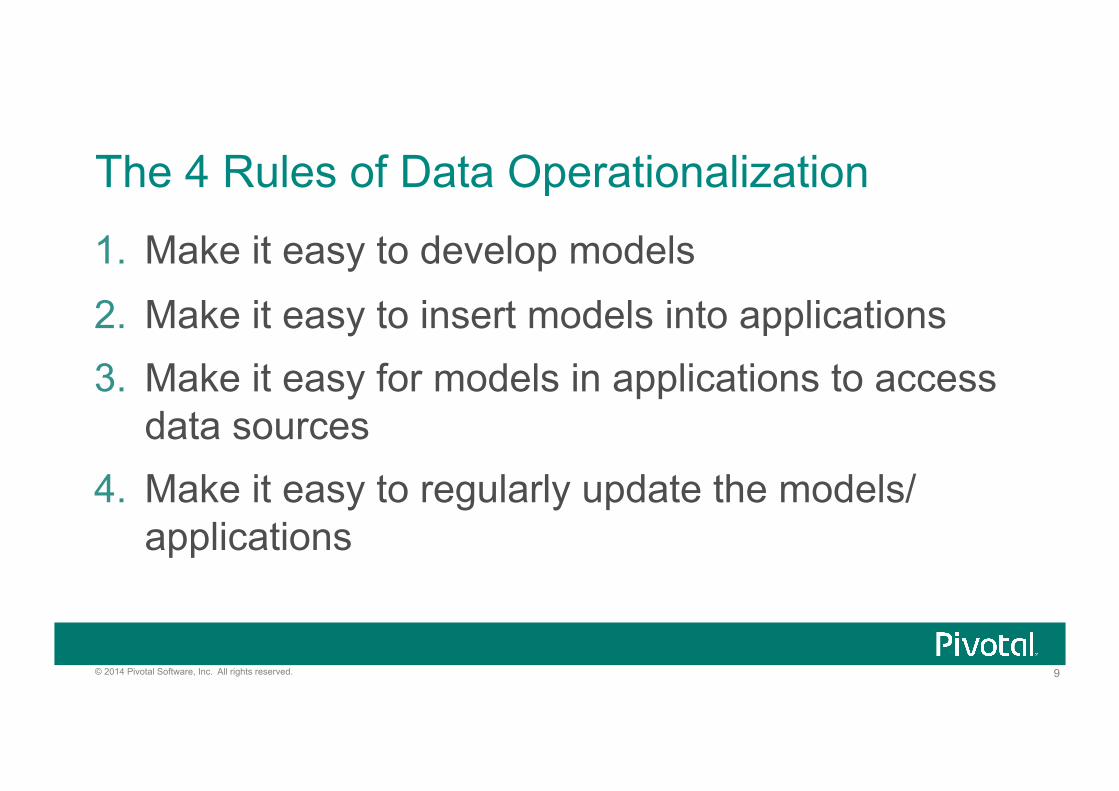
The 4 Rules of Data Operationalization
1. Make it easy to develop models 2. Make it easy to insert models into applications 3. Make it easy for models in applications to access
data sources 4. Make it easy to regularly update the models/
applications
10 © 2014 Pivotal Software, Inc. All rights reserved.
What’s Stopping Most Companies from doing this?
• Data in Silos
• Slow, Reactive Analytics
• Slow IT and App Dev Processes
11 © 2014 Pivotal Software, Inc. All rights reserved.
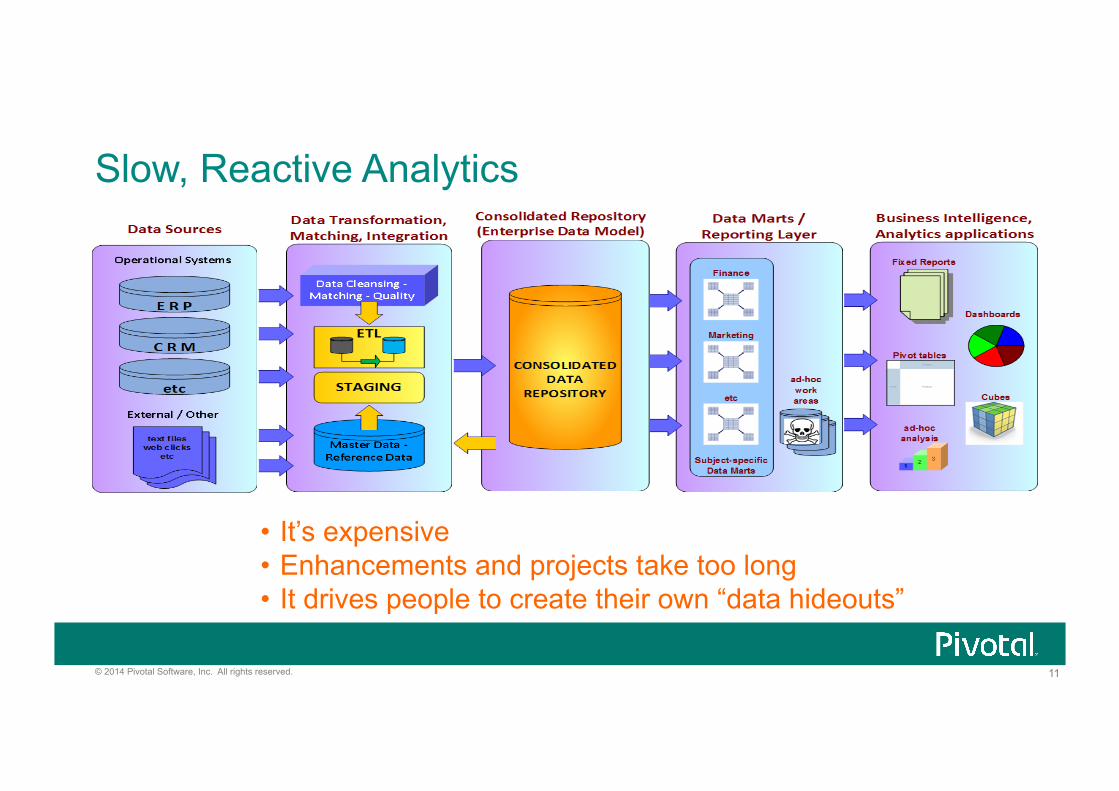
Slow, Reactive Analytics
• It’s expensive • Enhancements and projects take too long • It drives people to create their own “data hideouts”

12 © 2014 Pivotal Software, Inc. All rights reserved.
13 © 2014 Pivotal Software, Inc. All rights reserved.
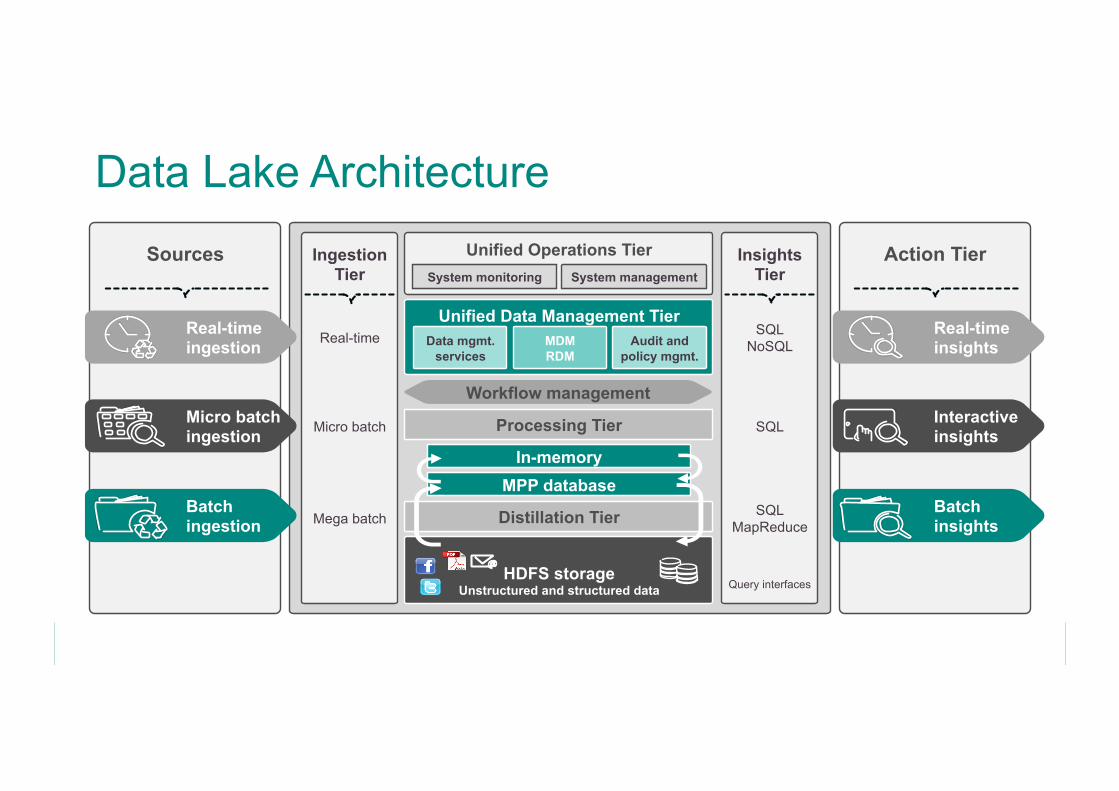
Data Lake Architecture Ingestion
Tier Insights
Tier Unified Operations Tier
System monitoring System management
Unified Data Management Tier Data mgmt.
services MDM RDM
Audit and policy mgmt.
Processing Tier
Workflow management
Distillation Tier
HDFS storage Unstructured and structured data
In-memory MPP database
Real-time
Micro batch
Mega batch
SQL NoSQL
SQL MapReduce
Query interfaces
SQL
Sources Action Tier
Real-time ingestion
Micro batch ingestion
Batch ingestion
Real-time insights
Interactive insights
Batch insights
14 © 2014 Pivotal Software, Inc. All rights reserved.
YOUR DATA
DATA SCIENCE
+!= MODELS
15 © 2014 Pivotal Software, Inc. All rights reserved.
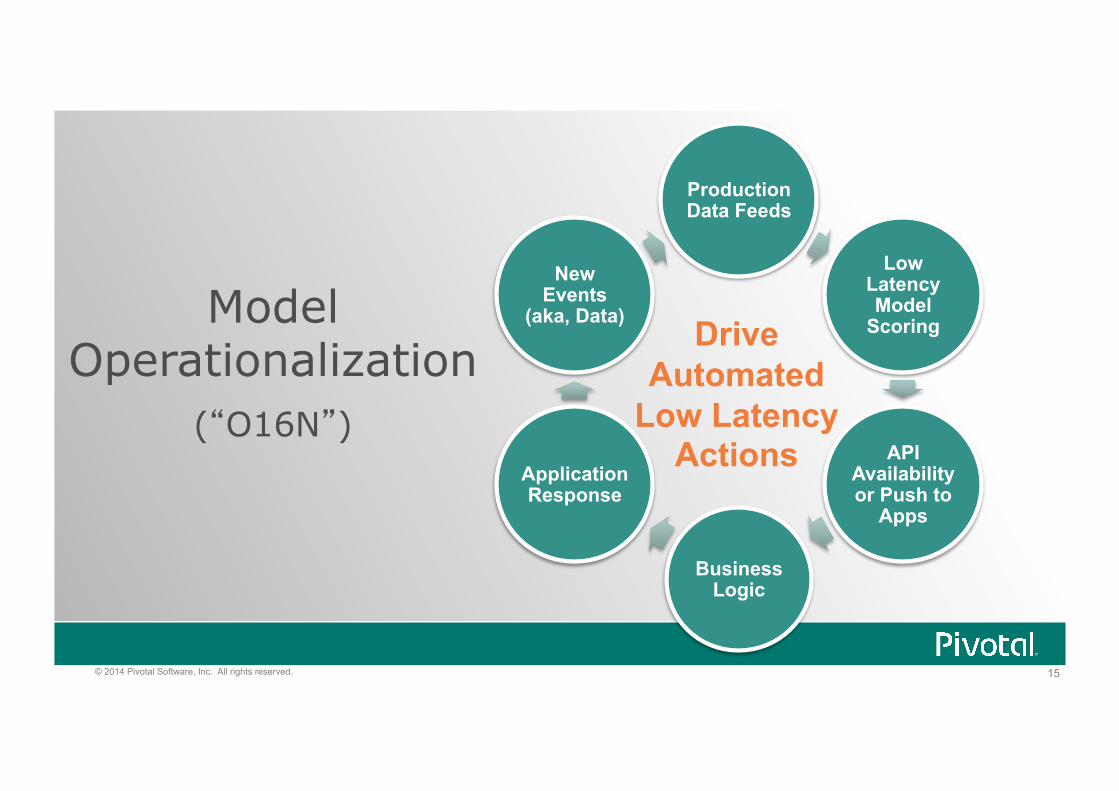
Drive Automated
Low Latency Actions
Production Data Feeds
Low Latency Model
Scoring
API Availability or Push to
Apps
Business Logic
Application Response
New Events
(aka, Data) Model Operationalization
(“O16N”)
16 © 2014 Pivotal Software, Inc. All rights reserved.
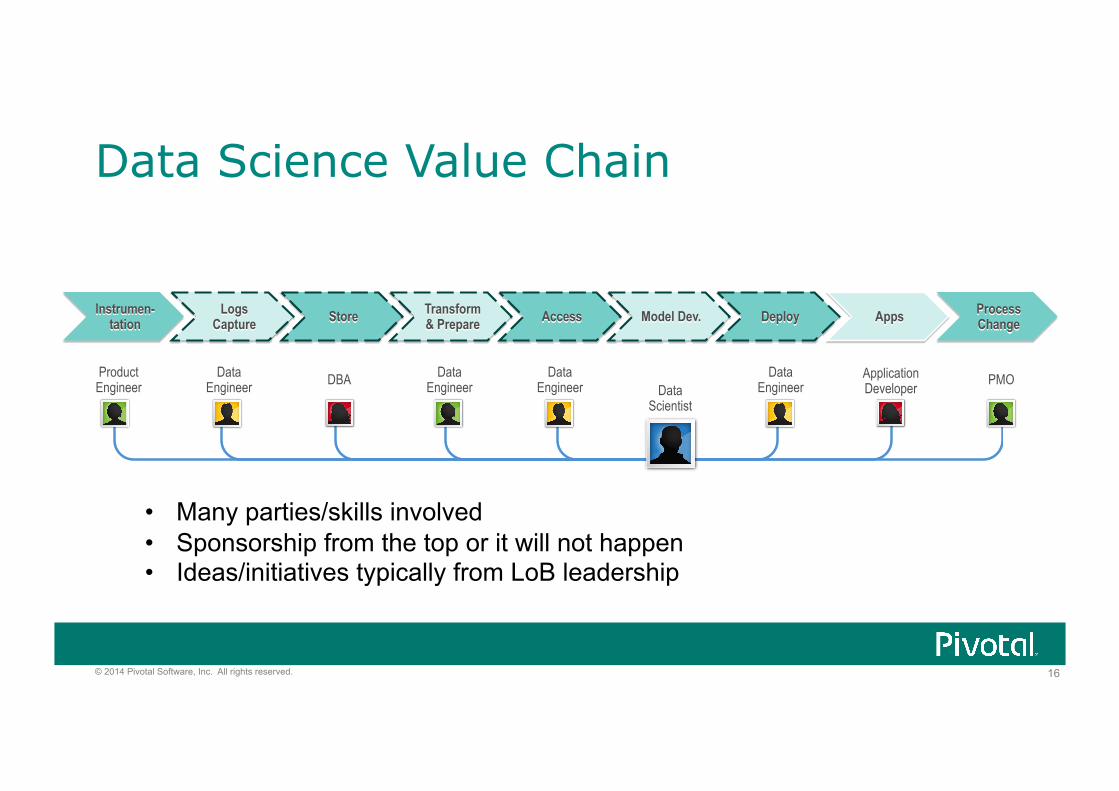
Data Science Value Chain
Product Engineer
Data Engineer DBA Data
Engineer Data
Engineer Data Scientist
Data Engineer
Application Developer PMO
• Many parties/skills involved • Sponsorship from the top or it will not happen • Ideas/initiatives typically from LoB leadership
17 © 2014 Pivotal Software, Inc. All rights reserved.
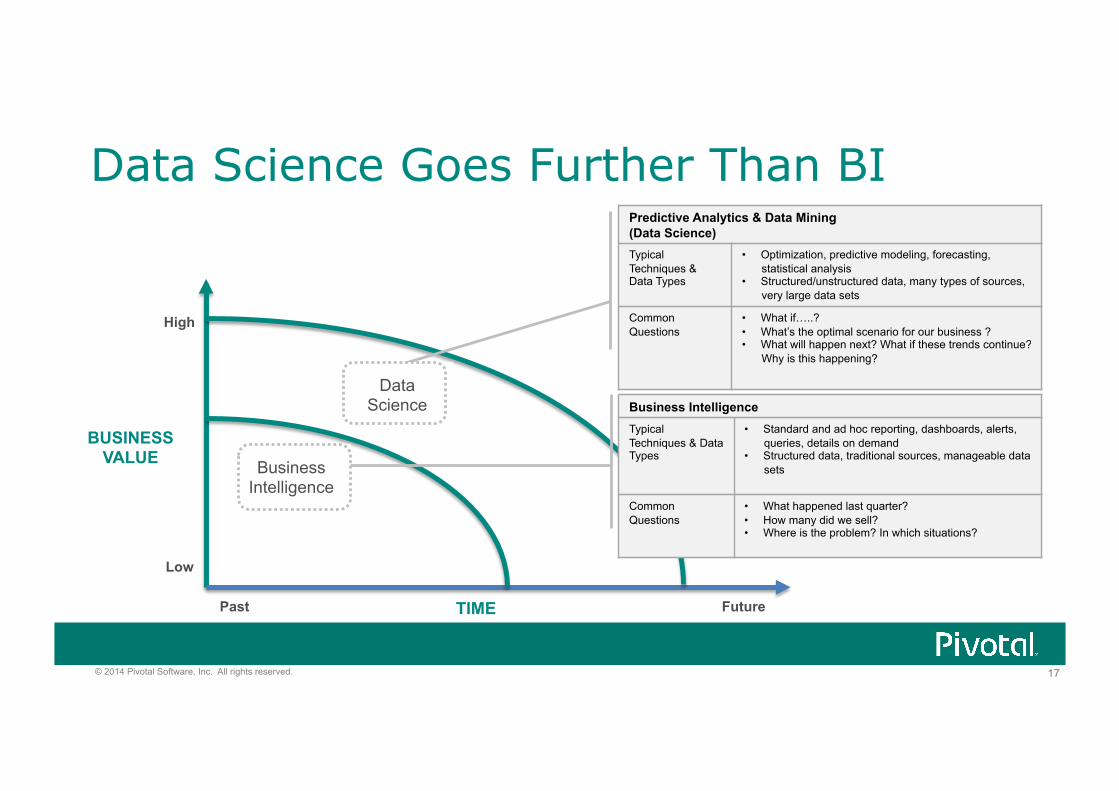
High
Future Past TIME
BUSINESS VALUE Business
Intelligence
Predictive Analytics & Data Mining (Data Science) Typical Techniques & Data Types
• Optimization, predictive modeling, forecasting, statistical analysis
• Structured/unstructured data, many types of sources, very large data sets
Common Questions
• What if…..? • What’s the optimal scenario for our business ? • What will happen next? What if these trends continue?
Why is this happening?
Business Intelligence Typical Techniques & Data Types
• Standard and ad hoc reporting, dashboards, alerts, queries, details on demand
• Structured data, traditional sources, manageable data sets
Common Questions
• What happened last quarter? • How many did we sell? • Where is the problem? In which situations?
Data Science
Low
Data Science Goes Further Than BI
18 © 2014 Pivotal Software, Inc. All rights reserved.
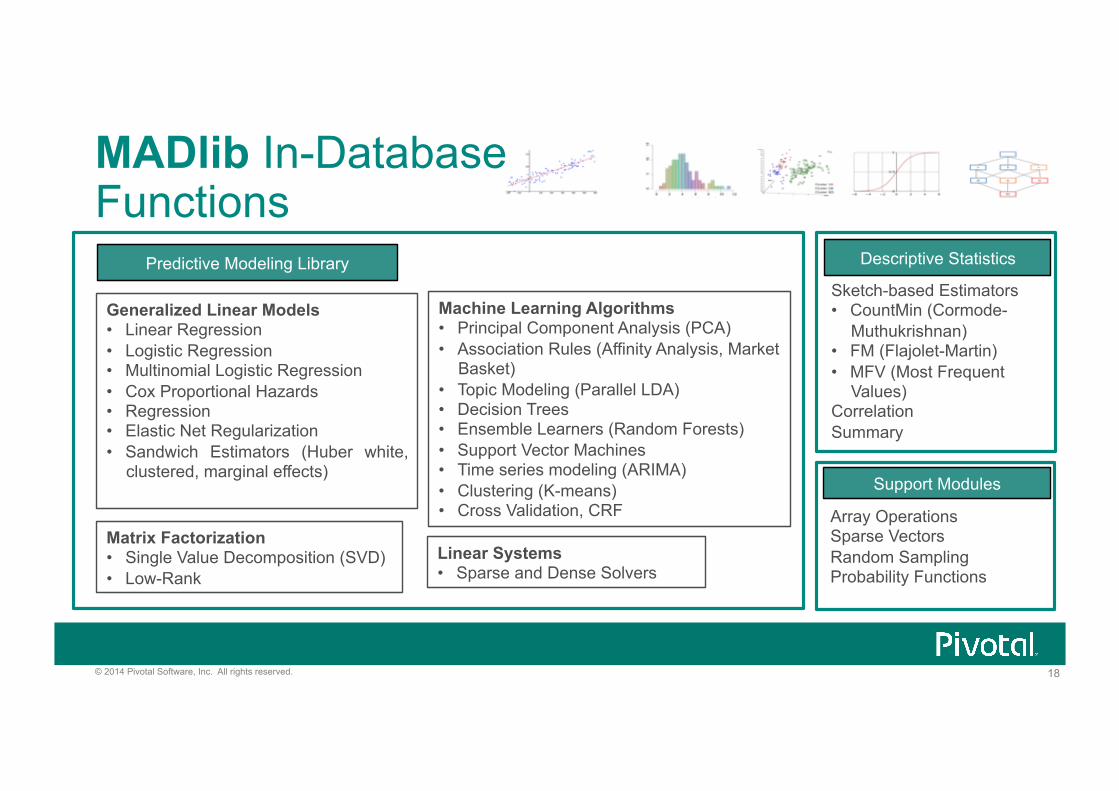
MADlib In-Database Functions
Predictive Modeling Library
Linear Systems • Sparse and Dense Solvers
Matrix Factorization • Single Value Decomposition (SVD) • Low-Rank
Generalized Linear Models • Linear Regression • Logistic Regression • Multinomial Logistic Regression • Cox Proportional Hazards • Regression • Elastic Net Regularization • Sandwich Estimators (Huber white,
clustered, marginal effects)
Machine Learning Algorithms • Principal Component Analysis (PCA) • Association Rules (Affinity Analysis, Market
Basket) • Topic Modeling (Parallel LDA) • Decision Trees • Ensemble Learners (Random Forests) • Support Vector Machines • Time series modeling (ARIMA) • Clustering (K-means) • Cross Validation, CRF
Descriptive Statistics
Sketch-based Estimators • CountMin (Cormode-
Muthukrishnan) • FM (Flajolet-Martin) • MFV (Most Frequent
Values) Correlation Summary
Support Modules
Array Operations Sparse Vectors Random Sampling Probability Functions
19 © 2014 Pivotal Software, Inc. All rights reserved.
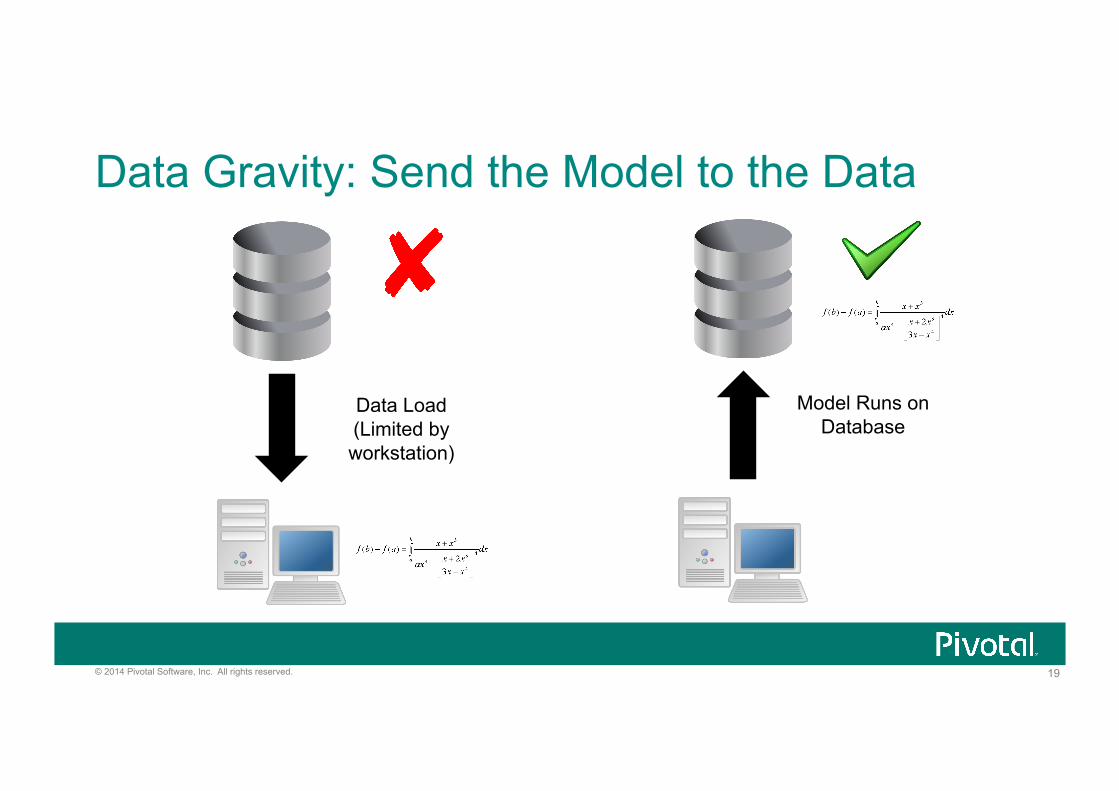
Data Gravity: Send the Model to the Data
Data Load (Limited by workstation)
Model Runs on Database
20 © 2014 Pivotal Software, Inc. All rights reserved.
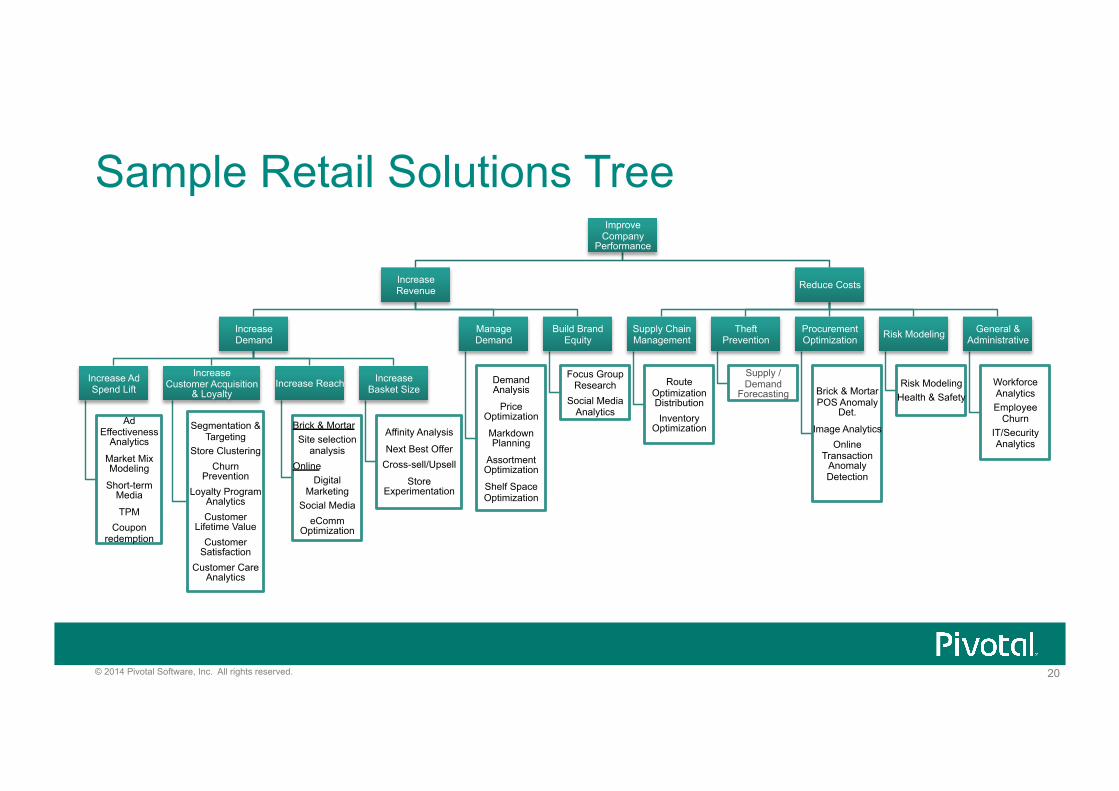
Improve Company
Performance
Increase Revenue
Increase Demand
Increase Ad Spend Lift
Ad Effectiveness
Analytics
Market Mix Modeling
Short-term Media
TPM Coupon
redemption
Increase Customer Acquisition
& Loyalty
Segmentation & Targeting
Store Clustering Churn
Prevention Loyalty Program
Analytics Customer
Lifetime Value Customer
Satisfaction Customer Care
Analytics
Increase Reach
Brick & Mortar Site selection
analysis Online
Digital Marketing
Social Media eComm
Optimization
Increase Basket Size
Affinity Analysis
Next Best Offer Cross-sell/Upsell
Store Experimentation
Manage Demand
Demand Analysis
Price Optimization
Markdown Planning
Assortment Optimization
Shelf Space Optimization
Build Brand Equity
Focus Group Research
Social Media Analytics
Reduce Costs
Supply Chain Management
Route Optimization Distribution Inventory
Optimization
Theft Prevention
Supply / Demand
Forecasting
Procurement Optimization
Brick & Mortar POS Anomaly
Det.
Image Analytics Online
Transaction Anomaly Detection
Risk Modeling
Risk Modeling Health & Safety
General & Administrative
Workforce Analytics Employee
Churn IT/Security Analytics
Sample Retail Solutions Tree
21 © 2014 Pivotal Software, Inc. All rights reserved.
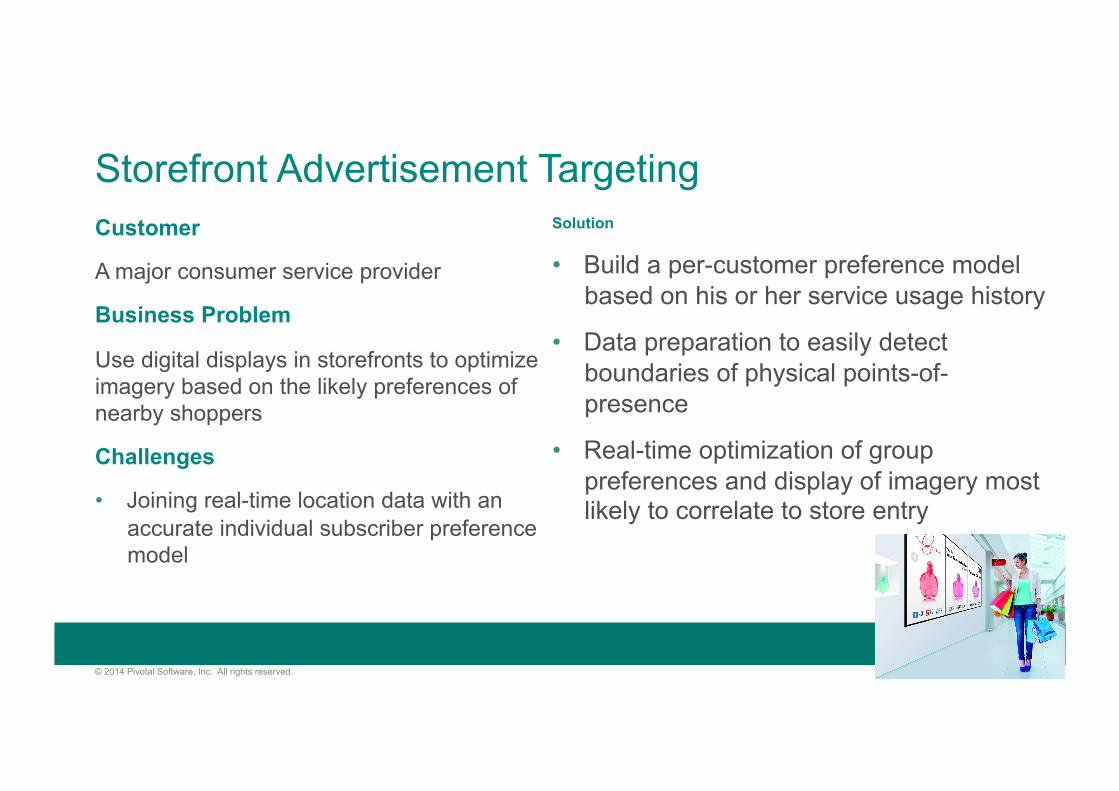
Storefront Advertisement Targeting Customer
A major consumer service provider
Business Problem
Use digital displays in storefronts to optimize imagery based on the likely preferences of nearby shoppers
Challenges
• Joining real-time location data with an accurate individual subscriber preference model
Solution
• Build a per-customer preference model based on his or her service usage history
• Data preparation to easily detect boundaries of physical points-of-presence
• Real-time optimization of group preferences and display of imagery most likely to correlate to store entry
22 © 2014 Pivotal Software, Inc. All rights reserved.
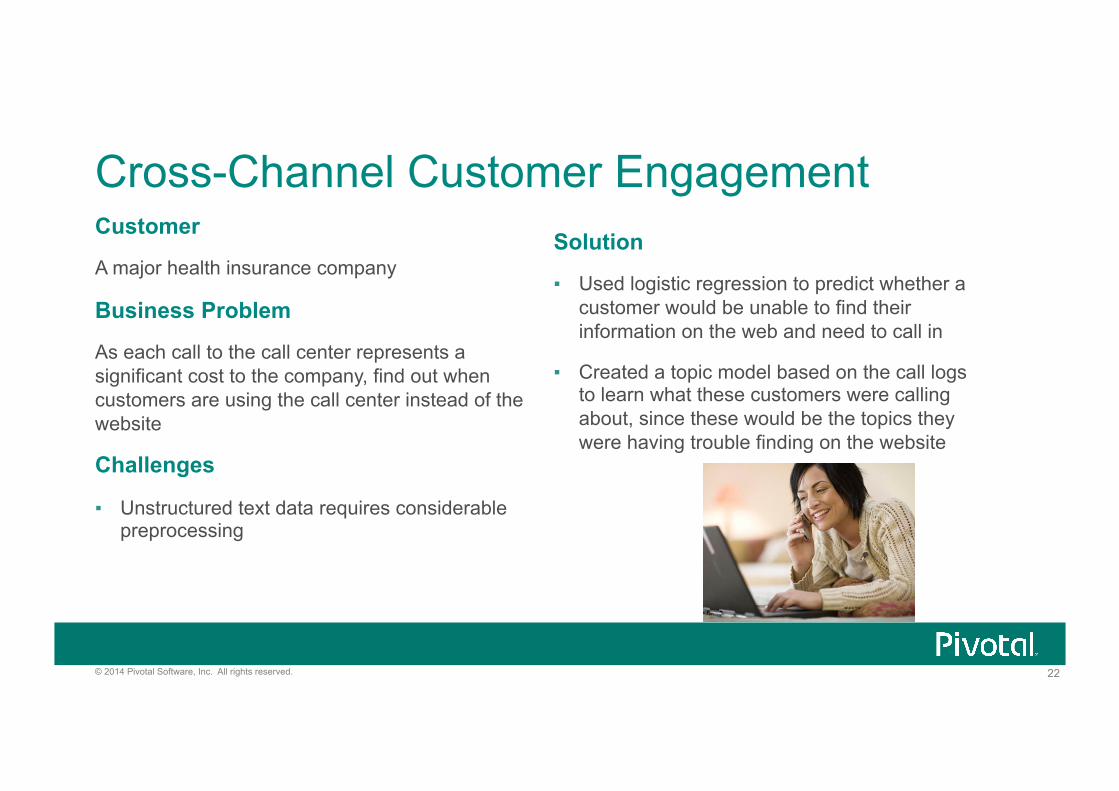
Cross-Channel Customer Engagement Customer
A major health insurance company
Business Problem
As each call to the call center represents a significant cost to the company, find out when customers are using the call center instead of the website
Challenges
▪ Unstructured text data requires considerable preprocessing
Solution
▪ Used logistic regression to predict whether a customer would be unable to find their information on the web and need to call in
▪ Created a topic model based on the call logs to learn what these customers were calling about, since these would be the topics they were having trouble finding on the website
23 © 2014 Pivotal Software, Inc. All rights reserved.
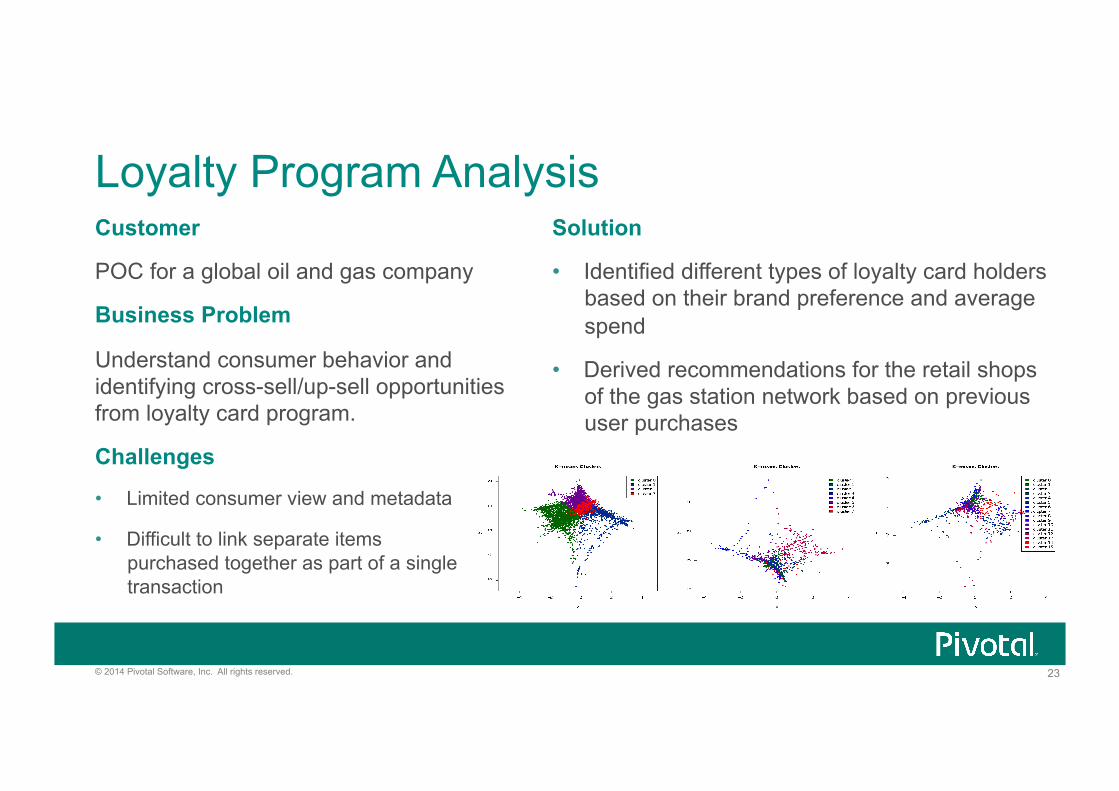
Loyalty Program Analysis Customer
POC for a global oil and gas company
Business Problem
Understand consumer behavior and identifying cross-sell/up-sell opportunities from loyalty card program.
Challenges
• Limited consumer view and metadata
• Difficult to link separate items purchased together as part of a single transaction
Solution
• Identified different types of loyalty card holders based on their brand preference and average spend
• Derived recommendations for the retail shops of the gas station network based on previous user purchases
24 © 2014 Pivotal Software, Inc. All rights reserved.
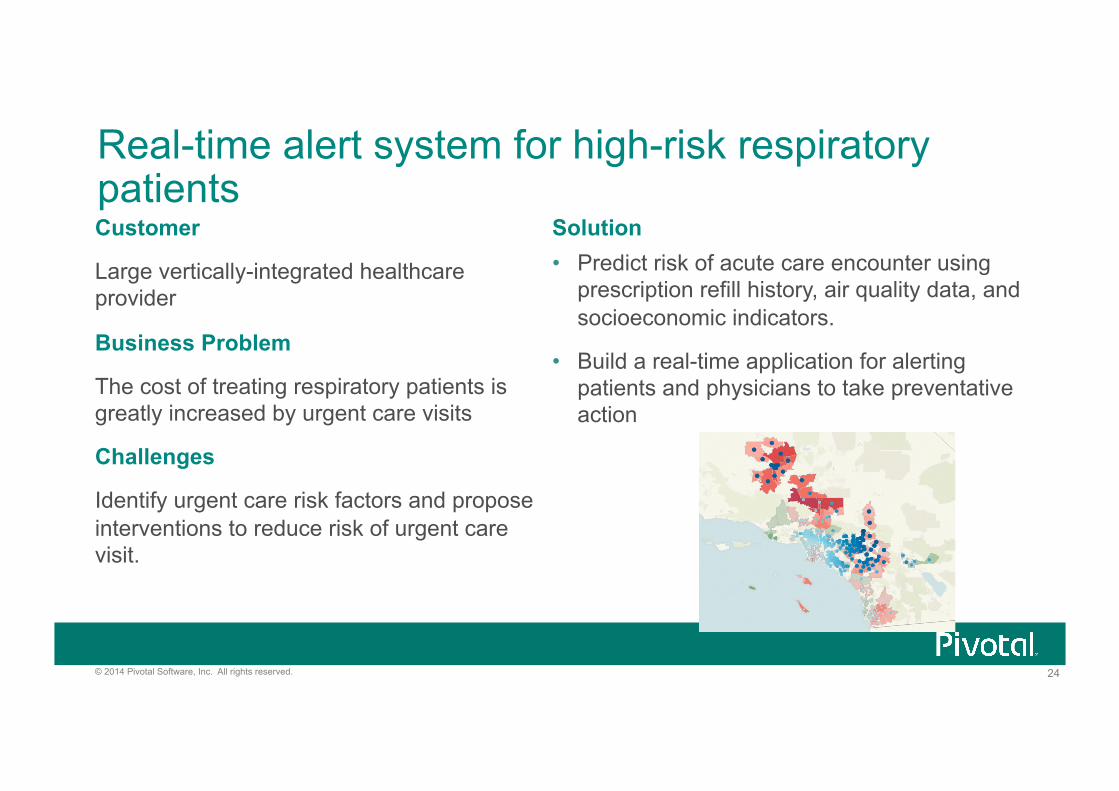
Real-time alert system for high-risk respiratory patients Customer
Large vertically-integrated healthcare provider
Business Problem
The cost of treating respiratory patients is greatly increased by urgent care visits
Challenges
Identify urgent care risk factors and propose interventions to reduce risk of urgent care visit.
Solution • Predict risk of acute care encounter using
prescription refill history, air quality data, and socioeconomic indicators.
• Build a real-time application for alerting patients and physicians to take preventative action

25 © 2014 Pivotal Software, Inc. All rights reserved.
26 © 2014 Pivotal Software, Inc. All rights reserved.
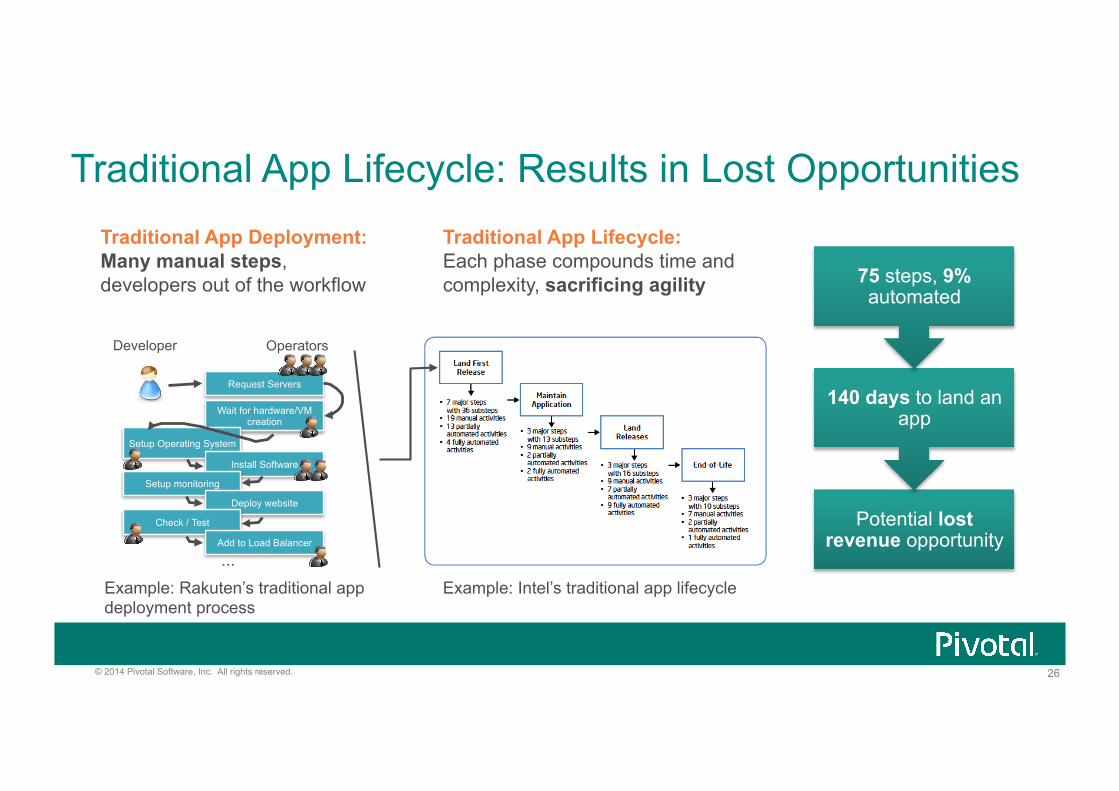
Traditional App Lifecycle: Results in Lost Opportunities
Potential lost revenue opportunity
140 days to land an app
75 steps, 9% automated
Example: Intel’s traditional app lifecycle
Traditional App Lifecycle: Each phase compounds time and complexity, sacrificing agility
Traditional App Deployment: Many manual steps, developers out of the workflow
Example: Rakuten’s traditional app deployment process
Request Servers
Wait for hardware/VM creation
Setup Operating System
Install Software
Setup monitoring
Deploy website
Check / Test
Add to Load Balancer
...
Developer Operators
27 © 2014 Pivotal Software, Inc. All rights reserved.
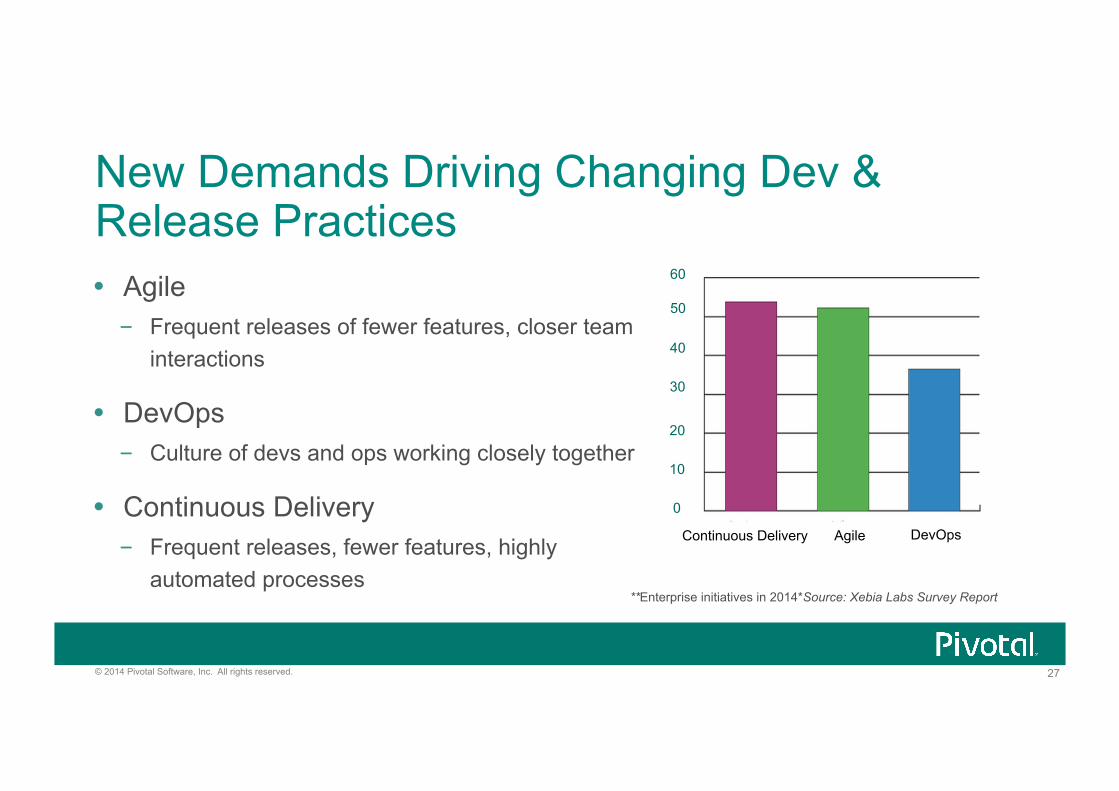
New Demands Driving Changing Dev & Release Practices Agile
– Frequent releases of fewer features, closer team interactions
DevOps – Culture of devs and ops working closely together
Continuous Delivery – Frequent releases, fewer features, highly
automated processes **Enterprise initiatives in 2014*Source: Xebia Labs Survey Report
DevOps Continuous Delivery Agile
50
40
30
20
0
10
60
28 © 2014 Pivotal Software, Inc. All rights reserved.
29 © 2014 Pivotal Software, Inc. All rights reserved.
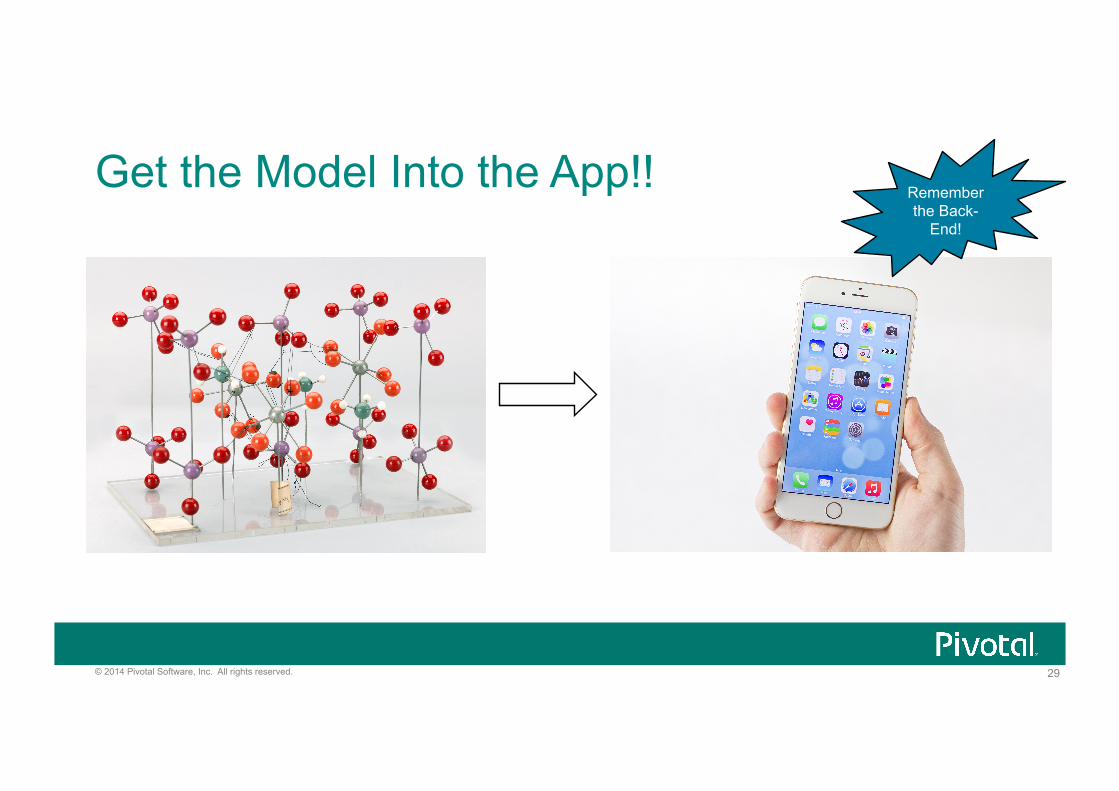
Get the Model Into the App!! Remember the Back-
End!
30 © 2014 Pivotal Software, Inc. All rights reserved.
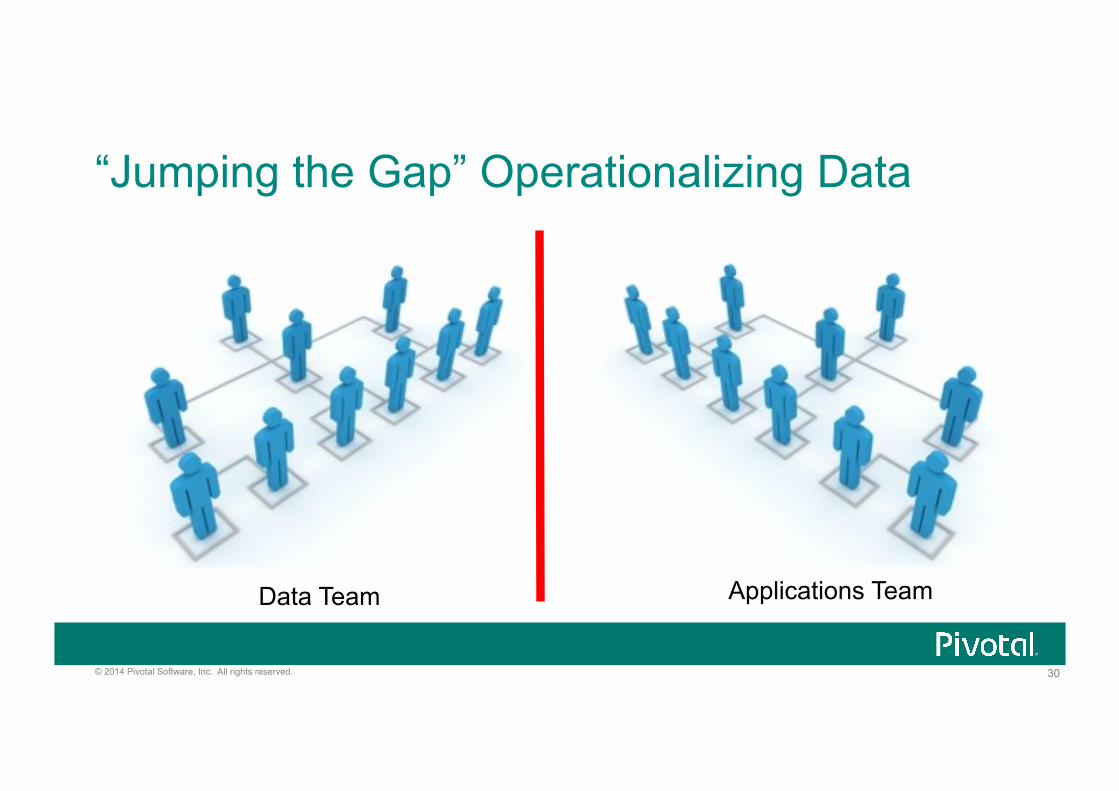
“Jumping the Gap” Operationalizing Data
Data Team Applications Team
31 © 2014 Pivotal Software, Inc. All rights reserved.
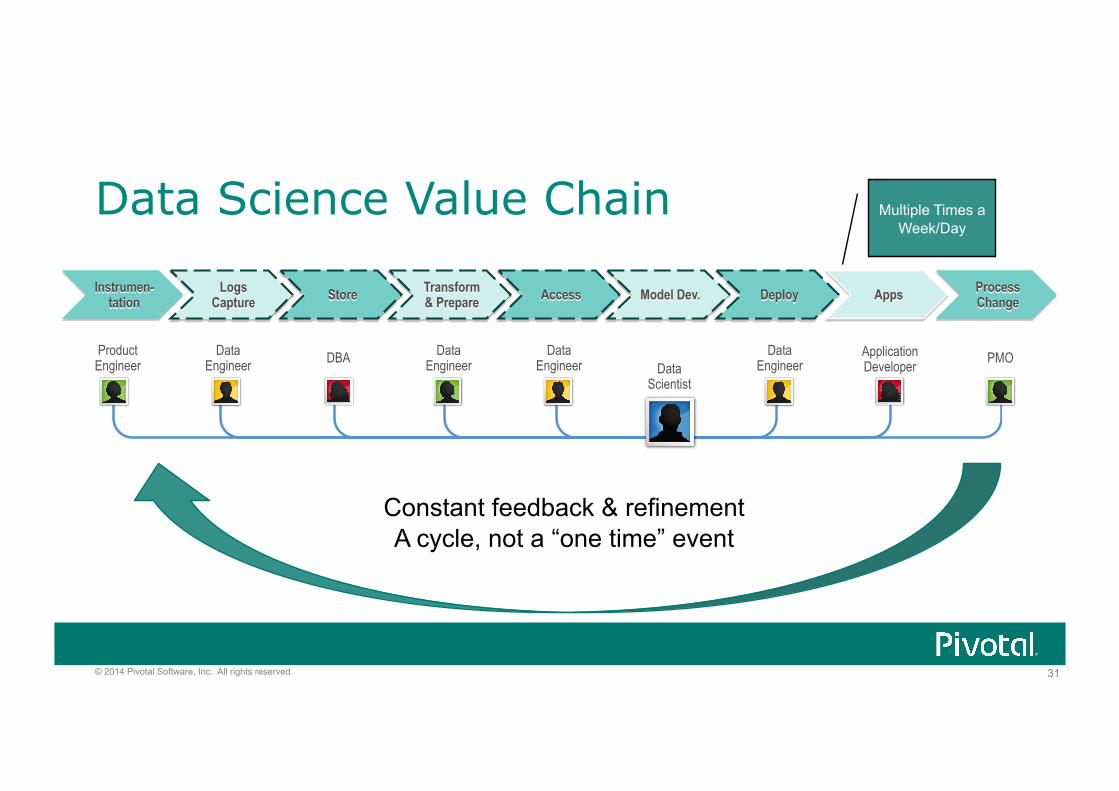
Data Science Value Chain
Product Engineer
Data Engineer DBA Data
Engineer Data
Engineer Data Scientist
Data Engineer
Application Developer PMO
Constant feedback & refinement A cycle, not a “one time” event
Multiple Times a Week/Day
32 © 2014 Pivotal Software, Inc. All rights reserved.
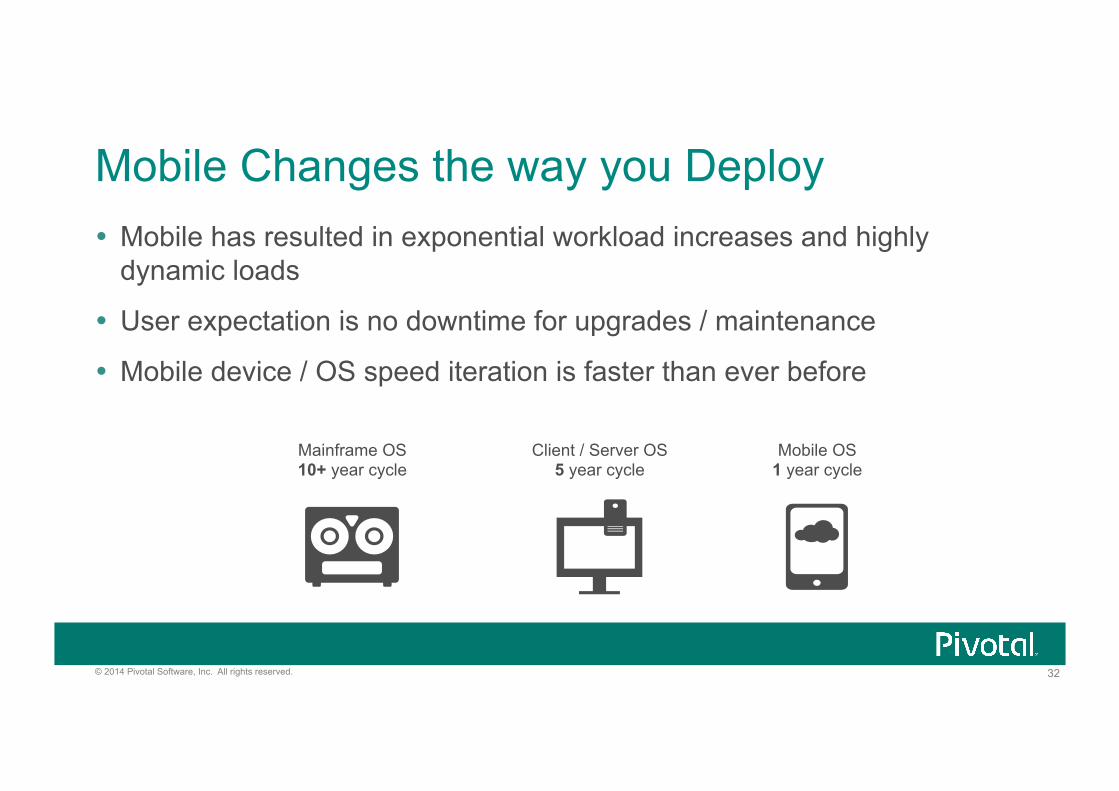
Mobile Changes the way you Deploy Mobile has resulted in exponential workload increases and highly
dynamic loads
User expectation is no downtime for upgrades / maintenance
Mobile device / OS speed iteration is faster than ever before
Client / Server OS 5 year cycle
Mainframe OS 10+ year cycle
Mobile OS 1 year cycle
33 © 2014 Pivotal Software, Inc. All rights reserved.
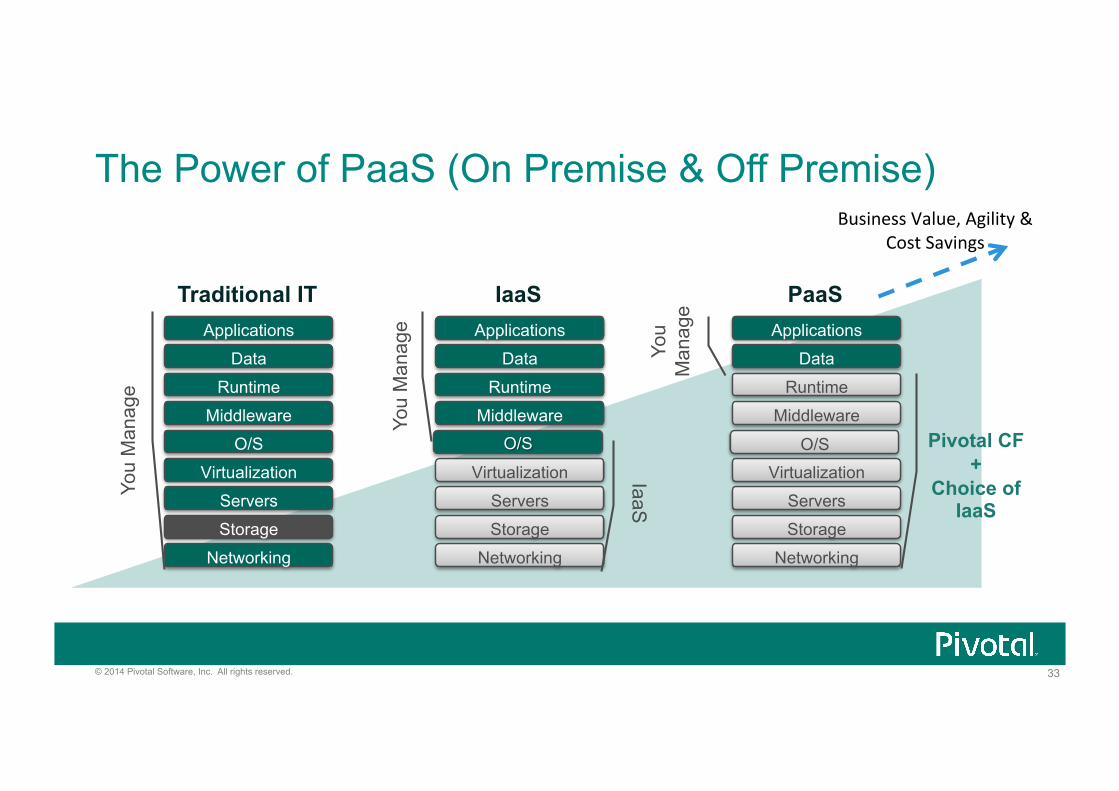
The Power of PaaS (On Premise & Off Premise)
Traditional IT
Storage
Servers
Networking
O/S
Middleware
Virtualization
Data
Applications
Runtime
You
Man
age
IaaS
Storage
Servers
Networking
Middleware
Virtualization
Data
Applications
Runtime Yo
u M
anag
e
IaaS
O/S
PaaS
Storage
Servers
Networking
Middleware
Virtualization
Data
Applications
Runtime
Pivotal CF +
Choice of IaaS
Business Value, Agility & Cost Savings
You
Man
age
34 © 2014 Pivotal Software, Inc. All rights reserved.
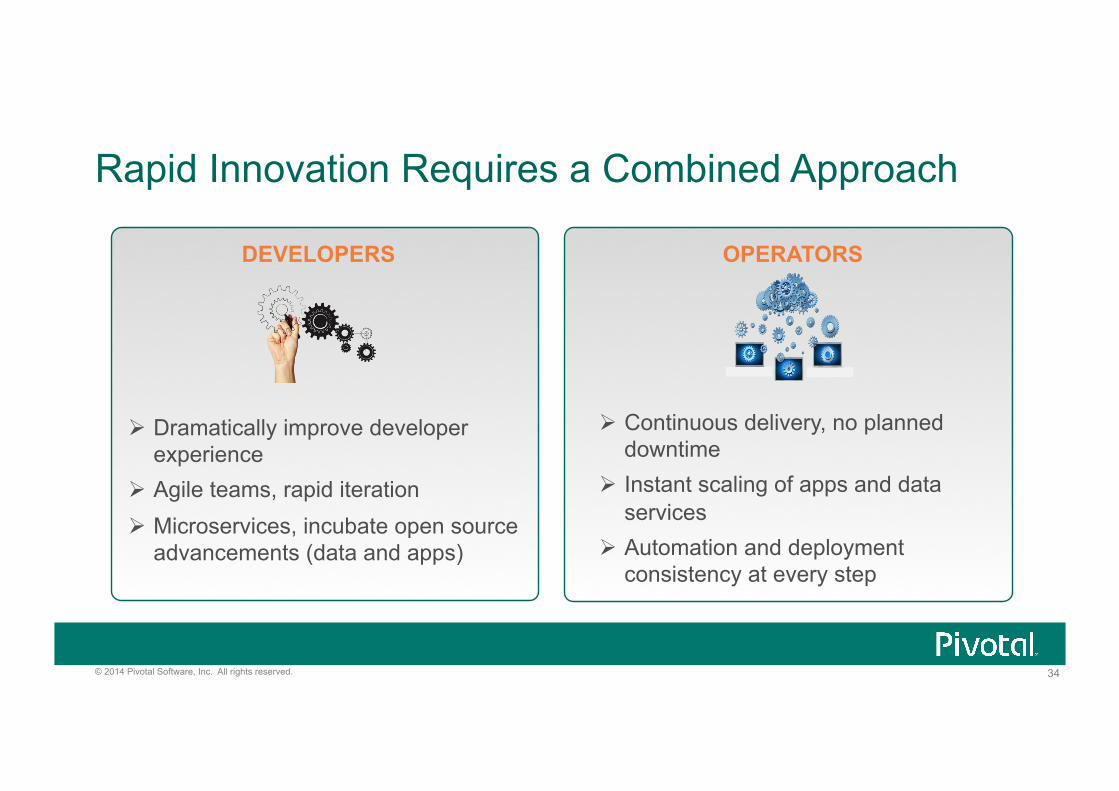
Rapid Innovation Requires a Combined Approach
Dramatically improve developer experience
Agile teams, rapid iteration Microservices, incubate open source
advancements (data and apps)
Continuous delivery, no planned downtime
Instant scaling of apps and data services
Automation and deployment consistency at every step
DEVELOPERS OPERATORS
35 © 2014 Pivotal Software, Inc. All rights reserved.
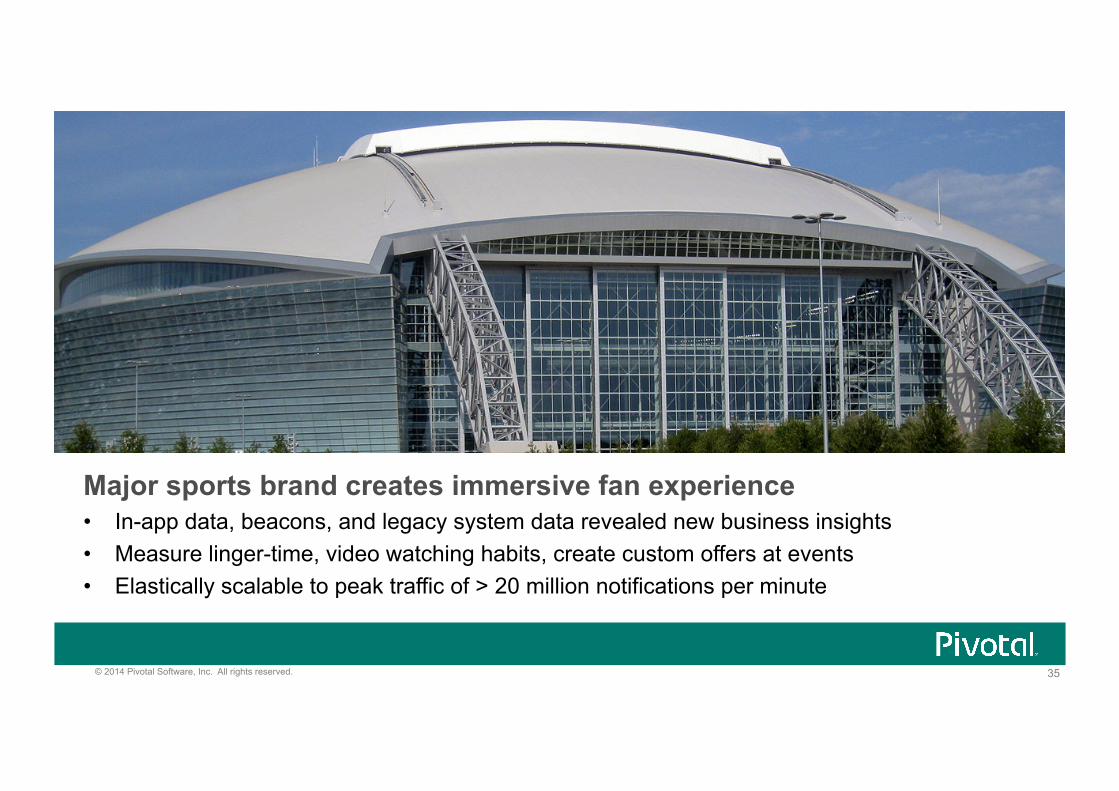
Major sports brand creates immersive fan experience • In-app data, beacons, and legacy system data revealed new business insights • Measure linger-time, video watching habits, create custom offers at events • Elastically scalable to peak traffic of > 20 million notifications per minute
36 © 2014 Pivotal Software, Inc. All rights reserved.
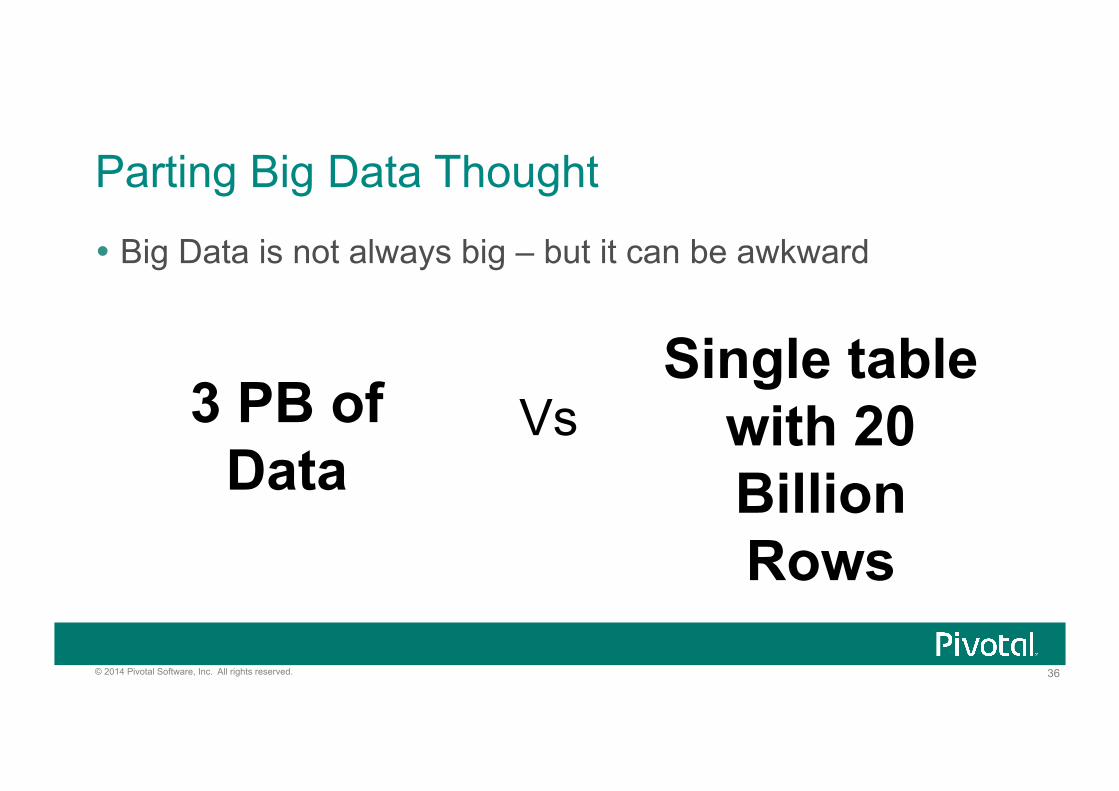
Parting Big Data Thought
Big Data is not always big – but it can be awkward
3 PB of Data
Single table with 20 Billion Rows
Vs
37 © 2014 Pivotal Software, Inc. All rights reserved.
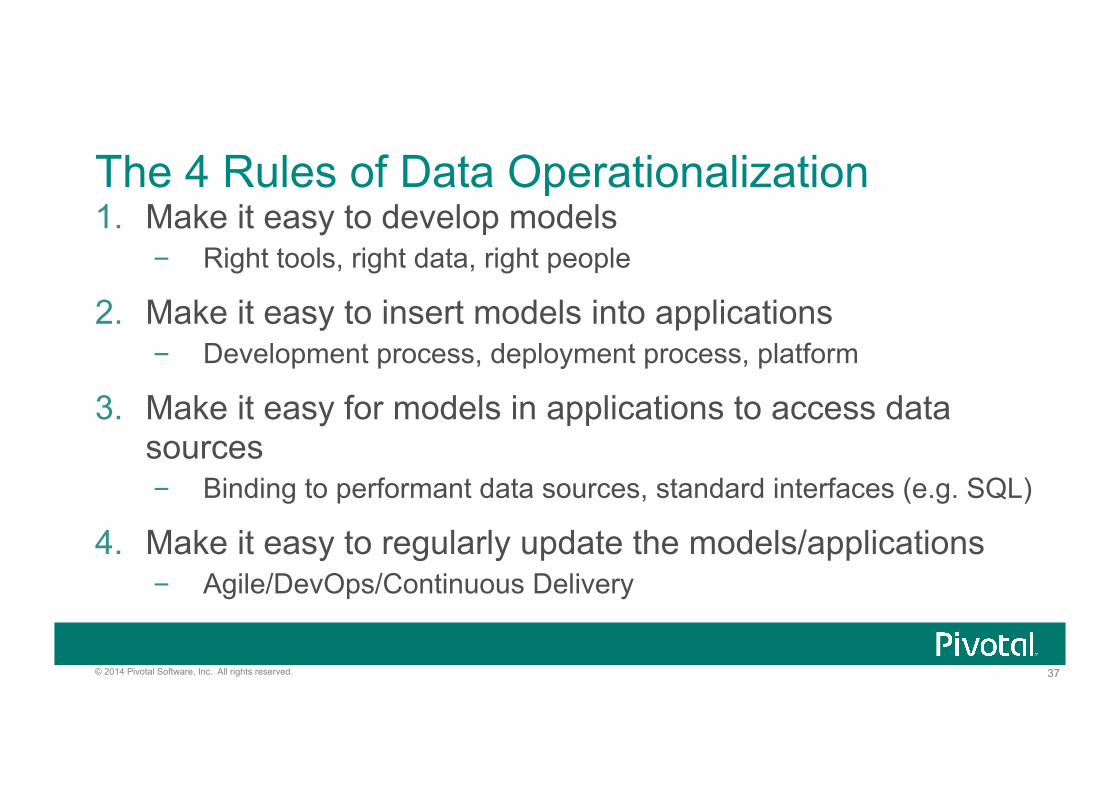
The 4 Rules of Data Operationalization 1. Make it easy to develop models
– Right tools, right data, right people
2. Make it easy to insert models into applications – Development process, deployment process, platform
3. Make it easy for models in applications to access data sources – Binding to performant data sources, standard interfaces (e.g. SQL)
4. Make it easy to regularly update the models/applications – Agile/DevOps/Continuous Delivery
