simpson 479
DESCRIPTION
Operator's Manual for Simpson Model 479 FM-TV Signal Generator. Also includes circuit schematic.TRANSCRIPT

OPERATOR’SMANUAL
MODEL 479FM-TV SIGNALGENERATOR
SIMPSON ELECTRIC COMPANY5200 W. ICinzie St., Chicago 44, Illinois, ES 9-1121
In Canadz. Bach-Simpson. Ltd., London, Ontario
' Simpson Electrk Co., Chkogo 44, IIInos
1

A. M. GENERATOR400 r, AUDIO GENERATOR
F.M. GENERATOR
CRYSTAL CALLBRATOR
FIG. 1. THE MODEL 479 TV-FM SIGNAL GENERATOR
-z
MODEL .479 + TV -FM SIGNAL GEHERATOD
Y YL
,uLjc
O‘14p
frMP
&L 7-

MODEL 479 FM-TV SIGNAL GENERATOR
The Simpson Model 479 Signal Generator has been designed carefully to supply allthe necessary signal sources for the proper alignment and servicing of TV and FMreceivers. For your convenience, markings on the FM Generator tuning dial allow youto tune it according to the frequency which you require, or according to television channel number for RF signals through both VHF and UHF ranges.
There are two separate tunable oscillator sections. Each oscillator section is provided with a large, precision vernier dial having a 20:1 knob-to-pointer ratio and a1000 division logging scale. They are easy to read and easy to set to any exact frequency within the range of the generator.
Everything possible has been done to make the Model 479 the most accurate, flexible and convenient instrument available. Each part of this instrument has been considered carefully for long life and stability. Many of the vital components are manufactured under rigid supervision within our own plants in order to insure lasting accuracy and many years of uninterrupted service.
DESCRIPTION
The Model 479 is arranged in two major sections as shown in figure 1. The lefthand section contains a crystal calibrator, a 400 cycle audio oscillator, and a three-range r-f generator which can be amplitude modulated with the output of the 400 cycleoscillator.
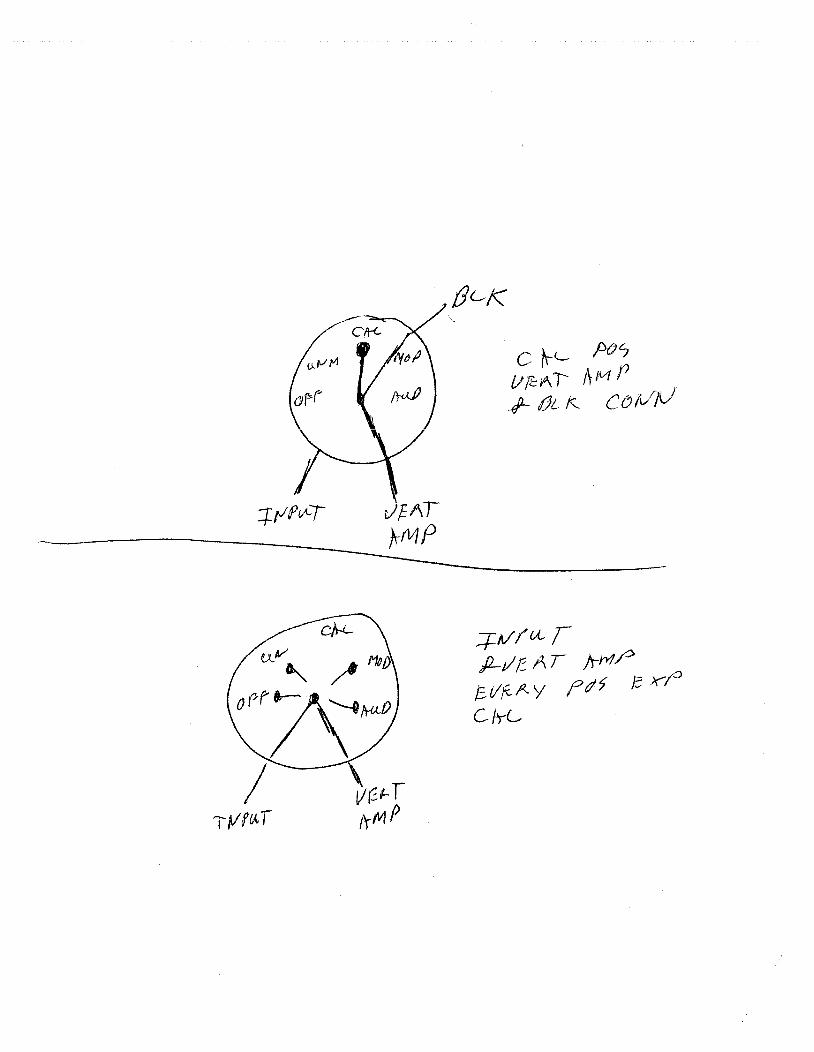
The desired type of signal is selected by the SIGNAL switch left. The SIGNALswitch has five positions, named OFF, tJNMOD. R.F., CAL., MOD. R.F., and AUDIO.When the switch is in the OFF position, the entire A.M. Generator is inoperative. When theswitch is in the UNMOD. R.F. position, anunmodulated r-f signal is available through theOUTPUT jack and cable. The amplitude is controlled with the SIGNAL ATTENUATORS,with both fine and coarse adjustments center and right. When the switch is in theCAL. position, the output of a 5.0 mc. crystal oscillator is mixed with the output of theR.F. Generator to produce a "beat" according to the information in table 1. The beatpattern can be observed on an oscilloscope connected with the VERT. AMPL. andHORIZ. AMPL. cables. By using table 1 and the oscilloscope,anyfrequency within therange of the instrument can be produced quickly and precisely. When the switch is inthe MOD. R. F. position, the r-f signal is amplitude modulated 30% with a 400 cycleaudio frequency and the modulated signal is available through the OUTPUT jack andcable. The amplitude is controlled by the SIGNAL ATTENUATORS. When the switchis in the AUDIO position, a 400 cycle signal is available through the OUTPUT jack andcable. The amplitude is controlled by the SIGNAL ATTENUATORS.
A potentiometer and a five-position switch together comprise the SIGNAL ATTENUATORS. The switch, at the right, is the coarse amplitude selector for the output ofthe a-rn generator, and the potentiometer acts as a fine adjustment on amplitude.
The A.M. GENERATOR RANGE switch, located just below the center of the dial,selects each of the three bands of radio frequencies. The tuning knob varies the frequency throughout each band.
Band A. Fundamental 3.3 to 7.8 mc.Second harmonic 6.6 to 15.6 mc.
Band B. Fundamental 15 to 38 mc.Second harmonic 30 to 76 mc.
Band C. Fundamental 75 to 125 mc.Second harmonic 150 to 250 mc.
-3-

The POWER switch lower enter controls the power input to both sections of theModel 479. When the switch is in the OFF position the entire instrument is turned off.In the STAND BY position, all the tube filaments are turned on but no plate voltage isapplied. In the OPERATE position, plate voltage is applied. The green light is on forboth STAND BY and OPERATE positions of the switch, and the red light is on for theOPERATE position only.
In the center of the Model 479 there are three jacks which are labelled, from topto bottom, HORIZ. AMPL., VERT. AMPL., and SIGNAL INPUT. A cable from theHORIZ. AMPL. jack should be connected to the horizontal input terminal with the redinsulated clip and ground with the black insulated clip of the oscilloscope used in conjunction with the Model 479. Set the function switch of the oscilloscope to utilize thissignal for the horizontal sweep. The switch position will usually be named "horizontalamplifier or "horizontal input" on the oscilloscope. This connection is important because it offers the operator his most convenient source of 60 cycle sine wave sweepvoltage which may be phase adjusted relative to the f-rn sweep voltage with the PHASINGcontrol on the Model 479. There is more information on this in the discussion of thePHASING control. A cable from the VERT. AMPL. is used to connect the source of theresponse pattern to the vertical input terminal with the red insulated clip and groundwith the black insulated clip of the oscilloscope. A cable from the SIGNAL INPUTjack is used to connect the signal output of the amplifier under test back into the Model479. This signal will be fed through the SIGNAL switchto the VERT.AMPL. jack whenthe switch is in the OFF, UNMOD. R.F., MOD. R.F., or AUDIO position.
The right hand section of the Model 479 contains a frequency modulated signal gen-erator,a 140 rnc.fixedfrequencyoscillator,a mixer, and phasing and blanking circuits.The output of the f-rn signal generator is connected through an attenuator to the OUTPUTjack. The OUTPUT jack serves both the a-mandthe f-rn signal generators so that onlyone connection need be made to the input of the receiver.
The F.M. GENERATOR RANGE switch below the center of the dial has three positions. In the OFF position, the f-rn generator section of the Model 479 is inoperative.In the A position, both the 140 mc. fixed frequency oscillator and the tunable f-rn oscillator are operating; one output frequency from the mixer is the difference between thesetwo frequencies. The fundamental range of the beat frequencies is.2 to 120 mc. Thelocations for RF signals for television channels 2 through 6 are marked in areas below the corresponding frequencies. In the B position, the switch turns off the 140 mc.fixed frequency oscillator, and the output from the variable frequency oscillator isavailable at the output. The fundamental range of the B band is 140 to 260 mc, Thelocations for RF signals for channels 7 through 13, which use fundamentals of the Bband, are marked in areas below the corresponding frequencies. The locations of Bband frequencies which will have harmonics required for RF signals for channels 14through 83 are marked ingroups above theB band. Channels 14 through 21 use second.jiarmonics,22 through65use third harmonics, and66 through83 use fourth harmonics.The tuning knob in the dial serves to select any frequency within the range indicated onthe arcs of the CENTER FREQUENCY dial.
The F. M. ATTENUATORS are two controls which act as coarse and fine adjustment. A 5-position switch provides coarse control on attenuation and a continuouslyvariable potentiometer provides the fine control.
The F.M. SWEEP control regulates the amount of frequency variation due tomodulation. The center frequency of the fundamental can be swept through a bandwidth of zero to 15 megacycles. Harmonics can be swept through multiples of thisband width, corresponding to the harmonic order. The rate at which center frequencies are swept through any selected range and back is the modulation frequency of 60cycles.

The PHASING control is a phase adjuster on the 60 cycle sine wave signal furnishedto the HORIZ. AMPL. jack. It is to be used to adjust the phase relations between theoscilloscope sweep and the 60 cycle sweep modulationon the carrier. With the PHASINGcontrolitis possible to superimposethe response pattern on the forward trace over thepattern on the return trace.
The BLANKING control has a potentiometer and a switch on the same shaft. Theswitch is actuated at the full counter-clockwise knob position. When the knob is in theOFF position, no blanking occurs and the F.M. Generator oscillates continuously, Whenthe knob is rotated towardits numbered range,the switch actuates and applies a 60 cyclevoltage to the f-rn oscillator grid to block out oscillations during its negative half cycles.Turning the BLANKING control through its numbered range changes the phasing of theblocking voltage with respect to the horizontal sweep to the oscilloscope. Thus eitherthe forward or the return trace can coincide with the period of oscillation and the alternate trace can coincide with the time during which the oscillator is turned off. On theoscilloscope, the operator will see a single response curve with a base line through it.
Four cables are furnished for connecting the Model 479 to a receiver and to an oscilloscope. One cable fits in the OUTPUT jack and has a termination box at the otherend which may be adapted quickly to the receiver input impedance with an optional 2000rnmf capacitor in series for use on circuits having a d-c component. Most receiverinputs can be matched without using any external resistors or capacitors. See table 2and figure 14. The other three cables are identical and are to be used in the HORIZ.AMPL., VERT. AMPL., AND SIGNAL INPUT jacks. A pair of clips at the other end ofeach cable are to be used for receiver output and oscilloscope connections. The redinsulated clips connect the "hot leads and the black insulated clips are for ground connections.
During normal alignment procedure, the signal is sent out of the OUTPUT jack, tothe receiveir under test, returned to the Model 47.9 through the SIGNAL INPUT jack,through the SIGNAL switch many position except CAL., and out the VERT. AMPL. jackto the oscilloscope. This arrangementwas designed to simplifythe alignment operationbyinternalswitchingof the oscilloscope input. Whenthe SIGNAL SWITCH is in the CAL.position, the signal fed to the VERT. AMPL. jack is the audio beat frequency producedby the a-m generator and the crystal calibrator near any of the calibration points listed4’r, +h1’
CALIBRATION PROCEDURE FOR DETERMINING TUNABLE FREQUENCIESWITH CRYSTAL ACCURACY
The Model 479 has two precision vernier dials; one is used for the a-rn generatorand the other for the f-rn generator. The a-mgenerator can be used as a marker generator for both FM and TV alignment. It needs to be extremely accurate to adjust FMand TV receivers properly. The basic accuracy is better than 1% output frequencyagainst dial indications, but it needs to be even more accurate for alignment. For thisreason, the Model 479 is provided with a crystal oscillator standard having an accuracyof .05% or better, It is by use of this standard and the logging scale of the a-rn generator that frequencies with crystal accuracy may be established at any point in therange of the a-rn generator.
To prepare the Model 479 for calibration, turn the POWER switch to OPERATE;SIGNAL switch to CAL.; SIGNAL ATTENUATORS to a low setting; and the A.M. GENERATOR RANGE switch to A, B, or C depending on the frequency to be established.Connect the VERT. AMPL. cable to the vertical input of the oscilloscope. Connect theHORIZ. AMPL. cable to the horizontal input of the oscilloscope if a60 cycle sine wavesweep is desired calibration beats can be observed with either a 60 cycle sweep orlinear sweep in the osci]oscope. With horizontal deflection on the oscilloscope due to
-5-

either the internal sweep or the 60 cycle sine wave sweep, advance the vertical arnplifier gain of the oscilloscope and slowly rotate the a-rn generator tuning knob whileobserving the oscilloscope screen. At various tuning points a pattern will appear onthe oscilloscope screen. Rotate the dial slowly through the area in which a pattern canbe seen. First a high frequency appears, then as the knob is rotated slowly, note thatthe frequency reduces to zero,thenincreasesto a high frequencyagain and disappears.The patterns are the results of beat frequencies developed between the a-rn oscillatorand the 5.0 mc crystal oscillator.
The point at which the pattern reduces to zero frequency is known as zero beat andis the point at which the two oscillators are in step. The zero beat point is identifiedeasily by the fact that the slightest movement of the dial in either direction will causethe pattern to increase in height and in frequency. At zero beat the pattern is, essentially, a straight line. At the higher frequencies it is sometimes difficult to bring thepattern down to exact zero beat, but this is not important so long as it is brought downto within two or three hundred cycles. This shows three to five cycles on a 60 cyclesweep.
Note that some points on the dial will produce much larger patterns than others.This is due to the order of harmonics of the two oscillators producing the beat pattern.The lowei harmonics result in a stronger beat pattern. Some of the weaker patternsmay require a higher setting of the vertical gain control of the oscilloscope.
TabLe 1 has been developed to assist the operator in identifying the frequencieswhere beat patterns occur and the oscillator harmonics which produce them. Thefrequencies preceded by an asterisk 4 will produce the stronger patterns and shouldbe used wherever possible.
FIG. 2. THE MODEL 479 AM-FM LOGGING DIAL
Figure 2 is an illustration of the logging arcs as they are used in both a-rn andf-rn generator dials. The upper arc of each dial is divided into 10 equal divisionsmarked from 0 to 100. On the knob shaft is another dial marked in 100 equal divisions.The gear. ratio between the knob shaft and the pointer is such that one revolution of theknob shaft moves the pointer through one of its ten divisions. Thus each division of thelogging scale is effectively divided into 100 parts and the entire arc into 1000 parts.The minor divisions may be divided visually for further increasing the number of loggingpoints and the resulting accuracy of calibration information. For example, the readingon the logging scale in figure 2 is 22.5. The main pointer shows that the setting is 20plus some additional amount, and the dial on the knob shaft shows that the additionalamount is 2.5. If the knob were turned slightly counterclockwise so the dial settingwere half way between 2.5 and 2.6, it could be read as 2.55 and the indicated settingwould be 22.55 divisions. Take advantage of the visual division of these marked pointsand effectively increase the accuracy to 2000 or more scale divisions.
-6-

TABLE I - CRYSTAL CALIBRATING POINTS
BAND A BAND B BAND C
2ND VAR. XTL. 2ND VAR. XTL. 2ND VAR. XTL.
FUNDAMENTAL HARMONIC OSC. OSC. FUNDAMENTAL HARMONIC OSC. OSC. FUNDAMENTAL HARMONIC OSC. OSC.
MEDACYCLES MEGACYCLES HARM. HARM. MEGACYCLES MEGACYCLES HARM. HARM. MEGACYCLES MEGACYCLES HARM. HARM.
*333 *7 3 2 *1500 ‘30.00 1 3 ‘70.0 ‘140 1 143.46 6.92 13 9 15.83 31.66 6 19 72.5 145 2 293.50 7.00 10 7 16.00 32.00 5 16 ‘750 ‘150 1 153.57 7.14 7 5 16.25 32.50 4 13 77.5 155 2 313.64 7.28 11 8 ‘16.67 ‘33.34 3 10 ‘80.0 ‘160 1 16*375 *7.50 4 3 17.00 34.00 5 17 82.5 165 2 333.89 7.78 9 7 ‘17.50 ‘35.00 2 7 ‘85.0 ‘170 1 17
‘4.00 ‘8.00 5 4 18.00 36.00 5 18 87.5 175 2 354.09 8.18 11 9 ‘18.33 ‘36.66 3 11 ‘90.0 ‘180 1 18
*4 17 ‘8.34 6 5 18.75 37.50 4 15 92.5 185 2 374.29 8.58 7 6 19.00 38.00 5 19 ‘95.0 ‘190 1 194.38 8.76 8 7 ‘20.00 ‘40.00 1 4 97.5 195 2 39
‘4.44 ‘8.88 9 8 21.00 42.00 5 21 ‘100.0 ‘200 1 204.50 9.00 10 9 21.25 42.50 4 17 102.5 205 2 414.55 9.10 11 10 ‘21.67 ‘43.34 3 13 ‘105.0 ‘210 1 214.58 9.17 12 11 22.00 44.00 5 22 107,5 215 2 43
‘5.00 ‘10.00 1 1 ‘22.50 ‘45.00 2 9 ‘110.0 ‘220 1 225.63 11.26 8 9 23.00 46.00 5 23 112.5 225 2 45
‘5.71 ‘11.42 7 8 ‘23,33 ‘46.66 3 14 ‘115.0 ‘230 1 235.83 11.66 6 7 23.75 47.50 4 19 117.5 235 2 476.00 12.00 5 6 24.00 48.00 5 24 ‘120.0 ‘240 1 24
‘6.25 ‘12.50 4 S ‘25.00 ‘50.00 1 5 122.5 245 2 496.43 12.86 7 9 26.25 52.50 4 21 ‘125.0 ‘250 1 25‘6.67 ‘13.34 3 4 26.67 53.34 3 166.87 13.74 8 11 ‘27.50 ‘55.00 2 11‘7.00 ‘14.00 5 7 28.33 56.66 3 177.14 14.28 7 10 28.75 57.50 4 237.22 14.44 9 13 ‘30.00 ‘60.00 1 6
‘7.50 ‘15.00 2 3 31.67 63.34 3 197.72 15.44 11 17 ‘32.50
33.33‘35.0036.67
‘37.50
‘65.0066.66‘70.0073.34
‘75.00
23132
13207
2215
ASTEHISK ‘ INDICATES ThE SThONGEB CALIBRATION POINTS.

DETERMINING AN EXACT FREQUENCY
There are two methods by which a given frequency setting may be obtained. Theyare somewhat similar but one is simpler while the other yields more accurate resuits.
The first method is the simpler and, with practice, can produce acceptable resultsfor most purposes. The process consists of first determining the number of loggingscale divisions which correspond to a one megacycle frequency difference which in-cludes, the desired frequency; second, mathematically figuring the number of loggingscale divisions the desired frequency is away from a crystal check point see table 1;third, turning to the crystal point and observing its logging scale reading; and fourth,adding or subtracting the determined number of scale divisions to or from the readingat the crystal check point. When the logging scale is set to the reading obtained in thefourth step, the oscillator will be tuned to the desired frequency.
A step-by-step example of the first method follows. Assume that a frequency of20.75 mc. is desired in the A.M. Generator. Note that table 1 shows a strong calibration check point at 20 mc. Set the A.M. GENERATOR RANGE switch to B, theSIGNAL switch to CAL., and the SIGNAL ATTENUATORS low to see the zero beat indications on an oscilloscope with the VERT. AMPL. and HORIZ. AMPL. cables connected. Have the POWER switch in either STAND BY or OPERATE position for at least15 minutes before beginning the calibration to allow the Model 479 to warm up, and setit in the OPERATE position to calibrate.
1. Observe the tuning arc of range Bfrom apositiondirectly in front of the pointerto avoid parallax error and set the pointer over the 20 megacycle mark on the dial..Record the logging scale reading for this setting. Ona sample unit the setting was 36.0use your readings, since there will be variation from one unit to another which does notaffect the accuracy in any way. Set the pointer exactly over the 21 megacycle mark onthe dial. Again record the logging scale reading. The sample unit read 40.45 for thissetting. Subtract the first reading from the second to obtain the number of scale divisions which correspond to one megacycle. 40.45 - 36.0 is 4.45 divisions.
2. Determine the frequency difference, in megacycles, between the desired frequency and a check point table I; then multiply this difference by the result of step iabove. In the example, the desired frequency of 20.75 mc. is .75 mc. away from thestrong calibration check point at 20 mc. The result of step 1 shows thatin this area ofthe sample unit, a change of 4.45 scale divisions corresponds to a change of one megacycle. Multiply .75 x 4.45 to get 3.33 divisions.
3. With the aid of the oscilloscope, tune the generator to its zero beat position forthe chosen calibration check point and record the logging scale setting for this position.In the example, the sample unit was tuned to 20 megacycles and the logging scale read36.2 divisions.
4. Add or subtract the, results of steps 2 and 3. Add if the check point frequency islower than the desired frequency, or subtractif the check point frequency is the higher.This sum or difference is the logging scale setting to use for the desired frequency. Inthe example, add because the check point is below 20.75 mc. 3.33 to 36.2 to obtain39.53 divisions.
Note that the logging scale readings are for a sample unit only. Do not use thesereadings. Obtain the logging scale readings for your Model 479 and use them in a similar way. Although you will be using some frequency settings repeatedly, do not relyon the stability of the instrumentover long periods of time; the components are subjectto normal deterioration and will cause slight changes of logging scale settings in time.
-8-

The second method is different from the first only in the fact that two crystal checkpoint settings are used in place of two dial markings. First, determine the number oflogging scale divisions which correspond to the frequency difference between two crystalcheck points surrounding the desired frequency; second, mathematically figure the number of logging scale divisions the desired frequency is away from one of the checkpoint frequencies; third, add or subtract the determined number of scale divisions to orfrom the reading atthe crystal check point. Add if the lower check point is the reference,or subtract if the higher check point is the reference. When the logging scale is set tothe reading obtained in the third step, the oscillator will be tuned to the desired frequency.The accuracy obtained by this method is better than 0.1%
A step-by-step example of the second method follows. Again, assume that a frequencyof 20.75 mc. is desired in the A.M. Generator. Note that the two nearest strong crystalcheck points are 20.0 and 21.67 mc. table 1. There are weak check points at 21.0 and21.25 rnc.,but these are not recommended because they are close together and difficultto identify. Set the A.M, GENERATOR RANGE switch to B, the SIGNAL switch to GAL.,and the SIGNAL ATTENUATORS low to see the zerobeatindications onan oscilloscopewith the VERT. AMPL. and HORIZ. AMPL. cables connected. Have the POWER switchin either STAND BY or OPERATE position for at least 15 minutes before beginning thecalibration to allow the Model 479 to warm up, and set it in the OPERATE position tocalibrate.
1. With the aid oftheoscilloscope,tunetheA.M. GENERATOR around the 20 megacycle point for the zero beat indication. Record the logging scale setting for the zerobeat position. On the sample unit, the reading was 36.2 divisions use the reading onyour own Model 479; this is for an example only. Retune the A.M. Generator aroundthe 21.67 mc. point for the zero beat indication. Record the logging scale setting forthis zero beat position. On the sample unit, the reading was 43.3 divisions. Subtractthe first reading fromthe second for the number of logging scale divisions between thecheck point frequencies. For the example, 43.3-36.2 is 7.1 divisions.
2. Determine the frequency difference between the desired frequency and eithercheck point frequency. In the example, the desired frequency 20.75 mc. is .75 mc.above the lower check point and is .92 mc. below the upper check point. Next find thefrequency difference between the two check points. In the example this is 1.67 megacycles. By ratio and proportion, the frequency deviations can be translated into scaledivisions for the logging scale;
F1= or P1 D2
where D1 logging scale divisions between one checkpoint and the desired frequency,
D2 logging scale divisions between tyvocheck points,
F1 frequency difference between the samecheck point see D1 above and thedesired frequency,
and F2 frequency difference between the two checkpoints.
-9-

In the example, using the .75 mc. deviation from 20 megacycles,
7.l 3.19 divisions.
3. If the lower check point was used to determine Di in step 2, add D1 to the logging scale setting for this check point; or if the higher checkpoint was used to determineDi in step 2, subtract Dl fromthe logging scale settingfor this check point. The resultwill be the logging scale setting for the desired frequency. In the example, add 3.19 to36.2 to get 39.39 divisions which is a very accurate setting to obtain 20.75 mc. on thesample unit.
Use table 3 at the back of the manual to record the settings for the various frequencies after they have been determined. This will save timewhenever the use of anyfrequency is repeated. Note that four columns apply to each frequency listed: the firstcolumn will contain the desired frequency; the second column will have the log scalesetting which has been determined for the desired frequency; the third column willhave the nearest crystal check point frequency; and the fourth column will have the logscale setting of the crystal check point. To use, after it has once been filled infor anygiven frequency, zero beat the crystal check point frequency and compare the readingof the logging scale against the listed setting of the fourth column. If the readings areidentical, tune to the logging scale setting of the desired frequency listed in the secondcolumn and you will have tuned the oscillator to the desired frequency. However, ifthere is a difference between the log scale setting for zero beat at the check point andthe listed setting in the fourth column, it indicates that the components of the oscillatorhave changed, and the logging scale settings need correction. If the log scale settingfor the crystal check point has changed up or down one, two,or three divisions, the setting for the desired frequency has changed the samenumberof divisions. in the samedirection so add or subtract the change to or from the column 2 listing to provide acorrected setting. There is enough space in both tbesecondandfourth columnsto keepa record of any changes over a long period of time. For greater accuracy, if the scalesettings change more than five divisions, recalculate the column 2 listing rather thanadd or subtract divisions.
PRINCIPLES OF VISUAL ALIGNMENT
The visual method of adjusting resonant circuits has been developed in order to eliminate the tedious procedure of point to point measurements which would otherwisebe necessary to determine the response characteristics ofa tuned circuit or a numberof tuned circuits such as used in radio and televisions receivers.
Referring to figure 3 it is obvious that a response curve can be traced by applyinga signal of fixed amplitude to the input of the circuit and measuring the output voltageas the frequency of the generator is varied. This, ofcourse,requiresnumerousrreasurements and is impractical for the purpose of circuit adjustment. The visual alignment procedure accomplishes the same result but is instantaneous. Here the generator frequency is varied above and below circuit resonance at a fixed rate.
-10-

FREQUENCY IN MEACYCLE
FIG. 3. GRAPHIC REPRESENTATION OF A RESPONSE CURVEThe vertical amplifier of an oscilloscope is connected across the output of the cir
cuit in order to indicate the instantaneous voltage appearing at various points alongthe curve and the oscilloscope sweep is synchronized with the generator frequency deviation in such a manner that the entire resonant characteristic of the circuit is registered on the oscilloscope screen.
By this method the operator can see instantly the effects of the adjustments as heproceeds with the alignment.
This type of alignment is of particular value in television receivers because of thewide band characteristics necessary for satisfactory reception.
ALIGNMENT PROCEDUREIt would be impossible to cover all of the various alignment procedures in this man
ual since each receiver manufacturer determines the sequence of adjustment best suitedto his particular product. Follow the receiver manufacturer’s service instructions whenmaking tests and adjustments on a television receiver.
The following paragraphs will explain the various steps in the alignment of a typicalreceiver andmaybeusedasa guide for adaptingtheModel479 and an associated oscilloscope to any manufacturer’s specific instruction.
The general procedure is as follows:1, Connect the Model 479 to a 110 volt 60 cycle power outlet.2. Turn the POWER switch to the OPERATE position.3. Connect the receiver to a power outlet and turn it on. Adjust the contrast
control to approximately 3/4 of maximum. Some receivers require a battery bias tosimulate normal AGG.
4. Allow the receiver and the Model 479 to warm up for about 15 minutes before attempting to make any adjustments. The Model 479 will not require additionalwarm up time if the POWER switch has been left in the STAND BY position.
-11-

5. Connect the HORIZ. AMPL. cable to the horizontal input terminals of theoscilloscope, and the VERT. AMPLJ. cable to the vertical amplifier input.
6. Set the oscilloscope switches and controls as follows: vertical sensitivityhigh, vertical gain at 0, horizontal gain as required to obtain a convenient horizontaldeflection on the cathode ray tube, and function switch to the position which will connectthe horizontal input through the horizontal amplifier.
7. Advance the oscilloscope intensity control and focus control until a thinbright horizontal line is seen on the cathode ray tube. Center the trace horizontally andvertically.
8. On the Model 479, set the controls as follows:
F.M. GENERATOR RANGE switchatOFF: A.M. GENERATOR RANGE switch to B;SIGNAL switch to GAL., and SIGNAL ATTENUATORS low.
9. Advance the oscilloscope vertical gain control to about mid rotation and readjust as desired during the following steps.
10. Refer to the receiver manufacturer’s literature for the frequencies which willbe required during the adjustment. Determine the logging scale settings to tune thesefrequencies; use the instructions givenunder CALIBRATION PROCEDURE in this manual. The frequencies specified for this example of a typical circuit are; 19.75, 21.25,21.8, 22,3, 23.4, 25.2, 25.3, and 27.25 mc, Seefigure4. Anewtendencyamong receivermanufacturers is to use an intermediate frequency centered around 45 mc.
ll. Set the OUTPUT cable termination for 75 ohms by jumpering terminals 6-7-8-9-5 and terminals 2-3-4. Open termination may be preferred. See table 2 forinstructions. Connect the alligator clip on the end of the probe to point "F " of figure4. Connect the ground lead of the probe to the receiver chassis. Note that thealligator clip and ground lead may provide too much inductance for use at 45 mc See thespecial instructions on page 24. Connect the SIGNAL INPUT cable to point A "of figure 4.
fcowvrgAUDIOI ‘ -
DT
12. Rotate the SIGNAL switch to MOD. R.F. and adjust the SIGNAL ATTENUATORS and the oscilloscope vertical gain control until a good size Lissajou pattern isseen on the oscilloscope. The SIGNAL ATTENUATORS should be operated at the lowestsetting which will give a good oscilloscope pattern.
13. SettheA. M. GENERATOR logging scale to the point recorded for 19.75 megacycles and adjust L7 point "1 "of figure 4 for minimum patternheight. If the patterndisappears completely, increase the attenuator setting until the exact minimum point canbe observed.
14. Set the logging scale at the point recorded for 21.25 mc. and adjust the sound
FIGURE. 4. TYPICAL TV VIDEO IF SYSTEM
-12-

takeoff trap L3 point 2 for a minimum indication.
15. Leave the Model 479 set at 21.25 mc. and adjust the accompanying soundtrap L9 point 3 for a minimum indication.
16. Set the logging scale to the point recordedfor 27.25 mc. and adjust the adjacent channel sound trap L5 point 4 for a minimum indication. This completes thetrap adjustments.
17. Set the logging scale at the point recorded for 21.8 mc. and adjust the converter output LZ point 5 for a MAXIMUM indication. If the pattern becomes too large,reduce the SIGNAL ATTENUATORS.
18. Set the logging scale to the point recorded for 25.3 mc. and adjust the firstIF L4 point 6 for maximum.
19. Set the logging scale to the point recorded for 22.3 mc. and aojust thesecond IF L6 point 7 for maximum.
20. Set the logging scale to the point recorded for 25.2 mc. and adjust the thirdIF L8 point 8 for maximum.
21. Set the logging scale to the point recorded for 23.4 mc. and adjust the thirdIF Lii point 9 for maximum.
22. If coils L2, L4, and L6 have required appreciable adjustment, the associatedtraps, L3, L5, and L7 should be rechecked as explained in steps 13, 14, and 16.
23. Occasionally a receiver will have a tendency to oscillate during alignment.Usually this is caused bytwo or more transformers being tuned to the same frequency.Such oscillationwill be identified by.a suddenhigh deflectiononthe CRT and a scrambledpatternwhich cannot be controlled bythe attenuators. When this occurs, the best remedyis to shunt points C, D, E, and F with .001 mfd capacitors. Connect the Model 479OUTPUT cable to point B and adjust Lii. Remove the capacitor at point C and connectthe OUTPUT CABLE to this point and adjust L8. Repeat this process for each stageback to point F, removing the capacitor and connecting the OUTPUT cable to points D,E, and F. Adjust L6, L4, and L2 for maximum indications. Some manufacturers recommend the latter, or backwards, sequence of adjustment. It makes little differencewhich sequence is used as long as each stage is adjusted carefully to its assigned frequency. This completes the i-f adjustments.
24. Leave the OUTPUT cable of the Model 479 connected to the converter gridpoint F and the SIGNAL INPUT cable connected across the video detector load resistor point A.
25. Set the SIGNAL switch to the OFF position. Set the F.M. GENERATORRANGE switch to A, F. M. ATTENUATOR switch to MAX. and potentiometer to 5,PHASING to 0, and BLANKING to OFF. Tune the F.M. GENERATOR to approximately23 mc. on range A. A response curve of the i-f systemwill appear on the oscilloscope.Adjust the F.M. Attenuators and the oscilloscope vertical gain for a pattern of cpnvenient height, keeping the F. M. ATTENUATORS set as low as possible. Adjust thePHASING control to superimpose the two traces. Readjustthe tuning dial until the pattern is centered in the horizontal trace. Readjust the F.M. SWEEP control until thepatternincludesabouttwo-thirds of the horizontal trace. Correct the control for superimposed traces again. Rotate the BLANKING control to produce a base line through asingle trace.
-13-

25,7 a5.75
FIG. 5. PICTURE IF RESPONSE - STAGGER TUNED
26. Compare the pattern with the one shown in the manufacturer’s instructions. Figure 5 shows an example of an i-f response curve. If the system has beenaligned properly, it should resemble figure 5A.
27. Turn the SIGNAL switch to UNMOD. R.F. and set the logging scale of theA.M. Generator to the, point for 22.3 mc. A marker should appear on the pattern asshown at the left in figure 5 A, B, and C. Adjust the SIGNAL ATTENUATORS and theF.M. ATTENUATORS for the desired balance of signal strengths. If the marker signal is too strong, the curve will be distorted and it will be difficult to measure its exactposition on the pattern.
28. Set the logging scale to the point recorded for 25.75 mc. and check the position of the marker. It should appear at 50% of the maximum pattern height. Settingthe marker frequency to the various points to which the system was adjusted will indicate the part of’ the response curve affected by each adjustment. Slight re-adjustment of the systemmay be performed at these points inorderto produce a satisfactoryresponse curve. However, if considerable adjustment is necessary, the entire alignment procedure should be repeated.
The foregoing paragraphs have dealt with the alignment of a stagger tuned video i-fsystem. Another system, known as Band Pass IF and used in many receivers, requiresthat the entire alignment be performed by use of the F.M. Generator. In this type ofreceiver, alignment begins with the last i-f stage and proceeds stage by stage back tothe converter. A set of curves is furnished as a guide and it is only necessary to followthe sequence set up by the manufacturer’s instructions, using his curves to indicatethe type ofresponse to be expected. A set of sample curves appears in figure 6.
To adjust band pass i-f, connectthe SIGNAL INPUT cable to the video detector output and the OUTPUT cable to the grid of the last i-f amplifier. Set the F.M. GENERATOR RANGE switch to A and adjust the dial to 25 mc. Set the F.M. ATTENUATORSto MAX. and 10, and adjust PHASING and BLANKING controls and the associated oscilloscope for a single image pattern with satisfactory ,height. Set the A.M. GENERATOR RANGE switch to B and the SIGNAL switch to CAL. Record logging scale readings for the recommended frequencies. In the example, these are 22.6, 22.75, 23.25,23.75, 24.25, ‘24.6, 25.75, 26.6, 26.75, 27.0, and 27.1 megâcycles. Set the SIGNALswitchtoUNMOD, R.F. andthe logging scale tothepoint recorded for 27.1 rnegacycles.Adjust the SIGNAL ATTENUATORS to the lowest setting which will give a satisfactorymarker on the trace. Adjust the last i-f transformer primary and secondary for a singlepeak centered on the 27.1 mc. marker. Setthe A.M. Generatorloggingscaletotheposition for 23.25 mc. Adjustthe coupling condenser in the last i-f transformer for a peakcentered at 2325 mc. The curve should now resemble figure 6A.
AftPRO?ERLY PLtGt4ED MPROPERL’ ALIGNED
-14-

80
60
40
20
0
FIG. 6 VIDEO ALIGNMENT CURVES - BAND PASS TYPE
Move the OUTPUT cable to the grid of the preceding stage. Adjust the secondaryof this i-f transformer fora peak at 23.75 mc. and the primary for a peak at 26.75 mc.There is no coupling condenser adjustment for this stage. The response curve shouldnow resemble figure 6B.
Move the OUTPUT cable to the next preceding stage. Adjust the primary and secondary of the i-f transformer for a curve having the same shape and relative amplitudeas that of figure 6G. Use the marker at the frequencies indicated: 22.75, 24.25, 25.75,and 27.0 mc.
Move the OUTPUT cable to the grid of the converter. Adjust the primary, secondary,and coupling condenser of the first i-f transformer for a curve having the same shapeand relative amplitude as figure 6D. The check points indicated for marker use are22.6, 23.75, 24.6, and 26.6 megacycles.
Touch up adjustments are permissable to improve the over-all response curve. Becareful to select the adjustment which affects the partof the curve which needs correction. Figure 7 shows the acceptable limits of the over-all response curve with theamplitude at 24.0 mc. for a reference point. Conduct the alignment to produce a curvewhich is within these tolerances.
The last five paragraphs have outlined a typical process for band pass i-f alignment only. For trap adjustments, see steps 10 to 16 on page 12. The trapadjustmentsshould be made in the order recommended by the receiver manufacturer, with the F.M.GENERATOR RANGE switch in the OFF position and the SIGNAL switch in the MOD.R.F. position. Log the specified trap frequencies in advance.
oc -+ ,U
,O
+
* -
40
20
0
fITTE
2 23 24 25 26 27
A
Tr:J
LUJz0
ULUt:tLU>
Ft
26
EL I i I I
234 25 26 27 28
22 23 24 25 26 27 28
2’342526I
FREQUENCY MC D
-15-

*1r 1f
ikUF1Uft02 24 25 25$ 27
PICIURE i-F T0LRANCE
FIGURE 7. RESPONSE TOLERANCE - BAND PASS I-FA third type of circuit uses what is known as intercarrier i-f. The principle is
to provide a mixer and oscillator to produce an intermediate frequency, and to amplify this i-f through several stages with a special frequency response characteristic; theband pass is sufficient to include both the sound and the video center frequencies, andthe response maintains a desired relative amplitude between the two center frequencies.Then the beat of 4.5 megacycles between the two center frequencies is used to producea double superheterodyne action with the sound frequency modulated on the 4.5 mc.carrier. The sound i-f isuaiiy one stage, tuned to 4.5 mc., aLnpiifies the sound signal and sends it to an f-rn demodulator of any type desired by the manufacturer. It isimportant to follow the alignment data indicated in the manufacturer’s literature because he has engineered a circuit which requires specific response characteristics1and no generalization could represent the large variety of possibilities. The receivermanufacturer’s literature will indicate where the test points are located, what frequency to use for each input, what adjustment can be made, and the resulting responsewave shape. Set up the Model 479 in accordance with general instructions and use anoscilloscope to observe the results. Use the 6O sweep available through the HORIZ.AMPL. cable to observe the response curve in phase with the frequency modulating signal.
Sometimes during alignment it is desirable to have two markers at different frequencies on the response curve at the same time. A second signal generator, unmod-ulated, is necessary, tunable to the frequency at which the marker is desired. Thesecond generator can be calibrated with the accuracyof the Model 479 and should be asstable as possible. To calibrate the second generator, set up the Model 479 for itsnormal alignmentprocedure, withthe OUTPUTfeedinginto a receiver and the receiveroutput connected to the SIGNAL INPUT cable. Connect the VERT. AMPL. and HORIZ.AMPL. cables to the input terminals of the associated oscilloscope. Establish themarker on the response curve at the frequency to which the second generator will betuned. Then couple the second signal generator outputacross the termination box or inany other convenient way to the receiver input. Sometimes the mere presence of thesecond generator on the test bench will provide sufficient coupling without any directconnections. Now tune the second signal generator for a beat indication with the markerfrom the accurately calibrated A.M. Generator in the Model 479. Tune the second generator for a zero beat indication of the two markers. Then change the setting of theModel 479 A.M. Generator to provide the second marker frequency. Both markers willshow on the single response curve.
F-M RECEIVER ALIGNMENT
The order of f-rn alignment usually begins with the discriminator adjustment; thei-f section is next and the r-f section is last. If the receiver manufacturer recommendssome other sequence, use his suggestions rather than these general instructions. The
-16-

informationin the followingparagraphsisforthe sound section of a television receiver,but the same principles apply to f-rn receivers except that their intermediate frequenciesare usually_lower,
Figure 8 is the schematic diagramofa typical sound i-f system composed of threei-f amplifier stages andadiscriminator. Thethird i-f stage acts asalimiter to reducethe effects of amplitude modulation. Usually the alignment will begin at the discriminator and work back, stage-by-tage, to the converter. Proceed as follows:
1. Connect the HORIZ. AMPL. cable and the VERT. AMPL. cable to the inputterminals of the associated oscilloscope.
2. Connect the Model 479 OUTPUT cable between point "C H and ground seefigure 8. Use any desired termination. See table 2 for data on the termination boxconnections. Use the series condenser do not jumper terminals 1 and 6.
3. Connect the SIGNAL INPUT cable between point "A " and ground figure 8.
4. Set the F.M. ATTENUATORS to- MAX. and 10, F.M. SWEEP to 1, PHASINGto 0, BLANKING to OFF, F.M. GENERATOR RANGE to B, and CENTER FREQUENCYdial pointer to 21.25 mc. the intermediate frequency.
5. Set the oscilloscope controls to produce a convenient horizontal trace centered on the face of the cathode ray tube. Set the oscilloscope function control so the 60cycle sine wave voltage, fed through the HORIZ. AMPL. cable, is the horizontal deflecting signal.
6. Advance the oscilloscope vertical gain until the pattern is one to two incheshigh. The pattern will be two S-shaped response curves. Adjust the PHASING controlto bring the curves in phase as shown in figure 9.
FIG. 9. DISCRIMINATOR RESPONSE - IN PHASE - BLANKING OFF
7. Adjust the F.M. SWEEP so the response curve covers most of the trace asshown in figure 9. Readjust the PHASING control if the traces separate. If the response
FIG. 8. TYPICAL TV SOUND IF SYSTEM
DISCRIMINATOR ALIGNMENT
-17-

curve is not centered on the trac-e, reset the CENTER FREQUENCY pointer to centerthe pattern. Advance the BLANKING control to produce a pattern as shown in figure10; this is a single curve with a base line through it.
4
FIG. 10. DISCRIMINATOR RESPONSE - BLANKING ADJUSTED8. Reduce the F.M. ATTENUATORS and advance the oscilloscope vertical gain
for the lowest attenuator setting which gives a satisfactory pattern.
9. Set the SIGNAL switch to CAL., A.M. GENERATOR RANGE to B, SIGNALATTENUATORS low, and adjustthe frequency to exactly 21.25 mc. see CALIBRATIONPROCEDURES on page 5 .
10. Turn the SIGNAL SWITCH to MOD. R.E. A pattern similar to figure ii willappear on the oscilloscope if the discriminator secondary is not aligned perfectly. Re-duce the SIGNAL ATTENUATORS to as low a setting as possible with the 400 cyclepattern still showing.
FIG. II. DISCRIMINATOR RESPONSE - 400 CYCLE MODULATION11. Adjust the discriminator secondary L9 in figure 8 until the 400 cycle
pattern disappears and then re-appears if the adj1stment is continued in the same direction. Be sure to make this adjustment to the exact null point with the SIGNALATTENUATORS set low to avoid a broad response due to a high signal amplitude.
12. Adjust the discriminator primary L8 in figure 8 until a maximum amplitude symmetrical pattern is achieved as shown in figure 7. Reduce the F.M. ATTENUATOR setting as the amplitude of the curve increases. Readjust the secondary if the400 cycle modulation reappears.
13. Move the OUTPUT cable to the grid of the next preceding stage point "D"in figure 8.
14. Move the SIGNAL INPUT connection to the grid of the limiter point ‘C ‘ infigure 8.
15. Turn the SIGNAL switch to UNMOD. R,F. and adjust the F.M. and SIGNALATTENTJATORSto obtainani-f response curve similar to figure 12. The curve may bedistorted until the next adjustment has been made.
-18-

-–1t tt-r-ht-+-tt
_:t -
FIG. 12. SOUND I-F RESPONSE
16. Adjust L7 and L6 of figure 8 for a symmetrical response of maximum heightsimilar to figure 12. The marker should appear at the center. Keep the F.M. ATTENUATORS set as low as possible to avoid overloading and keep the SIGNAL ATTENUATORS set low to avoid distortion of the response curve at the marker point.
17. Connect the OUTPUT cable to the grid of the next preceding stage pointin figure 8. Adjust L5 and L4 for a symmetrical response curve of maximum
height as in step 16 above.
The sound i-f adjustment is now complete. Adjustment of L2 and L3 was covered in video i-f alignment. However, if this were an f-rn receiver instead of a television receiver, L2 and L3 would be adjusted to the intermediate frequency with theOUTPUT cable coupled to the converter grid. As the alignment proceeds from the discriminator back to the converter,thewidthof the response curvewilidecrease sincetheselectivity of the entire amplifier is greater than that of any one stage. If the responsecurve becomes too small, reduce the F.M. SWEEP. Any change in sweep width will require re-adjustment of the PHASING control. Adjust the PHASING control with BLANKING at OFF.
If it is desired to check the band pass of the i-f system, connect the OUTPUT cableto the grid of the converter tube and move the marker with the A.M. Generator fromone side of the response curve to the other.
i
-
t?tLf IJiL1Ttbf LLti hUId-RJEC’
FIG. 13. I-F BAND PASS MEASUREMENT
The band pass of a resonant circuit is usually taken between the 70% response points.See figure 13. To check the band pass of the i-f system, set the A.M.Generator tuningknob to place the marker on the response curve at the 70% point on one side of thecurve. Record the frequency indicated on the A. M. Generator dial. Then move themarker to the 70% response point on the other side of the curve. Record the frequencyindicated on the A. M. Generator dial again. Then subtract the lower recorded frequencyfrom the higher for the band of frequencies passed ‘.
-19-

TELEVISION TUNER ALIGNMENT
Many of the present day television sets use an r-f tuning unit produced by StandardCoil Products Co. This unit contains a 12-position rotary channel selector togetherwith a stage of r-f amplification, an r-f oscillator, and an r-f mixer. The componentsare matched for the purpose of transferring the modulation on the tuned signal to anintermediate frequency. The various receiver manufacturers who use this tuner haveused slightly different center intermediate frequencies, and some have used separatei-f strips for sound and video, while others have used intercarrier i-f amplification.The tuner can be adjusted to produce whateveroutputthe manufacturer requiresfor hiscircuit, and manufacturer’s literature will indicate the center frequency and the waveform required for servicing his equipment.
Admiral Corporation, for an example, uses the Standard Coil Products tuner diagrammed in figure 14a in their 2lBl,21C1, and 5D2 chassis. It is adjusted to tune, inthe r-f amplifier, a double peaked curve with the center frequencies of the soundcarrier and the video carrier at the peaks and not more than 30% reduction in responseto frequencies within this 4.5 mc. range. Then the intermediate frequency output isbalanced so that after ithas passed through the i-f amplifiers, the center video carrier
FIG. 14.STANDARDC
68/c’7/68Q7P4MP
A,c RTQ cW/1I76 &ACk &eJE
‘3V 24C-260V
A CIRCUIT FOR TV-114, 214, 293
-20-

is on one slope of the curve ata 50% response point, and the center sound carrier ison the other side of the curve at a 5% response point. The same pair of wave shapesneed to be produced for each of the 12 channels. Each channel has a pair of tuned circuits with switch points which make all the necessary connections to tune both the received signal and the local oscillator for the frequencies necessaryfor the channel. Thetuning problem consists of adjusting slugs for each of the 12 bands which insure that themaximum signal strength, with proper amplitude proportions for its component frequencies, will come out of the mixer.
In general, the manufacturer will specify an input across the antenna terminals atthe center frequency of the channel, frequency modulated through a range of 10 mega-cycles or more, and marked at the video carrier frequency and the sound carrier frequency. Use the OUTPUT cable for this connection and set the termination box for thecharacteristic impedance of the antenna terminals see table 2. Connect the SIGNALINPUT cable at the r-f test point ontopof the tuner chassis between the two tubes. Thecircuit position for this testpoint shows infigure l4Aand B. Adjustther-f stage tuning.Then move the SIGNAL INPUT cable to the next specified check point probably in thei-f amplifier and adjust the oscillator tuning for the specified response curve.
TURQE $M’TCN SETTING SELECTSCOILS FOR’ ChANNEL DE$/QED
RF. TEST Poiwr
RODUCTS TUNtRS
B. CIRCUIT FOR TV-2000 SERIES
-21-
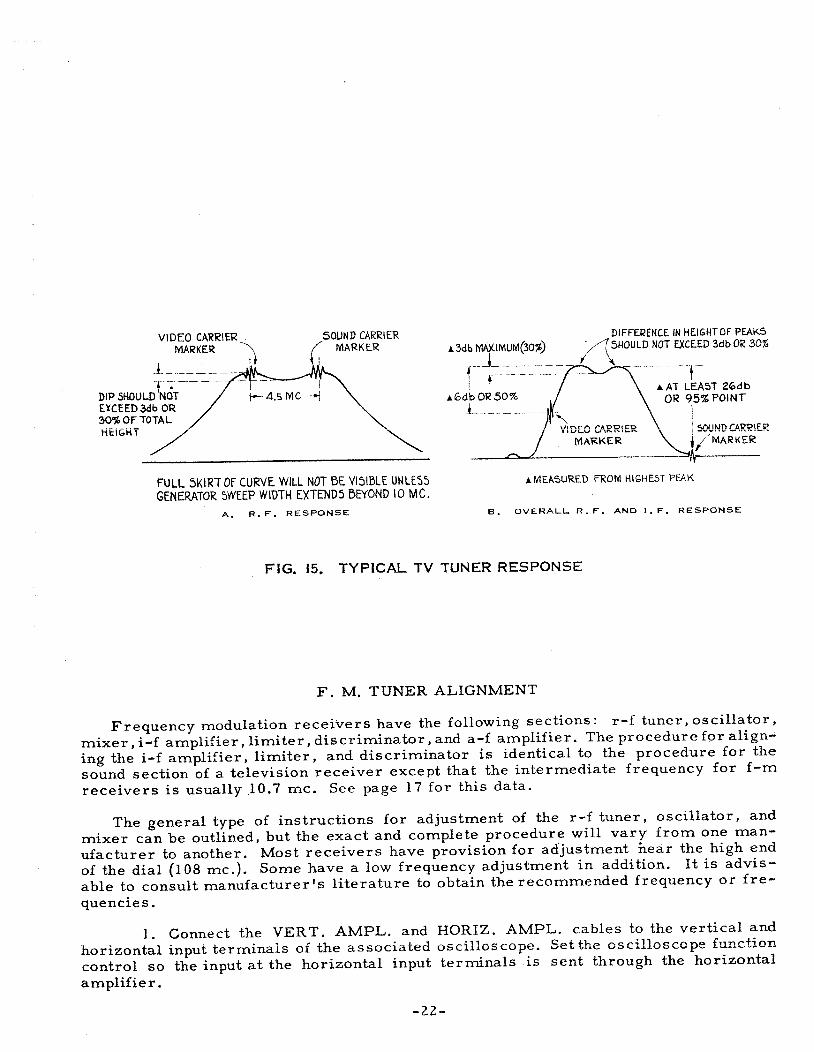
VIDEO CARRIER SOUND CAIRIERMARKER MAR
DIP 5HOULDOT
HEIGHT
EXCEED 3db OR30% OF TOTAL
FULL 5KIRT OF CURVE WILL NOT BE VIBLE UHLES5GENERATOR SWEEP WIDTH EXTEND5 BEYOND 10 MC.
A R.F. RESPONSE
DIFFERENCE IN HEIGHT OF PEAKSa 3db MUMUM3O% /H0ULD NOT EXCEED 3db OR 30%
:EORRtER
ATA5T 26dbPOINTAGdbO
MARKER MAR K ER
A MEASURED FROM HIGHE3T PEAK
B. OVERALL R.F. AND I.F RESPONSE
FIG. 15. TYPICAL TV TUNER RESPONSE
F. M. TUNER ALIGNMENT
Frequency modulation receivers have the following sections: r-f tuner,oscillator,mixer,i-f amplifier, limiter, discriminator, and a-f amplifier. The procedure for aligning the i-f amplifier, limiter, and discriminator is identical to the procedure for thesound section of a television receiver except that the intermediate frequency for f-rnreceivers is usually 10.7 mc. See page 17 for this data.
The general type of instructions for adjustment of the r-f tuner, oscillator, andmixer can be outlined, but the exact and complete procedure will vary from one manufacturer to another. Most receivers have provision for adjustment hear the high endof the dial 108 mc.. Some have a low frequency adjustment in addition. It is advisable to consult manufacturer’s literature to obtain the recommended frequency or fre-quencie s.
1. Connect the VERT. AMPL. and HORIZ. AMPL. cables to the vertical andhorizontal input terminals of the associated oscilloscope. Set the oscilloscope functioncontrol so the input at the horizontal input terminals is sent through the horizontalamplifier.
-22.-

2. Connect the SIGNAL INPUT cable across the output of the demodulator stagepoint uA in figure 8.
3. Connect the OUTPUT cable through its matching network to the antennaterminals of the receiver. Connect the termination box according to the data in table2 to provide the correct input for the receiver. Manufacturerts instructions shouldindicate whether this is 75 ohms or 300 ohms.
4. Set the A.M. Generator to the frequency recommended for alignment. Usethe CALIBRATION PROCEDURE page 5 to set this exactly. Set the receiver dial atthe same frequency.
5. Rotate the SIGNAL ATTENUATORS, F.M. ATTENUATORS, and the oscilloscope vertical gain for a 400 cycle pattern with satisfactory height.
6. Adjust the oscillator, mixer, and r-f trimmers of the receiver to obtain amaximum amplitude pattern. Keep the SIGNAL and F.M. ATTENUATORS as low aspossible, but keep a usable pattern on the cathode ray tube.
An alternate to the above method uses a frequency modulated signal input to theantenna, with a marker signal set at the desired frequency. Adjust the oscillator,mixer, and r-f trimmers of the receiver for a symmetrical response curve with amaximum amplitude, and with the marker centered on the curve.
Note that these instructions are very general. They are intended as a theoretical idea of alignment only. Always consult the receiver manufacturer’s instructionsfor specific directions when aligning his sets and follow them. However, an oscilloscope can be used to advantage in addition to the vacuum tube voltmeter specified inmany instructions. The oscilloscope will show the shape of the response wave form.
FIG. 16. IMPEDANCE MATCHING OUTPUT CABLE
-23-

TABLE 2. TERMINATION BOX CONNECTIONS
TERMINATION CONNECTIONS300 OHMS JUMPER 7-8-9-5 JUMPER 3-4
300 OHM WITH PAD* JUMPER 3-8 JUMPER 5-9
75 OHMS JUMPER 6-7-8-9-5 JUMPER Z-3-4
75 OHM WITH PAD* JUMPER 6-7 JUMPER Z-3-8 JUMPER 5-9
OPEN TERMiNATION JUMPER 2-3-4 JUMPER 6-7-8-9
SERIES CAPACITOR NO JUMPER 1-6 USE IN ADDITION TO
JUMPER 1-6 TERMINATIONS INDICATED
ABOVE,
RESISTANCE COUPLING,
NO SERIES CAPACITOR
*THE USE OF A PAD PROVIDES 1000 OHMS IN SERIES WITH EACH SIDEOF THE LINE
USING OUTPUT CABLE TERMINATION BOX
In order to simulate actualoperating conditions, it is important that the receiverinput impedance and the generator output impedance are matched. The OUTPUT cablefor the Model 479 has a termination box built on the probe end to facilitate matchingthese impedances. See figure 16 and table 2 for an outline drawing of the probe and someof the possible connections. The two most commonlyusedirnpedances for receiver inputs are 75 ohms and 300 ohms. These are both available, with or without an isolatingpad, by simply connecting bare wire jumpers as indicated in table 2. In each case, theconnections are set to provide a 75 ohm termination for the Model 479 output becausethis value is proper for its output characteristics. Use of the pad provides isolationbetween the output of the Model 479 and the receiver points to which it is connected.If a series capacitor of 2000 uuf is desired in series with the receiver input for d-cblocking, do not jumper terminals 1 and 6, but if a straight resistance coupling is desired, jumper these terminals to short the capacitor whichis built into the terminationbox. An open termination is provided for optional use: whenusing this connection, theModel 479 output is not impedance matched, but each side of the output is connectedstraight through with the series capacitor if desired to the two sides of the receiverinput.
When operating in the new intermediate frequency range around 45 mc., the termination box may cause distortion of the response wave form. For best results, changethe termination box connections as follows:
1. Pull the alligator clip off the post on the end of the termination box nearscrew terminal number 1.
2. Cut two pieces of solid bare jumper wire, #20 or 22, 1-3/4 inches long andone piece 1 inch long.
3. Loosen screws 2, 3, and 4,and place one 1-3/4" wire under them so that it isstraight between the screws and then bends around s’crew number 2 with about 1/2 inchextending beyond the side of the termination box. Tighten the screws. This will be theground lead.
4. Loosen screws 6, 7, 8, and 9. Place the other 1-3/4" wire under thesescrews. Keep the wire straight and tighten the screws.
5. Loosen screw number 1 and place one end of the 1" wire under it. With thewire extending off the side of the termination box, tighten the screw. This will be the"hot " lead.
-24-

6. Solder the "hot lead to the connection point of the receiver and the groundlead to the chassis or receiver-ground.
This provides an open terrninationfor the cable, with the 2000 uuf capacitor in series.It is important to keep the leads of the probe very short to obtain efficient operation.
An alternate method of handlingthis problem is to make up a special output cable touse for 45 mc. An Amphenol type 80M cable connector,about 3 feet of RG-59/U cable,and a 1000 uuf or 2000 uuf ceramic capacitor are all the required parts. Attach theconnector on one end of the cable and solder one lead of the capacitor clip the leadshort to the center conductor at the other end of the cable. Solder the other capacitorlead to the connection point in the receiver and the cable shield to the chassis or receiver ground.
A special OUTPUT cable assembly, Simpson part number 10-830046, for use at 45n-ic., is now available as an accessory to owners of the Model 479.
Should other termination boxconnections than those listed in table 2 be desired, theymay be obtained by using resistors between the terminals rather than using jumperwires. Suppose 150 ohms were desired. Connect a jumper across terminals 5 and 9to provide the proper termination for the Model 479. Then connect a 75 ohm resistorfrom terminal 6 to terminal 7, a jumper from 7 to 8 to 9, a jumper from 3 to 4, and a50 ohm resistor between terminals 2 and 3. If a pad is desired, leave the jumpers offof terrriinals 7-8-9 and terminals 3-4 and put in a jumper between terminals 3 and 8Unlimited possibilities of terminations can be produced by this method of combining theresistances inside the termination box with external resistance.
zaoMMF 1N34
INPUT Li’ -- VERTICAL
looK 470 3MMFT 30K
_________________ _______________ ________ __________OSCtLLOSCOPE
DUND4 GROUND
FIGURE 17. SCHEMATIC OF THE HIGH FREQUENCY PROBE
-25-

-SIGNAL TRACING
Figure 17 shows the arrangement of components in the Simpson High frequencyProbe, No. 10-890025, which is available to owners of the Model 479 at a nominal cost.Connect this probe to the SIGNAL INPUT of the Model 479 to trace the signal throughan f-m or television receiver. The probe is essentially a high frequency detector andit may be used to pickup the modulation on the signalfrom any part of the system wherehigh frequencies exist.
To trace a signal through the sound channels of a television receiver or through anf-m receiver, connect the OUTPUT cable to the antenna terminals of the receiver andset the A.M. GENERATOR to the sound carrierfrequencyof the channeltowhich the receiver is tuned. Rotate the SIGNAL switch to MOD. R.F. Connect the high frequencyprobe cable to the SIGNAL INPUT jack and the ground lead to the receiver chassis.Starting at the grid of the converter, the signal may be picked up at each successivegrid and plate through the i-f system. The 400 cycle modulation pattern should increase in amplitude as each succesive stage is checked.
In a television receiver, the picture system may be traced in the same manner.Set the A.M. GENERATOR to the picture carrier frequency and the SIGNAL switch toMOD. R.F. for this test. Trace the signal from the grid of the converter tube throughthe video i-f amplifiers, noting the increase in amplitude of the 400 cycle modulationpattern as each successive stage is checked.
Any single stage may be checked by connecting the OUTPUT cable across the in-put of the stage with the A.M. GENERATOR set to the proper frequency for the stage.Contact the output of the stage with the high frequency probe.
TESTING THE AUDIO AMPLIFIER
The Model 479 contains a 400 cycle audio oscillator which can be used to test theaudio amplifier section of a receiver. Set the SIGNAL switchatAUDlO. Use the OUTPUT cable and the SIGNAL ATTENUATORS. This feature is of special value whentests of the audio amplifier alone are desired.
To test the audio amplifier, connect the OUTPUT cable across the discriminator ordetector output. Turn the volume control of the receiver to its full on position. Withthe SIGNAL switch in the AUDIO position and the SIGNAL ATTENUATORS and the oscilloscope vertical gain set for a satisfactory indication, connect the SIGNAL INPUTcable across the various points to be checkedfromthe demodulator back tothe speaker.Note the increase in signal strength as each successive stage is checked. Watch fordistortion of the sine wave. Setthe SIGNAL ATTENUATORS as low as possible to prevent overloading the vertical amplifiers of the oscilloscope since this would give afalse indication of distortion in the receiver.
For the best indication of the 400 cycle sine wave, set the oscilloscope controls toproduce a linear sweep which will show 3 or 4 complete sine waves Internally synchronize the wave form to hold it steady on the oscilloscope.
-26-

L4 C7
C
C
FIG. 18. REAR VIEW OF MODEL 479. CASE AND SHIELDING REMOVED
The chassis of the Model 479 is mounted into its case with 18 screws around theedge of the front panel. Removing these 18 screws and 2 on the back at the line cordhole cover will allow the assembly to be taken out of the case. Figure 18 is a rearview of the Model 479 with its case and some shielding removed.
When the chassis is removed from the case, the 5Z4 rectifier tube, power supply,and most front panel controls are available. Hole plugs over the internal adjustmentpoints in the A.M. and F.M. Generators may be removed for aligning these sectionswhile the shielding is in place.
If any components inside the generators need to be reached, remove the 18 screwsholding the back shield in place one screw is behind the 5Z4 and take off the panel.Five more screws hold the end of the A.M. Generator section in place; take it off andall components are exposed.
The F.M. Generator section contains four tubes. These are; V4, a 6AK5 f-m oscillator; V5, a 6C4 fixed oscillator 140 mc; V6, a 6AK5 mixer; and V7, a 6C4 used forf-rn blanking.
The A.M. Generator section contains three tubes. These are: Vi, a 6C4 variabler-f oscillator; V2, a 6J6 crystal oscillator and mixer; and V3, a 66 audio oscillator
/
-27-

and beat amplifier. The 5.0 mc. crystal also is in this section.
All tubes in the Model 479 should be checked occasionally to insure good performance. The Model 479 is adjusted carefully at the factory with precision standards, butdue to the nature of very high frequency circuits aging of parts or replacement of tubesmay require readjustment of the oscillator circuits to maintain the original accuracy.
Adjust the Model 479, whennecessary, against its own crystal calibrator as follows:
1. With the back and top shields removed frombothoscillator sections, turn thePOWER switch to OPERATE and allow the Model 479 to warmup for at least 15 minutes.
2. Connect the VERT. AMPL. and HORIZ. AMPL. cables to the vertical andhorizontal inputs of an oscilloscope. Set the Model 479 controls as specified for CALIBRATION PROCEDURE on page 5
3. Set the A.M. GENERATOR RANGE switch at A, SIGNAL switch to CAL., andSIGNAL ATTENUATORS low. Tune the oscillator to the 7.5 mc. calibration check point.
4. Adjust C9 until the 7.5 mc zero beat indication occurs when the dial pointerindicates exactly 7.5 mc.
. Tune the oscillator for the 3.75 mc. calibration check point. Adjust L6 untilthe beat occurs when the dial pointer indicates exactly 3.75 mc. Recheck the 7.5 mc.setting and readjust C9 if necessary.
6. Set the A.M. GENERATORRANGE switch to B. Tune to the 35 mc. calibratingcheck point and adjust C8 until the check point indication occurs when the dial pointerindicates exactly 35 mc.Cl
. Tune to the 15 mc. calibration check point and adjust L5 until the pointer isover the 15 mc. mark on the dial. Recheck the 35 mc. tuning point.
Set the A.M. GENERATOR RANGE switch to band C. Tune to the 120 mc.calibration check point and adjust C7untilthe zero beat indication occurs when the dialpointer indicates exactly 120 mc.
Tune to the 75 mc. calibrating check point. This should fall exactly at thedial pointer position for 75 mc. unless L4 has been moved physically. If necessary,loosen the two set screws holding L4 in place and shift L4 in or out to obtain the beatpattern at the 75 mc. dial indication. Recheck the 120 mc. point. Replace the topshield of the A.M. Generator if it was removed for alignment to this step.
tQ. Connect a crystal diode such as a 1N34 between the center contacts of theOUTPUT and SIGNAL INPUT jacks.
L,i. Set the SIGNAL switch at CAL. TunetheA.M.Generator to its 170 mc. calibrating check point. Turn the SIGNAL switch to UNMOD R.F. and advance the SIGNALATTENUATORS to 10 and MAX.
4r2. Set the F.M. GENERATORRANGE switchatB, F.M. ATTENUATORSto MAX.and 10, F.M. SWEEP to 0, PHASING to 0, and BLANKING to OFF.
1,. Tune the F.M. Generator around the 170 mc. dial mark for a zero beat indication between the two generators. See whether the dial pointer indicates 170 mc.on the CENTER FREQUENCY dial or if it is above or below the mark.
-28-

Lt. Set the A.M. GENERATOR RANGE to B, SIGNAL switch to CAL,, andSIGNAL ATTENUATORpotentiorneter to 6. Tune the A.M. Generator to its 70 mc.calibration check point. Turn the SIGNAL switch to UNMOD. R.F, and the SIGNALATTENUATOR potentiometer to 10.
i Tune the F.M. Generator around the 140 mc. point on the dial for a zerobeat between the two generators. See whether the dial pointer indicates 140 mc. on theCENTER FREQUENCY dial, or if it is above or below the mark. ,.
1. Adjust C27 for a compromise settingfor the 170 mc. and 140 mc. frequencypositions of the pointer.
Set the A.M. GENERATOR RANGE switch to C, SIGNAL switch to GAL.,and SIGNAL ATTENUATOR potentiometer to 6. Tune the A.M. GENERATOR to the 240mc. calibrating check point, Return the SIGNAL switch to UNMOD. R.F. and the SIGNAL ATTENUATOR potentiometer to 10.
1& Tune the F.M. Generator around the 240 mc. point on the dial for a zerobeat between the two generators. Zero beat should occur at the 240 mc. mark on thedial unless the rotor for L7 has been moved on the tuning knob shaft. If it needs adjustment, tune to the zero beat point for 240 mc., loosen the allen head set screw onthe shaft coupler, turn the tuning knob to place the pointer over the 240 mc. dial markwhile holding L7 in position, and then tighten the alien head set screw. Recheck the170 mc. and 140 mc. indications.
19. Set the SIGNAL switch at CAL. and the SIGNAL ATTENUATOR potentiometer at 6. Tune the A.M. Generator to the 165 mc. check point. Return the SIGNAL switch to UNMOD. R.F. and the SIGNAL ATTENUATOR potentiometer to 10.
20. Tune the F.M. Generator around the 165 mc. mark on the dial for a zerobeat indication on the oscilloscope.
21. Remove the crystal diode from the OUTPUT and SIGNAL INPUT jacks.Attach the cables to these jacks.
. Connect the 001 F’UI cable to the input 01 an i-I strip tuned br a responsepattern in the vicinity of 20 to 25 mc. Connect the SIGNAL INPUT cable to the gridor plate of the last i-f amplifier to obtain a wave form similar to figure 15B when theintermediate frequency is tuned with the F.M. Generator.
23. Set the A.M. GENERATOR RANGE switch to B, SIGNAL switch to CAL.,and SIGNAL ATTENUATORS to 0 and Xl. Tune the A.M. Generator to the 25 mc. calibrating check point. Set the SIGNAL switch at UNMOD. R.F.
24. Set the F.M. GENERATOR RANGE switch at A, F.M. ATTENUATORS atMAX. and 10, and F.M. SWEEP at 10. Tune G34 until the maximum i-f response isseen on the oscilloscope. Note that several response curves can be seen with verylittle rotation of C34. Tune to the largest response.
25. Advance the SIGNAL ATTENUATORS until a marker can be seen on theresponse pattern. Keep them set as low as possible with the marker just visable.
26. Reduce the F.M. SWEEP gradually toward zero. Adjust C34 to keep themarker on the trace as long as possible while reducing the sweep control. This is arough adjustment of C34.
27. Remove the OUTPUT and SIGNAL INPUT cables and connect the 1N34
-29-

between the center jack contacts. Turn the SIGNAL switch to CAL. and SIGNALATTENUATOR potentiometer to 6. Set the AJ’S& GENERATOR RANGE switch to Cand tune the A.M, Generator to the 170 mc. check point. Turnthe Signal switch to UNMOD. R.F. and the SIGNAL ATTENUATOR potentiometer to 10.
28. Set the F.M.GENERATOR RANGE switchtoB and F.M. SWEEP at 0. Tunethe F.M. Generator for a zero beat indication at 170 mc.
29. Set the SIGNAL ATTENUATOR potentiometer at 6, the SIGNAL switch atCAL., and the A.M. GENERATOR RANGE switch at B. Tune the A.M. Generator to the30 mc. calibrating check point. Setthe SIGNAL switch at UNMOD. R.F. and the SIGNALATTENUATOR potentiometer to 10.
30. Set the F.M. GENERATOR RANGE switch at A. Very carefully adjust C34for a zero beat indication. This is a fine adjustment and should require only a slighttouch-up adjustment on C34.
Caution: this fine setting should require no more than 30° of rotation of C34. If itappears to need more, go back to step 19 and repeat the steps more carefully.
31. Set the SIGNAL switch at CAL. and the SIGNAL ATTENUATOR potentiometerat 6. Tune the A.M. Generator to the 35 mc. calibrating check point. Turn the SIGNALswitch to UNMOD. R.F. and the SIGNAL ATTENUATORS to 10 and MAX.
32. Observe the oscilloscope while rotating the F.M. tuning knob. A constant zerobeat should occur between the 35 mc. from the A.M. Generator and 140 mc. from thefixed oscillator regardless of the position of the pointer on the CENTER FREQUENCYdial. If this situation does not exist, the fixed oscillator is tuned to an incorrect frequency. Go back to step 19 and repeat the 140 mc. oscillator adjustment.
33. Remove the crystal diode and replace all shielding. The Model 479 oscillators are now aligned within the close tolerances to which they were adjusted when itwas manufactured.
SWEEP ADJUSTMENT
The f-m sweep motor is factory adjusted to provide a sweep bandwidth of 15 mc.when operated on 110 volts, 60 cycles, and with the F.M. Generator tuned to 160 mc.and the F.M. SWEEP control at 10. Operation on other line voltages or at line frequencies other than 60 cycles will require re-setting of the sweep limiter adjustment,R55. Use the fo1loving procedure to adjust R55.
1. Turn the POWER switch of the Mode1479 to OPERATE and allow 15 minutesfor th&utht to war,n up. Connect the VERT. AMPL. and HORIZ. AMPL. cables to thevertical and horizontal inputs of an oscilloscope. Set the function switch of the oscilloscope to utilize the 60 cycle sine wave sweep for horizontal deflection. Connect a crystaldiode such as a 1N34 between the center colitacts of the OUTPUT and SIGNAL INPUTjacks.
2. Setthe A.M. GENERATOR RANGE switchto C, SIGNAL switchto CAL., andSIGNAL ATTENUATORS to 6 and MAX. Tune the AM Generator to the 160 mc. checkpaint. Turn the SIGNAL switch to UNMOD. R.F. and the SIGNAL ATTENUATOR potentiometer to 10.
3. Setthe F.M.GENERATORRANGE switchto B,F.M.ATTENUATORSto MAX.and 10, and F.M. SWEEP to 0. Tune the F.M. Generator to zero beat at 160 mc.
-30-

4. Turn the F.M. SWEEP to 10 and the PHASING control to a position whichproduces an open oval or circle on the oscilloscope. Note the two markers on thepattern. Reduce the SIGNAL ATTENUATORS to as low a setting as will still keep themarkers visable.
5. Rotate the A.M. Generator tuning knob and note that the two markers movearound the trace until they join, produce a zero beat, and then disappear. Read thefrequency on the A.M. Generator dial at the point where the markers zero beat.
6. Rotate the A.M. Generator tuning knob in the opposite direction until themarkers move to the opposite side of the trace and join and zero beat again. Read thefrequency on the A.M. Generator dial again at this zero beat point.
7. The frequencies in steps 5, and 6 identify the limit frequencies toward whichthe F.M. GENERATOR is being swept. These should have a difference of 15 mc. Ifthey do not, adjust R55 to correct.
Caution: Do not adjust the sweep beyond the 15 mc. bandwidth point. The motorreaches the limit of its swing a little beyond this point and will be damaged if it isallowed to strike the stopsfor any considerable period of time.
Should your Model 479 fail to give satisfactory service due to reparable damage, itcan be returned to the factory for repairs. Always accompany any equipment sent infor repair with a statement indicating where the trouble is; for example, "A.M. Generator dial binds "or "F.M. Generator intermittent after Z hours of use" , etc. Thiswill facilitate repairs, keep your bill to a minimum, and insure that the fault will becorrected when you receive your Model 479 again.
WARRANTY
SIMPSON ELECTRIC COMPANY warrants each instrument and other articles ofequipment manufactured by it to be free from defects in material and workmanshipundernormal use and service, its obligationunder this warranty being limited to making goodat its factory any instrument or other article of equipment which shall within 90 daysafter delivery of such instrument or other article of equipment to the original purchaser be returned intact to it, or to one of its authorized service stations, with transportation charges prepaid, and which its examination shall disclose to its satisfactionto have been thus defective; this warranty-being expressly-in lieu of all other warrantiesexpressed or implied and of all other obligations or liabilities on its part and SIMPSONELECTRIC COMPANY neither assumes nor authorizes any other persons to assumefor it any other liability in connection with the sale of its products.
This warranty shall not apply to any instrument or other article of equipment whichshall have been repaired or alteredoutside the SIMPSONELECTRIC COMPANY factoryor ‘authorized service stations norwhichhas beensubjecttomisuse, negligence or accident, incorrect wiring by others, or installation or use not in accord with instructionsfurnished by the manufacturer.
-31-

PARTS LIST - MODEL 479CIRCUiT
REFERENCE
ClC2C3C4CSC6C7C8C9doCl’C1zC13C14C15C16C17C18C 19-26C 19-26C27C28C29C30C31C32C33C34C35C36Q37C38C39C40C41C42-50C42-50C51C52C53C54C56C57C58C59C60Fl11
r3LiLZ
SI MPSON
PART NUMRER
1-1139111-1138991-1 139111-1138991-1139131-1138981-1146591-1138911-1 138911-1139161-1138551-1138551-1138951-1139781-1138551-1139021-1138551-1138551-I !4b45
10-8901261-1139151-1139121-1138541-1138541- 1138541-1138931-1138931-1139201-1139121-1138541-1138541-1 13S1-1139131-1139131-1138541-114643
10-890 1271-1139121-1139121-1139031-1139631-1139131-1139131-1138981-1138981-1138551-1129111-1139821-1139831-1139831-113983
10-89004010-890040
Capacitor 8ZOOuuf micaCapacitor .OSuf 400 V. paperCapacitor 8ZOOuuf micaCapacitor .OSuf 400 V.paperCapacitor S000uuf ceramicCapacitor .O2uf 400 V paperCapacitor 4.5-Z5uuf trimmerCapacitor 2.2-Z0uuf trimmerCapacitor 2.2-Z0uuf trimmerCapacitor, 2 gang tuningCapacitor, Z000uuf ceramicCapacitor. Z000uuf ceramicCapacitor, l0uuf ceramicCapacitor, 47Ouuf ceramicCapacitor, Z000uuf ceramicCapacitor, 0.luf 400 V. paperCapacitor, Z000uuf ceramicCapacitor, Z000uuf ceramicCapacitors, l000uuf feedthroughAssembled on one plateCapacitor, 2-6uuf trimmerCapacitor, lOOuuf ceramicCapacitor, 2ZOuuf ceramicCapacitor, 2Z0uuf ceramicCapacitor, ZZOuuf ceramicCapacitor, 3.3 uuf ceramicCapacitor, 3.3 uuf ceramicCapacitor, 3.5-l5uuf trimmerCapacitor, lOOuuf ceramicCapacitor, 2ZOuuf ceramicCapacitor, ZZOuuf ceramicCapacitor, Z000uuf ceramicCapacitor, S000uuf ceramicCapacitor, S000uuf ceramicCapacitor, ZZOuuf ceramicCapacitors, l000uuf feedthroughAssembled on one plateCapacitor, lOOuuf ceramicCapacitor, lOOuuf ceramicCapacitor, 0.ZSuf 400 V. paperCapacitor, 40-1 Ouf 350V.D.C. electrolyticCapacitor, S000uuf ceramicCapacitor, S000uuf ceramicCapacitor, .OZuf 400 V. paperCapacitor, .02u1 400 V. paperCapacitor, Z000uuf ceramicFuse, 2 amp 3AGJack, OUTPUTJack, SIGNAL INPUTJack, VERT. AMPL.Jack, HORIZ. AMPL.Line FilterLine filter
-32-

PARTS LIST - MODEL 479CIRCUIT SIMPSON
REFERENCE DESCRIPTION
10-890034L4 NC" 10-890033L5 "A" 10-890031L6 "B" 10-890032
10-890028L8 10-890030L9 10-890039Ml 22-302118Ri 1-113947R2 1-113933R3 1-113959R4 1-113949R5 1-113949R6 1-111689
1-113921RB 1-113949R9 1-1130481A 1 ll2flIZO
LL.J7/
Ru 1-113959R12 1-113943R13 1-113960R14 1-113960R15 1-113945R16 1-111671R17 1-113956R18 1-111689R19 1-113979R20 1-113048R21 1-111671R22 1-111689R23 1-111940R24 1-113943R25 1-113961R26 1-113949R27 1-111693R28 1-113941R29 1-113941R30 1-113958R31 1-113949R32 1-113927R33 1-113877R34 1-113923R35 1-111684R36 1-113923R37 1-111684R38 1-113923R39 1-111684R40 1-113923R41 1-111684R42 1-113922R43 1-113947R44,45 1-113880
PART NUMBER
85uh choke coilOscillator coil, A.M. BandOscillator coil, A.M. BandOscillator coil, A.M, BandCoil assembly, F.M. tunerOscillator coil, l4Omc.Filter choke, Power supplySweep motor assemblyResistor, 56K 1/2 W. 10%Resistor, 33K 1/2W. 10%Resistor, 22K 2W. 10%Resistor, lOOK 1/2W. 10%Resistor, 100K 1/2w. 10%Resistor, 1K 1/2W. 10%Resistor, 47 ohms i/zw. 10%Resistor, 100K 1/2w. 10%Resistor, 6.8K 1/2W. 10%t tP UT 1 natfl. 0 £0 k’.J S i_s fl i_s 7Y. - .1. U /0
Resistor, 22K 2W. 10%Resistor, 18K 1/2W. 10%Resistor, 33K ZW.5%Resistor, 33K 2W. 5%Resistor, 33K 1/2W. 10%Resistor, 10K 1/2W. 10%Resistor, 8200 2W. 10%Resistor, 1K 1/2W. 10%Resistor, 7.5K 5W. 10%Resistor, 6.8K 1/2W. 10%Resistor, 10K 1/2W. 10%Resistor, 1K 1/2W. 10%Resistor, 100 ohm 1/2w. 10%Resistor, 18K 1/2W. 10%Resistor, 33K 2W. 10%Resistor, 100K 1/2W. 10%Resistor, lOMeg 1/2W. 10%Resistor, 2200 ohm 1/2W. 10%Resistor, 2200 ohm 1/2w. 10%Resistor, 12K 2W. 10%Resistor, lOOK 1/2w. 10%Resistor, 150 ohm 1/2W. 5%Potentiometer, 50KResistor,91 ohm 1/2W. 10%Resistor, 750 ohm 1/2W. 10%Resistor, 91 ohm 1/2W. 10%Resistor, 750 ohm 1/2w. 10%Resistor, 91 ohm 1/2w. 10%Resistor, 750 ohm 1/2W. 10%Resistor, 91 ohm 1/2w. 10%Resistor, 750 ohm 1/2w. 10%Resistor, 82 ohm 1/2W. 10%Resistor, 56K 1/2w. 10%Dual Potentiometer, 2K each section
-33-

PARTS LIST - MODEL 479C I RCU I T
REFERENCE 0E Sc RI PT10 N
St MPSON
PART NLJM8ER
R46R47R48R49R50R5 1R52R53R54R55R56R57R58R59R60R61R62R63R117SiS2S3S4S5S6TiT2T3viv2V3V4vsV6V7V8
YlYz
Resistor, 75 ohm 1/2w. 5%Resistor, 750 ohm 1/2w. 10%Resistor, 91 ohm i/zw. 10%Resistor, 750 ohm 1/2W. 10%Resistor, 91 ohm 1/2W. 10%Resistor, 750 ohm 1/2W. 10%Resistor, 91 ohm i/zw. 10%Resistor, 75Oohm i/2w. 10%Resistor, 82 ohm 1/2W. 10%Potentiometer, i0ohmResistor, 6.8 ohm 2W. 10%Potentiometer, 50 ohmResistor, 7K 20W.Potentiometer, 1 Meg with switchPotentiometer, 500KResistor, 10K 1/2W. 10%Resistor, 330K 1/2W. 10%Resistor, 150 ohm 1/2W. 10%Resistor, 680 ohm 1W. 10%Switch, A.M. GENERATOR RANGESwitch, POWERSwitch, SIGNALSwitch, F.M. GENERATOR RANGESwitch, F.M. ATTENUATORSwitch, SIGNAL ATTENUATORTransformer, PlateTransformer, ModulationTransformer, FilamentTube, 6C4, A.M. OscillatorTube, T6. Crystal Oscillator 8z MixerTube, 6Th , Audio Oscillator & Beat AmplifierTube, 6AK5, F.M. OscillatorTube, 6C4, 140 mc. OscillatorTube, 6AK5, F.M. MixerTube, 6C4, BlankingTube, 5Y3GT, Rectifieror 5Z4Crystal Diode, 1N34Crystal 5.0 mc. .05%Output cable with termination boxOscilloscope and signal input cables.Dial Assembly, A.M.Dial Assembly, F.M.Knob, pointer typeKnob, tuning type
1-1141131- 1116841-1139231-1 116841-1139231-1116841-1 139231-1116841-1139221-1138811-1139551-1138821-1139191-1138701-1141531-1116711-1139501-1139261-1 139291-1 138891-1138831-1138841-1138851-1 138861-1 13886
10-89003810-89003710-8900441-1139751-1 136391I
1-1136111-1139751-1136111-1 139751-11467 11-1139761-1138521-1139650-0083700-00837110-89002710-8900263-260 1801-114050
-34-
