simulating urban growth in nakuru (kenya) based on a
TRANSCRIPT
SIMULATING URBAN GROWTH IN NAKURU (KENYA) BASED ON A CONSTRAINED
CELLULAR AUTOMATA MODEL AND DECADE LANDSAT-DATA Kenneth MUBEA1*, Gunter MENZ 1,2, Roland GOETZKE1
1 Remote Sensing Research Group (RSRG), Department of Geography, University of Bonn, Germany 2 Centre of Remote Sensing of Land Surfaces (ZFL), University of Bonn, Germany
* Contact: [email protected]
During the last decade there has been exponential increase of urban areas in Africa. This has
become amongst others a major concern in the context of local environmental change and the
increasing amount of impervious surface.
This research aimed at modelling and projecting of land-use in Nakuru using the urban growth
model (UGM). UGM was integrated in the user friendly modelling frame-work XULU (eXtendable
Unified Land Use Modelling Platform). We used decade Landsat images of 1986, 2000 and 2010 in
order to obtain land-use changes. Inputs into our UGM included urban land-use, roads layer,
exclusion layer and slope data (DEM).
UGM was calibrated for Nakuru and simulation done up to the year 2030 when Kenya plans to
attain Vision 2030. The outcome shows that Nakuru has experienced fast urban sprawl.
2. Research Area
The approach adopted for urban land-use modelling of Nakuru central business district (CBD, 58
Km2) involved land-use change analysis using Landsat data for 1986, 2000, 2010 which were
combined with constrain data. Constraint data comprised of slope data, road data and exclusion of
layer. Figures 2 shows the different workflows for urban land-use modelling of Nakuru using our
cellular automata (CA) model, UGM, which was run on XULU (Goetzke and Judex, 2011, Schmitz
et al., 2007).
Land-use classification of Nakuru CBD consisted of three land-use classes; urban, forest and
agriculture. Overall accuracy of 96.87 % and Kappa coefficient of 0.9452 were obtained. Land-use
estimates obtained are as shown below on Table 1.
Monitoring land-use changes in urban areas is essential for guiding decision making for resource
management. We analysed urban land-use changes between the years 1986, 2000 and 2010 using
Landsat data. The UGM applied in this research used concept of cellular automata. After successful
calibration of UGM we were able to simulate urban-land use growth for Nakuru up to the year 2030.
Kenya plans to archive Vision 2030 in the year 2030.
Simulated results indicate that there is the need for strategic planning so as to control the expansion
of built-up areas. The capability of the model to simulate urban growth gives planners a powerful
tool in simulating future urban and regional development scenarios.
3. Data and Methodology
1. Research Question (Introduction)
Nakuru municipality lies in Central Rift Valley in Kenya between latitudes 0° 15' and 0° 31' South,
and longitude 36° 00' and 36° 12' East (Figure 1).
5. Conclusion
Presented at ESA Living Symposium in Edinburgh (United Kingdom), 9.9.13 – 13.9.13
Figure 1: Location of Nakuru in the Central Rift Valley (Kenya) (Data source: World Resources Institute 2010)
4. Results
4. Results
Figure 2: Urban land-use modelling work flow
12.4
15.4
22.3
13.3 13.7
10.7
32.3
28.9
25
0
5
10
15
20
25
30
35
1986 2000 2010
Km
2
Years
Land-use estimates for Nakuru CBD
Urban
Forest
Agriculture
UGM was run on XULU as shown in Figure 3. Best model parameters were obtained using Monte
Carlo calibration and multiple resolution validation (MRV) technique as shown in Table 2 (Pontius Jr et
al., 2008).
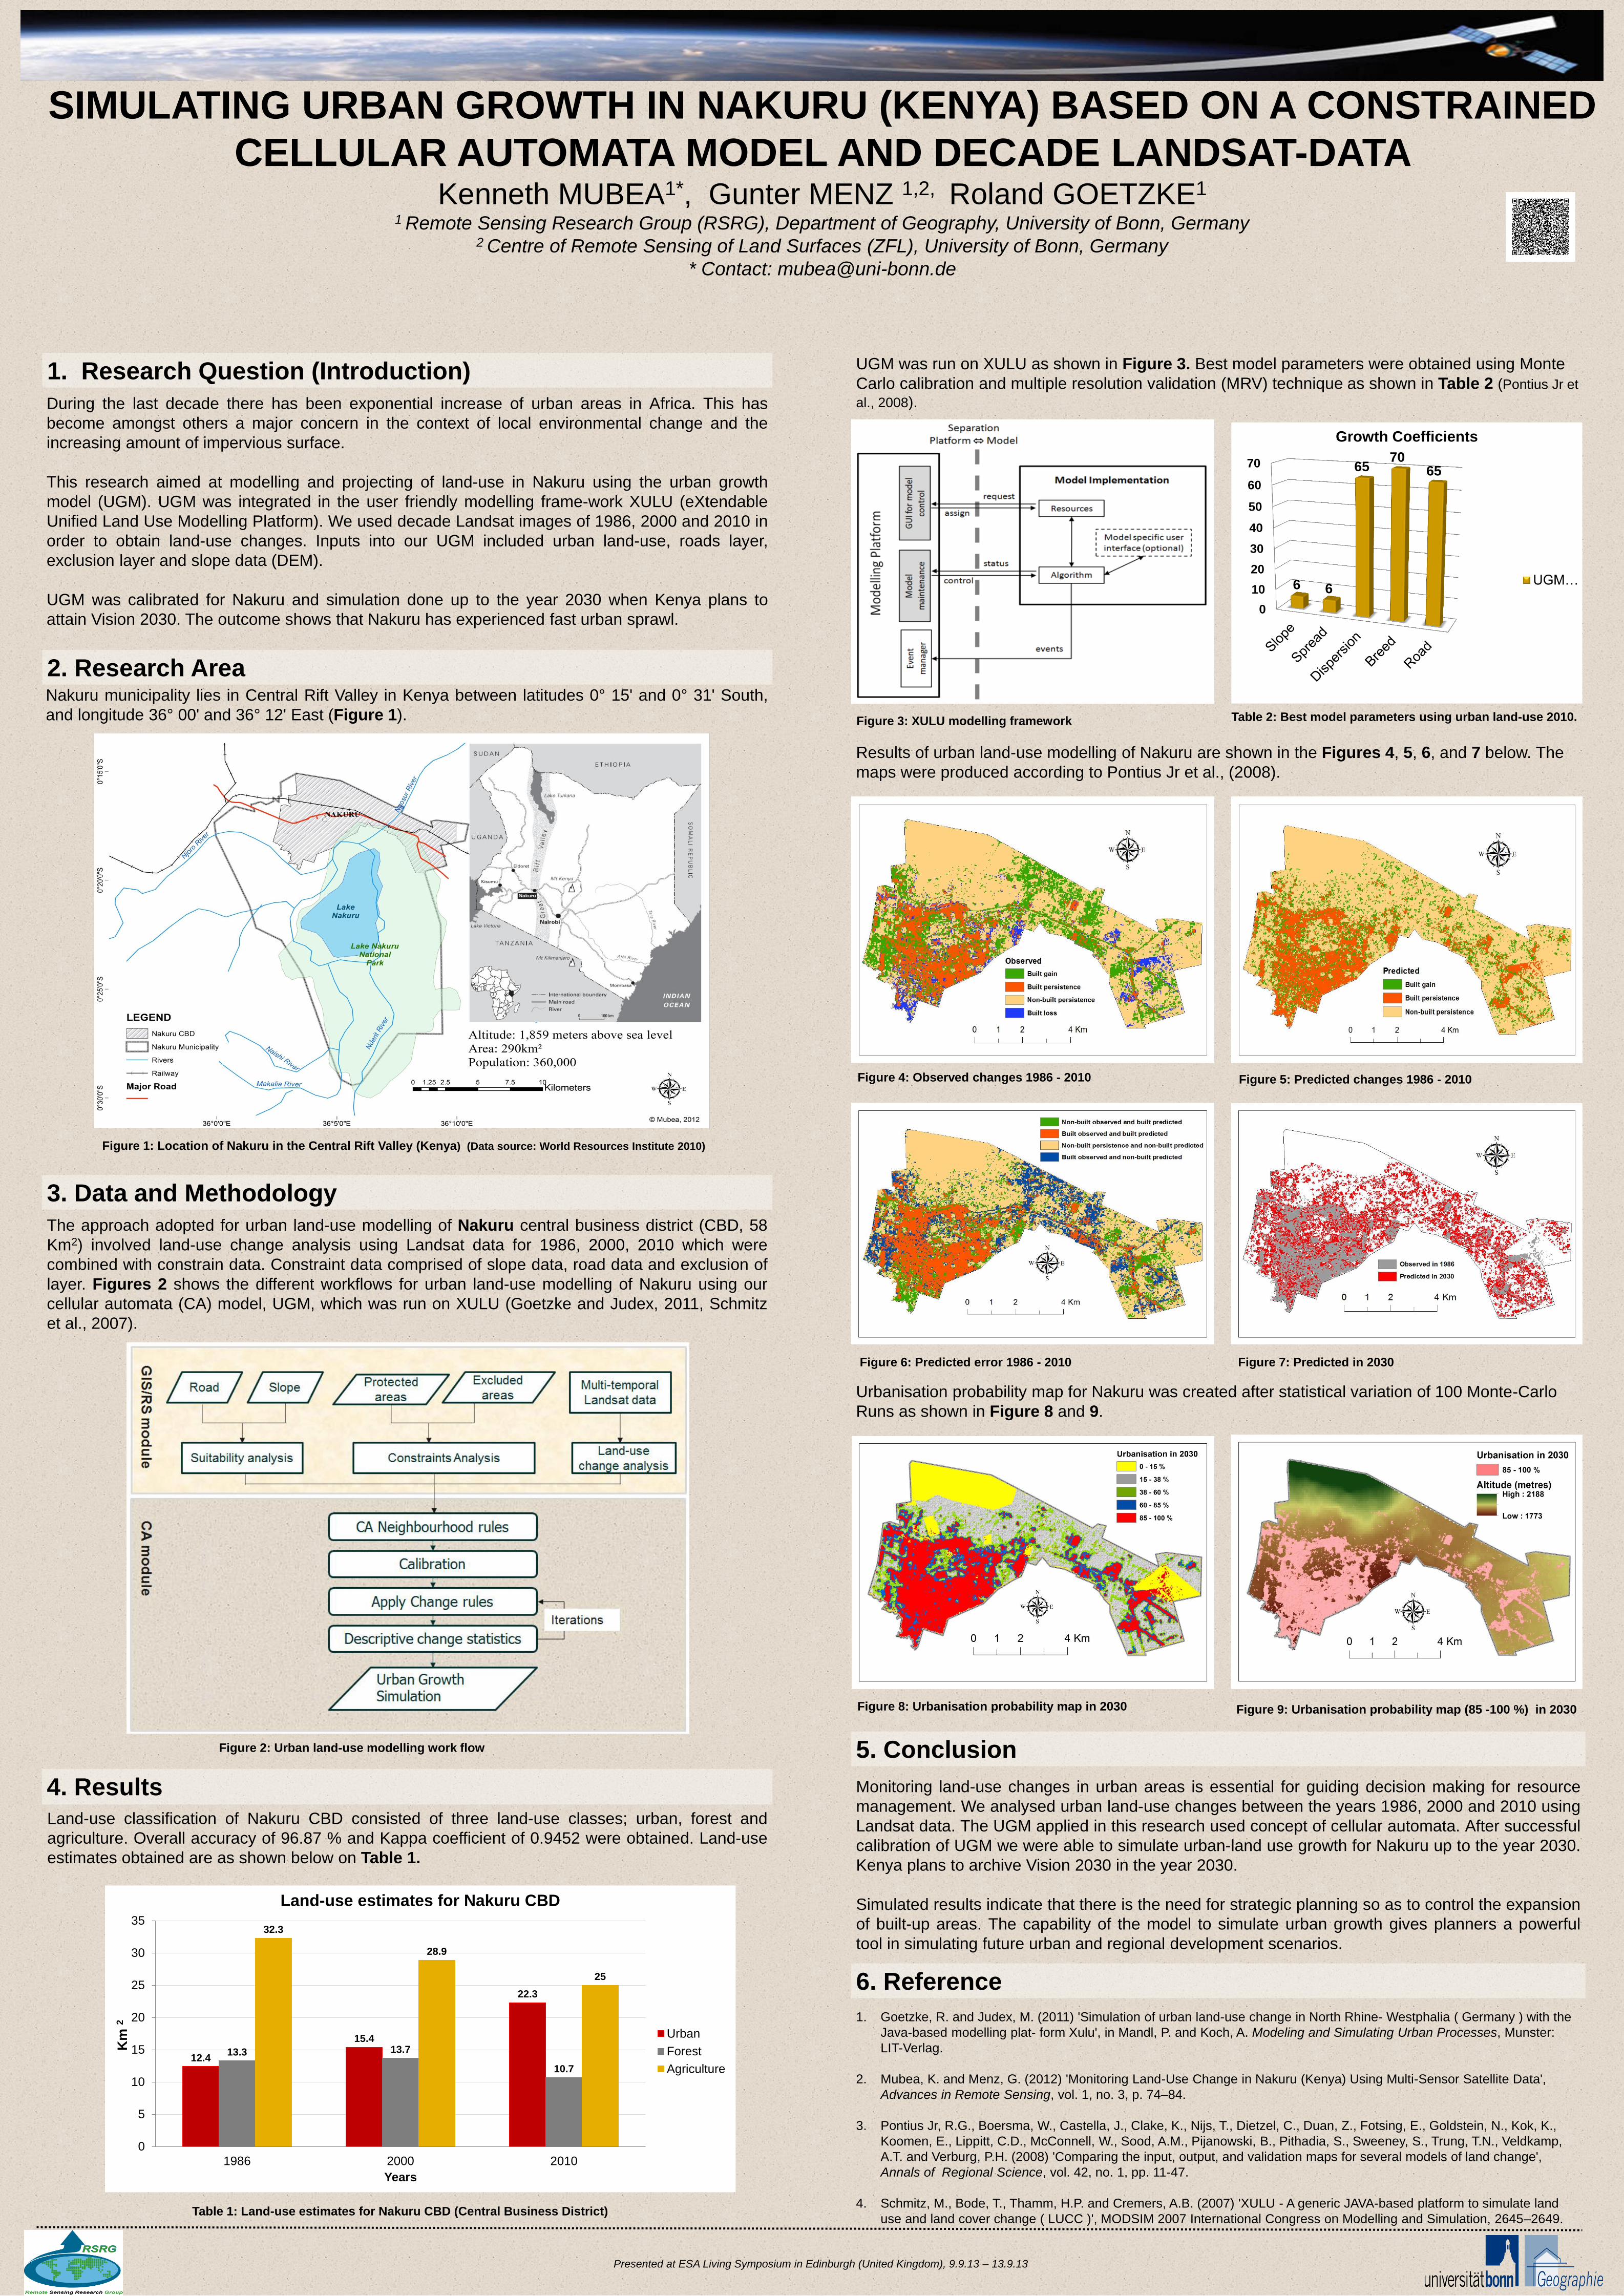
Results of urban land-use modelling of Nakuru are shown in the Figures 4, 5, 6, and 7 below. The
maps were produced according to Pontius Jr et al., (2008).
Figure 4: Observed changes 1986 - 2010
Figure 5: Predicted changes 1986 - 2010
Figure 6: Predicted error 1986 - 2010 Figure 7: Predicted in 2030
6. Reference
1. Goetzke, R. and Judex, M. (2011) 'Simulation of urban land-use change in North Rhine- Westphalia ( Germany ) with the
Java-based modelling plat- form Xulu', in Mandl, P. and Koch, A. Modeling and Simulating Urban Processes, Munster:
LIT-Verlag.
2. Mubea, K. and Menz, G. (2012) 'Monitoring Land-Use Change in Nakuru (Kenya) Using Multi-Sensor Satellite Data',
Advances in Remote Sensing, vol. 1, no. 3, p. 74–84.
3. Pontius Jr, R.G., Boersma, W., Castella, J., Clake, K., Nijs, T., Dietzel, C., Duan, Z., Fotsing, E., Goldstein, N., Kok, K.,
Koomen, E., Lippitt, C.D., McConnell, W., Sood, A.M., Pijanowski, B., Pithadia, S., Sweeney, S., Trung, T.N., Veldkamp,
A.T. and Verburg, P.H. (2008) 'Comparing the input, output, and validation maps for several models of land change',
Annals of Regional Science, vol. 42, no. 1, pp. 11-47.
4. Schmitz, M., Bode, T., Thamm, H.P. and Cremers, A.B. (2007) 'XULU - A generic JAVA-based platform to simulate land
use and land cover change ( LUCC )', MODSIM 2007 International Congress on Modelling and Simulation, 2645–2649.
0
10
20
30
40
50
60
70
6 6
65 70
65
Growth Coefficients
UGM…
Table 2: Best model parameters using urban land-use 2010.
Figure 3: XULU modelling framework
Urbanisation probability map for Nakuru was created after statistical variation of 100 Monte-Carlo
Runs as shown in Figure 8 and 9.
Table 1: Land-use estimates for Nakuru CBD (Central Business District)
Figure 8: Urbanisation probability map in 2030 Figure 9: Urbanisation probability map (85 -100 %) in 2030