simulating with statkey kari lock morgan department of statistical science duke university...
TRANSCRIPT
Simulating with StatKey
Kari Lock MorganDepartment of Statistical Science
Duke [email protected]
Joint Mathematical Meetings, San Diego1/11/13
StatKeyA set of web-based, interactive, dynamic
statistics tools designed for teaching simulation-based methods at an
introductory level.
Freely available at www.lock5stat.com/statkey
No login requiredRuns in (almost) any browser (incl. smartphones) Google Chrome App available (no internet needed)Standalone or supplement to existing technology
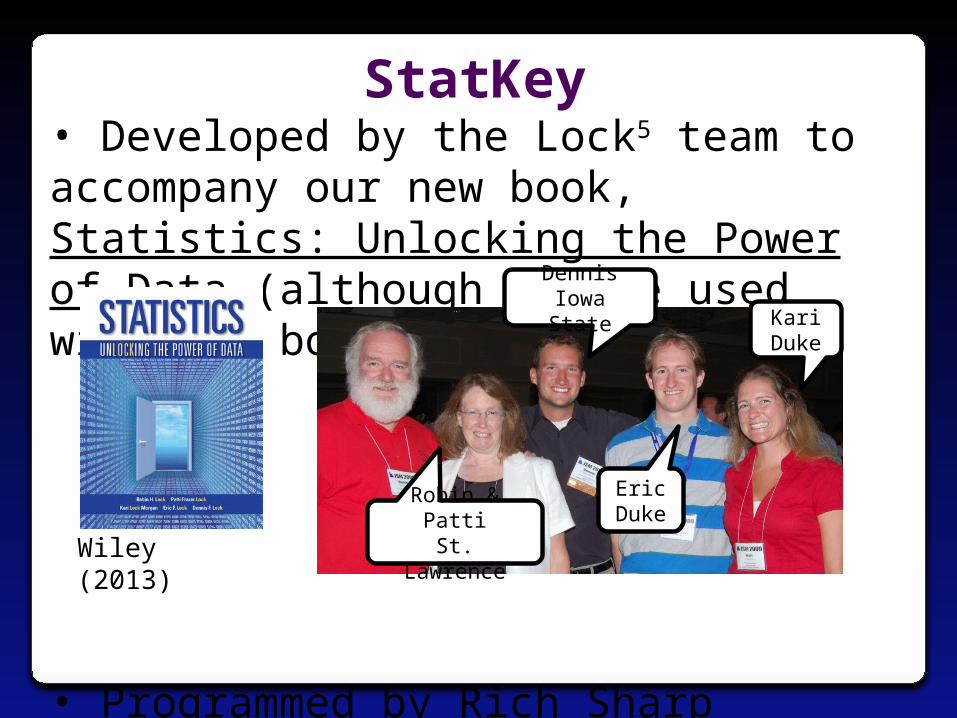
StatKey• Developed by the Lock5 team to accompany our new book, Statistics: Unlocking the Power of Data (although can be used with any book)
• Programmed by Rich Sharp (Stanford), Ed Harcourt and Kevin Angstadt (St. Lawrence)
Robin & PattiSt. Lawrence
EricDuke
KariDuke
Wiley (2013)
DennisIowa State


• What is the average human body temperature?
• Create a confidence interval for average human body temperature based on a sample of size 50 (
• Key Question: How much can statistics vary from sample to sample?
• www.lock5stat.com/statkey
Bootstrap Confidence Interval

Bootstrap Confidence Interval
SE = 0.108Distribution of Bootstrap Statistics
98.26 2 0.108(98.044, 98.476)
Middle 95% of bootstrap statistics
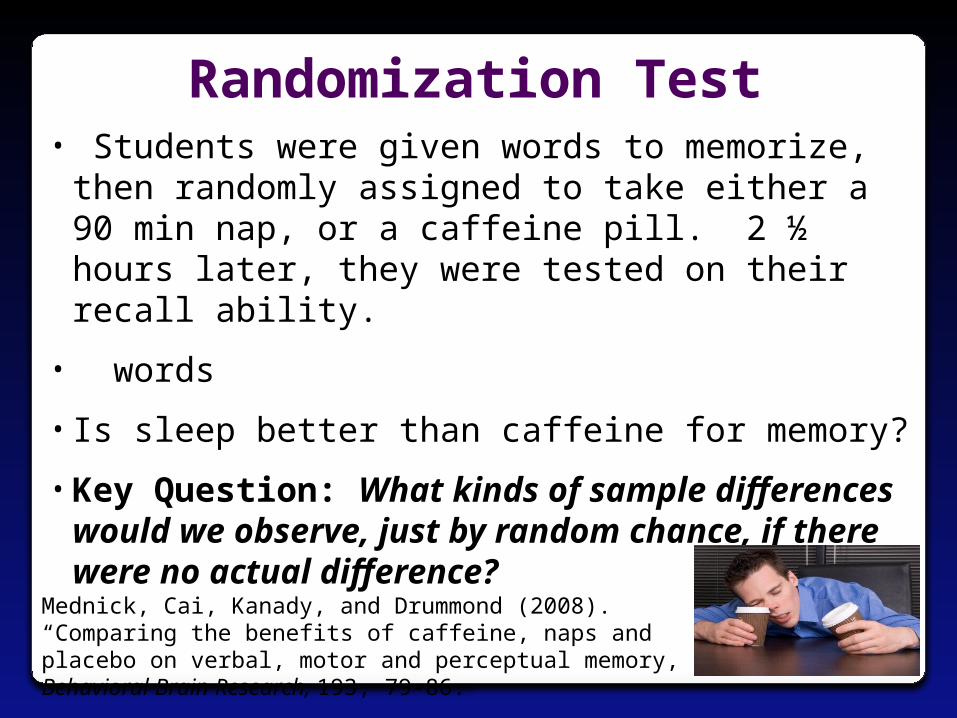
Randomization Test
Mednick, Cai, Kanady, and Drummond (2008). “Comparing the benefits of caffeine, naps and placebo on verbal, motor and perceptual memory,” Behavioral Brain Research, 193, 79-86.
• Students were given words to memorize, then randomly assigned to take either a 90 min nap, or a caffeine pill. 2 ½ hours later, they were tested on their recall ability.
• words
• Is sleep better than caffeine for memory?
• Key Question: What kinds of sample differences would we observe, just by random chance, if there were no actual difference?


Randomization Test
p-valueProportion as extreme as observed statistic
observed statistic
Distribution of Statistic Assuming Null is True

• Ability to simulate one to many samples
• Helps students distinguish and keep straight the original data, a single simulated data set, and the distribution of simulated statistics
• Students have to interact with the bootstrap/randomization distribution – they have to know what to do with it
• Consistent interface for bootstrap intervals, randomization tests, theoretical distributions
StatKey Pedagogical Features

• Sleep versus Caffeine:
• t-distribution
• df = 11
Theoretical Distributions
1 2
2 2 2 21 2
1 2
15.25 1
3.31 3.551
2.252.1
2 12
4ts sn
X X
n


Theoretical Distributions
p-value
t-statistic
MUCH more intuitive and easier to use than tables!!!
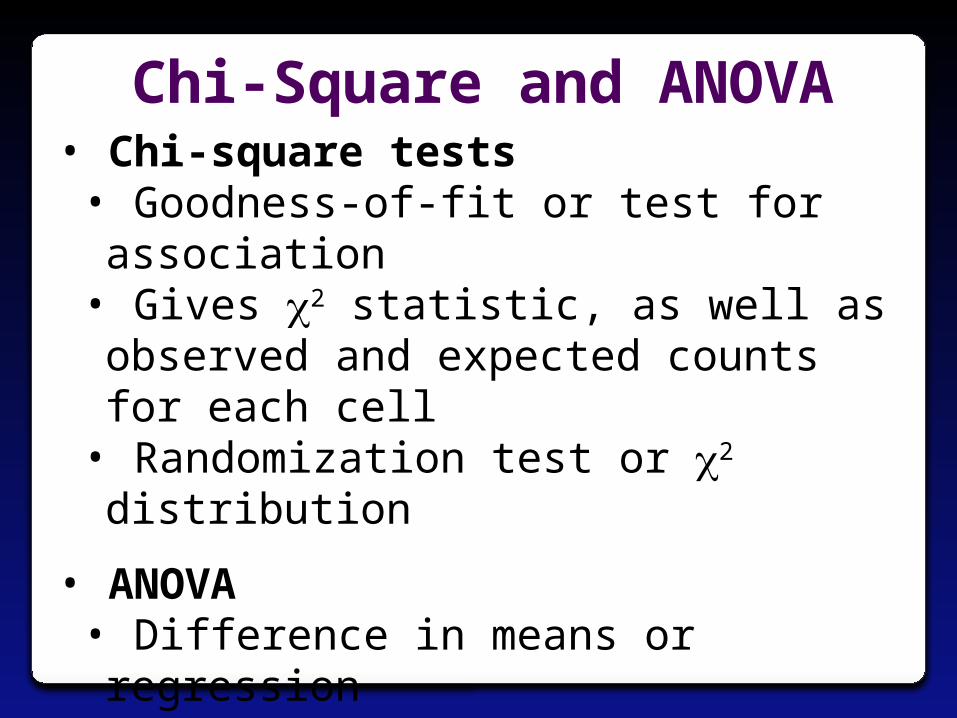
• Chi-square tests • Goodness-of-fit or test for association• Gives 2 statistic, as well as observed and
expected counts for each cell• Randomization test or 2 distribution
• ANOVA • Difference in means or regression• Gives entire ANOVA table• Randomization test or F-distribution
Chi-Square and ANOVA


Chi-Square Statistic
Randomization Distribution
Chi-Square Distribution (3 df)
p-value = 0.357
2 statistic = 3.242
2 statistic = 3.242 p-value = 0.356

• Simulate a sampling distribution
• Generate confidence intervals for each simulated statistic, keep track of coverage rate
Sampling Distributions

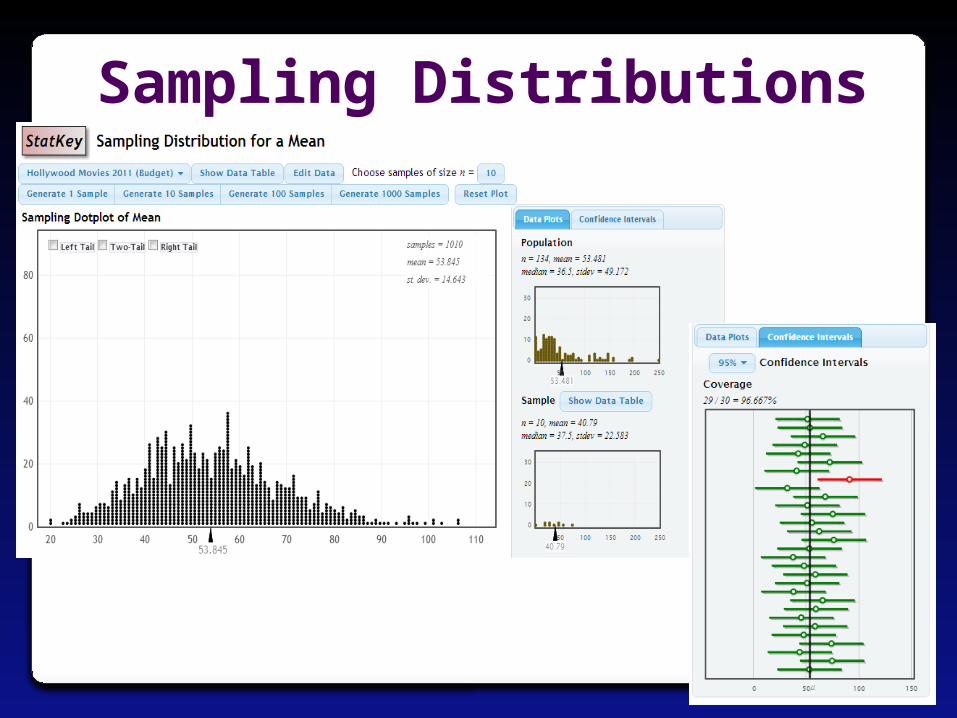
Sampling Distributions

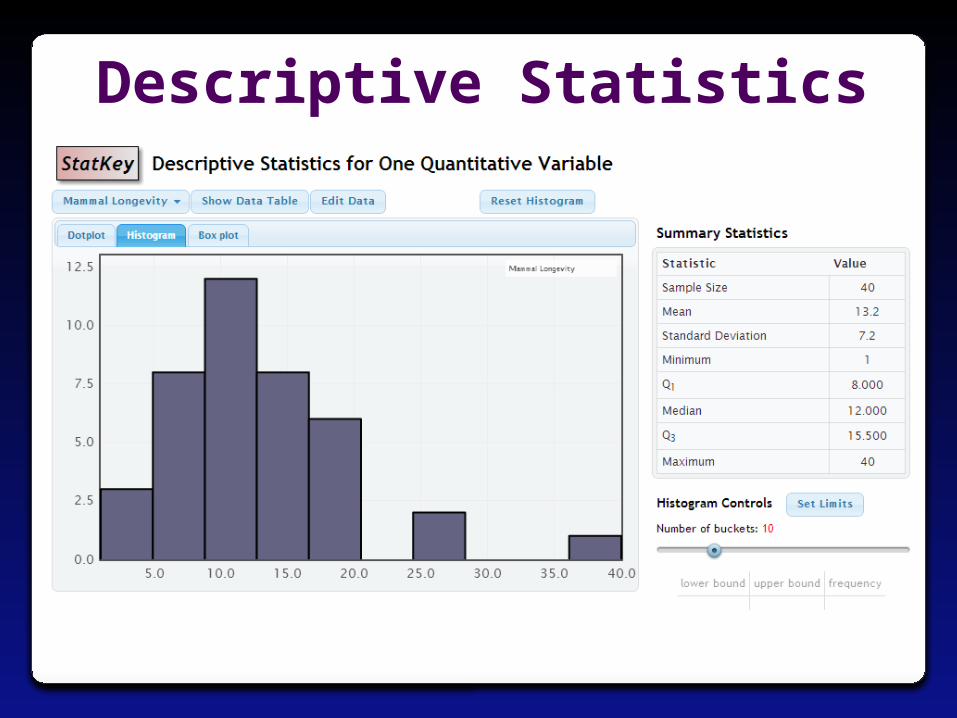
Descriptive Statistics

Descriptive Statistics

Descriptive Statistics
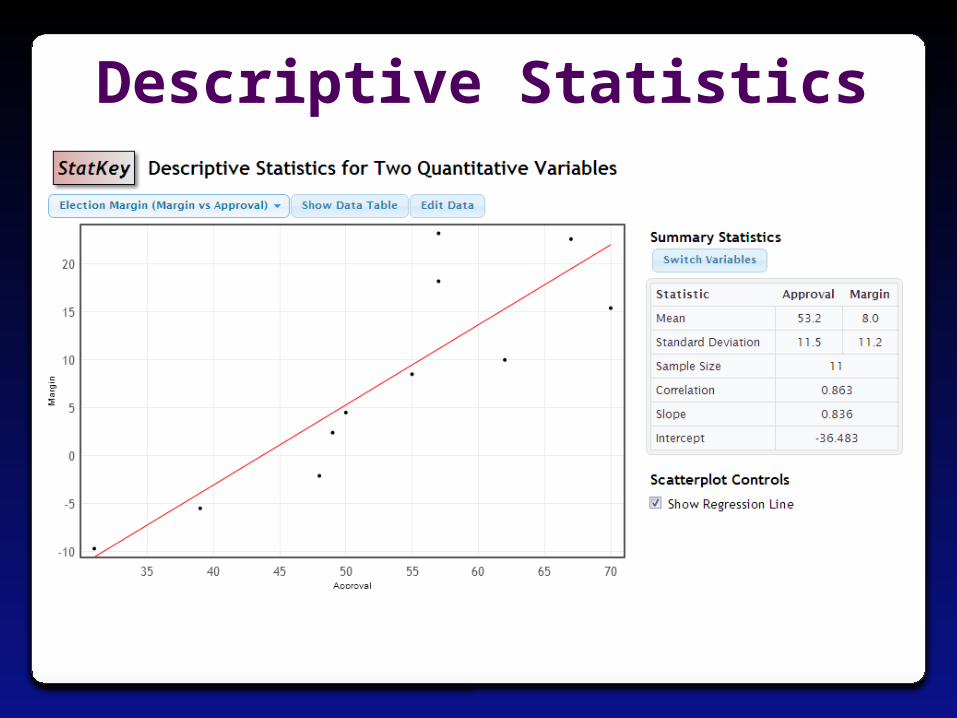
Descriptive Statistics

Help
• Help page, including instructional videos

Suggestions? Comments? Questions?
• You can email me at [email protected], or the whole Lock5 team at [email protected]