simulation for the automotive industry
TRANSCRIPT

10 Fast-Charging
Battery Development15
Cleaning Up34
Driven to Success
Excellence in Engineering Simulation VOLUME VI | ISSUE 3 | 2012
ADVANTAGEADVANTAGE™
SIMULATION FOR THE AUTOMOTIVE INDUSTRY
DALLARA’S DRIVING SIMULATOR
Realize Your Product Promise™ ANSYS is dedicated exclusively to developing engineering simulation software that fosters rapid and innovative product design. ANSYS technology enables you to predict with confidence that your product will thrive in the real world. For more than 40 years, customers in the most demanding markets have trusted our solutions to help ensure the integrity of their products and drive business success through innovation.
ANSYS, Inc. Southpointe 275 Technology Drive Canonsburg, PA 15317 U.S.A.
For ANSYS, Inc. sales information, call 1.866.267.9724.Email the editorial staff at [email protected]. For address changes, contact [email protected].
Neither ANSYS, Inc., nor Wall-to-Wall Studios, Inc., guarantees or warrants accuracy or completeness of the material contained in this publication. ANSYS, Aqwa, Asas, Autodyn, BladeModeler, CFD, CFD-Flo, CFX, Composite PrepPost, DesignModeler, DesignSpace, DesignXplorer, EKM, Engineering Knowledge Manager, Explicit STR, Fatigue, Fluent, Full-Wave SPICE, HFSS, ICEM CFD, Icepak, Icepro, Maxwell, Mechanical, Mesh Morpher, Meshing, Multiphysics, Nexxim, Optimetrics, ParICs, PExprt, Polyflow, Professional, Q3D Extractor, Rigid Dynamics, RMxprt, SIwave, Simplorer, SpaceClaim Direct Modeler, Structural, Super-Compact, SVD Fast Solve, TGrid, TPA, TurboGrid, Vista TF, WinIQSIM, Workbench, AnsoftLinks, Ansoft Designer, QuickEye, FLUENT for CATIA V5, Realize Your Product Promise, Simulation-Driven Product Development, Simulation Driven, Solver on Demand, VerifEye, RedHawk, Totem, PathFinder, Sentinel, PowerArtist, CPM, RPM, PACE, SCADE, SCADE Display, SCADE System, SCADE Lifecycle, and any and all ANSYS, Inc. brand, product, service, and feature names, logos and slogans are registered trademarks or trademarks of ANSYS, Inc., or its subsidiaries located in the United States or other countries. ICEM CFD is a trademark licensed by ANSYS, Inc. LS-DYNA is a registered trademark of Livermore Software Technology Corporation. nCode DesignLife is a trademark of HBM nCode. All other brand, product, service, and feature names or trademarks are the property of their respective owners.
Executive Editor Fran Hensler
Managing Editor Chris Reeves
Editors Erik Ferguson Shane Moeykens Mark Ravenstahl Brenda Westcott
Editorial Advisor Tom Smithyman
Editorial Contributor ANSYS North America Support and Services
Art Directors Ron Santillo Dan Hart
Design Wall-to-Wall Studios, Inc.
Ad Sales Manager Helen Renshaw
W elcome to ANSYS Advantage! We hope you enjoy this issue containing articles by ANSYS customers, staff and partners. Want to be part of a future issue? The editorial team is interested in your ideas for an article. Contact us.
The Editorial Staff, ANSYS [email protected]
ANSYS.COM © 2012 ANSYS, INC. ANSYS ADVANTAGE 1
EDITORIAL
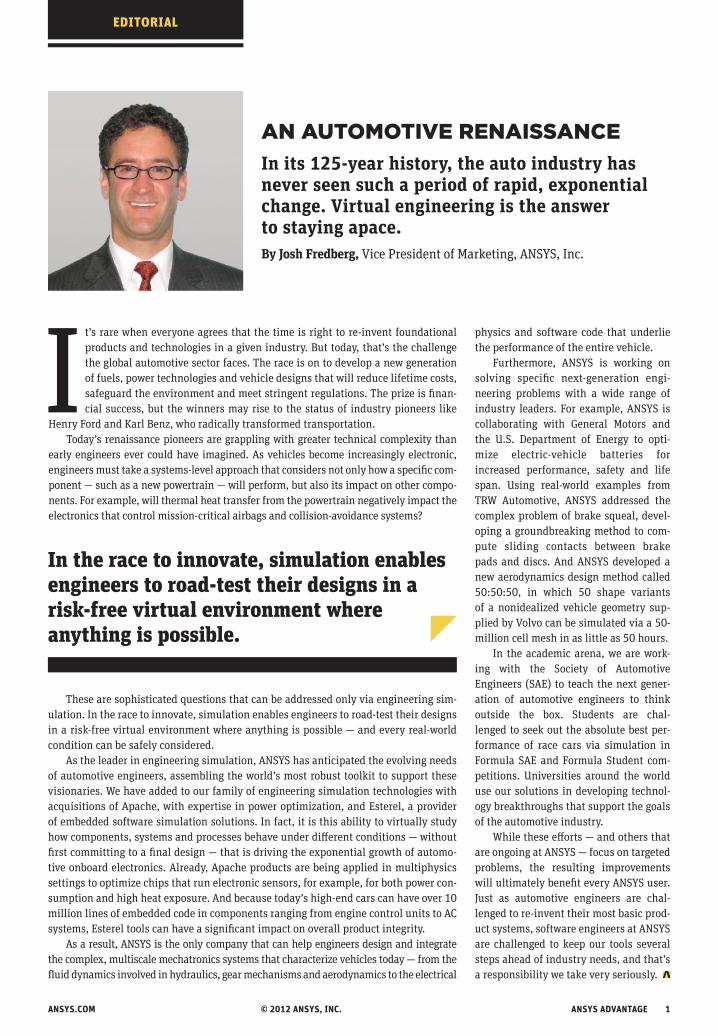
AN AUTOMOTIVE RENAISSANCEIn its 125-year history, the auto industry has never seen such a period of rapid, exponential change. Virtual engineering is the answer to staying apace. By Josh Fredberg, Vice President of Marketing, ANSYS, Inc.
I t’s rare when everyone agrees that the time is right to re-invent foundational products and technologies in a given industry. But today, that’s the challenge the global automotive sector faces. The race is on to develop a new generation of fuels, power technologies and vehicle designs that will reduce lifetime costs, safeguard the environment and meet stringent regulations. The prize is finan-cial success, but the winners may rise to the status of industry pioneers like
Henry Ford and Karl Benz, who radically transformed transportation.Today’s renaissance pioneers are grappling with greater technical complexity than
early engineers ever could have imagined. As vehicles become increasingly electronic, engineers must take a systems-level approach that considers not only how a specific com-ponent — such as a new powertrain — will perform, but also its impact on other compo-nents. For example, will thermal heat transfer from the powertrain negatively impact the electronics that control mission-critical airbags and collision-avoidance systems?
physics and software code that underlie the performance of the entire vehicle.
Furthermore, ANSYS is working on solving specific next-generation engi-neering problems with a wide range of industry leaders. For example, ANSYS is collaborating with General Motors and the U.S. Department of Energy to opti-mize electric-vehicle batteries for increased performance, safety and life span. Using real-world examples from TRW Automotive, ANSYS addressed the complex problem of brake squeal, devel-oping a groundbreaking method to com-pute sliding contacts between brake pads and discs. And ANSYS developed a new aerodynamics design method called 50:50:50, in which 50 shape variants of a nonidealized vehicle geometry sup-plied by Volvo can be simulated via a 50- million cell mesh in as little as 50 hours.
In the academic arena, we are work-ing with the Society of Automotive Engineers (SAE) to teach the next gener-ation of automotive engineers to think outside the box. Students are chal-lenged to seek out the absolute best per-formance of race cars via simulation in Formula SAE and Formula Student com-petitions. Universities around the world use our solutions in developing technol-ogy breakthroughs that support the goals of the automotive industry.
While these efforts — and others that are ongoing at ANSYS — focus on targeted problems, the resulting improvements will ultimately benefit every ANSYS user. Just as automotive engineers are chal-lenged to re-invent their most basic prod-uct systems, software engineers at ANSYS are challenged to keep our tools several steps ahead of industry needs, and that’s a responsibility we take very seriously.
In the race to innovate, simulation enables engineers to road-test their designs in a risk-free virtual environment where anything is possible.
These are sophisticated questions that can be addressed only via engineering sim-ulation. In the race to innovate, simulation enables engineers to road-test their designs in a risk-free virtual environment where anything is possible — and every real-world condition can be safely considered.
As the leader in engineering simulation, ANSYS has anticipated the evolving needs of automotive engineers, assembling the world’s most robust toolkit to support these visionaries. We have added to our family of engineering simulation technologies with acquisitions of Apache, with expertise in power optimization, and Esterel, a provider of embedded software simulation solutions. In fact, it is this ability to virtually study how components, systems and processes behave under different conditions — without first committing to a final design — that is driving the exponential growth of automo-tive onboard electronics. Already, Apache products are being applied in multiphysics settings to optimize chips that run electronic sensors, for example, for both power con-sumption and high heat exposure. And because today’s high-end cars can have over 10 million lines of embedded code in components ranging from engine control units to AC systems, Esterel tools can have a significant impact on overall product integrity.
As a result, ANSYS is the only company that can help engineers design and integrate the complex, multiscale mechatronics systems that characterize vehicles today — from the fluid dynamics involved in hydraulics, gear mechanisms and aerodynamics to the electrical
2 ANSYS ADVANTAGE Volume VI | Issue 3 | 2012
6BEST PRACTICES
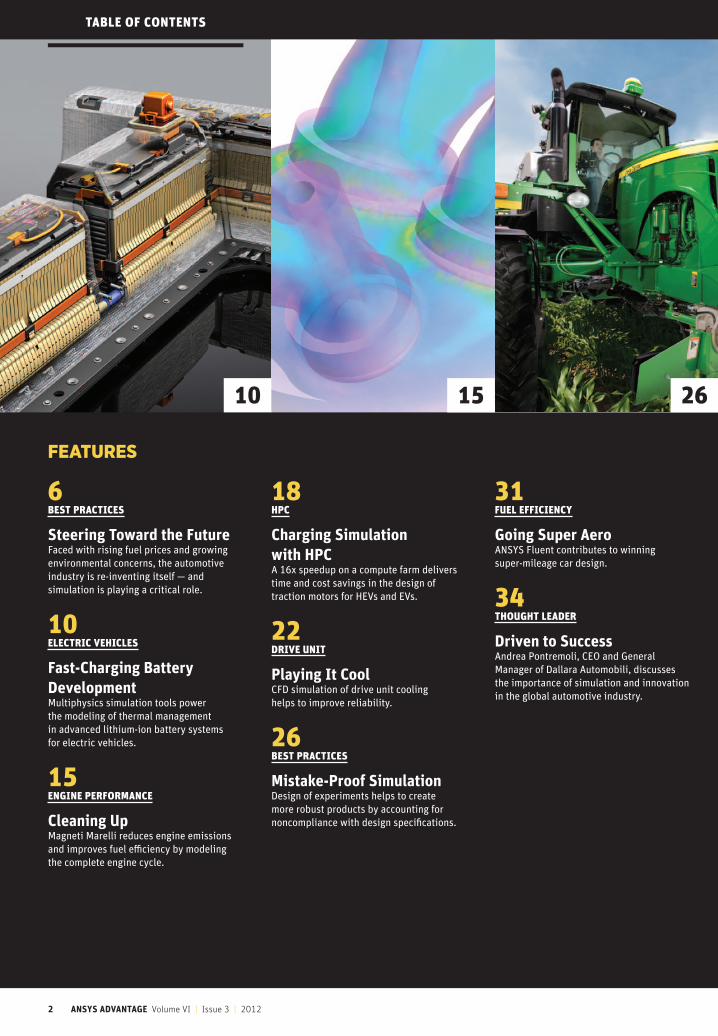
Steering Toward the FutureFaced with rising fuel prices and growing environmental concerns, the automotive industry is re-inventing itself — and simulation is playing a critical role.
10ELECTRIC VEHICLES
Fast-Charging Battery DevelopmentMultiphysics simulation tools power the modeling of thermal management in advanced lithium-ion battery systems for electric vehicles.
15ENGINE PERFORMANCE
Cleaning UpMagneti Marelli reduces engine emissions and improves fuel efficiency by modeling the complete engine cycle.
18HPC
Charging Simulation with HPCA 16x speedup on a compute farm delivers time and cost savings in the design of traction motors for HEVs and EVs.
22DRIVE UNIT
Playing It CoolCFD simulation of drive unit cooling helps to improve reliability.
26BEST PRACTICES
Mistake-Proof SimulationDesign of experiments helps to create more robust products by accounting for noncompliance with design specifications.
31FUEL EFFICIENCY
Going Super AeroANSYS Fluent contributes to winning super-mileage car design.
34THOUGHT LEADER
Driven to SuccessAndrea Pontremoli, CEO and General Manager of Dallara Automobili, discusses the importance of simulation and innovation in the global automotive industry.
10 15 26
FEATURES
TABLE OF CONTENTS

ANSYS.COM © 2012 ANSYS, INC. ANSYS ADVANTAGE 3
38BICYCLING
Going StrongOxylane/Decathlon leverages simulation to design stronger, lighter bike frames in less time.
41MARINE
Deep DiveANSYS software helped in designing a deep-sea submersible to reach the lowest point on earth.
45MATERIALS
Reducing Material CostsR&D reduced material costs for a water container by 10 percent while maintaining product integrity.
49ANALYSIS TOOLS
Smart Products, Smart Engineering SolutionsWith its acquisition of Esterel Technologies, ANSYS extends its capabilities to embedded software simulation and code production — enabling rapid, reliable and cost-effective design of smart product systems.
53ANALYSIS TOOLS
Flow ValidationCFD turbulence models correspond well with experimental values.
56TECH TIP
Understanding Temperature-Dependent DemagnetizationUsing both fluid and electromagnetic simulation can better determine temperature-based demagnetization for permanent magnets used in electric vehicles.
31 34 41
SIMULATION@WORK DEPARTMENTS
ABOUT THE COVERThe driving simulator developed by Dallara Automobili manipulates input from simulation and other sources to allow drivers to navigate a car long before it is built. The simulator also provides other valuable information that is fed back into the design process. Page 34
4 ANSYS ADVANTAGE Volume VI | Issue 3 | 2012
NEWS
DEEPSEA SUBMERSIBLE WINS TOP DESIGN AWARDAustralian Design International www.gooddesignaustralia.comJuly 2012
James Cameron’s submersible, the DEEPSEA CHALLENGER, took top honors at the 2012 Australian International Design Awards. Judges recognized the craft for its innovation, design ingenuity, safety considerations and atten-tion to detail. Four Australian companies partnered with Cameron to design and manufacture the vessel — including Finite Elements, which used ANSYS tools to optimize crucial structural elements. Learn more on page 41.
DRIVETRAIN PROJECT COULD BOOST HEAVY-DUTY VEHICLE EFFICIENCYEngineer Online www.theengineer.co.uk, July 2012
An Energy Technologies Institute project plans to improve efficiency of heavy-duty vehicles by halving the amount of para-sitic losses in the lower drivetrain system. The project will look to improve overall system design, with a focus on gears, bear-ings, surface treatments, lubricant flow and lubricant composition. Project leader Romax Technology selected ANSYS solu-tions for modeling the lubrication system.
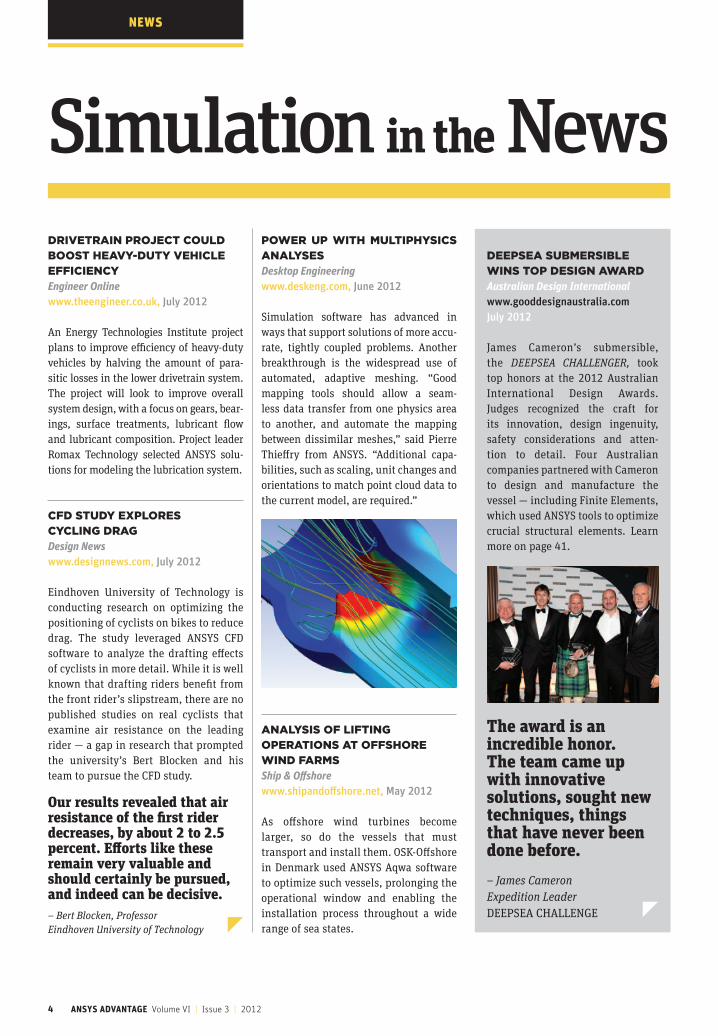
CFD STUDY EXPLORES CYCLING DRAG Design News www.designnews.com, July 2012
Eindhoven University of Technology is conducting research on optimizing the positioning of cyclists on bikes to reduce drag. The study leveraged ANSYS CFD software to analyze the drafting effects of cyclists in more detail. While it is well known that drafting riders benefit from the front rider’s slipstream, there are no published studies on real cyclists that examine air resistance on the leading rider — a gap in research that prompted the university’s Bert Blocken and his team to pursue the CFD study.
POWER UP WITH MULTIPHYSICS ANALYSESDesktop Engineering www.deskeng.com, June 2012
Simulation software has advanced in ways that support solutions of more accu-rate, tightly coupled problems. Another breakthrough is the widespread use of automated, adaptive meshing. “Good mapping tools should allow a seam-less data transfer from one physics area to another, and automate the mapping between dissimilar meshes,” said Pierre Thieffry from ANSYS. “Additional capa-bilities, such as scaling, unit changes and orientations to match point cloud data to the current model, are required.”
ANALYSIS OF LIFTING OPERATIONS AT OFFSHORE WIND FARMSShip & Offshore www.shipandoffshore.net, May 2012
As offshore wind turbines become larger, so do the vessels that must transport and install them. OSK-Offshore in Denmark used ANSYS Aqwa software to optimize such vessels, prolonging the operational window and enabling the installation process throughout a wide range of sea states.
Simulation in the News
The award is an incredible honor. The team came up with innovative solutions, sought new techniques, things that have never been done before.– James Cameron Expedition Leader DEEPSEA CHALLENGE
Our results revealed that air resistance of the first rider decreases, by about 2 to 2.5 percent. Efforts like these remain very valuable and should certainly be pursued, and indeed can be decisive.– Bert Blocken, Professor Eindhoven University of Technology

ANSYS.COM © 2012 ANSYS, INC. ANSYS ADVANTAGE 5
ANSYS ACQUIRES ESTERELAugust 2012
ANSYS completed its acquisition of Esterel Technologies, whose tools simu-late the behavior of embedded software code. The joint solution will enable cus-tomers to gain greater insight into the behavior of the embedded software as it interacts with the overall product. The acquisition, which extends the ANSYS Simulation-Driven Product Development vision to encompass both hardware and software systems, is expected to enable customers to accelerate development and delivery of innovative products — smart products — to the marketplace. Read more about Esterel on page 49.
INNOVATION GAMESSports Illustrated www.sportsillustrated.cnn.comAugust 2012
Few sports events have seen more advances in technology and technique than the Olympics. Speedo, for example, used 3-D mapping (and software from ANSYS) to determine head shape, custom-fitting some Olympians with ultra-sleek caps and goggles that are part of its new, drag-reducing Fastskin3 system.
REVOLUTIONIZING ENGINEERING SCIENCE THROUGH SIMULATIONDrilling and Exploration World Journal www.dewjournal.com, June 2012
Oil and gas industries rely more than ever on advanced technologies to develop reli-able, innovative ways to optimize explora-tion, production, transportation, refining and processing. Ahmad Haidari of ANSYS detailed how virtual engineering “has opened new frontiers, providing unimag-inable solutions that were not thought of until recently.”
COURTESY SWIFT TG SOLUTIONS.
ASSESSING THE IMPACT OF WAVESEngineer Live www.engineerlive.com, June 2012
Environment Canada commissioned Grantec Engineering Consultants to develop a water quality monitoring float designed to carry a sensor for captur-ing environmental data. The firm used ANSYS solutions to minimize drag and ensure stability of the float as well as to develop specifications for the mooring system and structure. Grantec believes that its investment in engineering simu-lation has made a significant addition to its analytical capabilities.
RE-ENGINEERING WITH CONFIDENCEDefense Review www.defensereview.com, June 2012
For military applications, physics-based simulation has been proven to be a valu-able method to measure performance, calculate preferred options, determine appropriate materials and troubleshoot problems virtually. Rob Harwood of ANSYS details the techniques and char-acteristics that differentiate smart engi-neering from engineering approaches that fail to achieve time, cost and qual-ity goals.
DESIGN FOR RELIABILITYEE Times www.eetimes.com, May 2012
Low cost and time to market are critical to the success of OEM IC suppliers today. If a particular failure mechanism cannot be modeled and predicted in an IC, then the
reliability of the system is compromised. Arvind Shanmugavel of Apache Design details how simulation-driven product design, testing and verification sign-off is imperative in this climate.
With today’s multiphysics technologies, creative thinkers and innovative doers, we are one step closer to the golden age of simulation-driven product design!– Arvind Shanmugavel Director of Applications Engineering Apache Design, Inc.
6 ANSYS ADVANTAGE Volume VI | Issue 3 | 2012
By Sandeep Sovani Manager of Global Automotive Strategy, ANSYS, Inc.
Faced with rising fuel prices and growing environmental concerns, the automotive industry is re-inventing itself — and simulation is playing a critical role.
BEST PRACTICES
ANSYS.COM © 2012 ANSYS, INC. ANSYS ADVANTAGE 7
T he global automotive industry faces incredible pressures today. The skyrocketing costs of tra-
ditional fuels — along with worldwide supply uncertainties — are forcing auto-makers to not only increase the effi-ciency of current fuels, but to explore new fuel sources and engine designs that will drive increased efficiency. Last year, in an agreement with U.S. President Barack Obama, 13 leading automakers pledged to increase the average fuel econ-omy of their fleets to 54.5 miles per gal-lon (mpg) by the 2025 model year. With today’s average rate in the United States at 25 mpg, this is a very ambitious target.
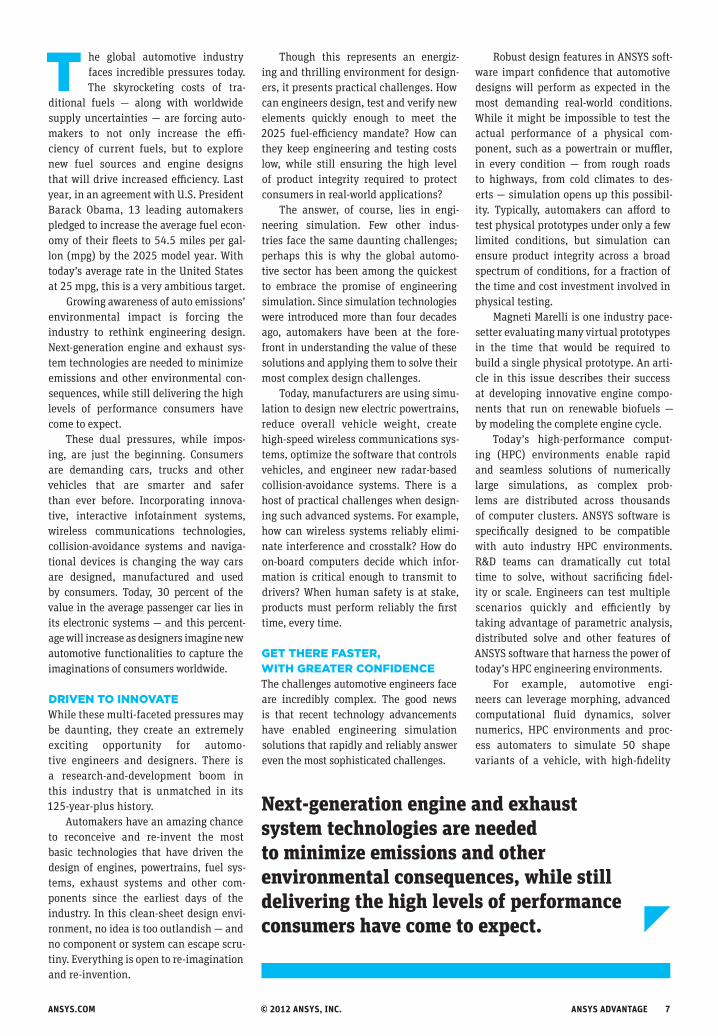
Growing awareness of auto emissions’ environmental impact is forcing the industry to rethink engineering design. Next-generation engine and exhaust sys-tem technologies are needed to minimize emissions and other environmental con-sequences, while still delivering the high levels of performance consumers have come to expect.
These dual pressures, while impos-ing, are just the beginning. Consumers are demanding cars, trucks and other vehicles that are smarter and safer than ever before. Incorporating innova-tive, interactive infotainment systems, wireless communications technologies, collision-avoidance systems and naviga-tional devices is changing the way cars are designed, manufactured and used by consumers. Today, 30 percent of the value in the average passenger car lies in its electronic systems — and this percent-age will increase as designers imagine new automotive functionalities to capture the imaginations of consumers worldwide.
DRIVEN TO INNOVATEWhile these multi-faceted pressures may be daunting, they create an extremely exciting opportunity for automo-tive engineers and designers. There is a research-and-development boom in this industry that is unmatched in its 125-year-plus history.
Automakers have an amazing chance to reconceive and re-invent the most basic technologies that have driven the design of engines, powertrains, fuel sys-tems, exhaust systems and other com-ponents since the earliest days of the industry. In this clean-sheet design envi-ronment, no idea is too outlandish — and no component or system can escape scru-tiny. Everything is open to re-imagination and re-invention.
Though this represents an energiz-ing and thrilling environment for design-ers, it presents practical challenges. How can engineers design, test and verify new elements quickly enough to meet the 2025 fuel-efficiency mandate? How can they keep engineering and testing costs low, while still ensuring the high level of product integrity required to protect consumers in real-world applications?
The answer, of course, lies in engi-neering simulation. Few other indus-tries face the same daunting challenges; perhaps this is why the global automo-tive sector has been among the quickest to embrace the promise of engineering simulation. Since simulation technologies were introduced more than four decades ago, automakers have been at the fore-front in understanding the value of these solutions and applying them to solve their most complex design challenges.
Today, manufacturers are using simu-lation to design new electric powertrains, reduce overall vehicle weight, create high-speed wireless communications sys-tems, optimize the software that controls vehicles, and engineer new radar-based collision-avoidance systems. There is a host of practical challenges when design-ing such advanced systems. For example, how can wireless systems reliably elimi-nate interference and crosstalk? How do on-board computers decide which infor-mation is critical enough to transmit to drivers? When human safety is at stake, products must perform reliably the first time, every time.
GET THERE FASTER, WITH GREATER CONFIDENCEThe challenges automotive engineers face are incredibly complex. The good news is that recent technology advancements have enabled engineering simulation solutions that rapidly and reliably answer even the most sophisticated challenges.
Robust design features in ANSYS soft-ware impart confidence that automotive designs will perform as expected in the most demanding real-world conditions. While it might be impossible to test the actual performance of a physical com-ponent, such as a powertrain or muffler, in every condition — from rough roads to highways, from cold climates to des-erts — simulation opens up this possibil-ity. Typically, automakers can afford to test physical prototypes under only a few limited conditions, but simulation can ensure product integrity across a broad spectrum of conditions, for a fraction of the time and cost investment involved in physical testing.
Magneti Marelli is one industry pace-setter evaluating many virtual prototypes in the time that would be required to build a single physical prototype. An arti-cle in this issue describes their success at developing innovative engine compo-nents that run on renewable biofuels — by modeling the complete engine cycle.
Today’s high-performance comput-ing (HPC) environments enable rapid and seamless solutions of numerically large simulations, as complex prob-lems are distributed across thousands of computer clusters. ANSYS software is specifically designed to be compatible with auto industry HPC environments. R&D teams can dramatically cut total time to solve, without sacrificing fidel-ity or scale. Engineers can test multiple scenarios quickly and efficiently by taking advantage of parametric analysis, distributed solve and other features of ANSYS software that harness the power of today’s HPC engineering environments.
For example, automotive engi-neers can leverage morphing, advanced computational fluid dynamics, solver numerics, HPC environments and proc-ess automaters to simulate 50 shape variants of a vehicle, with high-fidelity
Next-generation engine and exhaust system technologies are needed to minimize emissions and other environmental consequences, while still delivering the high levels of performance consumers have come to expect.
8 ANSYS ADVANTAGE Volume VI | Issue 3 | 2012
BEST PRACTICES
CFD simulations that use a computa-tional mesh of 50 million cells for sim-ulating each design point, in a total elapsed time of 50 hours after initial case setup. Partnerships with processing leaders, such as Intel, have helped ANSYS to bring this kind of speed and power to auto engineers around the world.
ANSYS multiphysics technologies span the breadth of automotive engineer-ing challenges — from the chip level to an entire system, such as a sophisticated electric powertrain. Automotive design encompasses fluid dynamics, structural mechanics, electromagnetics and ther-mal transfer; ANSYS delivers technology leadership in each of these individual physics. Furthermore, and perhaps more critical, ANSYS solutions support the systems-level approach that will help automotive designers meet the aggressive timetable established for truly re-inventing cars, trucks and other vehicles.
Only by looking at vehicles as con-nected systems — instead of as isolated components — can auto designers arrive
at a new generation of products that meet the diverse needs of consumers, envi-ronmental groups and government reg-ulators. Particularly for the new smart cars of the future, designers must ensure that computer chips, circuit boards and antennas interact reliably with such crit-ical components as brake and steering systems — ensuring product integrity and passenger safety.
GREATER PRODUCTIVITYPerhaps more than in any other indus-try, automotive engineers are racing toward the future of their product lines. Engineering simulation is helping organ-izations to amplify their resources and win the race — by making rapid progress at a lower overall investment.
Another article in this issue details how General Motors doubled the pro-ductivity of its engineering team work-ing on an electric vehicle traction motor, combining an HPC environment with the power of ANSYS electromagnetic field simulation software. By performing
simulations across 16 computers, with 32 cores, General Motors reduced its overall solution time by a factor of 16 — from 72 hours to just 4.5 hours.
ANSYS software is designed to be easy and intuitive to use, enabling the democratization of auto engineer-ing, as more diverse employee teams work toward a common goal. Software features such as engineering knowl-edge management and the industry-standard ANSYS Workbench platform enable automotive teams — including OEMs and multi-tier suppliers — to collaborate in a powerful manner, sharing workflows and simulation data.
As user needs in the auto industry (and other sectors) have become more complex, ANSYS has responded by mak-ing significant R&D investments that allow engineers to arrive at faster, higher fidelity, more accurate results with-out increasing their human resources and other product development costs. Product integrity can still be assured, even as companies slash the engineering
Automakers can afford to test physical prototypes under only a few limited conditions. But simulation can ensure product integrity across a broad spectrum of conditions, for a fraction of the time and cost investment involved in physical testing.
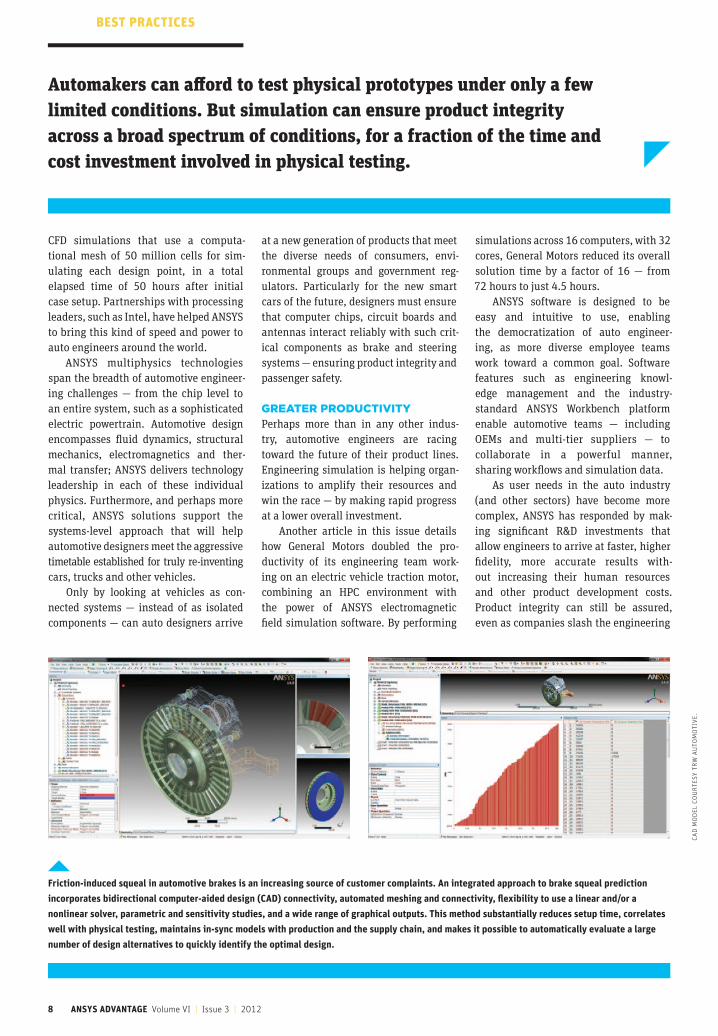
Friction-induced squeal in automotive brakes is an increasing source of customer complaints. An integrated approach to brake squeal prediction incorporates bidirectional computer-aided design (CAD) connectivity, automated meshing and connectivity, flexibility to use a linear and/or a nonlinear solver, parametric and sensitivity studies, and a wide range of graphical outputs. This method substantially reduces setup time, correlates well with physical testing, maintains in-sync models with production and the supply chain, and makes it possible to automatically evaluate a large number of design alternatives to quickly identify the optimal design.
CAD
MO
DEL
CO
URT
ESY
TRW
AU
TOM
OTI
VE.
ANSYS.COM © 2012 ANSYS, INC. ANSYS ADVANTAGE 9
cycle time to arrive at revolutionary new designs before the rest of the industry.
WINNING THE RACEIn this issue of ANSYS Advantage, we showcase still other automotive leaders who are leveraging the power of simu-lation to amplify their resources, turbo-charge their product design efforts, make products safer, and contribute to saving the planet.
In the hybrid electric vehicle sec-tor, General Motors has enlisted a team (which includes ANSYS) to develop com-mercial battery software tools, expecting to accelerate development of next-genera-tion cars. With funding from the National Renewable Energy Laboratory, the proj-ect is focused on breaking the industry’s expensive and time-consuming process of design−build−test−break for prototyping and manufacturing lithium-ion batteries.
Complex structures, such as vehicles, are never 100 percent compliant in the real world. When a design does not take
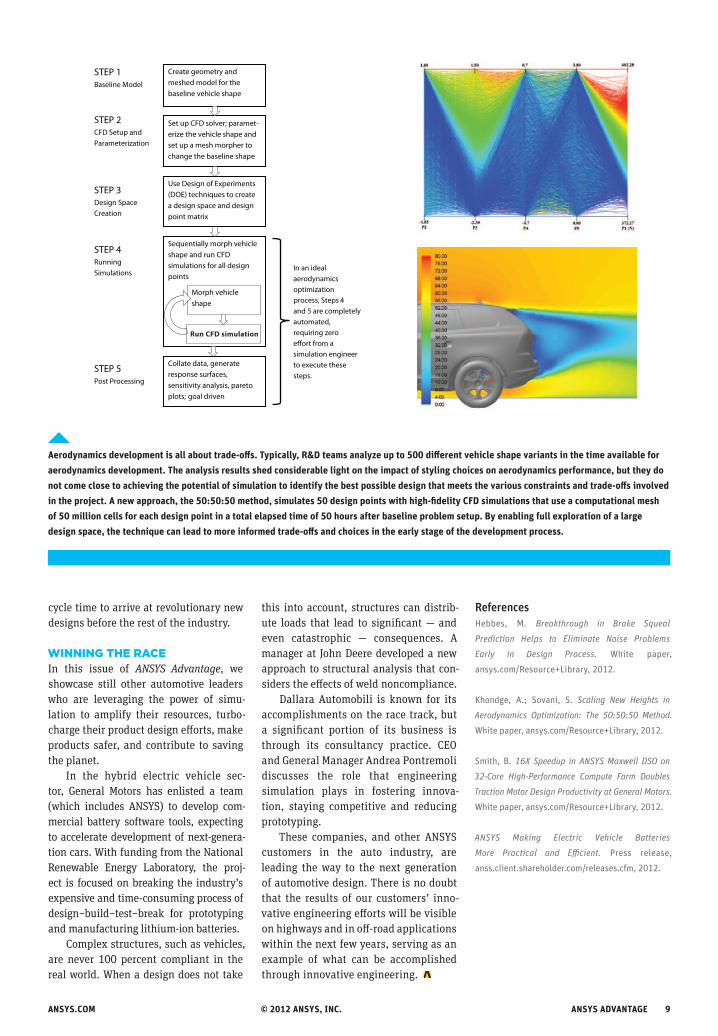
Aerodynamics development is all about trade-offs. Typically, R&D teams analyze up to 500 different vehicle shape variants in the time available for aerodynamics development. The analysis results shed considerable light on the impact of styling choices on aerodynamics performance, but they do not come close to achieving the potential of simulation to identify the best possible design that meets the various constraints and trade-offs involved in the project. A new approach, the 50:50:50 method, simulates 50 design points with high-fidelity CFD simulations that use a computational mesh of 50 million cells for each design point in a total elapsed time of 50 hours after baseline problem setup. By enabling full exploration of a large design space, the technique can lead to more informed trade-offs and choices in the early stage of the development process.
this into account, structures can distrib-ute loads that lead to significant — and even catastrophic — consequences. A manager at John Deere developed a new approach to structural analysis that con-siders the effects of weld noncompliance.
Dallara Automobili is known for its accomplishments on the race track, but a significant portion of its business is through its consultancy practice. CEO and General Manager Andrea Pontremoli discusses the role that engineering simulation plays in fostering innova-tion, staying competitive and reducing prototyping.
These companies, and other ANSYS customers in the auto industry, are leading the way to the next generation of automotive design. There is no doubt that the results of our customers’ inno-vative engineering efforts will be visible on highways and in off-road applications within the next few years, serving as an example of what can be accomplished through innovative engineering.
ReferencesHebbes, M. Breakthrough in Brake Squeal
Prediction Helps to Eliminate Noise Problems
Early in Design Process. White paper,
ansys.com/Resource+Library, 2012.
Khondge, A.; Sovani, S. Scaling New Heights in
Aerodynamics Optimization: The 50:50:50 Method.
White paper, ansys.com/Resource+Library, 2012.
Smith, B. 16X Speedup in ANSYS Maxwell DSO on
32-Core High-Performance Compute Farm Doubles
Traction Motor Design Productivity at General Motors.
White paper, ansys.com/Resource+Library, 2012.
ANSYS Making Electric Vehicle Batteries
More Practical and Efficient. Press release,
anss.client.shareholder.com/releases.cfm, 2012.
STEP 1
Baseline Model
STEP 2
CFD Setup and Parameterization STEP 3
Design Space Creation
STEP 4
Running Simulations
STEP 5 Post Processing
Sequentially morph vehicle shape and run CFD simulations for all design points
Create geometry and meshed model for the baseline vehicle shape
Set up CFD solver; paramet-erize the vehicle shape and set up a mesh morpher to change the baseline shape
Use Design of Experiments (DOE) techniques to create a design space and design point matrix
Morph vehicle shape
Collate data, generate response surfaces, sensitivity analysis, pareto plots; goal driven
In an ideal aerodynamics optimization process, Steps 4 and 5 are completely automated,requiring zero e�ort from a simulation engineer to execute these steps.

ELECTRIC VEHICLES
Fast- ChargingBattery Development
A view of internal mechanisms of lithium-ion battery pack used in Chevy Volt
Multiphysics simulation tools power the modeling of thermal management in advanced lithium-ion battery systems for electric vehicles.
© G
M C
ORP
.
ANSYS.COM © 2012 ANSYS, INC. ANSYS ADVANTAGE 11
W hen the electrically pow-ered “horseless carriage” of William Morrison, a Des
Moines, Iowa, chemist and inventor, was brought to widespread attention at the 1893 Chicago World’s fair, it proved to be hugely influential in early automo-tive history. Capitalizing on the new age of electricity that was being introduced, electric-drive vehicles powered by lead-acid storage batteries rose to mar-ket prominence over the next decade. Thousands of these vehicles were used to carry passengers around cities in North America and Europe. However, limitations of the battery technology combined with lack of recharging infra-structure ultimately led to waning popu-larity by the early 1910s.
Over the past century though, battery-specific energy (watt-hours/kilogram) has improved dramatically, with lithium-ion systems becoming the most popular
in recent years. With concern about emis-sions and the volatile price of gasoline, electric vehicles are again emerging as a viable transportation option, and the U.S. Department of Energy (DOE) is helping to sponsor innovative research to support the technology. One of the goals of DOE’s Vehicle Technologies Program for hybrid electric systems is to, by 2014, reduce the production cost of high-power batter-ies 70 percent from 2009 costs. In addi-tion, to encourage widespread adoption of electric vehicles, the industry must reduce the cost of high-energy batter-ies by a factor of three in the next sev-eral years. The use of battery simulation tools to design batteries and predict their performance is one of the strategies for hitting these targets.
To accelerate the production of safe, reliable, high-performance and long- lasting lithium-ion battery packs, the automotive industry requires simulation
tools that accurately represent cell and pack multiphysics phenomena occur-ring across a wide range of scales. In April 2010, the Vehicle Technologies Program launched the Computer-Aided Engineering for Electric Drive Vehicle Batteries (CAEBAT) activity through DOE’s National Renewable Energy Laboratory (NREL). In response to its own urgent demand for this technology as well as to the CAEBAT program championed by DOE/NREL, General Motors has assembled a project team composed of GM researchers and engineers, ANSYS software develop-ers, and the staff of ESim LLC.
The GM CAEBAT project has two main tasks: cell-level and pack-level design tools development. In partnership with NREL, the project team is working to identify end-user needs and establish requirements, integrate and enhance existing submodels, and perform experi-mental testing to validate the tools. In a third task, the team is creating interfaces to enable these new tools to interact with other current and future battery models.
BATTERY CELL MODELThe objective of the cell-level modeling tool is to predict multiphysics responses
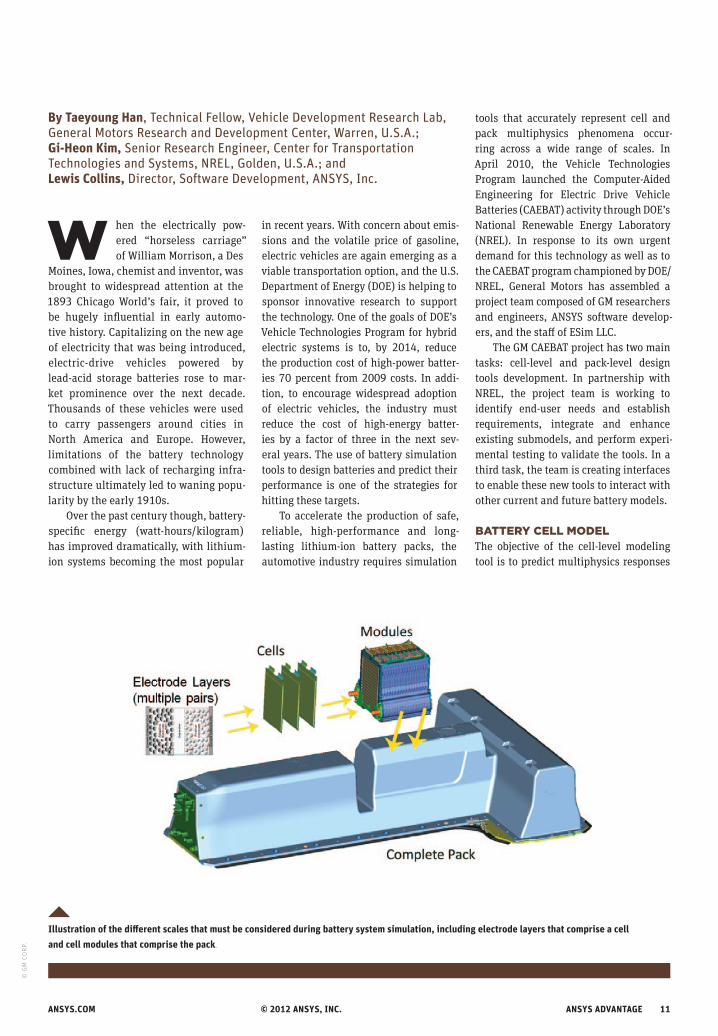
Illustration of the different scales that must be considered during battery system simulation, including electrode layers that comprise a cell and cell modules that comprise the pack.
By Taeyoung Han, Technical Fellow, Vehicle Development Research Lab, General Motors Research and Development Center, Warren, U.S.A.; Gi-Heon Kim, Senior Research Engineer, Center for Transportation Technologies and Systems, NREL, Golden, U.S.A.; and Lewis Collins, Director, Software Development, ANSYS, Inc.
© G
M C
ORP
.
12 ANSYS ADVANTAGE Volume VI | Issue 3 | 2012
of large-format (capacity greater than 5 amp-hours) lithium-ion battery cells. Because temperature greatly affects the performance, safety and life of lithium-ion batteries, automakers and battery suppliers are paying increased attention to thermal management to reduce tem-perature fluctuations. In a battery pack, heating and cooling can create uneven temperature distribution, which in turn leads to electrically unbalanced modules, thus lowering performance and short-ening battery life. For optimal operating conditions, temperature variations need to be minimized across each cell and between cells. If the temperature is too low, the power/energy output is reduced; if too high, cell life is limited.
The proposed cell-level model will provide a seamless connection among electrochemical, thermal and structural responses. The model will demonstrate to engineers how their design changes influence overall cell performance — that is, thermal, electric power, capac-ity, safety, state of charge and life — and internal imbalance within the cell due to spatial variations of current density and temperature. One-dimensional electrode-scale models have proven use-ful to understand the physics — such as electrochemical kinetics, lithium diffu-sion and transport, and charge conser-vation and transport — but a 3-D model is needed for realistic cell geometry that includes cell-level performance. The proj-ect team is collaborating with NREL for the scale coupling between 1-D electrode-scale models with the 3-D cell model.
Battery service life represents one of the greatest uncertainties in the
total lifecycle cost of electric-drive vehi-cles. The complex dependency of the cell capacity on time, temperature, volt-age, number of charge/discharge cycles, electrode microstructure, and depth of discharge is not fully understood and is often neglected in cell models. To simulate cell aging and degradation, the electrode-scale predictions will be enhanced by introducing models that account for capacity fade due to mechan-ical degradation caused by thermal and mechanical stress and loss of active material due to film formation.
BATTERY PACK MODELFrom an automotive OEM perspective, the primary value of battery compu-tational modeling tools is improving the battery pack’s thermal management, which affects many attributes. The goal of a battery thermal management system (TMS) is to maintain a battery pack at an optimum average temperature that oper-ates in surrounding environments rang-ing from -40 C to 50 C (-40 F to 122 F) and to minimize the temperature differ-ence in cells. Lithium-ion batteries oper-ate best at temperatures between 25 C and 35 C (77 F to 95 F), which is currently difficult or expensive to maintain over the wide range of environments expected during normal vehicle operation. Active cooling and heating of the battery pack is a challenge due to constraints on cost, power, weight and volume. Design solu-tions include heat sinks, air jet impinge-ment, micro-channel cooling, heat pipes, immersion cooling and spray cooling, so a simulation tool is needed for trade-off design studies.
At present, though, these concept evaluations and the resulting bat-tery life predictions are based on very time-consuming hardware build-and-test iterations — a process that could be streamlined by using effective pack-level simulation. The fastest way to cre-ate common cell and pack geometries for analysis is to use existing CAD models. For the team’s CAEBAT effort, the geom-etry interfaces capability within ANSYS Workbench is unsurpassed, and the software’s replication and parts-library functions will be helpful when geome-try and properties information must be input manually. The proposed approach is based on the Workbench platform and can handle complex 3-D geometry of
The model will demonstrate how engineering design changes influence overall cell performance.
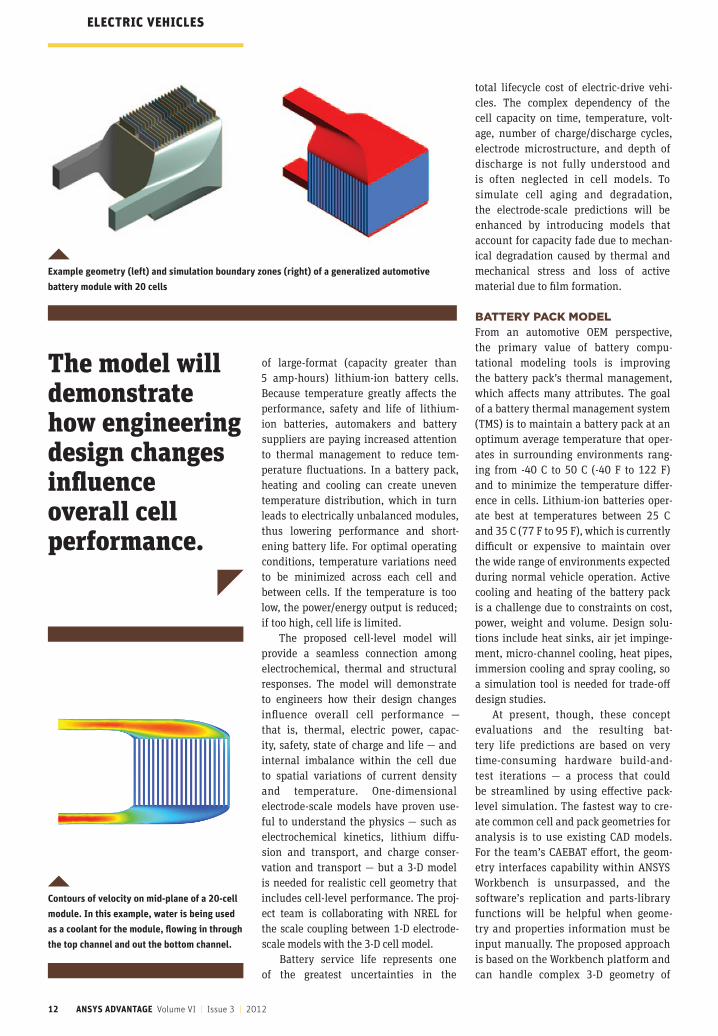
Contours of velocity on mid-plane of a 20-cell module. In this example, water is being used as a coolant for the module, flowing in through the top channel and out the bottom channel.
ELECTRIC VEHICLES
Example geometry (left) and simulation boundary zones (right) of a generalized automotive battery module with 20 cells
ANSYS.COM © 2012 ANSYS, INC. ANSYS ADVANTAGE 13
The proposed approach is based on ANSYS Workbench and can handle complex 3-D geometry of battery cells.
The pack-level tool will combine field simulation from ANSYS Fluent and ANSYS Mechanical, and systems simulation using ANSYS Simplorer, through straightforward run-time coupling, or cosimulation.
battery cells, including current-collector tabs, encapsulation materials and struc-tural support details.
To solve electrochemical–thermal–fluid behavior at cell or module level, it may be appropriate to fully discretize the cell and coolant channels and per-form field simulation. However, direct scaling to the pack level is rarely prac-tical because it is computationally too demanding, particularly with the fluid dynamic complexity of some micro-chan-nel liquid cooling strategies now being considered. Efficient parallel code imple-mentation — a general strength of ANSYS solvers — is helpful in reducing execution times when high-performance comput-ing hardware is available. However, this strategy alone is insufficient, given the desire for rapid acceleration of battery- pack innovation and the associated number of pack-level simulations using conventional desktops and workstations.
Systems simulation offers a com-putationally inexpensive alternative, but the current state of the art relies on relatively uncoupled and simplistic cell representations, such as equivalent- circuit models. As battery power densi-ties increase and thermal issues become more complex, these system simulations have neither the reliability nor the reso-lution necessary to guide pack design. The pack-level tool will, thus, combine field simulation from ANSYS Fluent and ANSYS Mechanical, and systems simu-lation using ANSYS Simplorer, through straightforward run-time coupling, or cosimulation. Additionally, the team will develop innovative reduced-order models (ROMs) that enable field-simulation mod-els to be automatically distilled into a system model with a controllable balance between fidelity and cost.
OPEN-ARCHITECTURE SOFTWARE (OAS) INTERFACEThe project team will contribute to the OAS efforts, part of CAEBAT activity, led by Oak Ridge National Laboratory, and adopt specifications for input and output file formats and standard communication protocols. This will allow the team’s cell- and pack-level tools to exchange infor-mation with tools developed by other CAEBAT teams. The ANSYS Workbench environment and related solvers have anticipated the adaptive software archi-tecture needs; they have been devel-oped from the ground up with the tools and system services for customization as well as interoperability with other CAE players as diverse as Aspen Plus®, CATIA®, CHEMKIN®, Microsoft® Excel®, GT-POWER, Isight, MATLAB®/Simulink®, modeFRONTIER®, MSC Sinda®, TRASYS and SPICE.
ANSYS Workbench can be the back-bone of the entire battery-modeling workflow, and it can also connect peer to peer with other software environ-ments. The project team anticipates that this flexibility will be an asset as ANSYS develops the CAEBAT OAS interfaces and GM demonstrates the ability to select different battery models with different physics solvers and scales. The flexibil-ity will also be vital as GM integrates the newly developed tools into its proprie-tary process automation (PA) engineer-ing environment.
PROCESS AUTOMATION AND ROBUST ENGINEERINGGiven the complexity of the development process in a large organization like GM, it is important to ensure that the vari-ous models used for evaluation and opti-mization are correct and consistent; they
also must represent the most current design in the product development proc-ess. Complementary PA tools will follow after the project’s conclusion to enable rapid and reliable comparison of design alternatives, design exploration, robust assessments and optimization.
PA tools incorporate process guid-ance, which is useful for implement-ing enterprise-wide standardized work. Components of standardized work typically include following modeling guidelines, applying correct boundary conditions for analysis, post-processing and reporting analysis results. This standardized work is essential to assure decision makers that evaluation and reporting of analysis metrics is consis-tently performed. PA and robust engi-neering are proven methodologies in the automotive industry. GM has established these methodologies for the engineering areas of noise and vibration, crash anal-ysis, and body structural optimization. The battery design modeling tool devel-oped in this project can be coupled with a vehicle simulator to evaluate thermal and electrical responses of a particular battery pack for a given power load pro-file associated with a specified vehicle driving condition.
VERIFICATION AND VALIDATIONThe accuracy and usefulness of the pro-posed cell-level tool will be demonstrated through rigorous verification and vali-dation processes. GM will follow a math model validation process developed by the National Institute of Statistical Sciences (NISS). GM will generate the test database for physical verification of the nominal heat source model as
14 ANSYS ADVANTAGE Volume VI | Issue 3 | 2012
well as cell-level electrical and thermal performance.
The project team will use data from thermal characterization with known heat source and thermal boundary conditions for various battery TMS operation condi-tions. The total heat generated from the pack is calculated from coolant inflow and outflow rates and temperatures, sup-plemented by cell or module calorimetry and heat-generation measurement test-ing. Pack-level–specific heat and thermal conductivities are derived from individ-ual cell thermal properties and other elec-trical and electronic equipment onboard the pack. In addition, temperature sensors are placed at every module to monitor hot spots across the pack. This data is crucial for validating the coolant flow field around the battery pack.
CONCLUSIONSimulation tools are essential for devel-oping the next generation of battery cells and packs for electric-drive vehi-cles. At the pack level, the state of the art will be significantly advanced by using innovative ROMs, derived and calibrated from the cell-level models and carefully validated through experi-ment. The project team is incorporating the latest advances in battery model-ing research with software tools that are unsurpassed in their ease of use and workflow automation for robust design optimization. With a strong plan for rapid deployment to the industry, these proj-ect results will help to accomplish the ultimate goal of accelerating the pace of battery innovation and development for future electric-drive vehicles.
The project will help to accomplish the ultimate goal: accelerating the pace of battery innovation and development for future electric-drive vehicles.
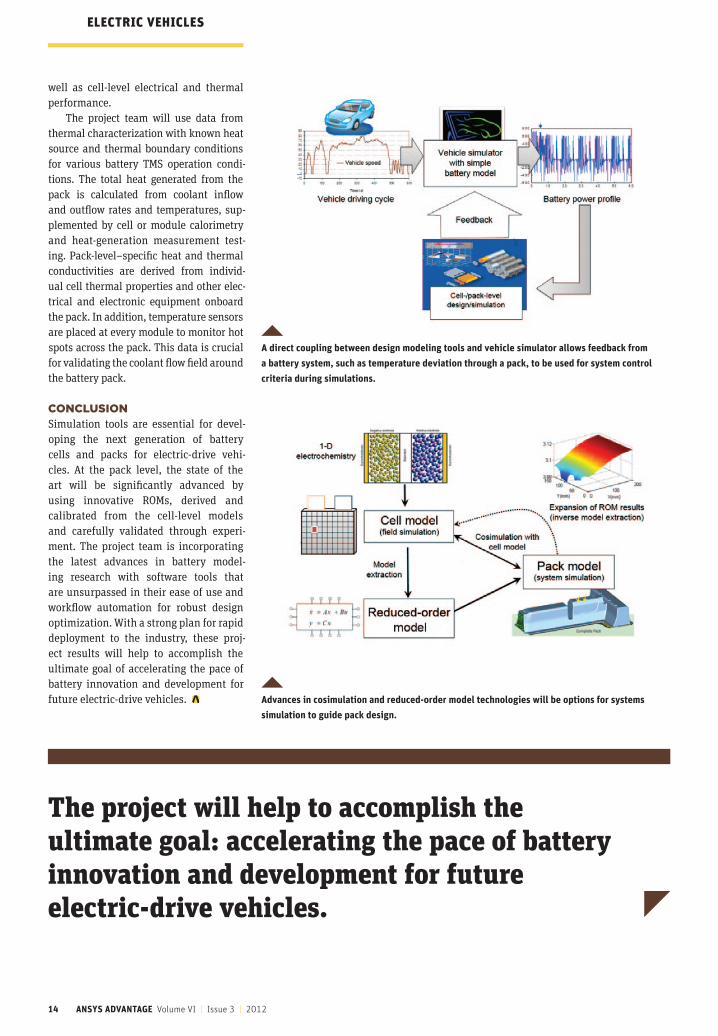
A direct coupling between design modeling tools and vehicle simulator allows feedback from a battery system, such as temperature deviation through a pack, to be used for system control criteria during simulations.
Advances in cosimulation and reduced-order model technologies will be options for systems simulation to guide pack design.
ELECTRIC VEHICLES
ANSYS.COM © 2012 ANSYS, INC. ANSYS ADVANTAGE 15
CLEANING UPMagneti Marelli reduces engine emissions and improves fuel efficiency by modeling the complete engine cycle.
ENGINE PERFORMANCE
I n 2009, the European Union rati-fied the Renewable Energy Directive (RED), which requires that 10 per-
cent of motor vehicles run on renewable energy by 2020. Biofuels consisting of ethanol or an ethanol blend are one of the most practical renewal fuels for motor vehicles. In Brazil, the use of biofuel is already common; but most current vehicle engines do not deliver optimal performance, fuel economy or exhaust emissions with biofuels.
Magneti Marelli, a leading supplier of automotive components and systems around the world, is working to develop fuel injection systems that will improve
the performance of existing engines run-ning on biofuels. An Italian–Brazilian Magneti Marelli team is working with the support of ANSYS to use 3-D compu-tational fluid dynamics (CFD) to simu-late the complex operation of an internal combustion engine (ICE) to evaluate many virtual prototypes in the time that would be required to build a single phys-ical prototype.
ADVANCED CFD TECHNOLOGY FOR PORT FUEL INJECTION ENGINES USING BIOFUELSSimulation of an internal combustion engine analysis is time consuming and
complex, and obtaining accurate results requires an appropriate simulation tool and engineering expertise. Increasingly complex control systems make it more difficult than ever to predict in-cylinder mixture formation, combustion and emission in these engines. Acceptable resolution of the engine flow and com-bustion requires large hybrid meshes for each configuration with associated com-puting overheads. Once the analysis has been set up, it takes many hours or days of computing to solve the model and eval-uate the results. The results include large data sets that require considerable time and effort to evaluate and then generate
By Nazario Bellato, Simulation Manager Magneti Marelli Powertrain S.p.A. Bologna, Italy
16 ANSYS ADVANTAGE Volume VI | Issue 3 | 2012
useful information that can be fed back to the design process. In existing engines, the goal is to improve engine perfor-mance by optimizing the geometry and operating parameters of the air intake manifold and injectors. This requires comparing the analysis results of many different parametric configurations.
FUEL INJECTION SPRAY MODELINGMagneti Marelli engineers have overcome these challenges by combining auto-matic remeshing and parametric anal-ysis methods using ANSYS CFX with a moving mesh to simulate the differ-ent states of the engine cycle, includ-ing fuel injection, spray formation and particle breakup. The most important part of engine simulation is modeling the fuel injection process. This requires accurately modeling the flow in the noz-zle, including cavitation, spray motion, breakup and evaporation, and film for-mation and evaporation. The spray algorithm parameters are tuned with experimental data to obtain satisfactory quantitative prediction, especially when defining a new design or different operat-ing conditions. In spray simulation, the most important characteristics are spray penetration depth and spray angle. The engineering team defines spray pene-tration depth as penetration depth in a specified direction. The spray cone angle is the radial expansion of the spray, measured at the end of the injection
cycle. Predefined post-processing rou-tines allow engineers to make decisions while the simulation is running.
Engineers use fluid dynamics to tune several aspects of fuel injection — the design of the injector, the spray target-ing and the spray–wall interaction. This process is important during combustion mixture formation because wall spray growth and wall film dynamics influence combustion efficiency and pollutant for-mation, especially in port fuel injection engines using biofuel. Fuel deposited on the intake wall creates engine control dif-ficulties because not all the injected fuel moves immediately into the combustion chamber. Fuel sediment is progressively transported to the combustion chamber, making it difficult to control the amount of fuel that is actually injected into the chamber, resulting in reduced engine per-formance and increased fuel consump-tion and emissions. Leading-edge fuel injectors spray fuel directly on a specific zone on the intake valve and its valve rod to reduce liquid film on the intake walls.
Simulation using software from ANSYS can accurately predict mixture formation, breakup phenomena, evapo-ration, and droplet–droplet and wall– droplet interactions, as well as enable the comparison of alternative engine designs with respect to all these differ-ent factors. The workflow within the ANSYS Workbench environment allows Magneti Marelli engineers to automat-ically investigate multiple parametric
design variations. The company uses design of experiments (DOE) to reduce the number of simulation runs needed to explore the complete design space. DOE examines first-order, second-order and multple-factor effects simultaneously with relatively few simulation runs. It is possible to optimize the design with far fewer simulation runs — and with a higher level of certainty and in less time than the traditional one-factor-at-a-time approach.
High turbulence levels facilitate fine mixing and atomization of fuel. One of the most valuable methods for evaluat-ing the turbulence levels is the tumble
Simulation using software from ANSYS can accurately predict mixture formation, breakup phenomena, evaporation, and droplet–droplet and wall–droplet interactions.
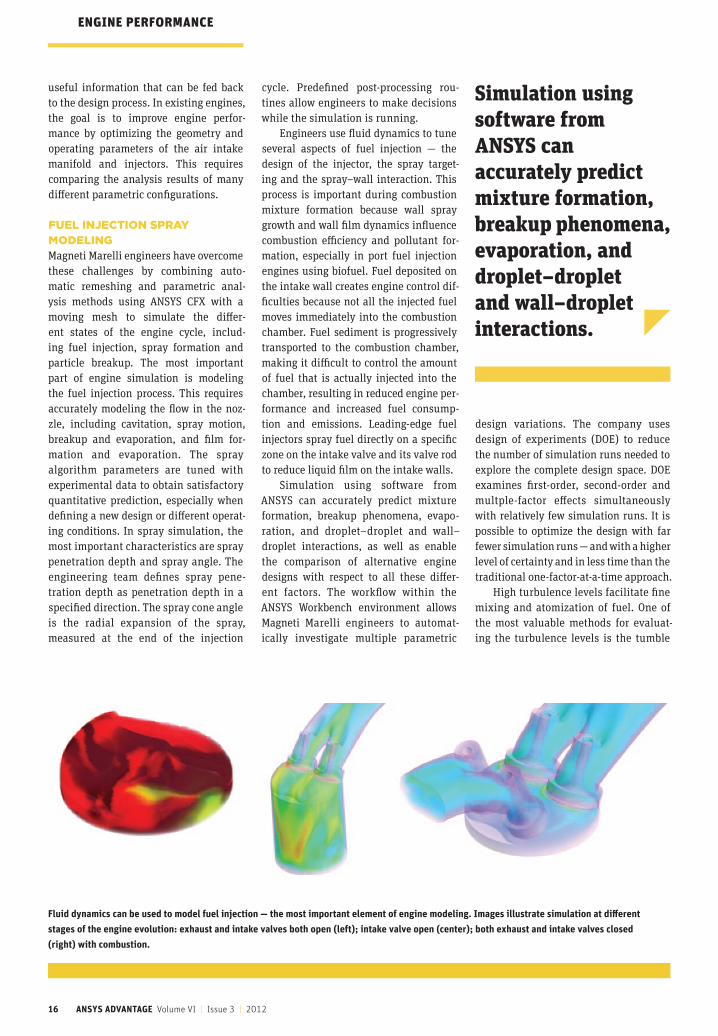
Fluid dynamics can be used to model fuel injection — the most important element of engine modeling. Images illustrate simulation at different stages of the engine evolution: exhaust and intake valves both open (left); intake valve open (center); both exhaust and intake valves closed (right) with combustion.
ENGINE PERFORMANCE
ANSYS.COM © 2012 ANSYS, INC. ANSYS ADVANTAGE 17
ANSYS is helping Magneti Marelli to reduce the time required to develop innovative engine components that improve fuel efficiency and reduce emissions.
index approach. The index quantifies the relative amount of tumbling or swirl-ing flow in the engine. The tumble index is most important at low engine rpm speed, at which it can be difficult to ensure complete combustion and sub-sequent rapid flame propagation. The tumble index can also be used to con-firm that turbulence levels at the end of the compression stage are adequate for combustion. Finally, the index provides an indirect indication of the injector positioning.
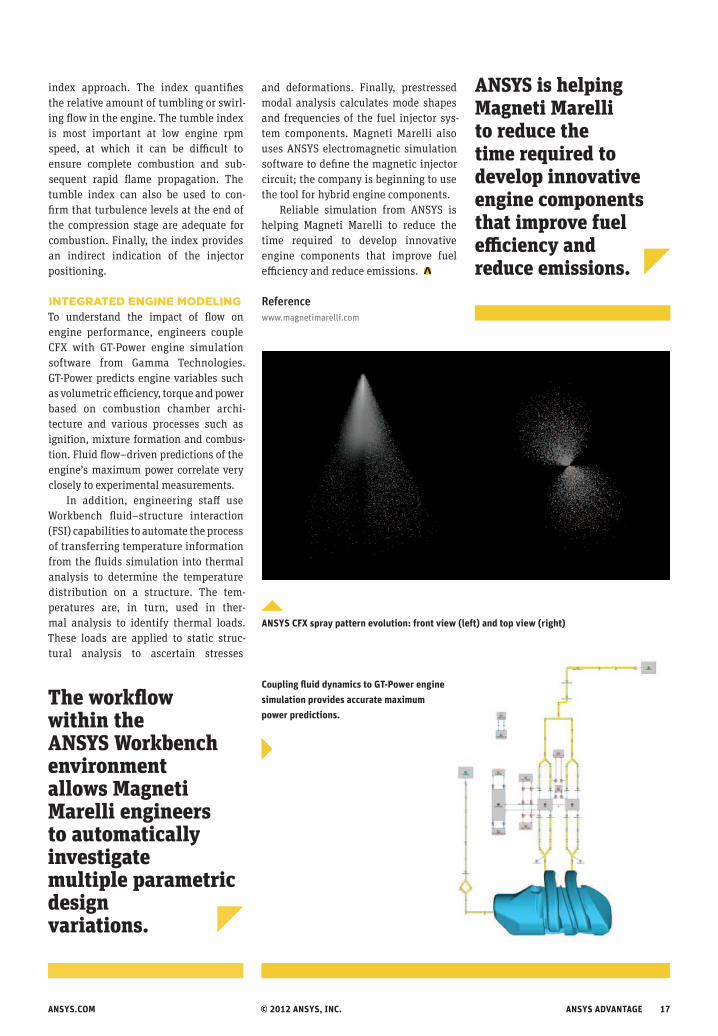
INTEGRATED ENGINE MODELINGTo understand the impact of flow on engine performance, engineers couple CFX with GT-Power engine simulation software from Gamma Technologies. GT-Power predicts engine variables such as volumetric efficiency, torque and power based on combustion chamber archi-tecture and various processes such as ignition, mixture formation and combus-tion. Fluid flow–driven predictions of the engine’s maximum power correlate very closely to experimental measurements.
In addition, engineering staff use Workbench fluid–structure interaction (FSI) capabilities to automate the process of transferring temperature information from the fluids simulation into thermal analysis to determine the temperature distribution on a structure. The tem-peratures are, in turn, used in ther-mal analysis to identify thermal loads. These loads are applied to static struc-tural analysis to ascertain stresses
Coupling fluid dynamics to GT-Power engine simulation provides accurate maximum power predictions.
ANSYS CFX spray pattern evolution: front view (left) and top view (right)
and deformations. Finally, prestressed modal analysis calculates mode shapes and frequencies of the fuel injector sys-tem components. Magneti Marelli also uses ANSYS electromagnetic simulation software to define the magnetic injector circuit; the company is beginning to use the tool for hybrid engine components.
Reliable simulation from ANSYS is helping Magneti Marelli to reduce the time required to develop innovative engine components that improve fuel efficiency and reduce emissions.
Referencewww.magnetimarelli.com
The workflow within the ANSYS Workbench environment allows Magneti Marelli engineers to automatically investigate multiple parametric design variations.
18 ANSYS ADVANTAGE Volume VI | Issue 3 | 2012
The ability to evaluate more design alternatives reduced time to market, reduced manufacturing costs and improved the quality of traction motors.
O ptimizing the design of trac- tion motors that are used to drive electric vehicles (EVs)
and hybrid electric vehicles (HEVs) is challenging because automakers have little experience in this area. Electro-magnetic simulation plays a critical role by evaluating the performance of design concepts: for example, computing the torque profile of the machine. In the past, it took hundreds of hours to perform electromagnetic simulation on a single design iteration, which hurt productivity by leaving engineers waiting for results. To solve this problem, General Motors developed a high-performance comput-ing (HPC) environment using surplus hardware. This 32-core compute farm provided a 16-times speedup on electro- magnetic simulation, reducing solution time to less than five hours. The com-pany estimates that the HPC system doubled the productivity of engineers working on traction motor design. In addition, the ability to evaluate more design alternatives reduced time to mar-ket, reduced manufacturing costs, and improved the quality of traction motors.
design by changing basic design param-eters to balance traction motor system performance against its size, weight, cost and interactions with other systems.
By Bradley Smith, HPC Architect General Motors Corporation, Warren, U.S.A.
TRACTION MOTOR DESIGN CHALLENGEElectric vehicles and hybrid electric vehi-cles, such as the Chevy Volt, have been rapidly gaining in popularity. A trac-tion motor is a special-purpose elec-tric motor that propels the HEV or EV. Engineers must consider a very wide range of design alternatives to optimize its design. Making the dozens of design decisions that lead to an optimal motor often requires the evaluation of thou-sands or even hundreds of thousands of design iterations.
As with many HEV and EV OEMs, General Motors uses ANSYS Maxwell elec-tromagnetic field simulation software to compute the torque profile of the motor, how the torque ramps up over time in motor mode, and the electrical resistance required to stop the vehicle in regener-ative brake mode. In addition to using Maxwell, the organization applies ANSYS HFSS and ANSYS Q3D Extractor as part of the electromagnetic design process to help address any electromagnetic com-patibility issues that may arise. Based on simulation results, the team modifies the
Charging Simulation with HPCA 16x speedup on a compute farm delivers time and cost savings in the design of traction motors for HEVs and EVs.
HPC
ANSYS.COM © 2012 ANSYS, INC. ANSYS ADVANTAGE 19
Making the dozens of design decisions that lead to an optimal motor often requires the evaluation of thousands or even hundreds of thousands of design iterations.
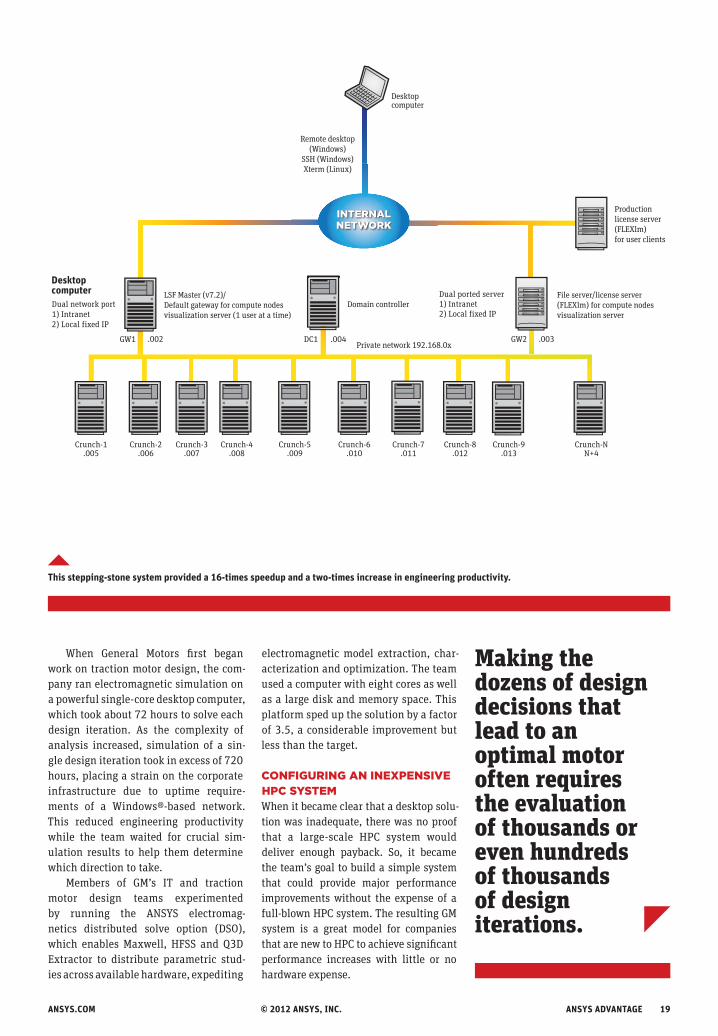
When General Motors first began work on traction motor design, the com-pany ran electromagnetic simulation on a powerful single-core desktop computer, which took about 72 hours to solve each design iteration. As the complexity of analysis increased, simulation of a sin-gle design iteration took in excess of 720 hours, placing a strain on the corporate infrastructure due to uptime require-ments of a Windows®-based network. This reduced engineering productivity while the team waited for crucial sim-ulation results to help them determine which direction to take.
Members of GM’s IT and traction motor design teams experimented by running the ANSYS electromag-netics distributed solve option (DSO), which enables Maxwell, HFSS and Q3D Extractor to distribute parametric stud-ies across available hardware, expediting
electromagnetic model extraction, char-acterization and optimization. The team used a computer with eight cores as well as a large disk and memory space. This platform sped up the solution by a factor of 3.5, a considerable improvement but less than the target.
CONFIGURING AN INEXPENSIVE HPC SYSTEMWhen it became clear that a desktop solu-tion was inadequate, there was no proof that a large-scale HPC system would deliver enough payback. So, it became the team’s goal to build a simple system that could provide major performance improvements without the expense of a full-blown HPC system. The resulting GM system is a great model for companies that are new to HPC to achieve significant performance increases with little or no hardware expense.
INTERNALNETWORK
DesktopcomputerDual network port1) Intranet2) Local fixed IP
Crunch-1.005
Crunch-2.006
LSF Master (v7.2)/Default gateway for compute nodesvisualization server (1 user at a time)
Remote desktop(Windows)
SSH (Windows)Xterm (Linux)
Desktop computer
Domain controller
Private network 192.168.0x
File server/license server (FLEXlm) for compute nodes visualization server
Productionlicense server(FLEXlm)for user clients
Crunch-3.007
Crunch-4.008
Crunch-5.009
Crunch-6.010
Crunch-7.011
Crunch-8.012
Crunch-9.013
Crunch-NN+4
.003GW2.004DC1.002GW1
Dual ported server1) Intranet2) Local fixed IP
This stepping-stone system provided a 16-times speedup and a two-times increase in engineering productivity.
20 ANSYS ADVANTAGE Volume VI | Issue 3 | 2012
HPC
HPC does not require the latest or fastest computing hardware to deliver high levels of performance, so, to save money, the team collected outdated rag-tag Hewlett-Packard® desktop computers from the scrap bin as the heart of the new HPC system. Microsoft® Windows® 2008 Server Edition HPC, a stripped-down version of Windows designed to consume fewer hardware resources, served as the operating system. Platform LSF® by Platform Computing (now an IBM com-pany) was used as the parallel task manager and queuing software. The cor-porate FLEXlm™ server that serves pro-duction applications was employed to service the licenses. Licenses are pulled from one central location, which simpli-fies administration and maintenance.
For this stepping-stone approach, it was assumed that no more than two concurrent users would be interfacing with the HPC system at one time. Their jobs would continue after they logged off, and they would need only to log on again to review their results. Two inter-face node computers, each supporting one user, comprised the external inter-face to HPC. The two client machines did not both directly submit jobs to the HPC. Instead, files were loaded onto an HPC storage area and queued by LSF.
There are a number of reasons for this approach. First, client machines can be laptops, which can be disconnected at any time. If this disconnection happens in the middle of simulation, all mapped links are lost, which can lock the simu-lation and eventually create a denial-of-service situation. Second, the amount of traffic required to generate the large out-put files can swamp the link from HPC to the client. Third, post-processing the data on the HPC system would require retransmission of the intermediate data files from the client to HPC.
CONTROLLING SOFTWARE EXPENSESSoftware is the primary expense of an HPC undertaking, but an organiza-tion can minimize costs with careful
planning. For a larger system, with N computers, each with M cores, N(M)-1 licenses of ANSYS Optimetrics soft-ware are needed. Optimetrics auto-mates the design-optimization process for high-performance electronic devices by quickly identifying optimal values for design parameters that satisfy user-specified constraints. N operating sys-tems and N LSF licenses are also required.
For HPC, one must think in terms of both cores per box and boxes. For N cores, there should be about N queues. More queues per core can be used, but one is a good starting point. This means that for an N-core system, N DSO licenses (avail-able in 10 packs at a reduced rate) are required. For an M-box HPC system, M LSF server licenses and one client license per submitting box are needed.
In a typical environment with served licenses, a safe assumption is that 40 per-cent of users will employ the tool at any one time. Engineers can and should learn to execute multiple jobs simultaneously to increase project bandwidth; however, this practice must grow over time, so, for P users, there should be about 0.6 P licenses of both Maxwell and Optimetrics. For this application, HFSS and Q3D Extractor have a lower frequency of usage and can run at about the 0.3 P level each. Maxwell 3-D requires larger memory and processing capacities than Maxwell 2-D. Up to one HPC/MP license per box is required if using Maxwell 3-D. As an alternative, engineers can limit the size of the jobs to the number of CPUs that can be handled by the HPC/MP license.
General Motors utilized a configu-ration with 16 compute nodes in addi-tion to the LSF master gateway, domain controller and license server. The domain controller served as the file server and had 2 TB of disk storage for all the user files. It also operated as the server for the Maxwell files so that it was not necessary
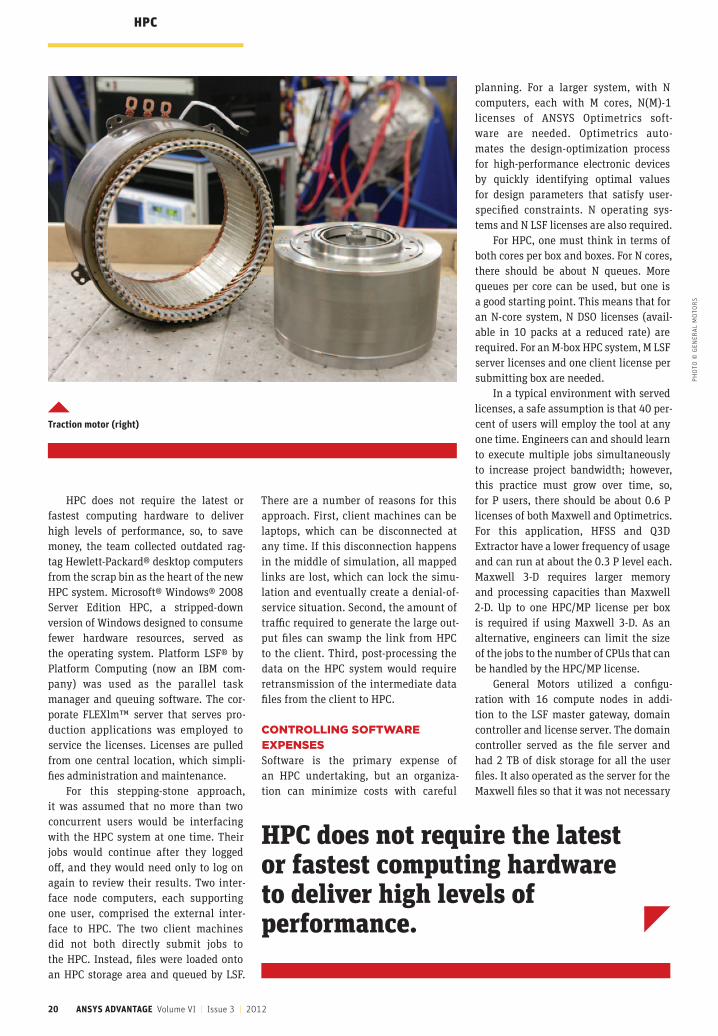
Traction motor (right)
HPC does not require the latest or fastest computing hardware to deliver high levels of performance.
PHO
TO ©
GEN
ERAL
MO
TORS
ANSYS.COM © 2012 ANSYS, INC. ANSYS ADVANTAGE 21
a few boxes or upward to 20. The only hard costs are the software.
For an interesting twist to the stepping-stone system, look at the nodes as individual computers attached to a small company LAN. LSF offers the capa-bility to start jobs and end jobs at given times. So, for a company that normally works 12 hours a day, jobs can be queued during the day and executed on idle machines at night. With this approach, even desktop computers with adequate memory can be used 24 hours per day — 12 hours for daily work and 12 hours for HPC work. This can allow a small com-pany to perform world-class Maxwell parametric electromagnetic analysis for only the license cost. With some of the
“fair-share” features intrinsic in LSF, jobs can be queued during the business day, when desktop hardware becomes available.
HPC combined with the latest gen-eration of analysis tools has led to dra-matic improvements in traction motor design productivity. The GM team was able to achieve major gains with a stepping-stone system using low-cost castaway hardware. For a small organi-zation, this can be used to implement a no-hardware-cost entry into the HPC supercomputing arena.
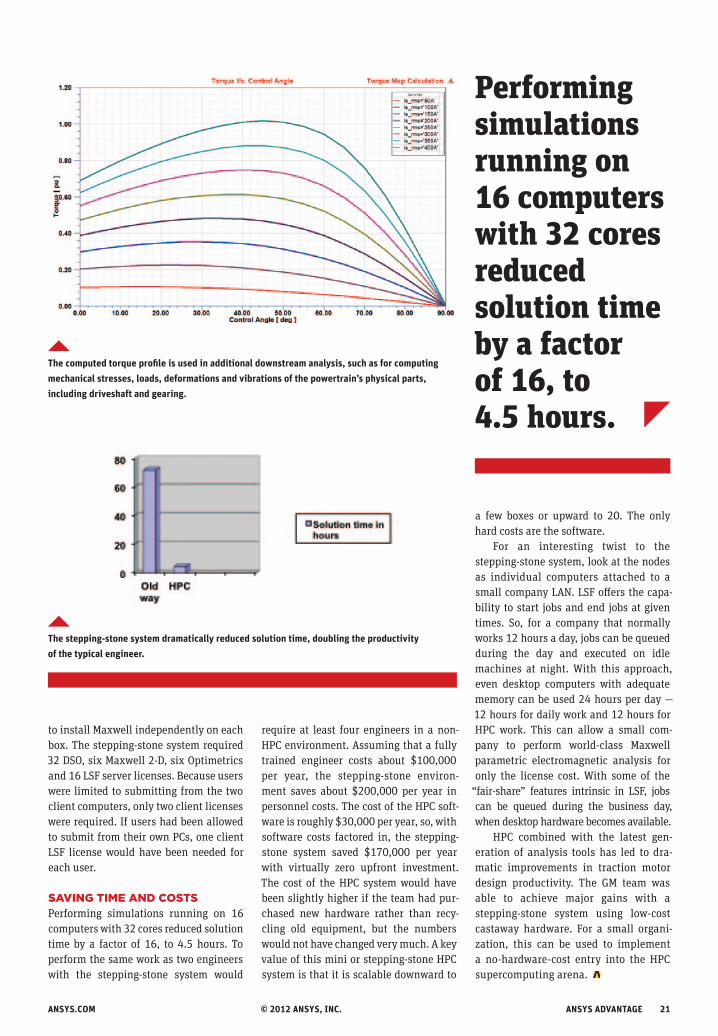
The computed torque profile is used in additional downstream analysis, such as for computing mechanical stresses, loads, deformations and vibrations of the powertrain’s physical parts, including driveshaft and gearing.
The stepping-stone system dramatically reduced solution time, doubling the productivity of the typical engineer.
Performing simulations running on 16 computers with 32 cores reduced solution time by a factor of 16, to 4.5 hours.
to install Maxwell independently on each box. The stepping-stone system required 32 DSO, six Maxwell 2-D, six Optimetrics and 16 LSF server licenses. Because users were limited to submitting from the two client computers, only two client licenses were required. If users had been allowed to submit from their own PCs, one client LSF license would have been needed for each user.
SAVING TIME AND COSTSPerforming simulations running on 16 computers with 32 cores reduced solution time by a factor of 16, to 4.5 hours. To perform the same work as two engineers with the stepping-stone system would
require at least four engineers in a non-HPC environment. Assuming that a fully trained engineer costs about $100,000 per year, the stepping-stone environ-ment saves about $200,000 per year in personnel costs. The cost of the HPC soft-ware is roughly $30,000 per year, so, with software costs factored in, the stepping-stone system saved $170,000 per year with virtually zero upfront investment. The cost of the HPC system would have been slightly higher if the team had pur-chased new hardware rather than recy-cling old equipment, but the numbers would not have changed very much. A key value of this mini or stepping-stone HPC system is that it is scalable downward to
22 ANSYS ADVANTAGE Volume VI | Issue 3 | 2012
T he cooling performance of oil is critical to the functionality and durability of vehicle drive units, such as transmissions and differentials. Traditionally, automotive R&D teams evaluate cooling performance by building proto-types, installing them in a vehicle, and conducting tests in wind tunnels.
The use of free-surface multiphase flow modeling with high-performance computing (HPC) has made it possible to accurately predict oil cooling performance via readily available computing resources. Automotive leader Toyota uses this approach to eval-uate more design alternatives in the early stages of the product development process.
A typical drive unit consists of a case containing rotating internal parts, such as gears and shafts supported by bearings that transmit power. These are surrounded by oil and air. The oil serves various functions, including lubrication, power transmission and cooling. The major heat sources within the drive unit include meshing of the gears, sliding friction between bearings and shafts, and stirring oil as a result of gear move-ment. The heat generated is conveyed to and through the oil to the internal surface of the case; from there, it goes to the case’s external surface and surrounding air. Oil flow
patterns within the transmission are crit-ical to efficient lubrication, power trans-mission and cooling performance, and to avoid negative effects, such as churning loss, in which friction between the oil and gears revolving at high rpm can consume several horsepower.
Simulating the cooling capacity of a drive unit requires predicting internal oil flow patterns involving free surfaces, external air flows, and the complex three-dimensional flows of heat from the oil to the air. A key difficulty is that external air flows can be resolved with sufficient accu-racy only by modeling the entire vehicle,
DRIVE UNIT
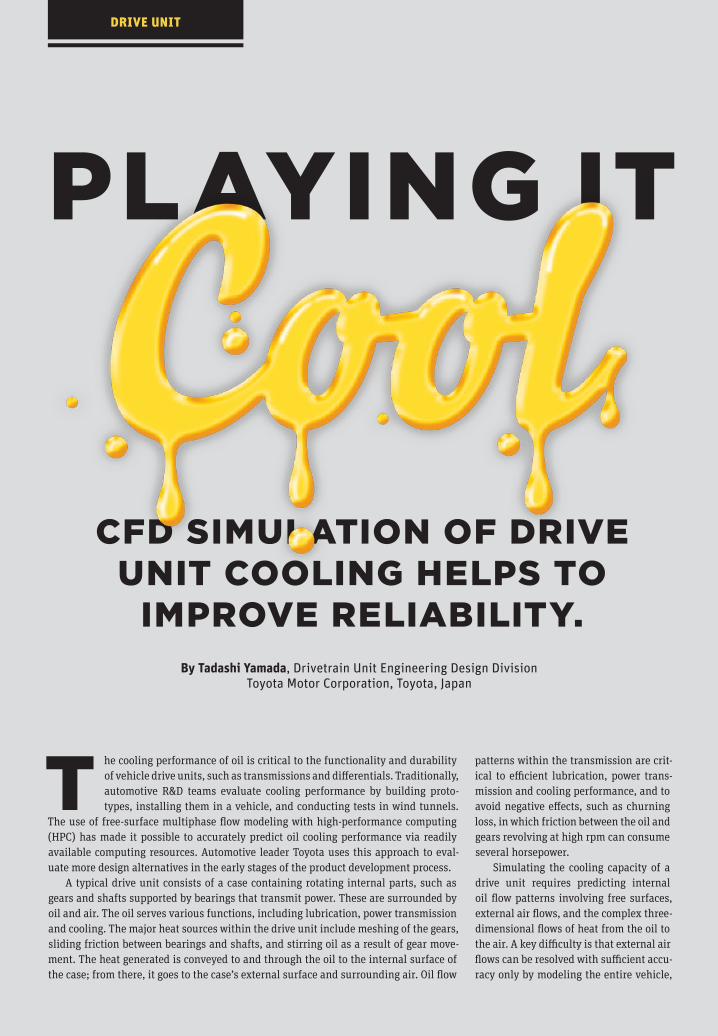
PLAYING IT
CFD SIMULATION OF DRIVE UNIT COOLING HELPS TO
IMPROVE RELIABILITY.By Tadashi Yamada, Drivetrain Unit Engineering Design Division
Toyota Motor Corporation, Toyota, Japan
ANSYS.COM © 2012 ANSYS, INC. ANSYS ADVANTAGE 23
whereas the internal temperature distri-butions must be analyzed for about an hour until a saturation temperature is reached. Until recently, this combination of complex physics, large spatial scale and long duration required such exten-sive computing resources that simula-tion could not be completed within a time frame that would positively affect the design process.
Advancements in physical models and HPC performance in the latest gen-eration of CFD software spurred Toyota engineers to initiate new efforts to simulate oil cooling performance in drive units. A strong coupling approach in which the entire computational domain is formulated is computation-ally very expensive. For this reason, the
internal oil flows and vehicle airflows were simulated separately but coupled to exchange data to determine the entire system’s behavior.
The internal oil flows were solved to obtain the heat transfer coefficients between the internal components and fluids, and between the fluids and the case. The whole-vehicle air flow simula-tions produced heat transfer coefficients between the case and the external air. Toyota engineers used the results of the internal and whole-vehicle simulations along with the heat generation rates of various components as boundary condi-tions for a heat calculation model con-sisting of only solid parts of the unit, with oil temperature as an unknown variable. The model was iterated until it converged
on a solution that achieved energy bal-ance to calculate the temperature distribution of the oil and internal com-ponents. Toyota used ANSYS Fluent to solve the internal fluid flow.
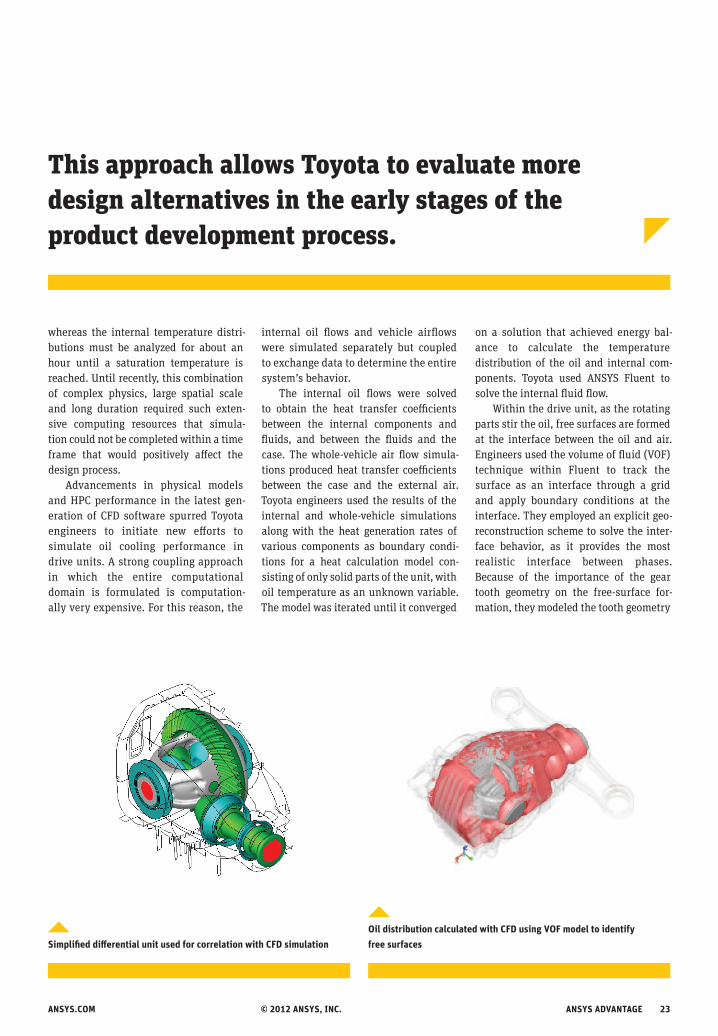
Within the drive unit, as the rotating parts stir the oil, free surfaces are formed at the interface between the oil and air. Engineers used the volume of fluid (VOF) technique within Fluent to track the surface as an interface through a grid and apply boundary conditions at the interface. They employed an explicit geo-reconstruction scheme to solve the inter-face behavior, as it provides the most realistic interface between phases. Because of the importance of the gear tooth geometry on the free-surface for-mation, they modeled the tooth geometry
This approach allows Toyota to evaluate more design alternatives in the early stages of the product development process.
Simplified differential unit used for correlation with CFD simulationOil distribution calculated with CFD using VOF model to identify free surfaces
24 ANSYS ADVANTAGE Volume VI | Issue 3 | 2012
DRIVE UNIT
as accurately as possible, and the compu-tational grids surrounding the gears were rotated using a moving mesh capability.
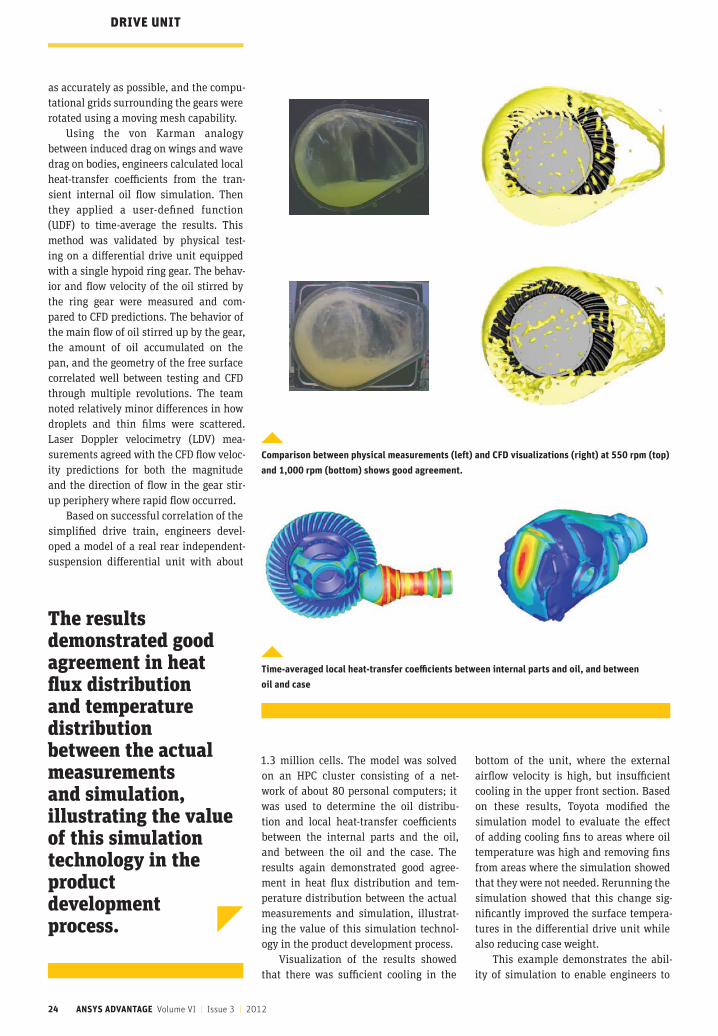
Using the von Karman analogy between induced drag on wings and wave drag on bodies, engineers calculated local heat-transfer coefficients from the tran-sient internal oil flow simulation. Then they applied a user-defined function (UDF) to time-average the results. This method was validated by physical test-ing on a differential drive unit equipped with a single hypoid ring gear. The behav-ior and flow velocity of the oil stirred by the ring gear were measured and com-pared to CFD predictions. The behavior of the main flow of oil stirred up by the gear, the amount of oil accumulated on the pan, and the geometry of the free surface correlated well between testing and CFD through multiple revolutions. The team noted relatively minor differences in how droplets and thin films were scattered. Laser Doppler velocimetry (LDV) mea-surements agreed with the CFD flow veloc-ity predictions for both the magnitude and the direction of flow in the gear stir-up periphery where rapid flow occurred.
Based on successful correlation of the simplified drive train, engineers devel-oped a model of a real rear independent-suspension differential unit with about
Comparison between physical measurements (left) and CFD visualizations (right) at 550 rpm (top) and 1,000 rpm (bottom) shows good agreement.
Time-averaged local heat-transfer coefficients between internal parts and oil, and between oil and case
The results demonstrated good agreement in heat flux distribution and temperature distribution between the actual measurements and simulation, illustrating the value of this simulation technology in the product development process.
1.3 million cells. The model was solved on an HPC cluster consisting of a net-work of about 80 personal computers; it was used to determine the oil distribu-tion and local heat-transfer coefficients between the internal parts and the oil, and between the oil and the case. The results again demonstrated good agree-ment in heat flux distribution and tem-perature distribution between the actual measurements and simulation, illustrat-ing the value of this simulation technol-ogy in the product development process.
Visualization of the results showed that there was sufficient cooling in the
bottom of the unit, where the external airflow velocity is high, but insufficient cooling in the upper front section. Based on these results, Toyota modified the simulation model to evaluate the effect of adding cooling fins to areas where oil temperature was high and removing fins from areas where the simulation showed that they were not needed. Rerunning the simulation showed that this change sig-nificantly improved the surface tempera-tures in the differential drive unit while also reducing case weight.
This example demonstrates the abil-ity of simulation to enable engineers to

ANSYS.COM © 2012 ANSYS, INC. ANSYS ADVANTAGE 25
The team reduced the weight of the drive unit while improving its cooling capacity.
Heat calculation model generated predictions of heat flux distribution and temperatures, which agreed well with measurements.
Surface temperatures were reduced in the model on the right after redistributing cooling fins based on earlier simulation results.
Design changes made with input from CFD simulation maintained the existing optimal oil temperature while significantly reducing case weight.
evaluate design alternatives in a fraction of the time and cost required for physi-cal prototypes. Simulation also provides more diagnostic information than can be obtained from physical testing, such as the ability to determine flow velocity, pressure and temperature at any point in the computational domain. As a result, the team reduced the weight of the drive unit while improving its cooling capacity. In the near future, Toyota plans to extend its simulation capabilities to model other types of drive units and to perform tran-sient simulation, which should offer improved accuracy.
Top Bottom Cross section
26 ANSYS ADVANTAGE Volume VI | Issue 3 | 2012
BEST PRACTICES
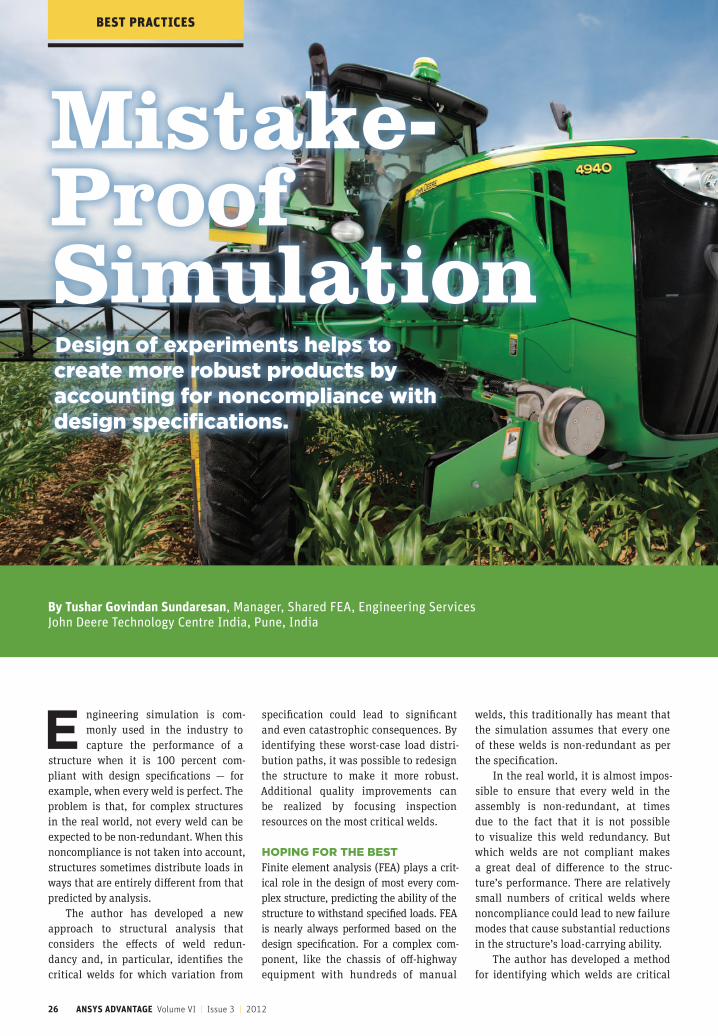
Mistake- Proof SimulationDesign of experiments helps to create more robust products by accounting for noncompliance with design specifications.
By Tushar Govindan Sundaresan, Manager, Shared FEA, Engineering Services John Deere Technology Centre India, Pune, India
E ngineering simulation is com-monly used in the industry to capture the performance of a
structure when it is 100 percent com-pliant with design specifications — for example, when every weld is perfect. The problem is that, for complex structures in the real world, not every weld can be expected to be non-redundant. When this noncompliance is not taken into account, structures sometimes distribute loads in ways that are entirely different from that predicted by analysis.
The author has developed a new approach to structural analysis that considers the effects of weld redun-dancy and, in particular, identifies the critical welds for which variation from
specification could lead to significant and even catastrophic consequences. By identifying these worst-case load distri-bution paths, it was possible to redesign the structure to make it more robust. Additional quality improvements can be realized by focusing inspection resources on the most critical welds.
HOPING FOR THE BESTFinite element analysis (FEA) plays a crit-ical role in the design of most every com-plex structure, predicting the ability of the structure to withstand specified loads. FEA is nearly always performed based on the design specification. For a complex com-ponent, like the chassis of off-highway equipment with hundreds of manual
welds, this traditionally has meant that the simulation assumes that every one of these welds is non-redundant as per the specification.
In the real world, it is almost impos-sible to ensure that every weld in the assembly is non-redundant, at times due to the fact that it is not possible to visualize this weld redundancy. But which welds are not compliant makes a great deal of difference to the struc-ture’s performance. There are relatively small numbers of critical welds where noncompliance could lead to new failure modes that cause substantial reductions in the structure’s load-carrying ability.
The author has developed a method for identifying which welds are critical
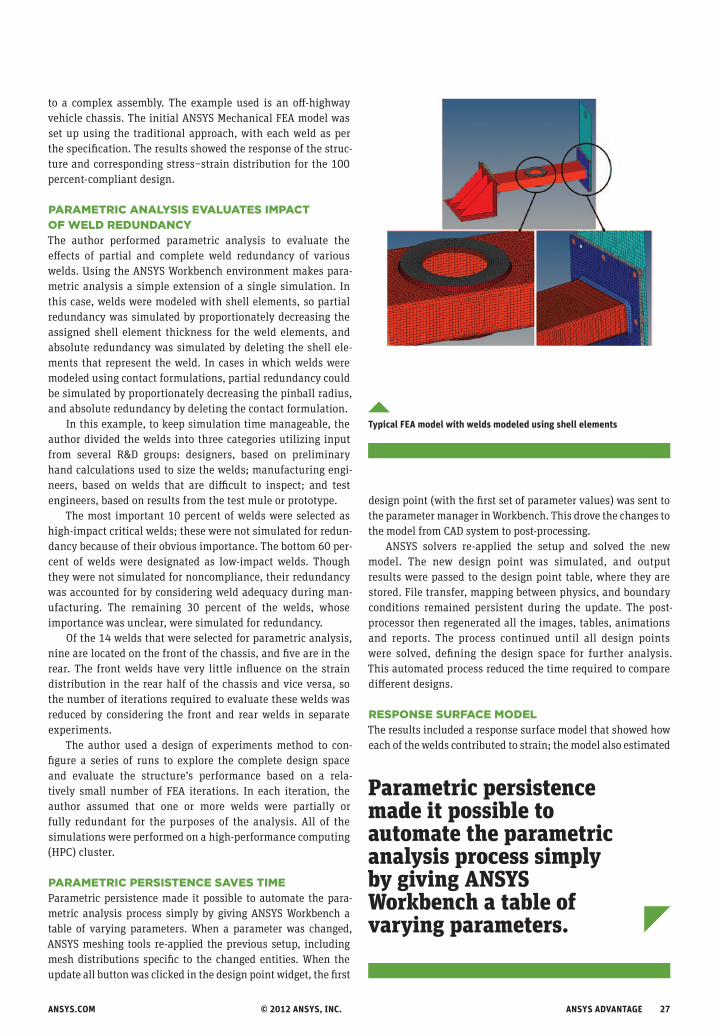
ANSYS.COM © 2012 ANSYS, INC. ANSYS ADVANTAGE 27
Parametric persistence made it possible to automate the parametric analysis process simply by giving ANSYS Workbench a table of varying parameters.
to a complex assembly. The example used is an off-highway vehicle chassis. The initial ANSYS Mechanical FEA model was set up using the traditional approach, with each weld as per the specification. The results showed the response of the struc-ture and corresponding stress−strain distribution for the 100 percent-compliant design.
PARAMETRIC ANALYSIS EVALUATES IMPACT OF WELD REDUNDANCYThe author performed parametric analysis to evaluate the effects of partial and complete weld redundancy of various welds. Using the ANSYS Workbench environment makes para-metric analysis a simple extension of a single simulation. In this case, welds were modeled with shell elements, so partial redundancy was simulated by proportionately decreasing the assigned shell element thickness for the weld elements, and absolute redundancy was simulated by deleting the shell ele-ments that represent the weld. In cases in which welds were modeled using contact formulations, partial redundancy could be simulated by proportionately decreasing the pinball radius, and absolute redundancy by deleting the contact formulation.
In this example, to keep simulation time manageable, the author divided the welds into three categories utilizing input from several R&D groups: designers, based on preliminary hand calculations used to size the welds; manufacturing engi-neers, based on welds that are difficult to inspect; and test engineers, based on results from the test mule or prototype.
The most important 10 percent of welds were selected as high-impact critical welds; these were not simulated for redun-dancy because of their obvious importance. The bottom 60 per-cent of welds were designated as low-impact welds. Though they were not simulated for noncompliance, their redundancy was accounted for by considering weld adequacy during man-ufacturing. The remaining 30 percent of the welds, whose importance was unclear, were simulated for redundancy.
Of the 14 welds that were selected for parametric analysis, nine are located on the front of the chassis, and five are in the rear. The front welds have very little influence on the strain distribution in the rear half of the chassis and vice versa, so the number of iterations required to evaluate these welds was reduced by considering the front and rear welds in separate experiments.
The author used a design of experiments method to con-figure a series of runs to explore the complete design space and evaluate the structure’s performance based on a rela-tively small number of FEA iterations. In each iteration, the author assumed that one or more welds were partially or fully redundant for the purposes of the analysis. All of the simulations were performed on a high-performance computing (HPC) cluster.
PARAMETRIC PERSISTENCE SAVES TIMEParametric persistence made it possible to automate the para-metric analysis process simply by giving ANSYS Workbench a table of varying parameters. When a parameter was changed, ANSYS meshing tools re-applied the previous setup, including mesh distributions specific to the changed entities. When the update all button was clicked in the design point widget, the first
design point (with the first set of parameter values) was sent to the parameter manager in Workbench. This drove the changes to the model from CAD system to post-processing.
ANSYS solvers re-applied the setup and solved the new model. The new design point was simulated, and output results were passed to the design point table, where they are stored. File transfer, mapping between physics, and boundary conditions remained persistent during the update. The post-processor then regenerated all the images, tables, animations and reports. The process continued until all design points were solved, defining the design space for further analysis. This automated process reduced the time required to compare different designs.
RESPONSE SURFACE MODELThe results included a response surface model that showed how each of the welds contributed to strain; the model also estimated
Typical FEA model with welds modeled using shell elements
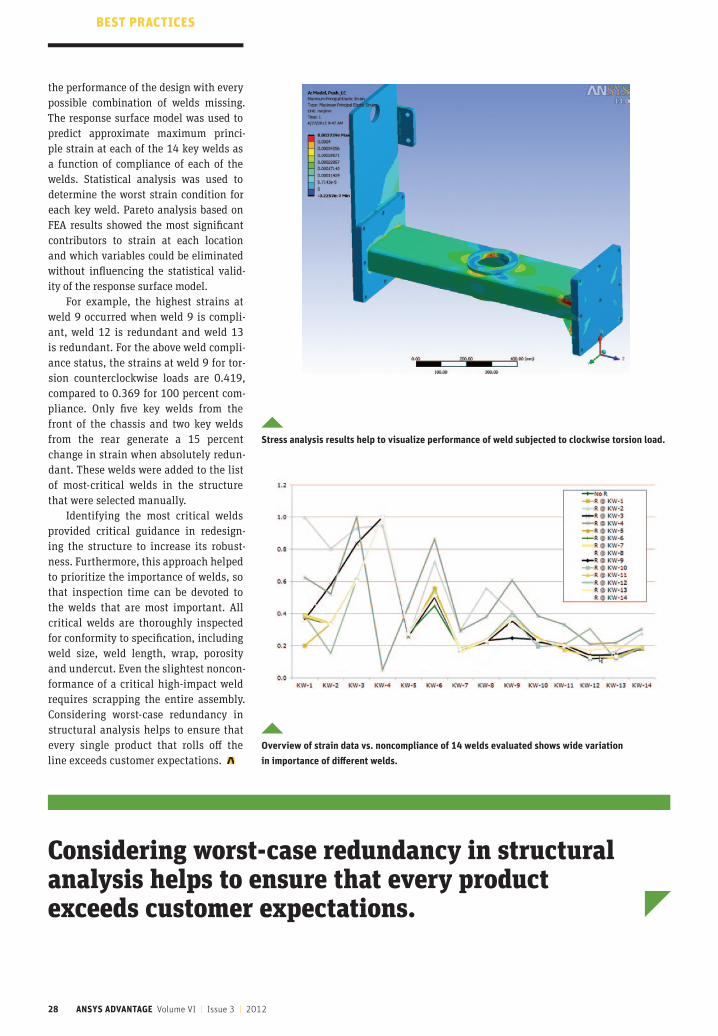
28 ANSYS ADVANTAGE Volume VI | Issue 3 | 2012
BEST PRACTICES
the performance of the design with every possible combination of welds missing. The response surface model was used to predict approximate maximum princi-ple strain at each of the 14 key welds as a function of compliance of each of the welds. Statistical analysis was used to determine the worst strain condition for each key weld. Pareto analysis based on FEA results showed the most significant contributors to strain at each location and which variables could be eliminated without influencing the statistical valid-ity of the response surface model.
For example, the highest strains at weld 9 occurred when weld 9 is compli-ant, weld 12 is redundant and weld 13 is redundant. For the above weld compli-ance status, the strains at weld 9 for tor-sion counterclockwise loads are 0.419, compared to 0.369 for 100 percent com-pliance. Only five key welds from the front of the chassis and two key welds from the rear generate a 15 percent change in strain when absolutely redun-dant. These welds were added to the list of most-critical welds in the structure that were selected manually.
Identifying the most critical welds provided critical guidance in redesign-ing the structure to increase its robust-ness. Furthermore, this approach helped to prioritize the importance of welds, so that inspection time can be devoted to the welds that are most important. All critical welds are thoroughly inspected for conformity to specification, including weld size, weld length, wrap, porosity and undercut. Even the slightest noncon-formance of a critical high-impact weld requires scrapping the entire assembly. Considering worst-case redundancy in structural analysis helps to ensure that every single product that rolls off the line exceeds customer expectations.
Considering worst-case redundancy in structural analysis helps to ensure that every product exceeds customer expectations.
Stress analysis results help to visualize performance of weld subjected to clockwise torsion load.
Overview of strain data vs. noncompliance of 14 welds evaluated shows wide variation in importance of different welds.
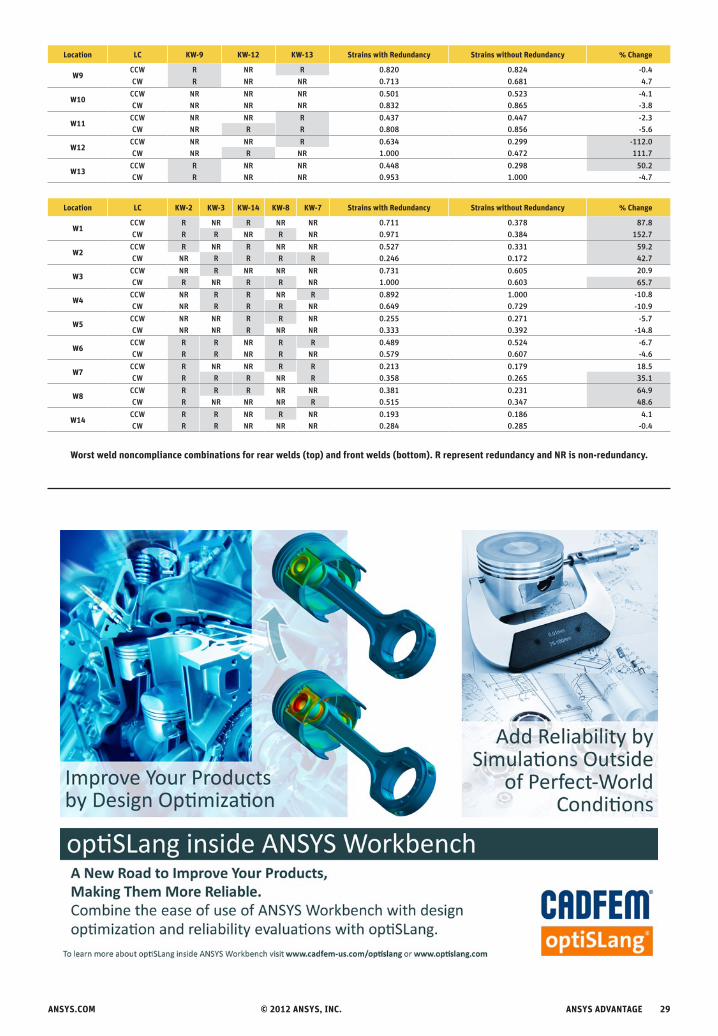
ANSYS.COM © 2012 ANSYS, INC. ANSYS ADVANTAGE 29
Worst weld noncompliance combinations for rear welds (top) and front welds (bottom). R represent redundancy and NR is non-redundancy.
Location LC KW-9 KW-12 KW-13 Strains with Redundancy Strains without Redundancy % Change
W9CCW R NR R 0.820 0.824 -0.4CW R NR NR 0.713 0.681 4.7
W10CCW NR NR NR 0.501 0.523 -4.1CW NR NR NR 0.832 0.865 -3.8
W11CCW NR NR R 0.437 0.447 -2.3CW NR R R 0.808 0.856 -5.6
W12CCW NR NR R 0.634 0.299 -112.0CW NR R NR 1.000 0.472 111.7
W13CCW R NR NR 0.448 0.298 50.2CW R NR NR 0.953 1.000 -4.7
Location LC KW-2 KW-3 KW-14 KW-8 KW-7 Strains with Redundancy Strains without Redundancy % Change
W1CCW R NR R NR NR 0.711 0.378 87.8CW R R NR R NR 0.971 0.384 152.7
W2CCW R NR R NR NR 0.527 0.331 59.2CW NR R R R R 0.246 0.172 42.7
W3CCW NR R NR NR NR 0.731 0.605 20.9CW R NR R R NR 1.000 0.603 65.7
W4CCW NR R R NR R 0.892 1.000 -10.8CW NR R R R NR 0.649 0.729 -10.9
W5CCW NR NR R R NR 0.255 0.271 -5.7CW NR NR R NR NR 0.333 0.392 -14.8
W6CCW R R NR R R 0.489 0.524 -6.7CW R R NR R NR 0.579 0.607 -4.6
W7CCW R NR NR R R 0.213 0.179 18.5CW R R R NR R 0.358 0.265 35.1
W8CCW R R R NR NR 0.381 0.231 64.9CW R NR NR NR R 0.515 0.347 48.6
W14CCW R R NR R NR 0.193 0.186 4.1CW R R NR NR NR 0.284 0.285 -0.4

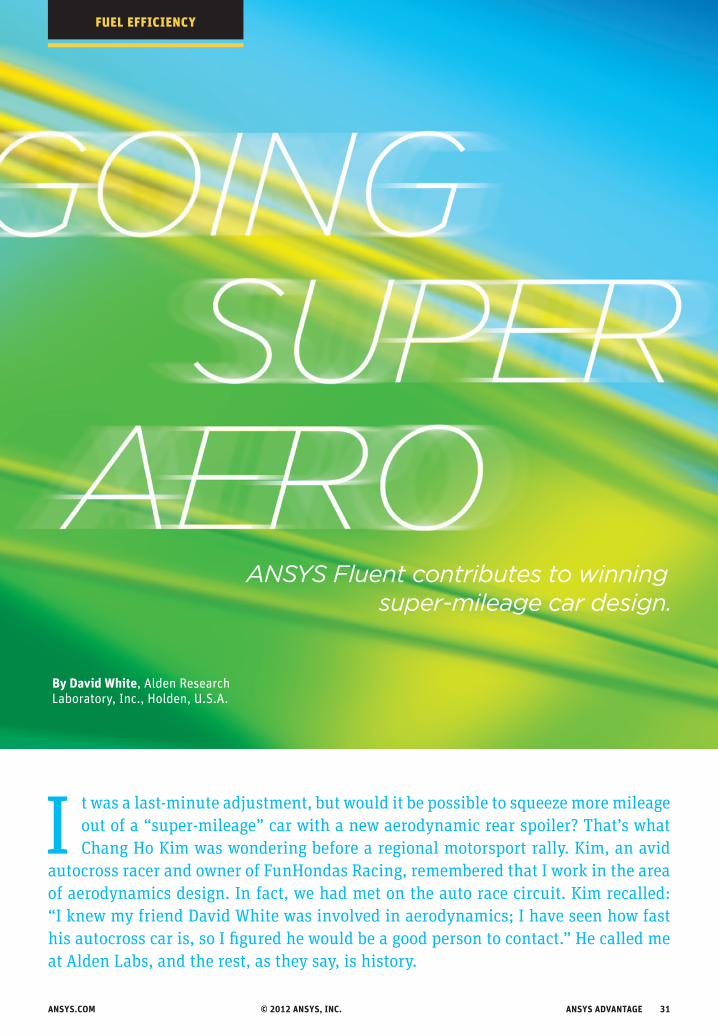
ANSYS.COM © 2012 ANSYS, INC. ANSYS ADVANTAGE 31
FUEL EFFICIENCY
ANSYS Fluent contributes to winning super-mileage car design.
By David White, Alden Research Laboratory, Inc., Holden, U.S.A.
I t was a last-minute adjustment, but would it be possible to squeeze more mileage out of a “super-mileage” car with a new aerodynamic rear spoiler? That’s what Chang Ho Kim was wondering before a regional motorsport rally. Kim, an avid
autocross racer and owner of FunHondas Racing, remembered that I work in the area of aerodynamics design. In fact, we had met on the auto race circuit. Kim recalled: “I knew my friend David White was involved in aerodynamics; I have seen how fast his autocross car is, so I figured he would be a good person to contact.” He called me at Alden Labs, and the rest, as they say, is history.
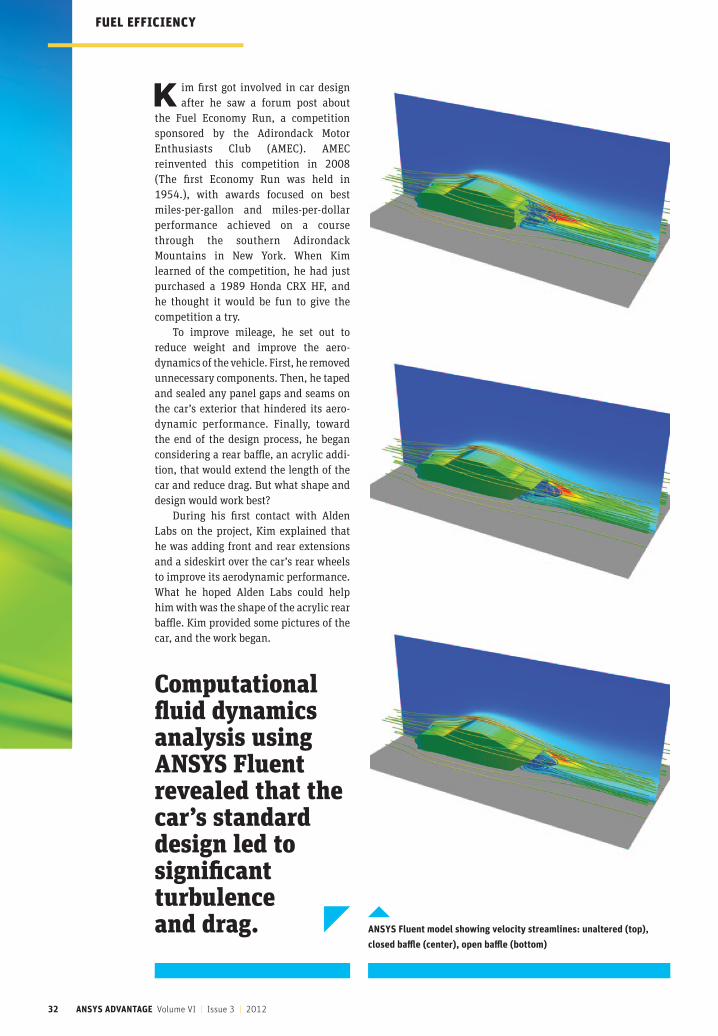
32 ANSYS ADVANTAGE Volume VI | Issue 3 | 2012
K im first got involved in car design after he saw a forum post about
the Fuel Economy Run, a competition sponsored by the Adirondack Motor Enthusiasts Club (AMEC). AMEC reinvented this competition in 2008 (The first Economy Run was held in 1954.), with awards focused on best miles-per-gallon and miles-per-dollar performance achieved on a course through the southern Adirondack Mountains in New York. When Kim learned of the competition, he had just purchased a 1989 Honda CRX HF, and he thought it would be fun to give the competition a try.
To improve mileage, he set out to reduce weight and improve the aero-dynamics of the vehicle. First, he removed unnecessary components. Then, he taped and sealed any panel gaps and seams on the car’s exterior that hindered its aero-dynamic performance. Finally, toward the end of the design process, he began considering a rear baffle, an acrylic addi-tion, that would extend the length of the car and reduce drag. But what shape and design would work best?
During his first contact with Alden Labs on the project, Kim explained that he was adding front and rear extensions and a sideskirt over the car’s rear wheels to improve its aerodynamic performance. What he hoped Alden Labs could help him with was the shape of the acrylic rear baffle. Kim provided some pictures of the car, and the work began.
FUEL EFFICIENCY
ANSYS Fluent model showing velocity streamlines: unaltered (top), closed baffle (center), open baffle (bottom)
Computational fluid dynamics analysis using ANSYS Fluent revealed that the car’s standard design led to significant turbulence and drag.
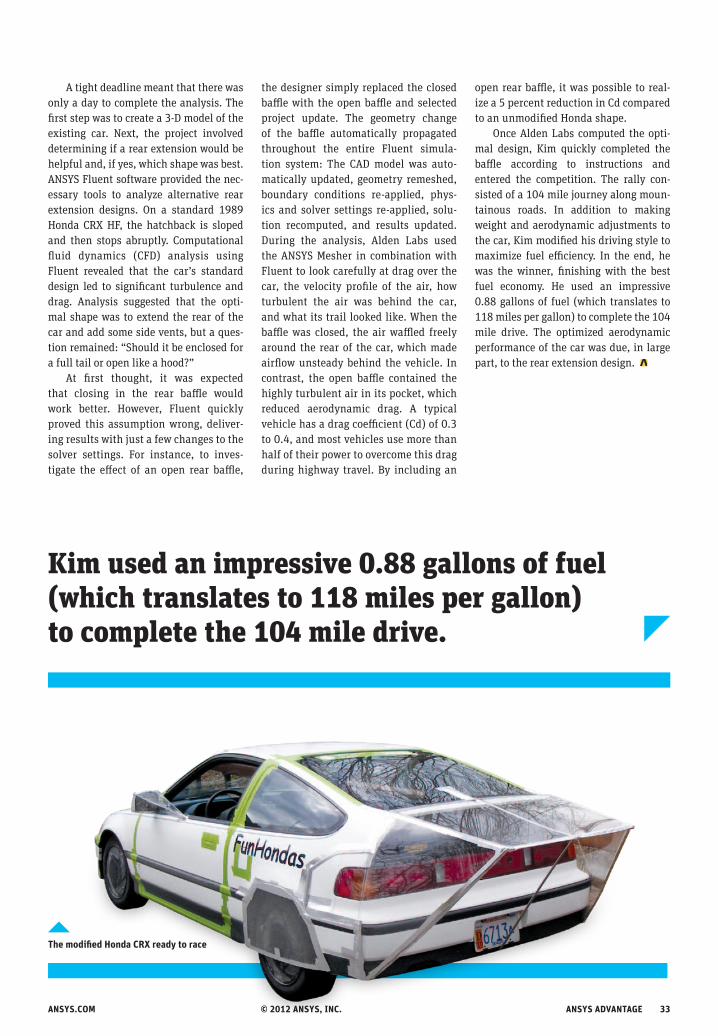
ANSYS.COM © 2012 ANSYS, INC. ANSYS ADVANTAGE 33
The modified Honda CRX ready to race
the designer simply replaced the closed baffle with the open baffle and selected project update. The geometry change of the baffle automatically propagated throughout the entire Fluent simula-tion system: The CAD model was auto-matically updated, geometry remeshed, boundary conditions re-applied, phys-ics and solver settings re-applied, solu-tion recomputed, and results updated. During the analysis, Alden Labs used the ANSYS Mesher in combination with Fluent to look carefully at drag over the car, the velocity profile of the air, how turbulent the air was behind the car, and what its trail looked like. When the baffle was closed, the air waffled freely around the rear of the car, which made airflow unsteady behind the vehicle. In contrast, the open baffle contained the highly turbulent air in its pocket, which reduced aerodynamic drag. A typical vehicle has a drag coefficient (Cd) of 0.3 to 0.4, and most vehicles use more than half of their power to overcome this drag during highway travel. By including an
A tight deadline meant that there was only a day to complete the analysis. The first step was to create a 3-D model of the existing car. Next, the project involved determining if a rear extension would be helpful and, if yes, which shape was best. ANSYS Fluent software provided the nec-essary tools to analyze alternative rear extension designs. On a standard 1989 Honda CRX HF, the hatchback is sloped and then stops abruptly. Computational fluid dynamics (CFD) analysis using Fluent revealed that the car’s standard design led to significant turbulence and drag. Analysis suggested that the opti-mal shape was to extend the rear of the car and add some side vents, but a ques-tion remained: “Should it be enclosed for a full tail or open like a hood?”
At first thought, it was expected that closing in the rear baffle would work better. However, Fluent quickly proved this assumption wrong, deliver-ing results with just a few changes to the solver settings. For instance, to inves-tigate the effect of an open rear baffle,
Kim used an impressive 0.88 gallons of fuel (which translates to 118 miles per gallon) to complete the 104 mile drive.
open rear baffle, it was possible to real-ize a 5 percent reduction in Cd compared to an unmodified Honda shape.
Once Alden Labs computed the opti-mal design, Kim quickly completed the baffle according to instructions and entered the competition. The rally con-sisted of a 104 mile journey along moun-tainous roads. In addition to making weight and aerodynamic adjustments to the car, Kim modified his driving style to maximize fuel efficiency. In the end, he was the winner, finishing with the best fuel economy. He used an impressive 0.88 gallons of fuel (which translates to 118 miles per gallon) to complete the 104 mile drive. The optimized aerodynamic performance of the car was due, in large part, to the rear extension design.
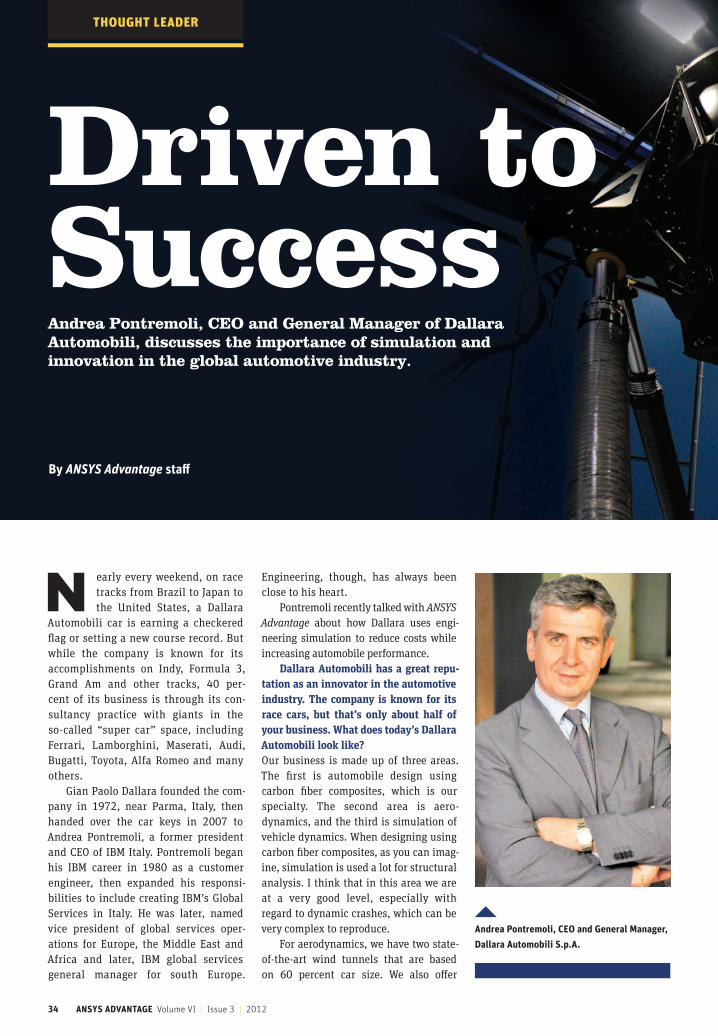
34 ANSYS ADVANTAGE Volume VI | Issue 3 | 2012
N early every weekend, on race tracks from Brazil to Japan to the United States, a Dallara
Automobili car is earning a checkered flag or setting a new course record. But while the company is known for its accomplishments on Indy, Formula 3, Grand Am and other tracks, 40 per-cent of its business is through its con-sultancy practice with giants in the so-called “super car” space, including Ferrari, Lamborghini, Maserati, Audi, Bugatti, Toyota, Alfa Romeo and many others.
Gian Paolo Dallara founded the com-pany in 1972, near Parma, Italy, then handed over the car keys in 2007 to Andrea Pontremoli, a former president and CEO of IBM Italy. Pontremoli began his IBM career in 1980 as a customer engineer, then expanded his responsi-bilities to include creating IBM’s Global Services in Italy. He was later, named vice president of global services oper-ations for Europe, the Middle East and Africa and later, IBM global services general manager for south Europe.
Engineering, though, has always been close to his heart.
Pontremoli recently talked with ANSYS Advantage about how Dallara uses engi-neering simulation to reduce costs while increasing automobile performance.
Dallara Automobili has a great repu-tation as an innovator in the automotive industry. The company is known for its race cars, but that’s only about half of your business. What does today’s Dallara Automobili look like?Our business is made up of three areas. The first is automobile design using carbon fiber composites, which is our specialty. The second area is aero-dynamics, and the third is simulation of vehicle dynamics. When designing using carbon fiber composites, as you can imag-ine, simulation is used a lot for structural analysis. I think that in this area we are at a very good level, especially with regard to dynamic crashes, which can be very complex to reproduce.
For aerodynamics, we have two state-of-the-art wind tunnels that are based on 60 percent car size. We also offer
THOUGHT LEADER
By ANSYS Advantage staff
Driven to SuccessAndrea Pontremoli, CEO and General Manager of Dallara Automobili, discusses the importance of simulation and innovation in the global automotive industry.
Andrea Pontremoli, CEO and General Manager, Dallara Automobili S.p.A.
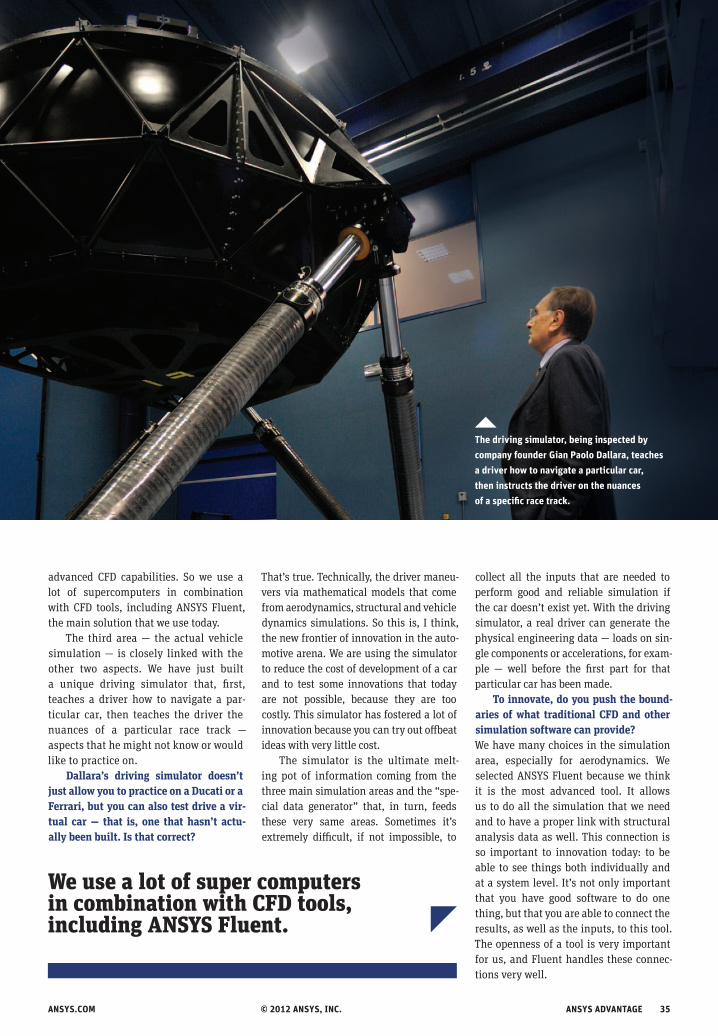
ANSYS.COM © 2012 ANSYS, INC. ANSYS ADVANTAGE 35
We use a lot of super computers in combination with CFD tools, including ANSYS Fluent.
advanced CFD capabilities. So we use a lot of supercomputers in combination with CFD tools, including ANSYS Fluent, the main solution that we use today.
The third area — the actual vehicle simulation — is closely linked with the other two aspects. We have just built a unique driving simulator that, first, teaches a driver how to navigate a par-ticular car, then teaches the driver the nuances of a particular race track — aspects that he might not know or would like to practice on.
Dallara’s driving simulator doesn’t just allow you to practice on a Ducati or a Ferrari, but you can also test drive a vir-tual car — that is, one that hasn’t actu-ally been built. Is that correct?
That’s true. Technically, the driver maneu-vers via mathematical models that come from aerodynamics, structural and vehicle dynamics simulations. So this is, I think, the new frontier of innovation in the auto-motive arena. We are using the simulator to reduce the cost of development of a car and to test some innovations that today are not possible, because they are too costly. This simulator has fostered a lot of innovation because you can try out offbeat ideas with very little cost.
The simulator is the ultimate melt-ing pot of information coming from the three main simulation areas and the “spe-cial data generator” that, in turn, feeds these very same areas. Sometimes it’s extremely difficult, if not impossible, to
collect all the inputs that are needed to perform good and reliable simulation if the car doesn’t exist yet. With the driving simulator, a real driver can generate the physical engineering data — loads on sin-gle components or accelerations, for exam-ple — well before the first part for that particular car has been made.
To innovate, do you push the bound-aries of what traditional CFD and other simulation software can provide?We have many choices in the simulation area, especially for aerodynamics. We selected ANSYS Fluent because we think it is the most advanced tool. It allows us to do all the simulation that we need and to have a proper link with structural analysis data as well. This connection is so important to innovation today: to be able to see things both individually and at a system level. It’s not only important that you have good software to do one thing, but that you are able to connect the results, as well as the inputs, to this tool. The openness of a tool is very important for us, and Fluent handles these connec-tions very well.
The driving simulator, being inspected by company founder Gian Paolo Dallara, teaches a driver how to navigate a particular car, then instructs the driver on the nuances of a specific race track.
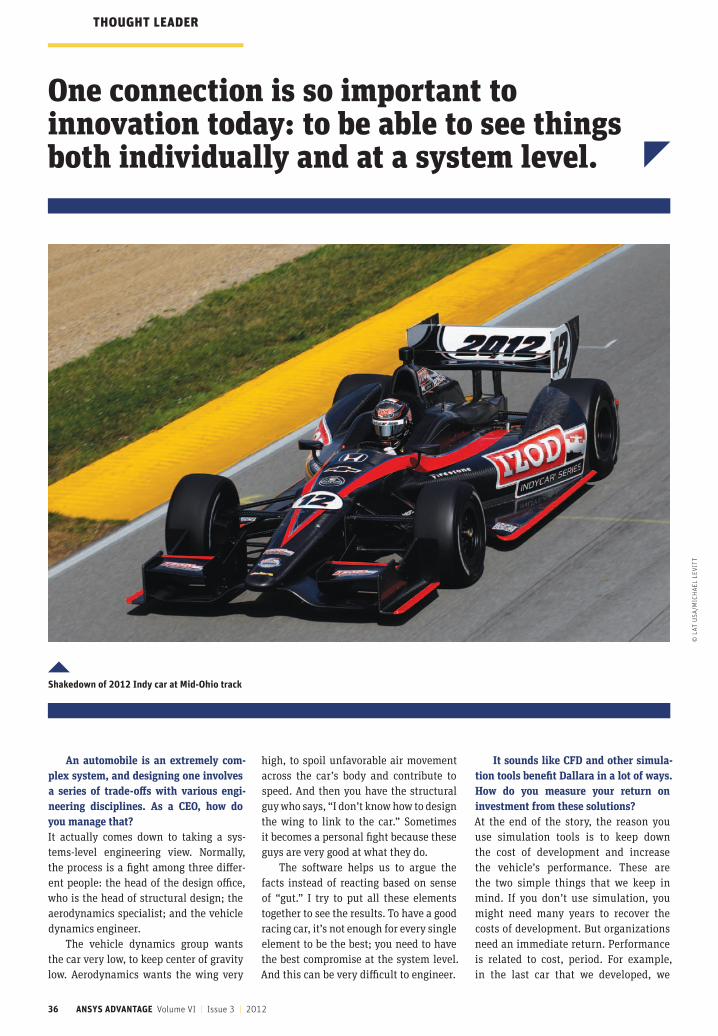
36 ANSYS ADVANTAGE Volume VI | Issue 3 | 2012
An automobile is an extremely com-plex system, and designing one involves a series of trade-offs with various engi-neering disciplines. As a CEO, how do you manage that?It actually comes down to taking a sys-tems-level engineering view. Normally, the process is a fight among three differ-ent people: the head of the design office, who is the head of structural design; the aerodynamics specialist; and the vehicle dynamics engineer.
The vehicle dynamics group wants the car very low, to keep center of gravity low. Aerodynamics wants the wing very
THOUGHT LEADER
Shakedown of 2012 Indy car at Mid-Ohio track
One connection is so important to innovation today: to be able to see things both individually and at a system level.
high, to spoil unfavorable air movement across the car’s body and contribute to speed. And then you have the structural guy who says, “I don’t know how to design the wing to link to the car.” Sometimes it becomes a personal fight because these guys are very good at what they do.
The software helps us to argue the facts instead of reacting based on sense of “gut.” I try to put all these elements together to see the results. To have a good racing car, it’s not enough for every single element to be the best; you need to have the best compromise at the system level. And this can be very difficult to engineer.
It sounds like CFD and other simula-tion tools benefit Dallara in a lot of ways. How do you measure your return on investment from these solutions?At the end of the story, the reason you use simulation tools is to keep down the cost of development and increase the vehicle’s performance. These are the two simple things that we keep in mind. If you don’t use simulation, you might need many years to recover the costs of development. But organizations need an immediate return. Performance is related to cost, period. For example, in the last car that we developed, we
© L
AT U
SA/M
ICH
AEL
LEVI
TT
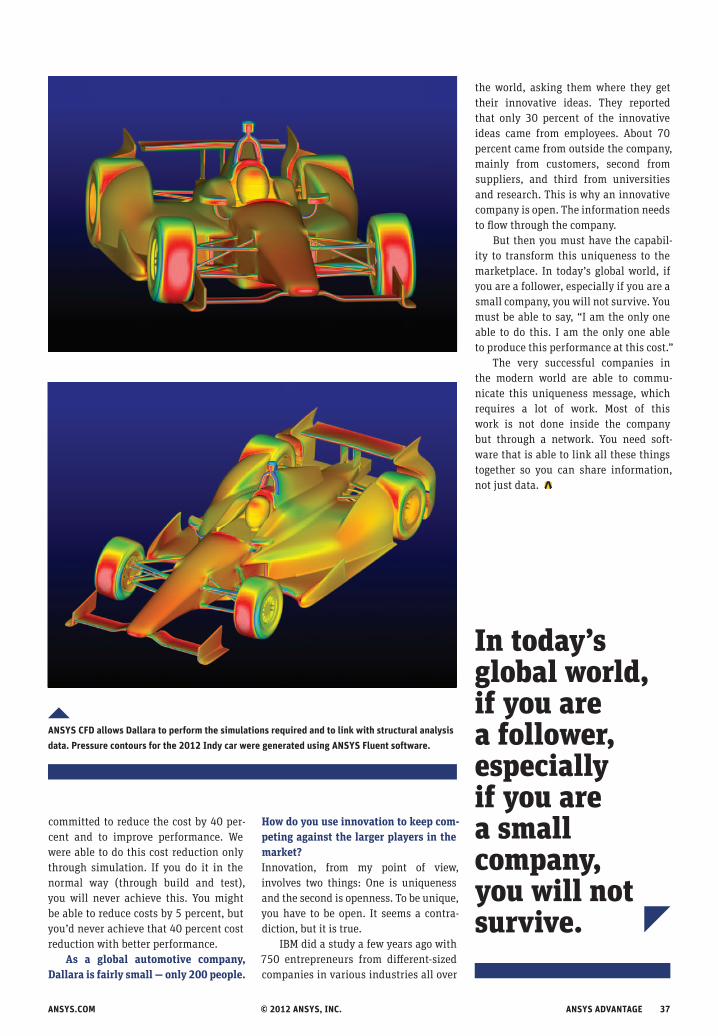
ANSYS.COM © 2012 ANSYS, INC. ANSYS ADVANTAGE 37
In today’s global world, if you are a follower, especially if you are a small company, you will not survive.
ANSYS CFD allows Dallara to perform the simulations required and to link with structural analysis data. Pressure contours for the 2012 Indy car were generated using ANSYS Fluent software.
committed to reduce the cost by 40 per-cent and to improve performance. We were able to do this cost reduction only through simulation. If you do it in the normal way (through build and test), you will never achieve this. You might be able to reduce costs by 5 percent, but you’d never achieve that 40 percent cost reduction with better performance.
As a global automotive company, Dallara is fairly small — only 200 people.
How do you use innovation to keep com-peting against the larger players in the market?Innovation, from my point of view, involves two things: One is uniqueness and the second is openness. To be unique, you have to be open. It seems a contra-diction, but it is true.
IBM did a study a few years ago with 750 entrepreneurs from different-sized companies in various industries all over
the world, asking them where they get their innovative ideas. They reported that only 30 percent of the innovative ideas came from employees. About 70 percent came from outside the company, mainly from customers, second from suppliers, and third from universities and research. This is why an innovative company is open. The information needs to flow through the company.
But then you must have the capabil-ity to transform this uniqueness to the marketplace. In today’s global world, if you are a follower, especially if you are a small company, you will not survive. You must be able to say, “I am the only one able to do this. I am the only one able to produce this performance at this cost.”
The very successful companies in the modern world are able to commu-nicate this uniqueness message, which requires a lot of work. Most of this work is not done inside the company but through a network. You need soft-ware that is able to link all these things together so you can share information, not just data.
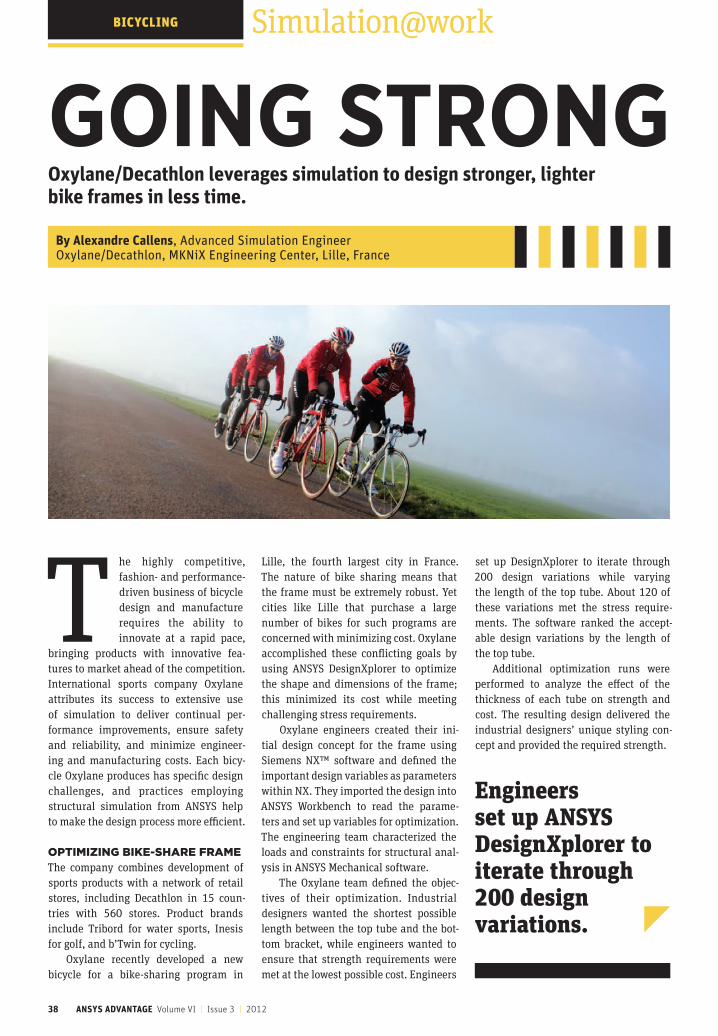
38 ANSYS ADVANTAGE Volume VI | Issue 3 | 2012
BICYCLING Simulation@work
T he highly competitive, fashion- and performance-driven business of bicycle design and manufacture requires the ability to innovate at a rapid pace,
bringing products with innovative fea-tures to market ahead of the competition. International sports company Oxylane attributes its success to extensive use of simulation to deliver continual per-formance improvements, ensure safety and reliability, and minimize engineer-ing and manufacturing costs. Each bicy-cle Oxylane produces has specific design challenges, and practices employing structural simulation from ANSYS help to make the design process more efficient.
OPTIMIZING BIKE-SHARE FRAMEThe company combines development of sports products with a network of retail stores, including Decathlon in 15 coun-tries with 560 stores. Product brands include Tribord for water sports, Inesis for golf, and b’Twin for cycling.
Oxylane recently developed a new bicycle for a bike-sharing program in
Lille, the fourth largest city in France. The nature of bike sharing means that the frame must be extremely robust. Yet cities like Lille that purchase a large number of bikes for such programs are concerned with minimizing cost. Oxylane accomplished these conflicting goals by using ANSYS DesignXplorer to optimize the shape and dimensions of the frame; this minimized its cost while meeting challenging stress requirements.
Oxylane engineers created their ini-tial design concept for the frame using Siemens NX™ software and defined the important design variables as parameters within NX. They imported the design into ANSYS Workbench to read the parame-ters and set up variables for optimization. The engineering team characterized the loads and constraints for structural anal-ysis in ANSYS Mechanical software.
The Oxylane team defined the objec-tives of their optimization. Industrial designers wanted the shortest possible length between the top tube and the bot-tom bracket, while engineers wanted to ensure that strength requirements were met at the lowest possible cost. Engineers
GOING STRONGOxylane/Decathlon leverages simulation to design stronger, lighter bike frames in less time.
By Alexandre Callens, Advanced Simulation Engineer Oxylane/Decathlon, MKNiX Engineering Center, Lille, France
set up DesignXplorer to iterate through 200 design variations while varying the length of the top tube. About 120 of these variations met the stress require-ments. The software ranked the accept-able design variations by the length of the top tube.
Additional optimization runs were performed to analyze the effect of the thickness of each tube on strength and cost. The resulting design delivered the industrial designers’ unique styling con-cept and provided the required strength.
Engineers set up ANSYS DesignXplorer to iterate through 200 design variations.
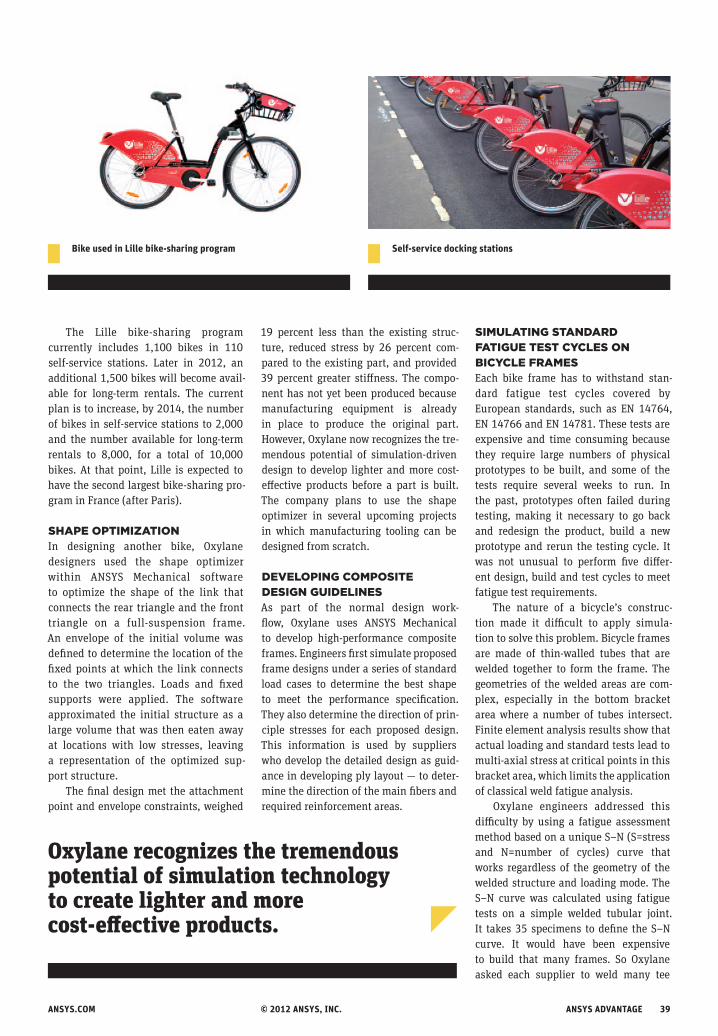
ANSYS.COM © 2012 ANSYS, INC. ANSYS ADVANTAGE 39
The Lille bike-sharing program currently includes 1,100 bikes in 110 self-service stations. Later in 2012, an additional 1,500 bikes will become avail-able for long-term rentals. The current plan is to increase, by 2014, the number of bikes in self-service stations to 2,000 and the number available for long-term rentals to 8,000, for a total of 10,000 bikes. At that point, Lille is expected to have the second largest bike-sharing pro-gram in France (after Paris).
SHAPE OPTIMIZATIONIn designing another bike, Oxylane designers used the shape optimizer within ANSYS Mechanical software to optimize the shape of the link that connects the rear triangle and the front triangle on a full-suspension frame. An envelope of the initial volume was defined to determine the location of the fixed points at which the link connects to the two triangles. Loads and fixed supports were applied. The software approximated the initial structure as a large volume that was then eaten away at locations with low stresses, leaving a representation of the optimized sup-port structure.
The final design met the attachment point and envelope constraints, weighed
SIMULATING STANDARD FATIGUE TEST CYCLES ON BICYCLE FRAMESEach bike frame has to withstand stan-dard fatigue test cycles covered by European standards, such as EN 14764, EN 14766 and EN 14781. These tests are expensive and time consuming because they require large numbers of physical prototypes to be built, and some of the tests require several weeks to run. In the past, prototypes often failed during testing, making it necessary to go back and redesign the product, build a new prototype and rerun the testing cycle. It was not unusual to perform five differ-ent design, build and test cycles to meet fatigue test requirements.
The nature of a bicycle’s construc-tion made it difficult to apply simula-tion to solve this problem. Bicycle frames are made of thin-walled tubes that are welded together to form the frame. The geometries of the welded areas are com-plex, especially in the bottom bracket area where a number of tubes intersect. Finite element analysis results show that actual loading and standard tests lead to multi-axial stress at critical points in this bracket area, which limits the application of classical weld fatigue analysis.
Oxylane engineers addressed this difficulty by using a fatigue assessment method based on a unique S–N (S=stress and N=number of cycles) curve that works regardless of the geometry of the welded structure and loading mode. The S–N curve was calculated using fatigue tests on a simple welded tubular joint. It takes 35 specimens to define the S–N curve. It would have been expensive to build that many frames. So Oxylane asked each supplier to weld many tee
Oxylane recognizes the tremendous potential of simulation technology to create lighter and more cost-effective products.
19 percent less than the existing struc-ture, reduced stress by 26 percent com-pared to the existing part, and provided 39 percent greater stiffness. The compo-nent has not yet been produced because manufacturing equipment is already in place to produce the original part. However, Oxylane now recognizes the tre-mendous potential of simulation-driven design to develop lighter and more cost-effective products before a part is built. The company plans to use the shape optimizer in several upcoming projects in which manufacturing tooling can be designed from scratch.
DEVELOPING COMPOSITE DESIGN GUIDELINESAs part of the normal design work-flow, Oxylane uses ANSYS Mechanical to develop high-performance composite frames. Engineers first simulate proposed frame designs under a series of standard load cases to determine the best shape to meet the performance specification. They also determine the direction of prin-ciple stresses for each proposed design. This information is used by suppliers who develop the detailed design as guid-ance in developing ply layout — to deter-mine the direction of the main fibers and required reinforcement areas.
Bike used in Lille bike-sharing program Self-service docking stations
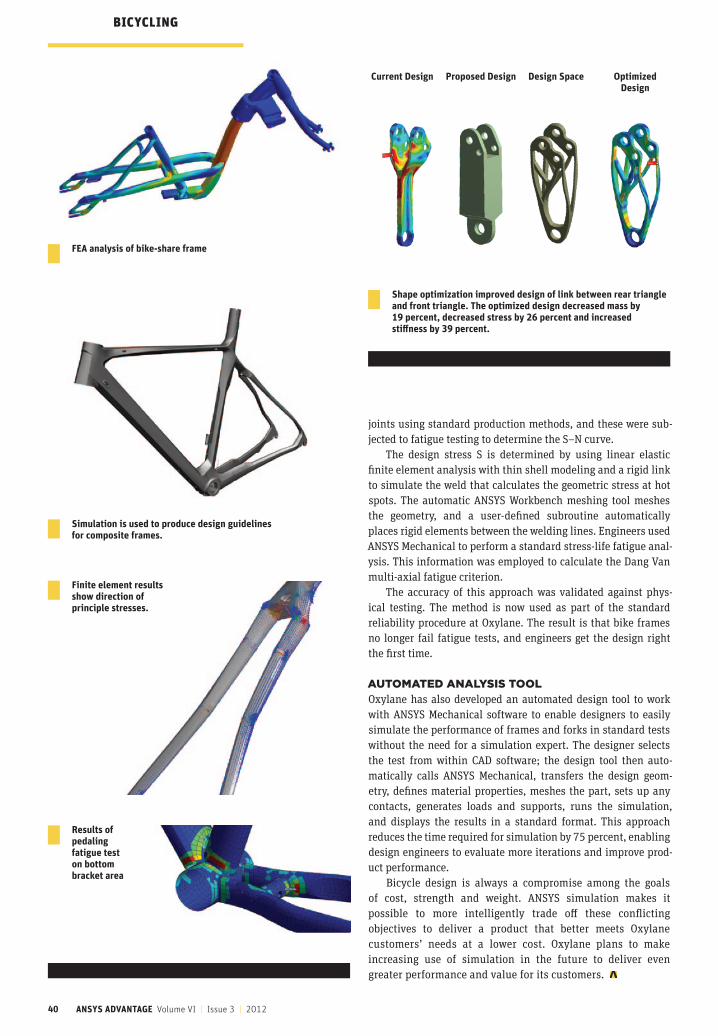
40 ANSYS ADVANTAGE Volume VI | Issue 3 | 2012
joints using standard production methods, and these were sub-jected to fatigue testing to determine the S–N curve.
The design stress S is determined by using linear elastic finite element analysis with thin shell modeling and a rigid link to simulate the weld that calculates the geometric stress at hot spots. The automatic ANSYS Workbench meshing tool meshes the geometry, and a user-defined subroutine automatically places rigid elements between the welding lines. Engineers used ANSYS Mechanical to perform a standard stress-life fatigue anal-ysis. This information was employed to calculate the Dang Van multi-axial fatigue criterion.
The accuracy of this approach was validated against phys-ical testing. The method is now used as part of the standard reliability procedure at Oxylane. The result is that bike frames no longer fail fatigue tests, and engineers get the design right the first time.
AUTOMATED ANALYSIS TOOLOxylane has also developed an automated design tool to work with ANSYS Mechanical software to enable designers to easily simulate the performance of frames and forks in standard tests without the need for a simulation expert. The designer selects the test from within CAD software; the design tool then auto-matically calls ANSYS Mechanical, transfers the design geom-etry, defines material properties, meshes the part, sets up any contacts, generates loads and supports, runs the simulation, and displays the results in a standard format. This approach reduces the time required for simulation by 75 percent, enabling design engineers to evaluate more iterations and improve prod-uct performance.
Bicycle design is always a compromise among the goals of cost, strength and weight. ANSYS simulation makes it possible to more intelligently trade off these conflicting objectives to deliver a product that better meets Oxylane customers’ needs at a lower cost. Oxylane plans to make increasing use of simulation in the future to deliver even greater performance and value for its customers.
FEA analysis of bike-share frame
Simulation is used to produce design guidelines for composite frames.
Shape optimization improved design of link between rear triangle and front triangle. The optimized design decreased mass by 19 percent, decreased stress by 26 percent and increased stiffness by 39 percent.
Optimized Design
Proposed Design Design Space Current Design
Finite element results show direction of principle stresses.
Results of pedaling fatigue test on bottom bracket area
BICYCLING
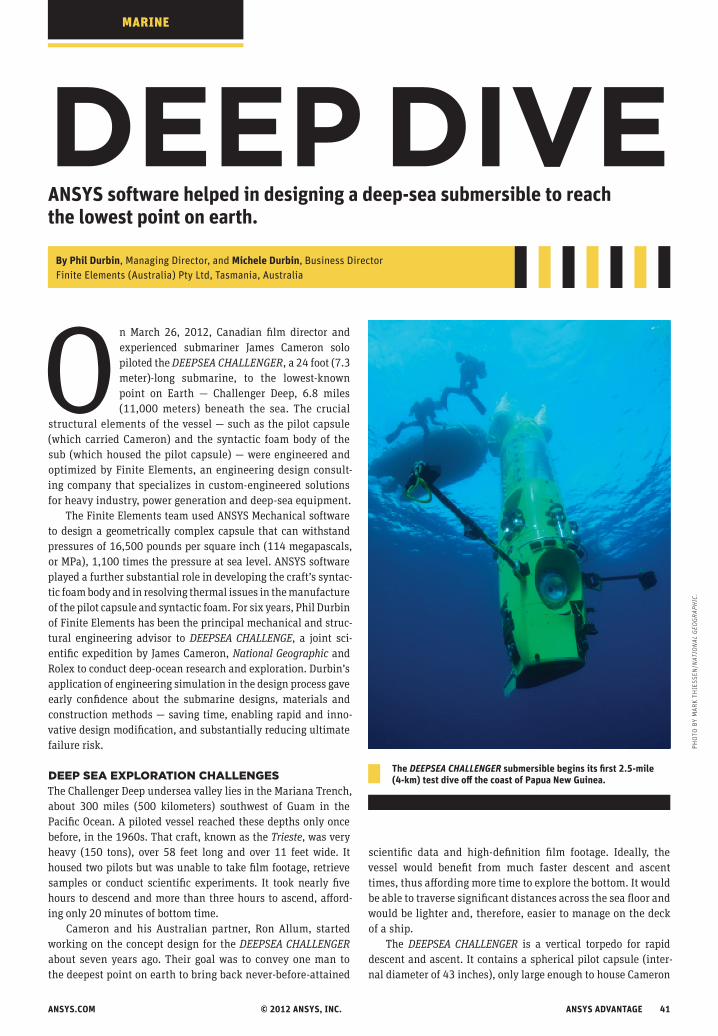
ANSYS.COM © 2012 ANSYS, INC. ANSYS ADVANTAGE 41
MARINE
O n March 26, 2012, Canad ian film director and experienced submariner James Cameron solo piloted the DEEPSEA CHALLENGER, a 24 foot (7.3 meter)-long submarine, to the lowest-known point on Earth — Challenger Deep, 6.8 miles (11,000 meters) beneath the sea. The crucial
structural elements of the vessel — such as the pilot capsule (which carried Cameron) and the syntactic foam body of the sub (which housed the pilot capsule) — were engineered and optimized by Finite Elements, an engineering design consult-ing company that specializes in custom-engineered solutions for heavy industry, power generation and deep-sea equipment.
The Finite Elements team used ANSYS Mechanical software to design a geometrically complex capsule that can withstand pressures of 16,500 pounds per square inch (114 megapascals, or MPa), 1,100 times the pressure at sea level. ANSYS software played a further substantial role in developing the craft’s syntac-tic foam body and in resolving thermal issues in the manufacture of the pilot capsule and syntactic foam. For six years, Phil Durbin of Finite Elements has been the principal mechanical and struc-tural engineering advisor to DEEPSEA CHALLENGE, a joint sci-entific expedition by James Cameron, National Geographic and Rolex to conduct deep-ocean research and exploration. Durbin’s application of engineering simulation in the design process gave early confidence about the submarine designs, materials and construction methods — saving time, enabling rapid and inno-vative design modification, and substantially reducing ultimate failure risk.
DEEP SEA EXPLORATION CHALLENGESThe Challenger Deep undersea valley lies in the Mariana Trench, about 300 miles (500 kilometers) southwest of Guam in the Pacific Ocean. A piloted vessel reached these depths only once before, in the 1960s. That craft, known as the Trieste, was very heavy (150 tons), over 58 feet long and over 11 feet wide. It housed two pilots but was unable to take film footage, retrieve samples or conduct scientific experiments. It took nearly five hours to descend and more than three hours to ascend, afford-ing only 20 minutes of bottom time.
Cameron and his Australian partner, Ron Allum, started working on the concept design for the DEEPSEA CHALLENGER about seven years ago. Their goal was to convey one man to the deepest point on earth to bring back never-before-attained
DEEP DIVEANSYS software helped in designing a deep-sea submersible to reach the lowest point on earth.
By Phil Durbin, Managing Director, and Michele Durbin, Business Director Finite Elements (Australia) Pty Ltd, Tasmania, Australia
The DEEPSEA CHALLENGER submersible begins its first 2.5-mile (4-km) test dive off the coast of Papua New Guinea.
scientific data and high-definition film footage. Ideally, the vessel would benefit from much faster descent and ascent times, thus affording more time to explore the bottom. It would be able to traverse significant distances across the sea floor and would be lighter and, therefore, easier to manage on the deck of a ship.
The DEEPSEA CHALLENGER is a vertical torpedo for rapid descent and ascent. It contains a spherical pilot capsule (inter-nal diameter of 43 inches), only large enough to house Cameron
PHO
TO B
Y M
ARK
THIE
SSEN
/NAT
ION
AL G
EOGR
APH
IC.
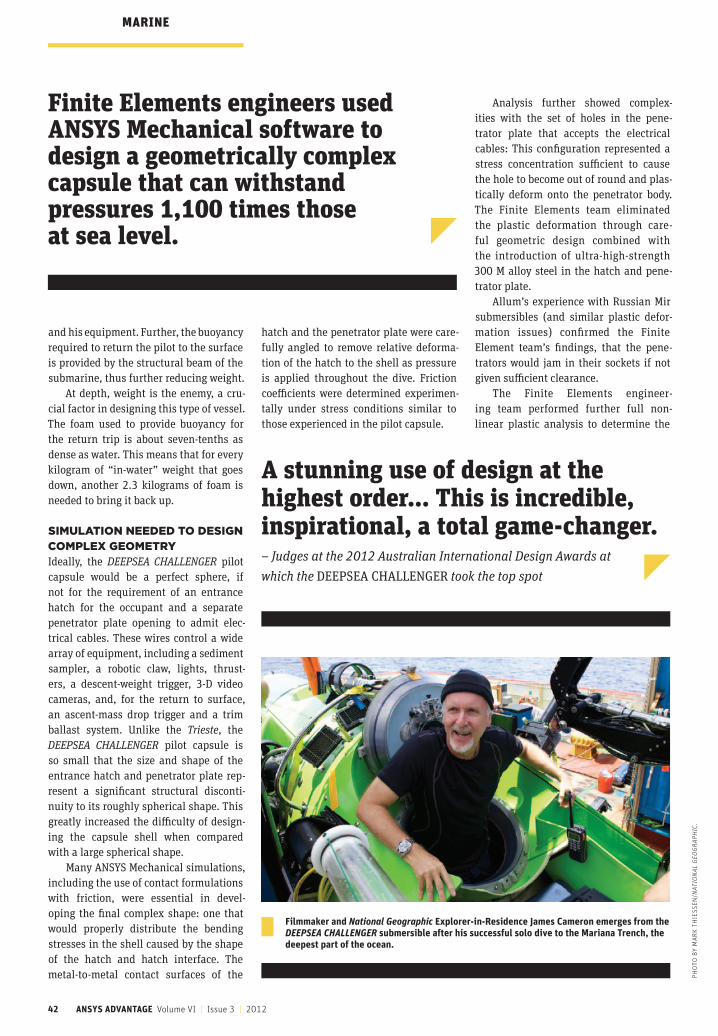
42 ANSYS ADVANTAGE Volume VI | Issue 3 | 2012
Filmmaker and National Geographic Explorer-in-Residence James Cameron emerges from the DEEPSEA CHALLENGER submersible after his successful solo dive to the Mariana Trench, the deepest part of the ocean.
and his equipment. Further, the buoyancy required to return the pilot to the surface is provided by the structural beam of the submarine, thus further reducing weight.
At depth, weight is the enemy, a cru-cial factor in designing this type of vessel. The foam used to provide buoyancy for the return trip is about seven-tenths as dense as water. This means that for every kilogram of “in-water” weight that goes down, another 2.3 kilograms of foam is needed to bring it back up.
SIMULATION NEEDED TO DESIGN COMPLEX GEOMETRYIdeally, the DEEPSEA CHALLENGER pilot capsule would be a perfect sphere, if not for the requirement of an entrance hatch for the occupant and a separate penetrator plate opening to admit elec-trical cables. These wires control a wide array of equipment, including a sediment sampler, a robotic claw, lights, thrust-ers, a descent-weight trigger, 3-D video cameras, and, for the return to surface, an ascent-mass drop trigger and a trim ballast system. Unlike the Trieste, the DEEPSEA CHALLENGER pilot capsule is so small that the size and shape of the entrance hatch and penetrator plate rep-resent a significant structural disconti-nuity to its roughly spherical shape. This greatly increased the difficulty of design-ing the capsule shell when compared with a large spherical shape.
Many ANSYS Mechanical simulations, including the use of contact formulations with friction, were essential in devel-oping the final complex shape: one that would properly distribute the bending stresses in the shell caused by the shape of the hatch and hatch interface. The metal-to-metal contact surfaces of the
hatch and the penetrator plate were care-fully angled to remove relative deforma-tion of the hatch to the shell as pressure is applied throughout the dive. Friction coefficients were determined experimen-tally under stress conditions similar to those experienced in the pilot capsule.
Analysis further showed complex-ities with the set of holes in the pene-trator plate that accepts the electrical cables: This configuration represented a stress concentration sufficient to cause the hole to become out of round and plas-tically deform onto the penetrator body. The Finite Elements team eliminated the plastic deformation through care-ful geometric design combined with the introduction of ultra-high-strength 300 M alloy steel in the hatch and pene-trator plate.
Allum’s experience with Russian Mir submersibles (and similar plastic defor-mation issues) confirmed the Finite Element team’s findings, that the pene-trators would jam in their sockets if not given sufficient clearance.
The Finite Elements engineer-ing team performed further full non-linear plastic analysis to determine the
Finite Elements engineers used ANSYS Mechanical software to design a geometrically complex capsule that can withstand pressures 1,100 times those at sea level.
A stunning use of design at the highest order… This is incredible, inspirational, a total game-changer.– Judges at the 2012 Australian International Design Awards at which the DEEPSEA CHALLENGER took the top spot
PHO
TO B
Y M
ARK
THIE
SSEN
/NAT
ION
AL G
EOGR
APH
IC.
MARINE
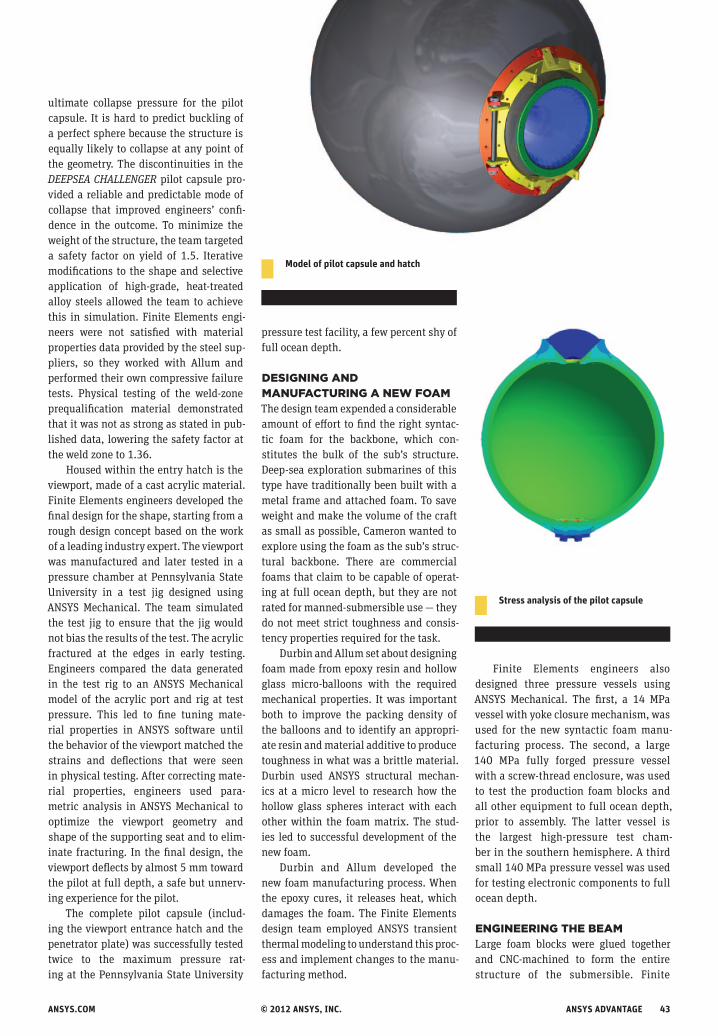
ANSYS.COM © 2012 ANSYS, INC. ANSYS ADVANTAGE 43
ultimate collapse pressure for the pilot capsule. It is hard to predict buckling of a perfect sphere because the structure is equally likely to collapse at any point of the geometry. The discontinuities in the DEEPSEA CHALLENGER pilot capsule pro-vided a reliable and predictable mode of collapse that improved engineers’ confi-dence in the outcome. To minimize the weight of the structure, the team targeted a safety factor on yield of 1.5. Iterative modifications to the shape and selective application of high-grade, heat-treated alloy steels allowed the team to achieve this in simulation. Finite Elements engi-neers were not satisfied with material properties data provided by the steel sup-pliers, so they worked with Allum and performed their own compressive failure tests. Physical testing of the weld-zone prequalification material demonstrated that it was not as strong as stated in pub-lished data, lowering the safety factor at the weld zone to 1.36.
Housed within the entry hatch is the viewport, made of a cast acrylic material. Finite Elements engineers developed the final design for the shape, starting from a rough design concept based on the work of a leading industry expert. The viewport was manufactured and later tested in a pressure chamber at Pennsylvania State University in a test jig designed using ANSYS Mechanical. The team simulated the test jig to ensure that the jig would not bias the results of the test. The acrylic fractured at the edges in early testing. Engineers compared the data generated in the test rig to an ANSYS Mechanical model of the acrylic port and rig at test pressure. This led to fine tuning mate-rial properties in ANSYS software until the behavior of the viewport matched the strains and deflections that were seen in physical testing. After correcting mate-rial properties, engineers used para-metric analysis in ANSYS Mechanical to optimize the viewport geometry and shape of the supporting seat and to elim-inate fracturing. In the final design, the viewport deflects by almost 5 mm toward the pilot at full depth, a safe but unnerv-ing experience for the pilot.
The complete pilot capsule (includ-ing the viewport entrance hatch and the penetrator plate) was successfully tested twice to the maximum pressure rat-ing at the Pennsylvania State University
pressure test facility, a few percent shy of full ocean depth.
DESIGNING AND MANUFACTURING A NEW FOAMThe design team expended a considerable amount of effort to find the right syntac-tic foam for the backbone, which con-stitutes the bulk of the sub’s structure. Deep-sea exploration submarines of this type have traditionally been built with a metal frame and attached foam. To save weight and make the volume of the craft as small as possible, Cameron wanted to explore using the foam as the sub’s struc-tural backbone. There are commercial foams that claim to be capable of operat-ing at full ocean depth, but they are not rated for manned-submersible use — they do not meet strict toughness and consis-tency properties required for the task.
Durbin and Allum set about designing foam made from epoxy resin and hollow glass micro-balloons with the required mechanical properties. It was important both to improve the packing density of the balloons and to identify an appropri-ate resin and material additive to produce toughness in what was a brittle material. Durbin used ANSYS structural mechan-ics at a micro level to research how the hollow glass spheres interact with each other within the foam matrix. The stud-ies led to successful development of the new foam.
Durbin and Allum developed the new foam manufacturing process. When the epoxy cures, it releases heat, which damages the foam. The Finite Elements design team employed ANSYS transient thermal modeling to understand this proc- ess and implement changes to the manu-facturing method.
Finite Elements engineers also designed three pressure vessels using ANSYS Mechanical. The first, a 14 MPa vessel with yoke closure mechanism, was used for the new syntactic foam manu-facturing process. The second, a large 140 MPa fully forged pressure vessel with a screw-thread enclosure, was used to test the production foam blocks and all other equipment to full ocean depth, prior to assembly. The latter vessel is the largest high-pressure test cham-ber in the southern hemisphere. A third small 140 MPa pressure vessel was used for testing electronic components to full ocean depth.
ENGINEERING THE BEAMLarge foam blocks were glued together and CNC-machined to form the entire structure of the submersible. Finite
Model of pilot capsule and hatch
Stress analysis of the pilot capsule
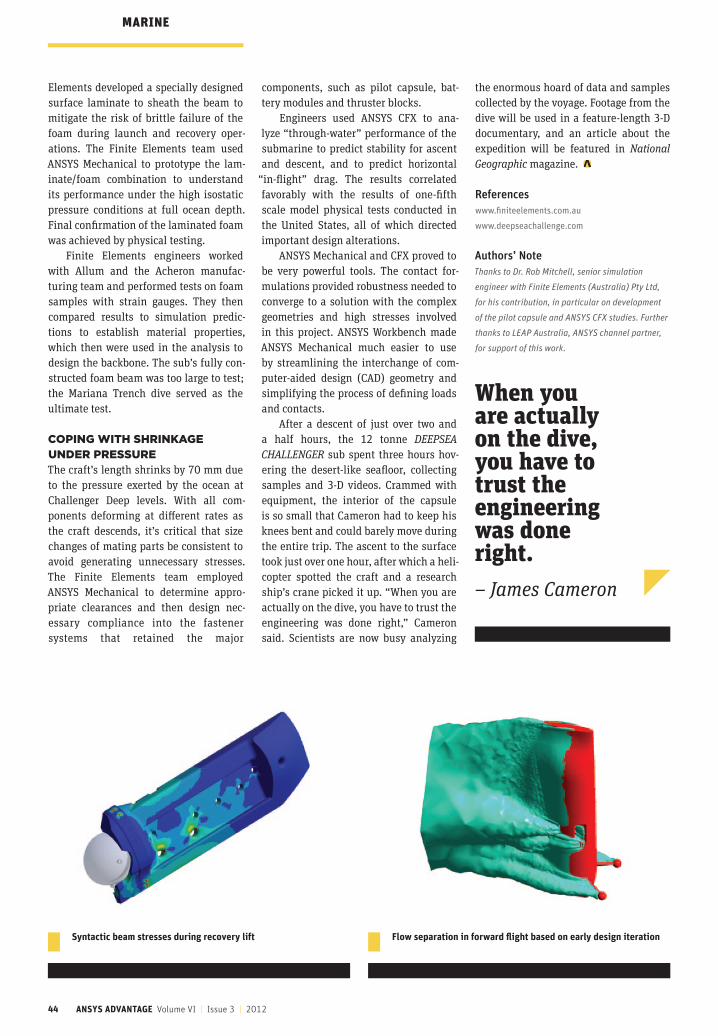
44 ANSYS ADVANTAGE Volume VI | Issue 3 | 2012
Elements developed a specially designed surface laminate to sheath the beam to mitigate the risk of brittle failure of the foam during launch and recovery oper-ations. The Finite Elements team used ANSYS Mechanical to prototype the lam-inate/foam combination to understand its performance under the high isostatic pressure conditions at full ocean depth. Final confirmation of the laminated foam was achieved by physical testing.
Finite Elements engineers worked with Allum and the Acheron manufac-turing team and performed tests on foam samples with strain gauges. They then compared results to simulation predic-tions to establish material properties, which then were used in the analysis to design the backbone. The sub’s fully con-structed foam beam was too large to test; the Mariana Trench dive served as the ultimate test.
COPING WITH SHRINKAGE UNDER PRESSUREThe craft’s length shrinks by 70 mm due to the pressure exerted by the ocean at Challenger Deep levels. With all com-ponents deforming at different rates as the craft descends, it’s critical that size changes of mating parts be consistent to avoid generating unnecessary stresses. The Finite Elements team employed ANSYS Mechanical to determine appro-priate clearances and then design nec-essary compliance into the fastener systems that retained the major
components, such as pilot capsule, bat-tery modules and thruster blocks.
Engineers used ANSYS CFX to ana-lyze “through-water” performance of the submarine to predict stability for ascent and descent, and to predict horizontal
“in-flight” drag. The results correlated favorably with the results of one-fifth scale model physical tests conducted in the United States, all of which directed important design alterations.
ANSYS Mechanical and CFX proved to be very powerful tools. The contact for-mulations provided robustness needed to converge to a solution with the complex geometries and high stresses involved in this project. ANSYS Workbench made ANSYS Mechanical much easier to use by streamlining the interchange of com-puter-aided design (CAD) geometry and simplifying the process of defining loads and contacts.
After a descent of just over two and a half hours, the 12 tonne DEEPSEA CHALLENGER sub spent three hours hov-ering the desert-like seafloor, collecting samples and 3-D videos. Crammed with equipment, the interior of the capsule is so small that Cameron had to keep his knees bent and could barely move during the entire trip. The ascent to the surface took just over one hour, after which a heli-copter spotted the craft and a research ship’s crane picked it up. “When you are actually on the dive, you have to trust the engineering was done right,” Cameron said. Scientists are now busy analyzing
the enormous hoard of data and samples collected by the voyage. Footage from the dive will be used in a feature-length 3-D documentary, and an article about the expedition will be featured in National Geographic magazine.
Referenceswww.finiteelements.com.au
www.deepseachallenge.com
Authors’ NoteThanks to Dr. Rob Mitchell, senior simulation
engineer with Finite Elements (Australia) Pty Ltd,
for his contribution, in particular on development
of the pilot capsule and ANSYS CFX studies. Further
thanks to LEAP Australia, ANSYS channel partner,
for support of this work.
Syntactic beam stresses during recovery lift Flow separation in forward flight based on early design iteration
When you are actually on the dive, you have to trust the engineering was done right.– James Cameron
MARINE

ANSYS.COM © 2012 ANSYS, INC. ANSYS ADVANTAGE 45
MATERIALS
REDUCING MATERIAL COSTSR&D reduced material costs for a water container by 10 percent while maintaining product integrity.
By Philippe Klein, Manager, Gamma Point, Saint-Avold, France; Frédéric Fradet, Manager, Plastinnov, Saint-Avold, France; Hossam Metwally, Lead Technical Services Engineer; Norman Robertson, Lead Product Manager; and Thierry Marchal, Director of Industry Marketing, ANSYS, Inc.
E xtrusion blow molding (EBM) is a common manu-facturing process for con-tainers, bottles and gas tanks with complex shapes that require precision in
manufacturing. Using engineering sim-ulation to design these products can help to reduce weight and materials yet achieve acceptable performance. This can, in turn, avoid expensive prototyp-ing and prevent failure while the prod-uct is in use.
Reducing materials can deliver sig-nificant cost savings for the manufac-turer, who can then make the product more competitive in the marketplace by passing some of these savings to the con-sumer. In addition, weight reduction pro-vides sustainability benefits with regard to decreased material disposal at the end of the product lifecycle. Gamma Point, a services company that assists custom-ers in the plastics industry via numerical simulation, employs ANSYS software as a regular part of its engineering process to meet specific structural performance criteria while minimizing the usage of raw materials.
EBM consists of four main phases: parison extrusion (preforming the plas-tic to be molded in the form of a tube), inflation, part cooling/solidification and mold release. Simulation is used dur-ing both parison extrusion and inflation phases to reduce materials.
In general, any blow-molded part var-ies in material thickness. Engineers must take this variation into account when per-forming simulation to obtain accurate results, which can reduce materials, avoid expensive prototyping and prevent failure.
As an example, simulation during the design process for a blow-molded 1,000 liter water container involved three main steps:
• Model verification and comparison with existing experimental data
• Weight reduction/optimization through parison programming
Extrusion blow-molding process
• Coupling with ANSYS Mechanical for top-load analysis and ANSYS Explicit STR for drop analysis
BASELINE MODEL VERIFICATIONGamma Point’s first step was to verify that the blow-molding simulation using ANSYS Polyflow yielded results that corre-late with experimental data. The Polyflow simulation used viscosity obtained from simple capillary testing, in which the vis-cosity of the high-density polyethylene (HDPE) material was measured at various shear rates.
To perform blow-molding simulation with Polyflow, Gamma Point engineers
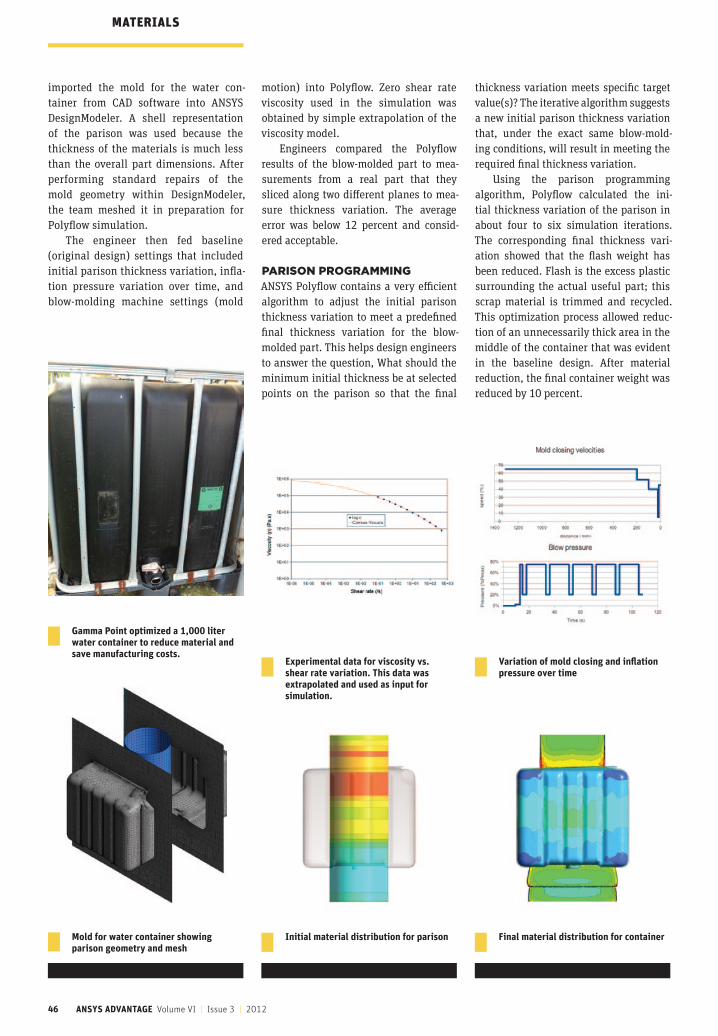
46 ANSYS ADVANTAGE Volume VI | Issue 3 | 2012
imported the mold for the water con-tainer from CAD software into ANSYS DesignModeler. A shell representation of the parison was used because the thickness of the materials is much less than the overall part dimensions. After performing standard repairs of the mold geometry within DesignModeler, the team meshed it in preparation for Polyflow simulation.
The engineer then fed baseline (original design) settings that included initial parison thickness variation, infla-tion pressure variation over time, and blow-molding machine settings (mold
motion) into Polyflow. Zero shear rate viscosity used in the simulation was obtained by simple extrapolation of the viscosity model.
Engineers compared the Polyflow results of the blow-molded part to mea-surements from a real part that they sliced along two different planes to mea-sure thickness variation. The average error was below 12 percent and consid-ered acceptable.
PARISON PROGRAMMINGANSYS Polyflow contains a very efficient algorithm to adjust the initial parison thickness variation to meet a predefined final thickness variation for the blow-molded part. This helps design engineers to answer the question, What should the minimum initial thickness be at selected points on the parison so that the final
Gamma Point optimized a 1,000 liter water container to reduce material and save manufacturing costs.
Mold for water container showing parison geometry and mesh
Experimental data for viscosity vs. shear rate variation. This data was extrapolated and used as input for simulation.
Initial material distribution for parison Final material distribution for container
Variation of mold closing and inflation pressure over time
thickness variation meets specific target value(s)? The iterative algorithm suggests a new initial parison thickness variation that, under the exact same blow-mold-ing conditions, will result in meeting the required final thickness variation.
Using the parison programming algorithm, Polyflow calculated the ini-tial thickness variation of the parison in about four to six simulation iterations. The corresponding final thickness vari-ation showed that the flash weight has been reduced. Flash is the excess plastic surrounding the actual useful part; this scrap material is trimmed and recycled. This optimization process allowed reduc-tion of an unnecessarily thick area in the middle of the container that was evident in the baseline design. After material reduction, the final container weight was reduced by 10 percent.
MATERIALS
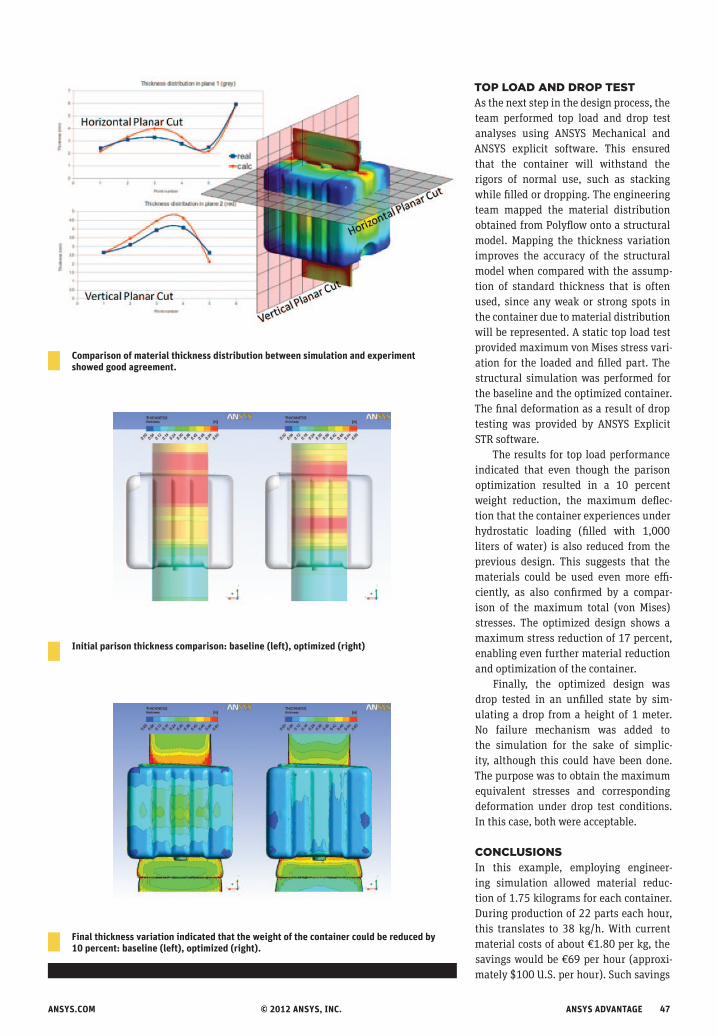
ANSYS.COM © 2012 ANSYS, INC. ANSYS ADVANTAGE 47
TOP LOAD AND DROP TESTAs the next step in the design process, the team performed top load and drop test analyses using ANSYS Mechanical and ANSYS explicit software. This ensured that the container will withstand the rigors of normal use, such as stacking while filled or dropping. The engineering team mapped the material distribution obtained from Polyflow onto a structural model. Mapping the thickness variation improves the accuracy of the structural model when compared with the assump-tion of standard thickness that is often used, since any weak or strong spots in the container due to material distribution will be represented. A static top load test provided maximum von Mises stress vari-ation for the loaded and filled part. The structural simulation was performed for the baseline and the optimized container. The final deformation as a result of drop testing was provided by ANSYS Explicit STR software.
The results for top load performance indicated that even though the parison optimization resulted in a 10 percent weight reduction, the maximum deflec-tion that the container experiences under hydrostatic loading (filled with 1,000 liters of water) is also reduced from the previous design. This suggests that the materials could be used even more effi-ciently, as also confirmed by a compar-ison of the maximum total (von Mises) stresses. The optimized design shows a maximum stress reduction of 17 percent, enabling even further material reduction and optimization of the container.
Finally, the optimized design was drop tested in an unfilled state by sim-ulating a drop from a height of 1 meter. No failure mechanism was added to the simulation for the sake of simplic-ity, although this could have been done. The purpose was to obtain the maximum equivalent stresses and corresponding deformation under drop test conditions. In this case, both were acceptable.
CONCLUSIONSIn this example, employing engineer-ing simulation allowed material reduc-tion of 1.75 kilograms for each container. During production of 22 parts each hour, this translates to 38 kg/h. With current material costs of about €1.80 per kg, the savings would be €69 per hour (approxi-mately $100 U.S. per hour). Such savings
Final thickness variation indicated that the weight of the container could be reduced by 10 percent: baseline (left), optimized (right).
Comparison of material thickness distribution between simulation and experiment showed good agreement.
Initial parison thickness comparison: baseline (left), optimized (right)
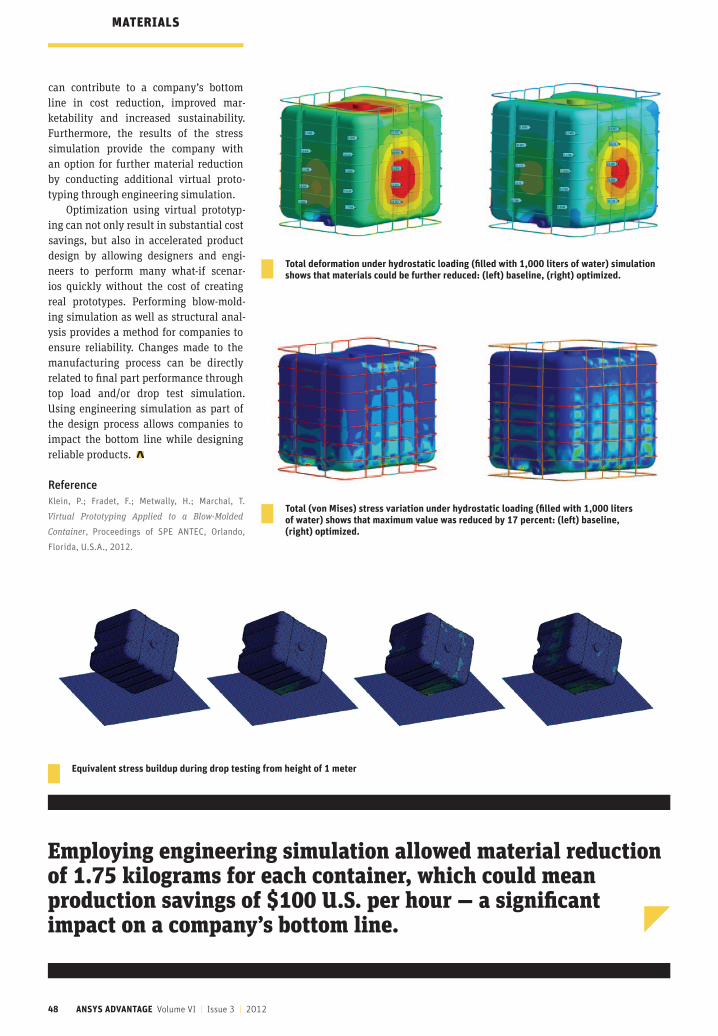
48 ANSYS ADVANTAGE Volume VI | Issue 3 | 2012
can contribute to a company’s bottom line in cost reduction, improved mar-ketability and increased sustainability. Furthermore, the results of the stress simulation provide the company with an option for further material reduction by conducting additional virtual proto-typing through engineering simulation.
Optimization using virtual prototyp-ing can not only result in substantial cost savings, but also in accelerated product design by allowing designers and engi-neers to perform many what-if scenar-ios quickly without the cost of creating real prototypes. Performing blow-mold-ing simulation as well as structural anal-ysis provides a method for companies to ensure reliability. Changes made to the manufacturing process can be directly related to final part performance through top load and/or drop test simulation. Using engineering simulation as part of the design process allows companies to impact the bottom line while designing reliable products.
ReferenceKlein, P.; Fradet, F.; Metwally, H.; Marchal, T.
Virtual Prototyping Applied to a Blow-Molded
Container, Proceedings of SPE ANTEC, Orlando,
Florida, U.S.A., 2012.
Total deformation under hydrostatic loading (filled with 1,000 liters of water) simulation shows that materials could be further reduced: (left) baseline, (right) optimized.
Total (von Mises) stress variation under hydrostatic loading (filled with 1,000 liters of water) shows that maximum value was reduced by 17 percent: (left) baseline, (right) optimized.
Equivalent stress buildup during drop testing from height of 1 meter
Employing engineering simulation allowed material reduction of 1.75 kilograms for each container, which could mean production savings of $100 U.S. per hour — a significant impact on a company’s bottom line.
MATERIALS

ANSYS.COM © 2012 ANSYS, INC. ANSYS ADVANTAGE 49
ANALYSIS TOOLS Departments
ANSYS has already established itself as a world-leading provider of multiphysics software that enables Simulation-Driven Product Development at the systems level. By adding Esterel’s unique capability to model and produce embedded software — the control and human–machine interface codes that are central to today’s smart electronic systems — ANSYS is extending its vision to encompass both hardware and software. As a result, product engineers can gain the earliest possible insights into how embedded software will behave as it interacts with hardware to control a range of electrical, mechanical and fluidic functions. We look forward to helping ANSYS customers to capitalize on these new software modeling and production capabilities for realizing incredible engineering innovations at both a lower cost and a more rapid pace — while also achieving uncompromising levels of product safety and reliability. Today’s smart products demand smarter engineering solutions, and ANSYS and Esterel are committed to providing the comprehensive set of modeling and code-generation tools that engineering teams need to be able to emerge as leaders in this complex environment.
Eric Bantegnie, Vice President and General Manager, Embedded Systems and Software Business, ANSYS, Inc. (Co-founder, CEO and President, Esterel Technologies)
SMART PRODUCTS, SMART ENGINEERING SOLUTIONSWith its acquisition of Esterel Technologies, ANSYS extends its capabilities to embedded software simulation and code production — enabling rapid, reliable and cost-effective design of smart product systems.
By Bernard Dion, CTO, Esterel Technologies, Elancourt, France
U nderlying every smart product system — whether installed in auto-mobiles, aircraft, rail transportation or medical devices — is a power-ful force: embedded software code that ensures the system’s reliable performance. Millions of lines of mission-critical code support the behavior of electrical, mechanical and fluidic systems, ensuring safe and dependable results.
While we rely on these smart product systems every day, few of us consider the complex interactions of software and hardware that govern their performance, or the increased systems engineering challenges they produce. Today, high-end cars can have more than 10 million lines of code, and aircraft engine controls incorporate several thousand input and output parameters.
In today’s ultra-competitive environment, product differentiation increasingly depends on embedded software, including complex control code and user-friendly human–machine interfaces. However, even as embedded software utilization and
In today’s ultra-competitive environment, product differentiation increasingly depends on embedded software.

50 ANSYS ADVANTAGE Volume VI | Issue 3 | 2012
ANALYSIS TOOLS
innovation emerge as major differen-tiators in many industries, embedded code also increases product complex-ity and risk. Manufacturers have to meet hard, real-time performance tar-gets, while also complying with strin-gent safety and reliability regulations in mission-critical applications and indus-tries. And the cost of manually producing, testing and verifying millions of lines of code to demonstrate design robustness, safety, reliability and regulatory compli-ance roughly doubles every 18 months.
RECOGNIZED TECHNOLOGY LEADERSHIPWith scientific leadership dating to the 1980s, Esterel Technologies has offered engineers a unique capability to graphi-cally design, verify and automatically generate embedded software for appli-cations with high dependability require-ments, as well as to capture system functionality requirements and manage the complete embedded software lifecycle.
Esterel’s model-based software devel-opment solutions dramatically reduce the cost, risk and time to certification involved in creating the embedded sys-tems and software at the heart of thou-sands of smart product systems.
By modeling and simulating the behavior of embedded software code before it is implemented, these solutions enable engineers to gain critical insights earlier in the system design process — and link the predicted behavior to specific customer requirements. Esterel solutions
SCADE Display is a flexible graphics design and development environment for critical displays and human–machine interfaces.
SCADE System provides an open-source system architecture tool for developers of critical systems.
Esterel’s model-based solutions dramatically reduce cost, risk and time to certification.
On the Horizon: Smart Systems for the Auto Industry
As the automotive market demands more onboard electronics, Esterel Technologies will play a growing role in optimizing development of smart software and systems, such as engine control units, heating and braking systems, and battery management. The current growth estimate for vehicle electronics is 30 percent. The forecast for the next few years rises to 40 percent of the total cost of vehicles, providing automobile manufacturers with a unique opportunity to differentiate their products. The technology that is currently used to develop certified software applications in aircraft, rail transportation and medical devices can also be applied to meet ISO international standard 26262.
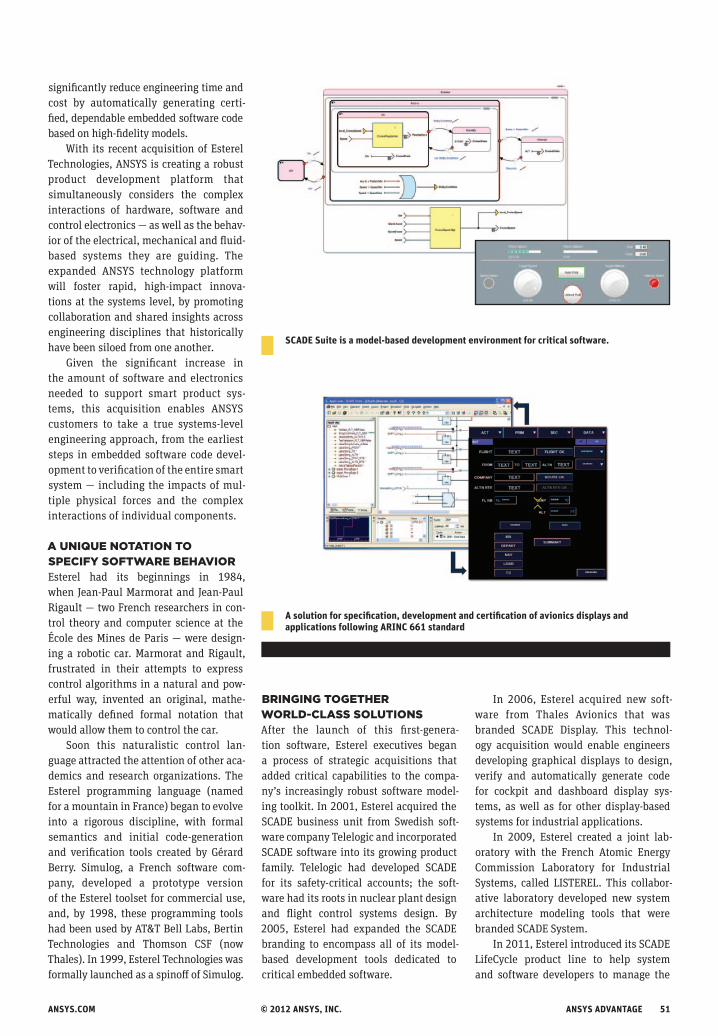
ANSYS.COM © 2012 ANSYS, INC. ANSYS ADVANTAGE 51
significantly reduce engineering time and cost by automatically generating certi-fied, dependable embedded software code based on high-fidelity models.
With its recent acquisition of Esterel Technologies, ANSYS is creating a robust product development platform that simultaneously considers the complex interactions of hardware, software and control electronics — as well as the behav-ior of the electrical, mechanical and fluid-based systems they are guiding. The expanded ANSYS technology platform will foster rapid, high-impact innova-tions at the systems level, by promoting collaboration and shared insights across engineering disciplines that historically have been siloed from one another.
Given the significant increase in the amount of software and electronics needed to support smart product sys-tems, this acquisition enables ANSYS customers to take a true systems-level engineering approach, from the earliest steps in embedded software code devel-opment to verification of the entire smart system — including the impacts of mul-tiple physical forces and the complex interactions of individual components.
A UNIQUE NOTATION TO SPECIFY SOFTWARE BEHAVIOR Esterel had its beginnings in 1984, when Jean-Paul Marmorat and Jean-Paul Rigault — two French researchers in con-trol theory and computer science at the École des Mines de Paris — were design-ing a robotic car. Marmorat and Rigault, frustrated in their attempts to express control algorithms in a natural and pow-erful way, invented an original, mathe-matically defined formal notation that would allow them to control the car.
Soon this naturalistic control lan-guage attracted the attention of other aca-demics and research organizations. The Esterel programming language (named for a mountain in France) began to evolve into a rigorous discipline, with formal semantics and initial code-generation and verification tools created by Gérard Berry. Simulog, a French software com-pany, developed a prototype version of the Esterel toolset for commercial use, and, by 1998, these programming tools had been used by AT&T Bell Labs, Bertin Technologies and Thomson CSF (now Thales). In 1999, Esterel Technologies was formally launched as a spinoff of Simulog.
SCADE Suite is a model-based development environment for critical software.
A solution for specification, development and certification of avionics displays and applications following ARINC 661 standard
BRINGING TOGETHER WORLD-CLASS SOLUTIONSAfter the launch of this first-genera-tion software, Esterel executives began a process of strategic acquisitions that added critical capabilities to the compa-ny’s increasingly robust software model-ing toolkit. In 2001, Esterel acquired the SCADE business unit from Swedish soft-ware company Telelogic and incorporated SCADE software into its growing product family. Telelogic had developed SCADE for its safety-critical accounts; the soft-ware had its roots in nuclear plant design and flight control systems design. By 2005, Esterel had expanded the SCADE branding to encompass all of its model-based development tools dedicated to critical embedded software.
In 2006, Esterel acquired new soft-ware from Thales Avionics that was branded SCADE Display. This technol-ogy acquisition would enable engineers developing graphical displays to design, verify and automatically generate code for cockpit and dashboard display sys-tems, as well as for other display-based systems for industrial applications.
In 2009, Esterel created a joint lab-oratory with the French Atomic Energy Commission Laboratory for Industrial Systems, called LISTEREL. This collabor-ative laboratory developed new system architecture modeling tools that were branded SCADE System.
In 2011, Esterel introduced its SCADE LifeCycle product line to help system and software developers to manage the
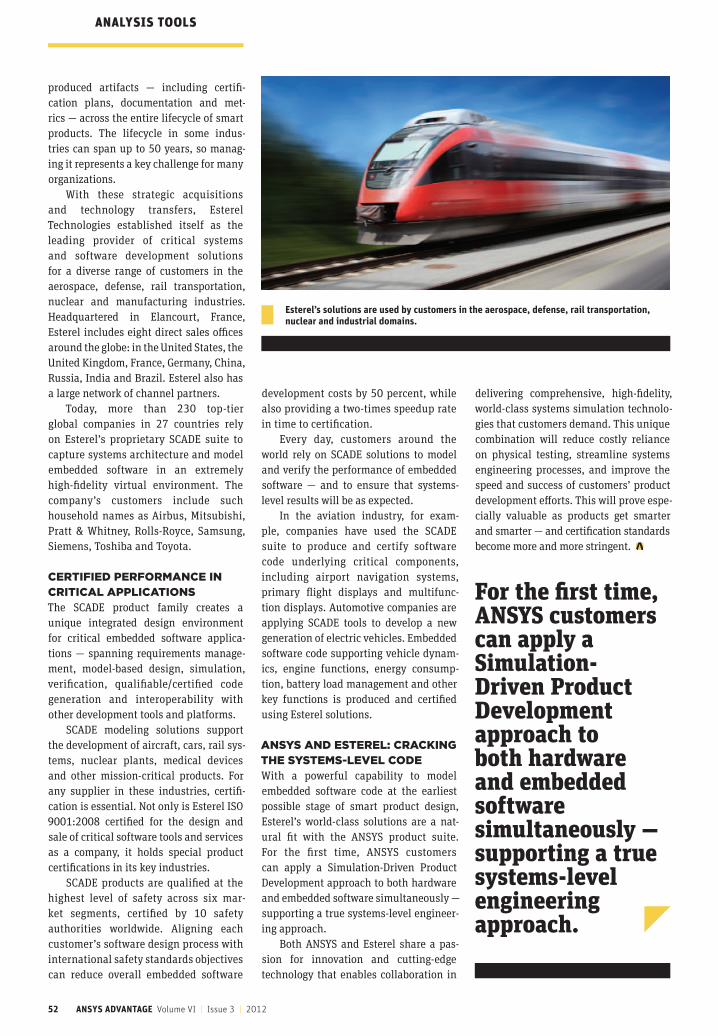
52 ANSYS ADVANTAGE Volume VI | Issue 3 | 2012
Esterel’s solutions are used by customers in the aerospace, defense, rail transportation, nuclear and industrial domains.
ANALYSIS TOOLS
produced artifacts — including certifi-cation plans, documentation and met-rics — across the entire lifecycle of smart products. The lifecycle in some indus-tries can span up to 50 years, so manag-ing it represents a key challenge for many organizations.
With these strategic acquisitions and technology transfers, Esterel Technologies established itself as the leading provider of critical systems and software development solutions for a diverse range of customers in the aerospace, defense, rail transportation, nuclear and manufacturing industries. Headquartered in Elancourt, France, Esterel includes eight direct sales offices around the globe: in the United States, the United Kingdom, France, Germany, China, Russia, India and Brazil. Esterel also has a large network of channel partners.
Today, more than 230 top-tier global companies in 27 countries rely on Esterel’s proprietary SCADE suite to capture systems architecture and model embedded software in an extremely high-fidelity virtual environment. The company’s customers include such household names as Airbus, Mitsubishi, Pratt & Whitney, Rolls-Royce, Samsung, Siemens, Toshiba and Toyota.
CERTIFIED PERFORMANCE IN CRITICAL APPLICATIONSThe SCADE product family creates a unique integrated design environment for critical embedded software applica-tions — spanning requirements manage-ment, model-based design, simulation, verification, qualifiable/certified code generation and interoperability with other development tools and platforms.
SCADE modeling solutions support the development of aircraft, cars, rail sys-tems, nuclear plants, medical devices and other mission-critical products. For any supplier in these industries, certifi-cation is essential. Not only is Esterel ISO 9001:2008 certified for the design and sale of critical software tools and services as a company, it holds special product certifications in its key industries.
SCADE products are qualified at the highest level of safety across six mar-ket segments, certified by 10 safety authorities worldwide. Aligning each customer’s software design process with international safety standards objectives can reduce overall embedded software
development costs by 50 percent, while also providing a two-times speedup rate in time to certification.
Every day, customers around the world rely on SCADE solutions to model and verify the performance of embedded software — and to ensure that systems-level results will be as expected.
In the aviation industry, for exam-ple, companies have used the SCADE suite to produce and certify software code underlying critical components, including airport navigation systems, primary flight displays and multifunc-tion displays. Automotive companies are applying SCADE tools to develop a new generation of electric vehicles. Embedded software code supporting vehicle dynam-ics, engine functions, energy consump-tion, battery load management and other key functions is produced and certified using Esterel solutions.
ANSYS AND ESTEREL: CRACKING THE SYSTEMS-LEVEL CODEWith a powerful capability to model embedded software code at the earliest possible stage of smart product design, Esterel’s world-class solutions are a nat-ural fit with the ANSYS product suite. For the first time, ANSYS customers can apply a Simulation-Driven Product Development approach to both hardware and embedded software simultaneously — supporting a true systems-level engineer-ing approach.
Both ANSYS and Esterel share a pas-sion for innovation and cutting-edge technology that enables collaboration in
delivering comprehensive, high-fidelity, world-class systems simulation technolo-gies that customers demand. This unique combination will reduce costly reliance on physical testing, streamline systems engineering processes, and improve the speed and success of customers’ product development efforts. This will prove espe-cially valuable as products get smarter and smarter — and certification standards become more and more stringent.
For the first time, ANSYS customers can apply a Simulation-Driven Product Development approach to both hardware and embedded software simultaneously — supporting a true systems-level engineering approach.
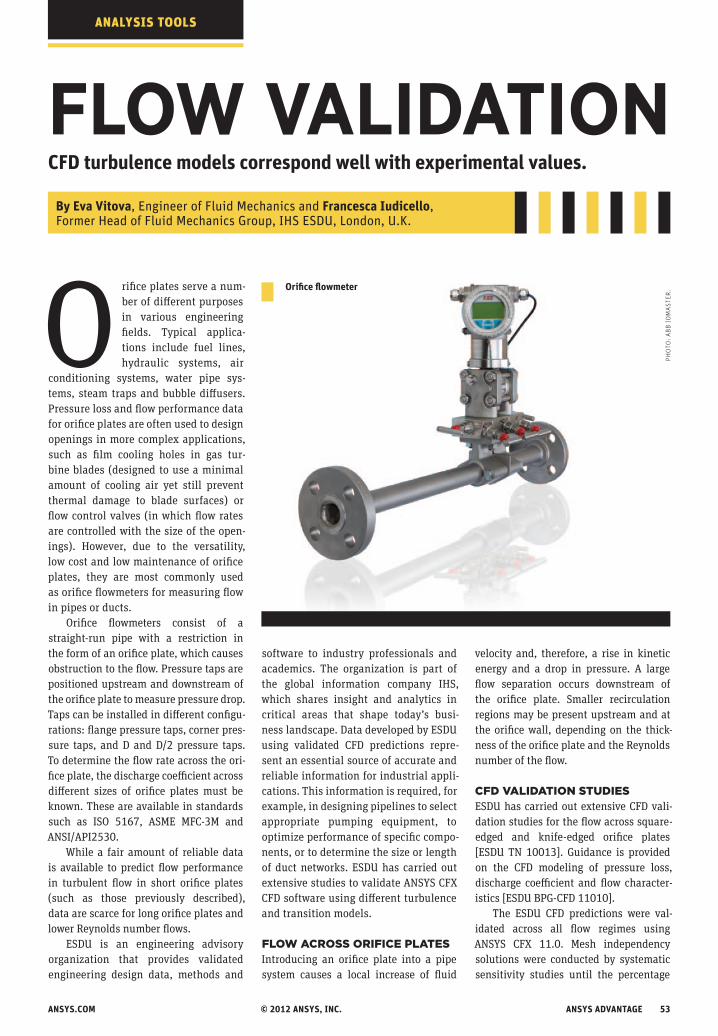
ANSYS.COM © 2012 ANSYS, INC. ANSYS ADVANTAGE 53
ANALYSIS TOOLS
O rifice plates serve a num-ber of different purposes in various engineering fields. Typical applica-tions include fuel lines, hydraulic systems, air
conditioning systems, water pipe sys-tems, steam traps and bubble diffusers. Pressure loss and flow performance data for orifice plates are often used to design openings in more complex applications, such as film cooling holes in gas tur-bine blades (designed to use a minimal amount of cooling air yet still prevent thermal damage to blade surfaces) or flow control valves (in which flow rates are controlled with the size of the open-ings). However, due to the versatility, low cost and low maintenance of orifice plates, they are most commonly used as orifice flowmeters for measuring flow in pipes or ducts.
Orifice flowmeters consist of a straight-run pipe with a restriction in the form of an orifice plate, which causes obstruction to the flow. Pressure taps are positioned upstream and downstream of the orifice plate to measure pressure drop. Taps can be installed in different configu-rations: flange pressure taps, corner pres-sure taps, and D and D/2 pressure taps. To determine the flow rate across the ori-fice plate, the discharge coefficient across different sizes of orifice plates must be known. These are available in standards such as ISO 5167, ASME MFC-3M and ANSI/API2530.
While a fair amount of reliable data is available to predict flow performance in turbulent flow in short orifice plates (such as those previously described), data are scarce for long orifice plates and lower Reynolds number flows.
ESDU is an engineering advisory organization that provides validated engineering design data, methods and
FLOW VALIDATIONCFD turbulence models correspond well with experimental values.
By Eva Vitova, Engineer of Fluid Mechanics and Francesca Iudicello, Former Head of Fluid Mechanics Group, IHS ESDU, London, U.K.
software to industry professionals and academics. The organization is part of the global information company IHS, which shares insight and analytics in critical areas that shape today’s busi-ness landscape. Data developed by ESDU using validated CFD predictions repre-sent an essential source of accurate and reliable information for industrial appli-cations. This information is required, for example, in designing pipelines to select appropriate pumping equipment, to optimize performance of specific compo-nents, or to determine the size or length of duct networks. ESDU has carried out extensive studies to validate ANSYS CFX CFD software using different turbulence and transition models.
FLOW ACROSS ORIFICE PLATESIntroducing an orifice plate into a pipe system causes a local increase of fluid
velocity and, therefore, a rise in kinetic energy and a drop in pressure. A large flow separation occurs downstream of the orifice plate. Smaller recirculation regions may be present upstream and at the orifice wall, depending on the thick-ness of the orifice plate and the Reynolds number of the flow.
CFD VALIDATION STUDIESESDU has carried out extensive CFD vali-dation studies for the flow across square-edged and knife-edged orifice plates [ESDU TN 10013]. Guidance is provided on the CFD modeling of pressure loss, discharge coefficient and flow character-istics [ESDU BPG-CFD 11010].
The ESDU CFD predictions were val-idated across all flow regimes using ANSYS CFX 11.0. Mesh independency solutions were conducted by systematic sensitivity studies until the percentage
PHO
TO: A
BB I
OM
ASTE
R.
Orifice flowmeter
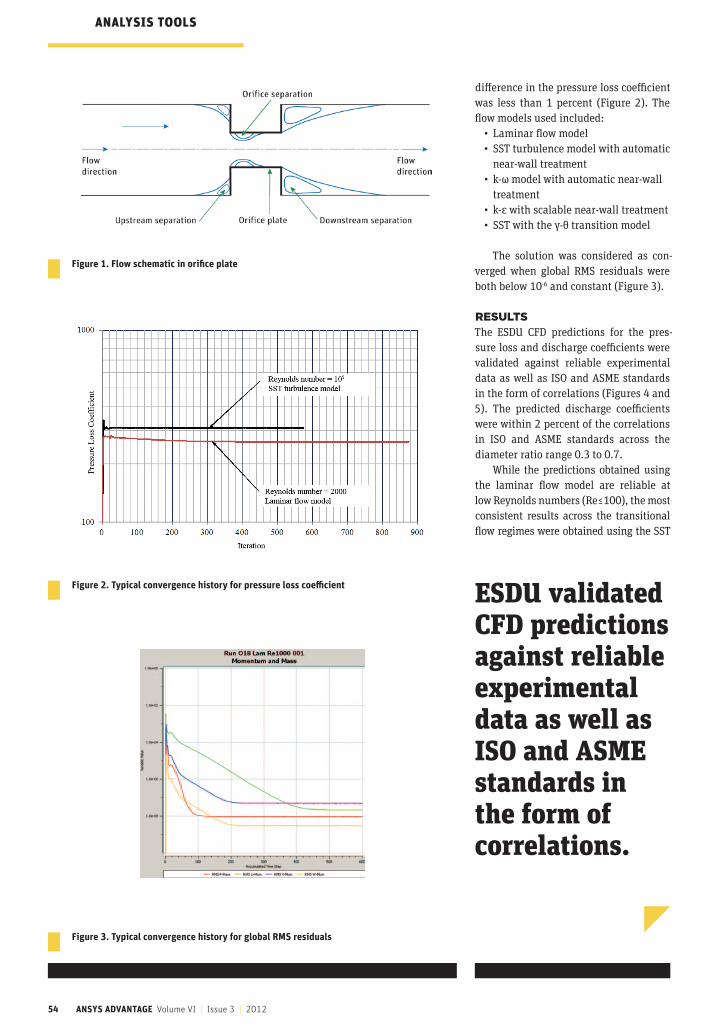
54 ANSYS ADVANTAGE Volume VI | Issue 3 | 2012
ANALYSIS TOOLS
difference in the pressure loss coefficient was less than 1 percent (Figure 2). The flow models used included:
• Laminar flow model• SST turbulence model with automatic
near-wall treatment• k-ω model with automatic near-wall
treatment• k-ε with scalable near-wall treatment• SST with the γ-θ transition model
The solution was considered as con-verged when global RMS residuals were both below 10-6 and constant (Figure 3).
RESULTSThe ESDU CFD predictions for the pres-sure loss and discharge coefficients were validated against reliable experimental data as well as ISO and ASME standards in the form of correlations (Figures 4 and 5). The predicted discharge coefficients were within 2 percent of the correlations in ISO and ASME standards across the diameter ratio range 0.3 to 0.7.
While the predictions obtained using the laminar flow model are reliable at low Reynolds numbers (Re≤100), the most consistent results across the transitional flow regimes were obtained using the SST
ESDU validated CFD predictions against reliable experimental data as well as ISO and ASME standards in the form of correlations.
Figure 1. Flow schematic in orifice plate
Figure 2. Typical convergence history for pressure loss coefficient
Figure 3. Typical convergence history for global RMS residuals
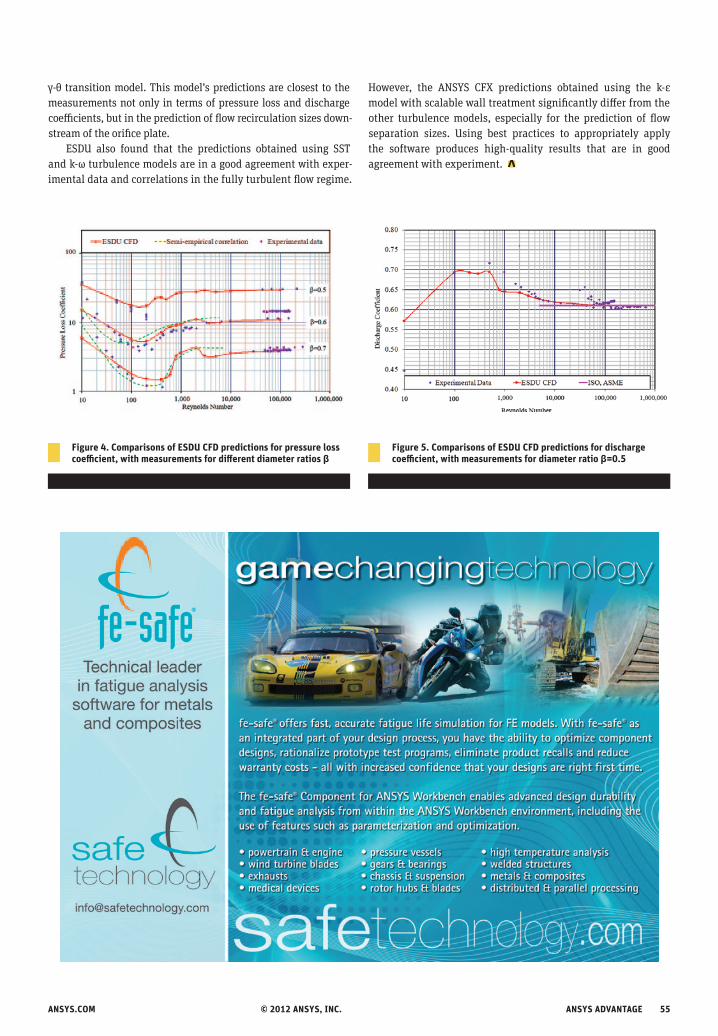
ANSYS.COM © 2012 ANSYS, INC. ANSYS ADVANTAGE 55
γ-θ transition model. This model’s predictions are closest to the measurements not only in terms of pressure loss and discharge coefficients, but in the prediction of flow recirculation sizes down-stream of the orifice plate.
ESDU also found that the predictions obtained using SST and k-ω turbulence models are in a good agreement with exper-imental data and correlations in the fully turbulent flow regime.
However, the ANSYS CFX predictions obtained using the k-ε model with scalable wall treatment significantly differ from the other turbulence models, especially for the prediction of flow separation sizes. Using best practices to appropriately apply the software produces high-quality results that are in good agreement with experiment.
Figure 4. Comparisons of ESDU CFD predictions for pressure loss coefficient, with measurements for different diameter ratios β
Figure 5. Comparisons of ESDU CFD predictions for discharge coefficient, with measurements for diameter ratio β=0.5
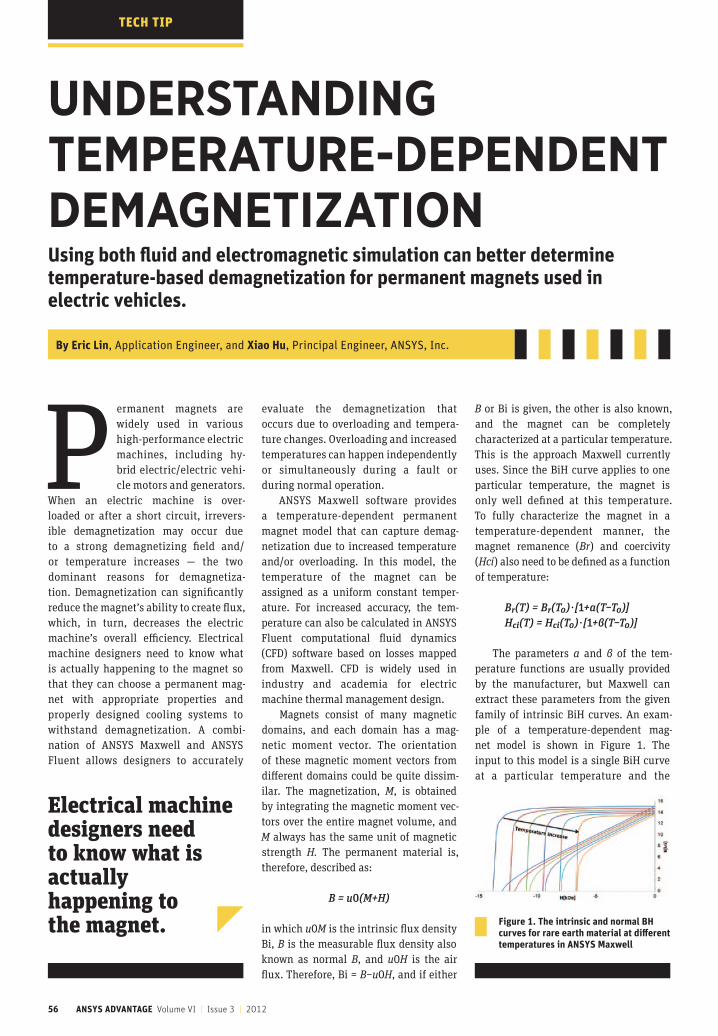
56 ANSYS ADVANTAGE Volume VI | Issue 3 | 2012
TECH TIP
UNDERSTANDING TEMPERATURE-DEPENDENT DEMAGNETIZATIONUsing both fluid and electromagnetic simulation can better determine temperature-based demagnetization for permanent magnets used in electric vehicles.
By Eric Lin, Application Engineer, and Xiao Hu, Principal Engineer, ANSYS, Inc.
P ermanent magnets are widely used in various high-performance electric machines, including hy- brid electric/electric vehi-cle motors and generators.
When an electric machine is over-loaded or after a short circuit, irrevers-ible demagnetization may occur due to a strong demagnetizing field and/or temperature increases — the two dominant reasons for demagnetiza-tion. Demagnetization can significantly reduce the magnet’s ability to create flux, which, in turn, decreases the electric machine’s overall efficiency. Electrical machine designers need to know what is actually happening to the magnet so that they can choose a permanent mag-net with appropriate properties and properly designed cooling systems to withstand demagnetization. A combi-nation of ANSYS Maxwell and ANSYS Fluent allows designers to accurately
evaluate the demagnetization that occurs due to overloading and tempera-ture changes. Overloading and increased temperatures can happen independently or simultaneously during a fault or during normal operation.
ANSYS Maxwell software provides a temperature-dependent permanent magnet model that can capture demag- netization due to increased temperature and/or overloading. In this model, the temperature of the magnet can be assigned as a uniform constant temper-ature. For increased accuracy, the tem-perature can also be calculated in ANSYS Fluent computational fluid dynamics (CFD) software based on losses mapped from Maxwell. CFD is widely used in industry and academia for electric machine thermal management design.
Magnets consist of many magnetic domains, and each domain has a mag-netic moment vector. The orientation of these magnetic moment vectors from different domains could be quite dissim-ilar. The magnetization, M, is obtained by integrating the magnetic moment vec-tors over the entire magnet volume, and M always has the same unit of magnetic strength H. The permanent material is, therefore, described as:
B = u0(M+H)
in which u0M is the intrinsic flux density Bi, B is the measurable flux density also known as normal B, and u0H is the air flux. Therefore, Bi = B−u0H, and if either
B or Bi is given, the other is also known, and the magnet can be completely characterized at a particular temperature. This is the approach Maxwell currently uses. Since the BiH curve applies to one particular temperature, the magnet is only well defined at this temperature. To fully characterize the magnet in a temperature-dependent manner, the magnet remanence (Br) and coercivity (Hci) also need to be defined as a function of temperature:
Br(T) = Br(T₀)⋅[1+α(T−T₀)] Hci(T) = Hci(T₀)⋅[1+β(T−T₀)]
The parameters α and β of the tem-perature functions are usually provided by the manufacturer, but Maxwell can extract these parameters from the given family of intrinsic BiH curves. An exam-ple of a temperature-dependent mag-net model is shown in Figure 1. The input to this model is a single BiH curve at a particular temperature and the
Electrical machine designers need to know what is actually happening to the magnet. Figure 1. The intrinsic and normal BH
curves for rare earth material at different temperatures in ANSYS Maxwell

ANSYS.COM © 2012 ANSYS, INC. ANSYS ADVANTAGE 57
temperature-dependent function. The curves at other tempera-tures are automatically generated by Maxwell.
Temperature gradients in the magnet often cause different parts of the magnet to demagnetize nonuniformly. To capture this demagnetization phenomenon, a spatial temperature dis-tribution for the permanent magnet is required. Fluent can be used in this case.
As an example, an interior permanent magnet motor can be modeled entirely within the ANSYS Workbench environment using Maxwell and Fluent. First, define the temperature-depen-dent model in Maxwell, and set up the motor to run at one of its normal operating conditions. To capture eddy current and core loss phenomena, use the Maxwell transient solver to cal-culate the time-averaged loss distribution — such as winding copper loss, core loss and eddy current losses — at an initial temperature. The loss distribution obtained in this way is shown in Figure 2. This data is used as a heat source in Fluent for the thermal calculation.
In Fluent, generate a thermal model based on the same motor geometry. Using the losses calculated in Maxwell as the heat source, calculate the temperature distribution of the motor.
Calculate the temperature distribution of the motor using the steady-state solver in Fluent based on the heat source from Maxwell. Using the steady-state solver is valid because the elec-trical time scale is much smaller than the thermal time scale. Temperature distribution is then automatically mapped back to Maxwell, in which the magnet is defined as temperature- dependent. Because of this mapping, the magnetic properties of the magnets will change based on the spatial temperature distri-bution. Run Maxwell again to take into account the distributive temperature effects that change the overall performance of the motor. This is an iterative solution, and after four to five itera-tions, the solution usually converges. The temperature effects on the performance of the motor at this particular operating condi-tion can then be studied. Figure 4 shows the torque of the motor with and without the temperature effects. Higher temperatures inhibit torque production. This insight is not possible without understanding the magnet’s temperature dependency and the actual temperature distribution.
Permanent magnets in high-performance electric machines can suffer from severe demagnetization due to overloading and/or overheating. Demagnetization can significantly impair the electric machine’s performance. Knowledge of demagneti-zation is critical for machine designers to properly select mag-net materials and cooling methods. ANSYS Maxwell and ANSYS Fluent provide a temperature-dependent magnet model and tem-perature distribution capabilities that enable designers to gain real insight into what is physically happening. This coupled sim-ulation is performed entirely within the ANSYS Workbench envi-ronment; it is a complete solution for studying demagnetization phenomena due to overloading and temperature effects.
This coupled simulation occurs entirely within ANSYS Workbench and is a complete solution for studying demagnetization phenomena.
Figure 2. Electromagnetic losses calculated in Maxwell can be automatically mapped to Fluent as the heat source to calculate the motor’s temperature distribution. The losses include copper loss in the copper winding, eddy current loss in the permanent magnet, and core loss in the stator and rotor cores.
Figure 3. Temperature distribution of motor calculated in Fluent. The temperature distribution is automatically mapped back to Maxwell, which then changes the conductivity of the copper winding and the magnetic property of the permanent magnet.
Figure 4. The motor produces lower torque when the temperature effect on the permanent magnet is considered.
When Speedo creates a new swimsuit or goggles or a cap, it makes a promise to its customers. That they will glide through the water faster. They’ll earn medals. Break world records.
Using ANSYS simulation technology, Speedo is delivering on that promise by engineering the most cutting-edge product inside the computer. Speedo saves valuable resources by reducing its dependence on costly and time-consuming physical prototypes.
Talk about making a splash.
Champions by DesignWith
Performance by Speedo. Simulation by ANSYS.Realize Your Product Promise®
Visit ANSYS.COM/Speedo to learn how simulation software can help you realize your product promise
Performance by Speedo. Simulation by ANSYS.
ANSYS, Inc.Southpointe275 Technology DriveCanonsburg, PA U.S.A. 15317
Send address corrections [email protected]