simulation of accelerator-driven systemspub_off/lectures/lns012/kadi_003.pdfsimulation of...
TRANSCRIPT

Simulation of Accelerator-Driven Systems
Y. Kadi∗ and F. Carminati
European Organization for Nuclear Research, CERN, Geneva, Switzerland
Lectures given at the Workshop on Hybrid Nuclear Systems for Energy Production,
Utilisation of Actinides & Transmutation of Long-Lived Radioactive Waste Trieste, 3 - 7 September 2001
LNS0212003

Abstract
The neutronic calculations presented in this paper are a result of a state-of-the-art computer code package developed by the EET group at CERN. Both high-energy particle interactions and low-energy neutron transport are treated with a sophisticated method based on a full Monte Carlo simulation, together with modern nuclear data libraries. The code is designed to run both on parallel and scalar computers. A series of experiments carried out at the CERN-PS (i) confirmed that the spallation process is correctly predicted and (ii) validated the reliability of the predictions of the integral neutronic parameters of the Energy Amplifier Demonstration Facility.
Contents
1 Introduction 137
2 The EA-MC Code Package 138 2.1 Structure of the program 138 2.2 Neutron transport and time evolution 139 2.3 Why a Monte Carlo code? 140 2.4 Other codes 145
3 Nuclear Data 148 3.1 Neutron cross sections 148 3.2 Nuclear physics data 149 3.3 Precision and validation of neutron cross section data 151
4 High-Energy Particle Transpor t 156 4.1 The physics 156 4.2 Limitations 158
5 Analysis of the Energy Amplifier Demonstration Facility 162 5.1 Reference configuration 162 5.2 Global neutronic parameters at Beginning-of-Life 164 5.3 Analysis of the high-energy beam – target interactions 166 5.4 Evolution of the main parameters with burn-up 172
6 Conclusions 174
Acknowledgments 175
References 176

ADS Simulation
137
1 Introduction
The sequence of phenomena from high-energy protons induced cascade in a heavy-Z material (lead or lead-bismuth eutectic), producing neutrons that subsequently interact until they are finally absorbed or escape, is rather complex. For a correct simulation of the Energy Amplifier [1,2], it is essential to understand the fine details of the physics related to all these phenomena. In order to do so, an innovative simulation was developed using Monte Carlo techniques. This code allows the description of complex geometrical models. Special attention was devoted to the development of techniques (for kinematic calculation, cross-section evaluation, etc…) to minimize the computer time in order to provide sufficient statistics [3].
The design of accelerator-driven fission devices (also called hybrid systems) requires powerful simulation tools for:
• The modeling of the high-energy cascade and of the neutron production;
• The transport of the low energy (E � 20MeV) neutrons;
• The description of the fuel evolution as a result of neutron interactions and nuclear decays;
• The nuclear transmutation and activation of the structural materials and coolant due to the presence of a neutron fluence and of the proton beam induced high energy cascade.
The simulation tools developed for nuclear reactors cannot be applied immediately to externally driven sub-critical systems and to the Energy Amplifier in particular [2]. Indeed, the spatial distribution of the neutron flux is expected to be radically different in the two cases. While in a critical reactor the flux distribution inside the volume is determined essentially by the boundary conditions, in an Energy Amplifier the effect of the initial high-energy cascade is dominant [2]. In fact, in a sub-critical arrangement the neutron flux along any radial direction starting from the center must fall-off in an approximately exponential manner. The corrections to the exponential behavior depend primarily on the shape of the source and they are important when close to it.
Such a complex simulation had to be validated. It was one of the main goals of the FEAT and TARC Experiments [4,5] carried out at the CERN-PS accelerator complex. Detailed comparisons of the neutron multiplication factor and energy and space distributions of the neutron fluence give an excellent agreement with experimental data. These sets of experiments confirm in particular that the spallation process is correctly predicted and validates the reliability of the predictions of the integral neutronic parameters of the Energy Amplifier Demonstration Facility.

Y. Kadi and F. Carminati
138
2 The EA-MC Code Package
EA-MC is a general geometry, “point-energy” , Monte Carlo code which stochastically calculates the distribution of neutrons in three-dimensional space as a function of energy and time. The neutron data are derived from the latest nuclear data libraries [6]: ENDF/B-VI 6 (USA), JENDL-3.2 (Japan), JEF-2.2 (Europe), EAF-4.2 (Europe), CENDL-2.1 (China), EFF-2.4 (Europe) and BROND-2 (Russia). 2.1 Structure of the program The general architecture of the EA-MC code is shown in Figure 1. The geometrical description is first automatically translated into FLUKA's combinatorial geometry, and the FLUKA simulation is carried out [7]. Neutrons are transported down to 20 MeV and then handed over to EA-MC which continues the transport.
Materials&
Geometry
Flukarun
Neutrons � > 20 MeVSpallation Products
Released Energy
Neutron transport for a
given time(+activation)
Time evolution and materials
update
Cross sectionsmerging
Initialisation
ENDF/B-6cross sectionsand spectra
Nucleardatabase
Fission yieldsdpa, heating
neutron multiplicity
Neutroncollision file
Materialsevolution data
Analysiscode
FLUKA step
EA-MC step
Figure 1: General architecture of the EA-MC simulation of neutron transport and element evolution.
The EA-MC code is designed to run both on parallel and scalar computer hardware. Having used standard language elements, the code can be implemented on different systems. A common initialization section is followed by a parallel phase where every CPU runs an independent simulation with the same initialization data. A parallel analysis program collects the results and calculates
ADS Simulation
139
the standard deviation among the different CPUs. This gives an estimate of the statistical fluctuations [3]. 2.2 Neutron transpor t and time evolution The EA-MC code has taken the most challenging approach to the problem of neutron transport and burn-up simulation. This simulation package integrates neutron transport and evolution of the material composition in the same code. To take into account the time evolution, every proton simulated by the high-energy transport code, FLUKA [7], is scaled-up to a large number of “ real” protons. Once this scale factor is fixed, the value chosen for the accelerator current determines the “real” elapsed time corresponding to one batch of incident protons.
The material composition is updated according to the neutron interactions simulated in every zone. Material composition evolution, due to nuclear decay, is performed between transport steps. High-energy spallation products generated by FLUKA are added to the material composition on a proton by proton basis. The contribution of each fission, spallation, decay and activation product is considered during neutron transport, no “ lumped” fission products are used in our code. Every material can have a different temperature that is inherited by all the nuclear species produced there. New temperatures can be generated during the run either by Doppler broadening or by linear interpolation of existing evaluations.
A typical reactor fuel material can contain a few hundred elements with cross sections and up to 2000 different nuclear species. Even in this case, the time to transport a neutron is approximately 8 µs/processor on our Convex SPP2000 machine.
At the end of each transport phase, all materials are evolved in a time step that varies adaptively during a complete burn-up simulation. To avoid all approximations in the concentration evolution, a complete solution of the Bateman equations involving thousands of elements is computed. A combination of storage techniques and decay chain algorithms allows evolving all materials in few seconds. No time stepping is used, the solution is analytically correct within the assumptions made. Different smoothing techniques have been developed in case of very short-lived elements or strong concentration gradients. The algorithm has been checked for stability against different time durations. An example of element evolution is shown in Figure 2.

Y. Kadi and F. Carminati
140
10-2
10-1
1
10
102
103
104
105
0 20 40 60 80 100 120
Rad
io-n
uclid
e S
tock
pile
(kg
)
Burnup (GW day/ton)
U-232U-236
Th-230
U-233
Th-232
U-234
Pa-233
Pu-238Th-229
Np-237
Th-228
U-235
Pa-231
Figure 2: Evolution of the actinide concentrations during burn-up for a typical Energy Amplifier configuration.
The composition of all the materials is then updated and transport continues for a further cycle. This does not require several separate runs of the simulation/evolution chain, as all is handled by the same code. Moreover, this is done with the full precision inherent to the Monte Carlo transport, and all the effects due to the geometry of the model and to the variation of the neutron energy spectrum are taken into account. This constitutes the innovative aspect of our simulation code. 2.3 Why a Monte Car lo code? Computer programs used for neutron multiplying systems fall into two broad categories: (a) deterministic and (b) Monte Carlo codes. • Deterministic codes, are based on the solution of the neutron transport equations. To make the problem amenable to a computer solution, a discretisation is introduced both in space and in energy. These codes operate on a spatial grid and on a fixed number of energy “groups” . While this approach has shown its viability in many applications, and is widely used to simulate critical reactors, it suffers from some drawbacks that become important in the case of a sub-critical device coupled to a particle accelerator, namely:

ADS Simulation
141
• The neutron source is usually given in terms of a neutron energy spectrum, which has then to be converted into an energy-space grid, introducing an approximation;
• Variations in the neutron energy are governed by a scattering matrix describing the probability of transition among different energy groups. Non-fission multiplying processes of the kind (n,xn) are poorly handled by this formalism, when not totally ignored;
• The fine interplay between the interaction probability peaks (resonances) is of great importance, particularly for fast hybrid systems, and when the interaction probabilities are averaged in the energy groups some effects may be lost or badly modelled;
• Deterministic codes usually describe the working conditions of the “associate critical device”, which is a good approximation if the system under study is close to criticality, but may be very distant from reality when the system is sub-critical;
• The spatial resolution is limited, as space is digitized by a grid. Most of these codes are bi-dimensional, while the few available three-dimensional codes usually require a large amount of computing resources, leading to large computation times;
• Activation can be handled only “off-line” , using the calculated neutron flux, but again through some averaging in space and energy due to the energy group structure, which necessarily introduces approximations which may be difficult to control. In fact the space dependent time-evolution of the fuel is difficult to describe in an analytical code, unless every region is evolved (with “0-Dimension” approximation) separately and with a self-consistent fluence. In this case all fluence calculations have to be made to converge simultaneously, because fluences in every region affects each other and so on...
• The fuel composition does not change during the transport, and so the evolution of the fuel can only be described by several runs alternated with “off-line” material evolution runs, where again the spectral and spatial effects are poorly modelled.
The approximations in an analytical code can be poor or unsafe since:
• Analytical codes are not suited to “explore” new problem domains where the effects of the approximations in the treatment of cross sections is unknown;
• The “convergence” of the differential equations gives the distance only to the mathematical solution, not to the physics reality;
Y. Kadi and F. Carminati
142
• It does not make sense at all to study the behaviour of a sub-critical system with the fundamental eigenfunction of the flux, when we know that the real system involves many higher modes.
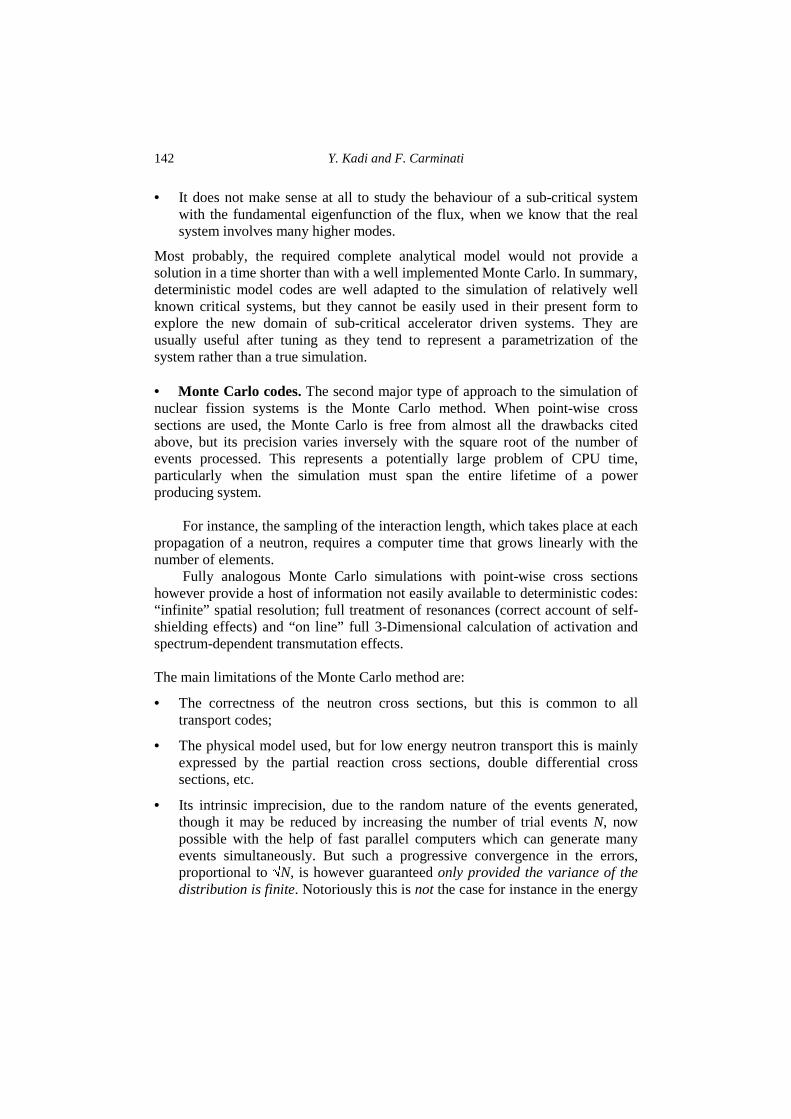
Most probably, the required complete analytical model would not provide a solution in a time shorter than with a well implemented Monte Carlo. In summary, deterministic model codes are well adapted to the simulation of relatively well known critical systems, but they cannot be easily used in their present form to explore the new domain of sub-critical accelerator driven systems. They are usually useful after tuning as they tend to represent a parametrization of the system rather than a true simulation. • Monte Car lo codes. The second major type of approach to the simulation of nuclear fission systems is the Monte Carlo method. When point-wise cross sections are used, the Monte Carlo is free from almost all the drawbacks cited above, but its precision varies inversely with the square root of the number of events processed. This represents a potentially large problem of CPU time, particularly when the simulation must span the entire lifetime of a power producing system.
For instance, the sampling of the interaction length, which takes place at each propagation of a neutron, requires a computer time that grows linearly with the number of elements.
Fully analogous Monte Carlo simulations with point-wise cross sections however provide a host of information not easily available to deterministic codes: “ infinite” spatial resolution; full treatment of resonances (correct account of self-shielding effects) and “on line” full 3-Dimensional calculation of activation and spectrum-dependent transmutation effects. The main limitations of the Monte Carlo method are:
• The correctness of the neutron cross sections, but this is common to all transport codes;
• The physical model used, but for low energy neutron transport this is mainly expressed by the partial reaction cross sections, double differential cross sections, etc.
• Its intrinsic imprecision, due to the random nature of the events generated, though it may be reduced by increasing the number of trial events N, now possible with the help of fast parallel computers which can generate many events simultaneously. But such a progressive convergence in the errors, proportional to
�N, is however guaranteed only provided the variance of the
distribution is finite. Notoriously this is not the case for instance in the energy
ADS Simulation
143
losses due to ionisation cascade of a charged particle in an ordinary medium, where the well known Landau distribution has a variance which is infinite: its width (due to fluctuations) decreases hopelessly slowly with the number of collisions log(
�N). We have shown, that for a fission driven, sub-critical
multiplying medium the variance of the distribution is large but finite, although, surprisingly, the mean multiplication factor M and related fluctuations are dominated by the rare occurrence of the few cascades with the largest fission multiplication. The
�N dependence of the achievable statistical
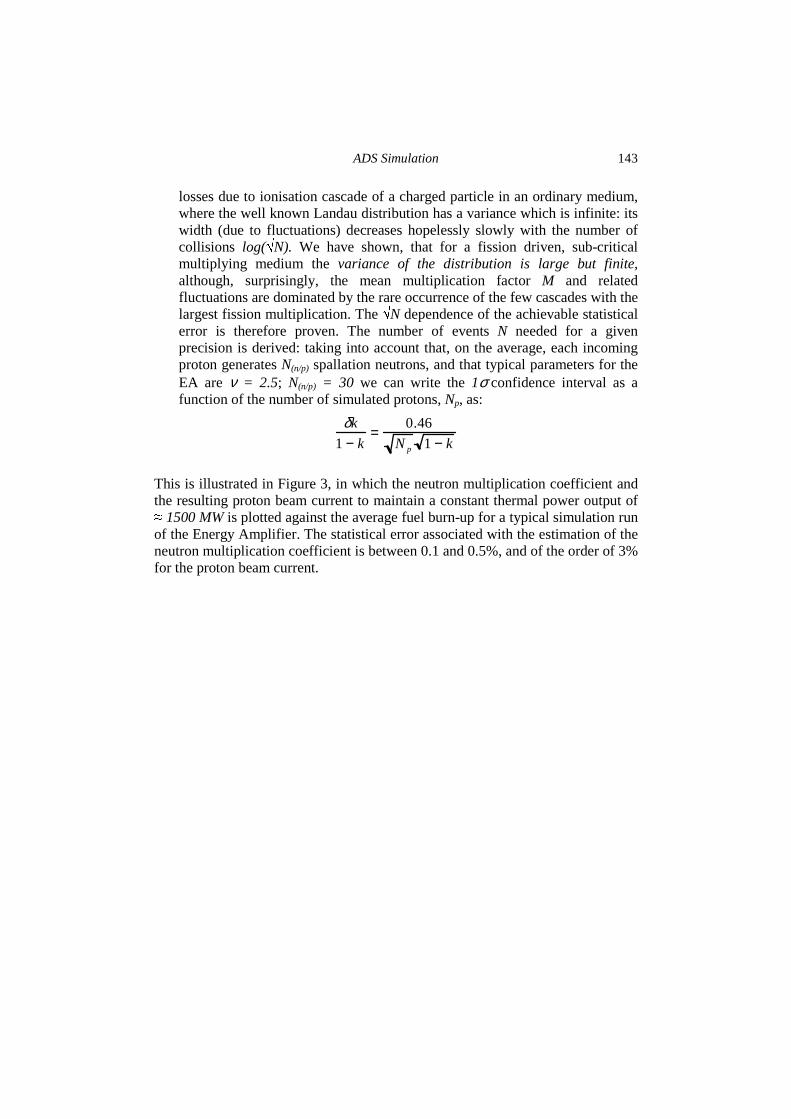
error is therefore proven. The number of events N needed for a given precision is derived: taking into account that, on the average, each incoming proton generates N(n/p) spallation neutrons, and that typical parameters for the EA are ν = 2.5; N(n/p) = 30 we can write the 1σ confidence interval as a function of the number of simulated protons, Np, as:
δk
1 − k=
0.46
Np 1 − k This is illustrated in Figure 3, in which the neutron multiplication coefficient and the resulting proton beam current to maintain a constant thermal power output of � 1500 MW is plotted against the average fuel burn-up for a typical simulation run of the Energy Amplifier. The statistical error associated with the estimation of the neutron multiplication coefficient is between 0.1 and 0.5%, and of the order of 3% for the proton beam current.

Y. Kadi and F. Carminati
144
0.90
0.91
0.92
0.93
0.94
0.95
0.96
0.97
0.98
0.99
1.00
0 20 40 60 80 100 120
Bea
m C
urre
nt (
mA
)
Neu
tron
Mul
tiplic
atio
n C
oeffi
cien
t
Average Fuel Burnup ( GWd/t of [Th-U]O2 )
< Proton Current > Å 14.8 mA
< Ksrc > Å 0.979
0
5
10
15
20
25
30
35
40
45
50
Figure 3: Variation of ksrc (the effective multiplication coefficient in the presence of an external neutron source) and resulting proton beam current to maintain constant thermal
power as a function of burn-up. As already mentioned a number of high quality Monte Carlo codes are available, but none that satisfied entirely all our requirements. More specifically, we needed not only transport but also chemical evolution, so as to allow a precise description of the space and time evolution of the Energy Amplifier.
Such a complex programe requires a massive number of calculations and there is the danger, if it is not fast enough, that it will be impossible in practice, even with a fast computer, to accumulate meaningful statistics. Therefore, the code had to be optimised to allow for a fast treatment of elastic scattering kinematics, dynamical ordering of elements in mixtures, merging of cross sections, etc.
The resulting level of detail reachable in the analysis is such that it became legitimate, during the simulation production phase, to upgrade our computer to fully profit from the newly opened possibilities. With the parallel supercomputer CONVEX SPP 2000 with 16 processors acquired within this programe, each neutron can now be followed completely in 8 µs and adequate statistics can be obtained.

ADS Simulation
145
2.4 Other codes In spite of the fact that we have developed our own Monte Carlo code, we have installed on our computers and used some of the most important other codes available:
• NJOY-94 [8] and PREPRO-94 [9] for the processing of point-wise and group-wise neutron cross sections;
• TWODANT [10] two-dimensional neutron transport theory code;
• TRANSX-2.9 [11] for integral transport theory cell spectrum calculations;
• MCNP-4B [12] and HETC [13] for low and high energy particle Monte Carlo transport;
• ORIGEN2 [14] and 2DB [13] for burn-up calculations;
• SUSD [15] for sensitivity studies.
Our purpose was to make extensive comparisons between TWODANT and our Monte Carlo code. This study has shown that transport theory calculations1 were not appropriate for nuclear systems sensitive to energies from 1 to 500 eV, where there are many broad and intermediate-width resonances which cannot be self-shielded with sufficient accuracy using the Bondarenko approach.
This failure is normally only important for resonance materials that are present in large concentration, such as natPb, 233U and 232Th. This is clearly illustrated in Figures 4a, 4b and 4c, where the dependence of the neutron flux and reaction rates of the isotopes previously mentioned is shown.
For instance, a deviation of more than 18% was observed in the value of the neutron average transport mean free path. At higher energies, the failure to treat explicitly (n,xn), reactions lead to differences up to 25% for instance in the estimation of the (n,2n) reaction rates in the case of the Energy Amplifier.
1100 neutron group cross sections up to Legendre polynomial P3 (GENDF files) were generated from the PENDF and ENDF files using the NJOY module GROUPR. Hereby a suitable weighting spectrum for fast breeder calculations was used, and the cross sections were shielded with the narrow-resonance flux model. The 100 groups include 90 fast energy goups below 14.92 MeV, mostly equally spaced in lethargy, and 10 thermal energy groups below 2.26 eV.

Y. Kadi and F. Carminati
146
Figure 4a: Dependence of the neutron flux spectrum on the number of energy groups used in the calculations with TWODANT deterministic code.
Figure 4b: Dependence of 233U fission rate on the number of energy groups used in the calculations with TWODANT deterministic code.

ADS Simulation
147
Figure 4c: Dependence of natPb capture rate on the number of energy groups used in the calculations with TWODANT deterministic code.
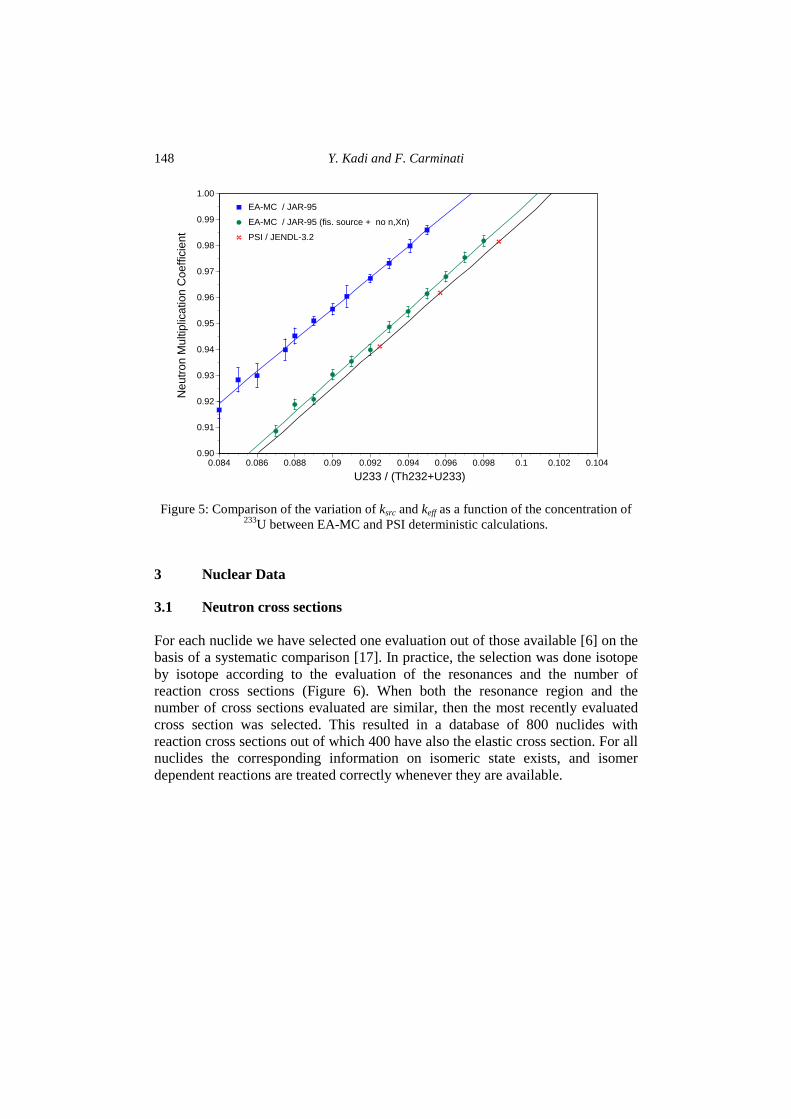
Implementing in the EA-MC code the same assumptions used by standard deterministic codes enables us to reproduce their results. But it must be emphasised that this incomplete description will fail totally in the case of the EA. This is clearly illustrated in Figure 5 where we compare the variation of ksrc and keff as a function of the concentration of 233U between the EA-MC code and PSI deterministic calculations [16]. The results indicate a systematic underestimation of the system reactivity by deterministic codes, of the order of 0.028 in k which implies an error in the estimation of the necessary concentration of 233U close to 5%, which in turn, induces an adverse effect on the stability of k during burn-up.
Y. Kadi and F. Carminati
148
0.90
0.91
0.92
0.93
0.94
0.95
0.96
0.97
0.98
0.99
1.00
0.084 0.086 0.088 0.09 0.092 0.094 0.096 0.098 0.1 0.102 0.104
Neu
tron
Mul
tiplic
atio
n C
oeffi
cien
t
U233 / (Th232+U233)
EA-MC / JAR-95
EA-MC / JAR-95 (fis. source + no n,Xn)
PSI / JENDL-3.2
Figure 5: Comparison of the variation of ksrc and keff as a function of the concentration of 233U between EA-MC and PSI deterministic calculations.
3 Nuclear Data
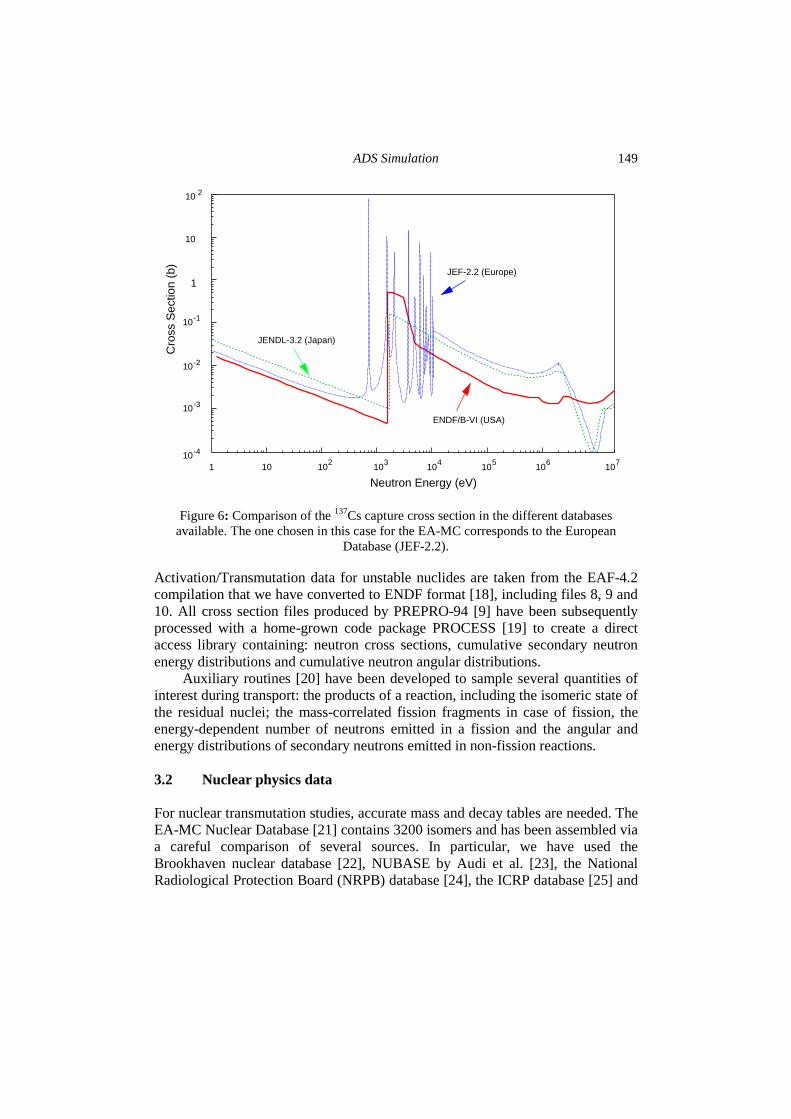
3.1 Neutron cross sections For each nuclide we have selected one evaluation out of those available [6] on the basis of a systematic comparison [17]. In practice, the selection was done isotope by isotope according to the evaluation of the resonances and the number of reaction cross sections (Figure 6). When both the resonance region and the number of cross sections evaluated are similar, then the most recently evaluated cross section was selected. This resulted in a database of 800 nuclides with reaction cross sections out of which 400 have also the elastic cross section. For all nuclides the corresponding information on isomeric state exists, and isomer dependent reactions are treated correctly whenever they are available.
ADS Simulation
149
10-4
10-3
10-2
10-1
1
10
10 2
1 10 102 103 104 105 106 107
Neutron Energy (eV)
Cro
ss S
ectio
n (b
)
ENDF/B-VI (USA)
JEF-2.2 (Europe)
JENDL-3.2 (Japan)
Figure 6: Comparison of the 137Cs capture cross section in the different databases available. The one chosen in this case for the EA-MC corresponds to the European
Database (JEF-2.2).
Activation/Transmutation data for unstable nuclides are taken from the EAF-4.2 compilation that we have converted to ENDF format [18], including files 8, 9 and 10. All cross section files produced by PREPRO-94 [9] have been subsequently processed with a home-grown code package PROCESS [19] to create a direct access library containing: neutron cross sections, cumulative secondary neutron energy distributions and cumulative neutron angular distributions.
Auxiliary routines [20] have been developed to sample several quantities of interest during transport: the products of a reaction, including the isomeric state of the residual nuclei; the mass-correlated fission fragments in case of fission, the energy-dependent number of neutrons emitted in a fission and the angular and energy distributions of secondary neutrons emitted in non-fission reactions. 3.2 Nuclear physics data For nuclear transmutation studies, accurate mass and decay tables are needed. The EA-MC Nuclear Database [21] contains 3200 isomers and has been assembled via a careful comparison of several sources. In particular, we have used the Brookhaven nuclear database [22], NUBASE by Audi et al. [23], the National Radiological Protection Board (NRPB) database [24], the ICRP database [25] and

Y. Kadi and F. Carminati
150
nuclear data information from ENDF files. For each isomer we store the atomic number, the chemical symbol, the mass number, the isomeric level, the isospin and parity, the mass excess, the half-life, the decay modes, branching ratios and Q values where applicable, the natural isotopic abundance and the inhalation and ingestion radiotoxicities [26].
This database represents a major improvement over all existing ones for use in a Monte Carlo. All available information about isomeric state decays and production has been included. Nuclear data have been extensively checked for inconsistencies. In particular all decay paths are closed (i.e. they terminate in a nuclide present in the database) and all branching ratios are consistent (i.e. sum = 100%). We also make sure that the information between neutron cross sections and nuclear data is consistent. All nuclei produced by nuclear reactions for which the cross section data exist, must be present in the nuclear database. All nuclear masses are consistent between cross sections, isomer yield files and nuclear databases. This database is probably the most extensive and effective summary of nuclear data available at this time (Figure 7).
-10
0
10
20
30
40
50
60
0 20 40 60 80 100 120
A -
2×Z
Z
EA-MC nuclear database (3200 nuclides)
EA-MC cross section database (393 nuclides)
EAF-4.2 activation database (399 nuclides)
Figure 7: Summary of the element content in the EA-MC nuclear database, illustrated by a plot of A - 2Z vs Z, showing the larger extent of the EA-MC Database.
ADS Simulation
151
3.3 Precision and validation of neutron cross section data The IAEA ADS Neutronic Benchmark (Stage 1) [16] showed that there are significant weaknesses concerning the cross sections relevant to ADS calculations. To further develop the subject, some of the differences between the one-group cross sections of two of the libraries are highlighted.
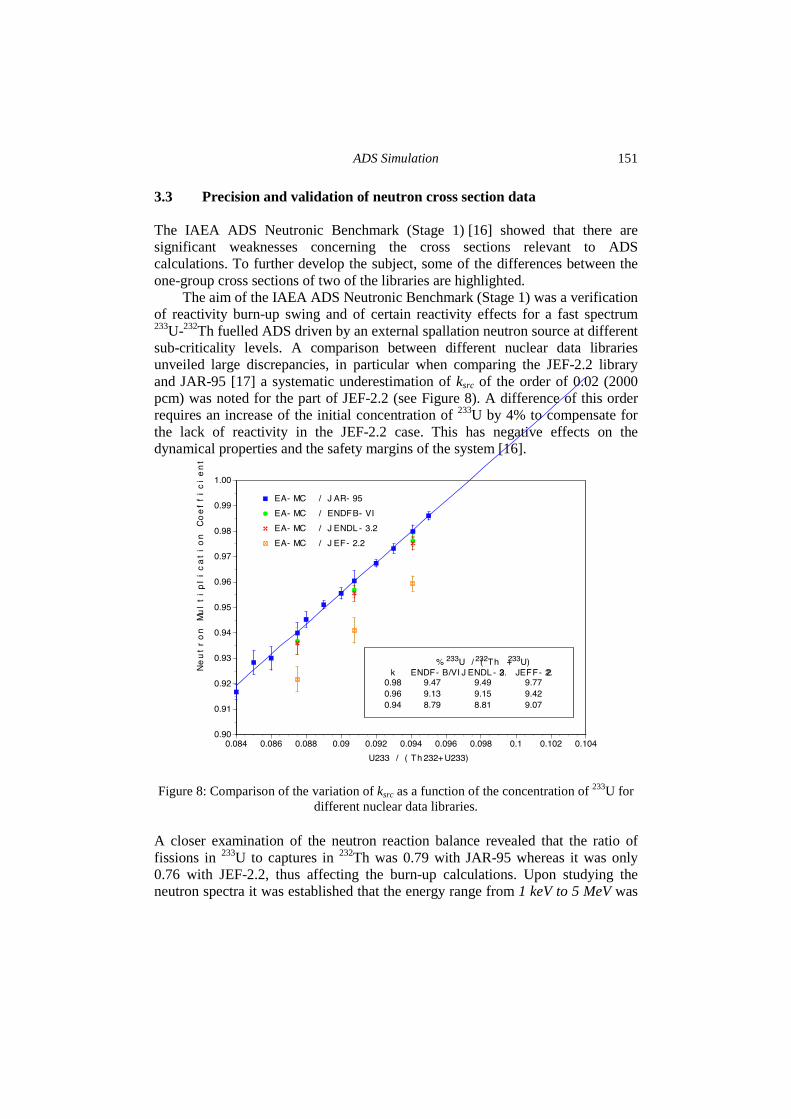
The aim of the IAEA ADS Neutronic Benchmark (Stage 1) was a verification of reactivity burn-up swing and of certain reactivity effects for a fast spectrum 233U-232Th fuelled ADS driven by an external spallation neutron source at different sub-criticality levels. A comparison between different nuclear data libraries unveiled large discrepancies, in particular when comparing the JEF-2.2 library and JAR-95 [17] a systematic underestimation of ksrc of the order of 0.02 (2000 pcm) was noted for the part of JEF-2.2 (see Figure 8). A difference of this order requires an increase of the initial concentration of 233U by 4% to compensate for the lack of reactivity in the JEF-2.2 case. This has negative effects on the dynamical properties and the safety margins of the system [16].
0.90
0.91
0.92
0.93
0.94
0.95
0.96
0.97
0.98
0.99
1.00
0.084 0.086 0.088 0.09 0.092 0.094 0.096 0.098 0.1 0.102 0.104
Neutron Multiplication Coefficient
U233 / (Th232+U233)
EA-MC / JAR-95
EA-MC / ENDFB-VI
EA-MC / JENDL-3.2
EA-MC / JEF-2.2
% 233U / (232Th +233U)
k ENDF-B/VIJENDL-3.2 JEFF-2.20.98 9.47 9.49 9.77
0.96 9.13 9.15 9.42
0.94 8.79 8.81 9.07
Figure 8: Comparison of the variation of ksrc as a function of the concentration of 233U for different nuclear data libraries.
A closer examination of the neutron reaction balance revealed that the ratio of fissions in 233U to captures in 232Th was 0.79 with JAR-95 whereas it was only 0.76 with JEF-2.2, thus affecting the burn-up calculations. Upon studying the neutron spectra it was established that the energy range from 1 keV to 5 MeV was
Y. Kadi and F. Carminati
152
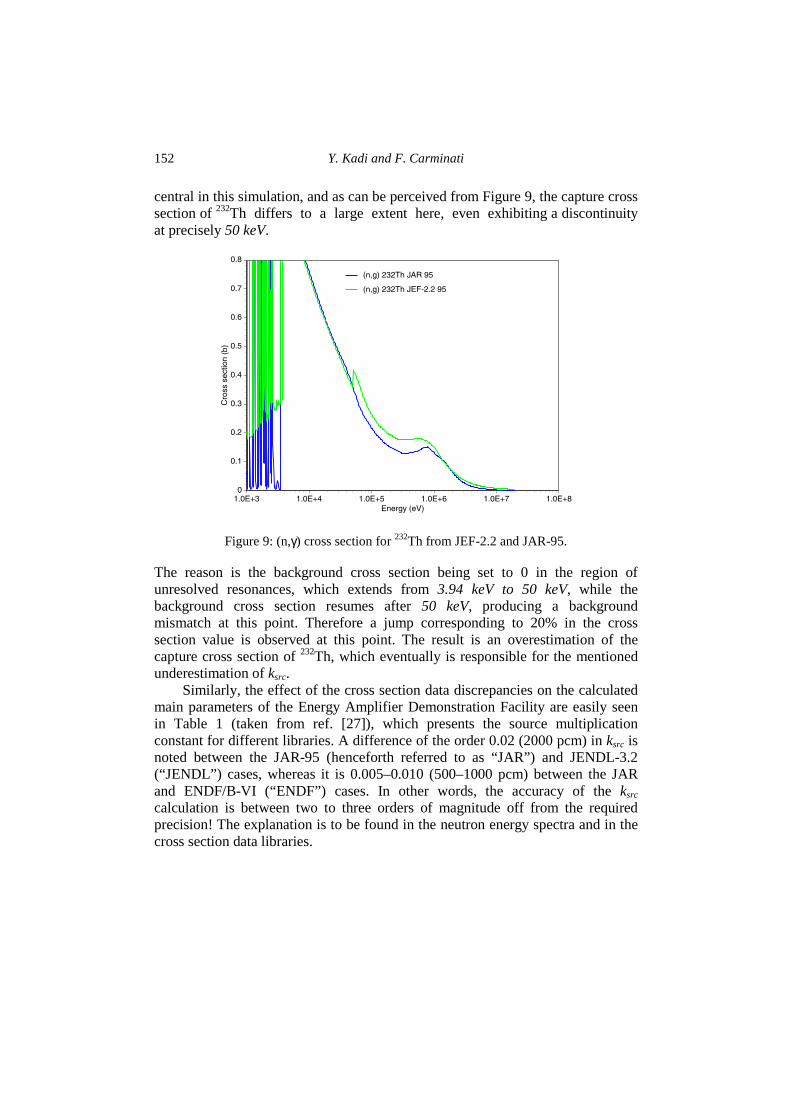
central in this simulation, and as can be perceived from Figure 9, the capture cross section of 232Th differs to a large extent here, even exhibiting a discontinuity at precisely 50 keV.
����������� ��� ��� ���������
0
0.1
0.2
0.3
0.4
0.5
0.6
0.7
0.8
1.0E+3 1.0E+4 1.0E+5 1.0E+6 1.0E+7 1.0E+8
Cro
ss s
ectio
n (b
)
Energy (eV)
(n,g) 232Th JAR 95
(n,g) 232Th JEF-2.2 95
Figure 9: (n,γ) cross section for 232Th from JEF-2.2 and JAR-95.
The reason is the background cross section being set to 0 in the region of unresolved resonances, which extends from 3.94 keV to 50 keV, while the background cross section resumes after 50 keV, producing a background mismatch at this point. Therefore a jump corresponding to 20% in the cross section value is observed at this point. The result is an overestimation of the capture cross section of 232Th, which eventually is responsible for the mentioned underestimation of ksrc.
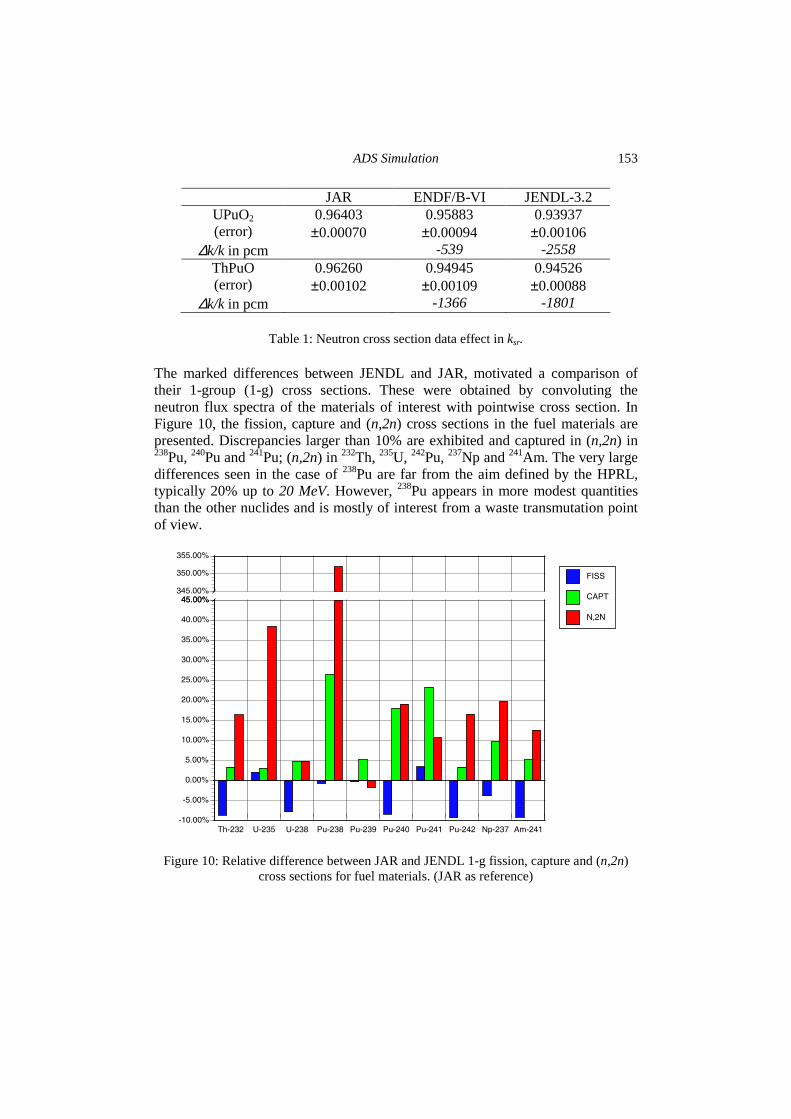
Similarly, the effect of the cross section data discrepancies on the calculated main parameters of the Energy Amplifier Demonstration Facility are easily seen in Table 1 (taken from ref. [27]), which presents the source multiplication constant for different libraries. A difference of the order 0.02 (2000 pcm) in ksrc is noted between the JAR-95 (henceforth referred to as “JAR”) and JENDL-3.2 (“JENDL”) cases, whereas it is 0.005–0.010 (500–1000 pcm) between the JAR and ENDF/B-VI (“ENDF”) cases. In other words, the accuracy of the ksrc calculation is between two to three orders of magnitude off from the required precision! The explanation is to be found in the neutron energy spectra and in the cross section data libraries.
ADS Simulation
153
JAR ENDF/B-VI JENDL-3.2 UPuO2 0.96403 0.95883 0.93937 (error) ±0.00070 ±0.00094 ±0.00106
∆k/k in pcm -539 -2558 ThPuO 0.96260 0.94945 0.94526 (error) ±0.00102 ±0.00109 ±0.00088
∆k/k in pcm -1366 -1801
Table 1: Neutron cross section data effect in ksr. The marked differences between JENDL and JAR, motivated a comparison of their 1-group (1-g) cross sections. These were obtained by convoluting the neutron flux spectra of the materials of interest with pointwise cross section. In Figure 10, the fission, capture and (n,2n) cross sections in the fuel materials are presented. Discrepancies larger than 10% are exhibited and captured in (n,2n) in 238Pu, 240Pu and 241Pu; (n,2n) in 232Th, 235U, 242Pu, 237Np and 241Am. The very large differences seen in the case of 238Pu are far from the aim defined by the HPRL, typically 20% up to 20 MeV. However, 238Pu appears in more modest quantities than the other nuclides and is mostly of interest from a waste transmutation point of view.
Th-232 U-235 U-238 Pu-238 Pu-239 Pu-240 Pu-241 Pu-242 Np-237 Am-241 -10.00%
-5.00%
0.00%
5.00%
10.00%
15.00%
20.00%
25.00%
30.00%
35.00%
40.00%
45.00% 45.00% 345.00%
350.00%
355.00%
FISS
CAPT
N,2N
Figure 10: Relative difference between JAR and JENDL 1-g fission, capture and (n,2n) cross sections for fuel materials. (JAR as reference)

Y. Kadi and F. Carminati
154
Figure 11 shows the differences for elastic and inelastic scattering cross sections in the fuel. The most notable differences are seen for both cross sections in 238Pu and 241Pu, but also over 10% differences are found for inelastic scattering in 235U, 240Pu and 241Pu.
Th-232 U-235 U-238 Pu-238 Pu-239 Pu-240 Pu-241 Pu-242 Np-237 Am-241-80%
-70%-70%-40%
-30%
-20%
-10%
0%
10%
20%
30%30%N,NE
N,NI
Figure 11: Relative difference between JAR and JENDL 1-g (n,n) and (n,n’ ) cross sections for fuel materials.
Capture, (n,2n), elastic and inelastic scattering cross sections have all been included in Figure 12, exhibiting their relative difference in cladding materials. 55Mn is the only nuclide for which all the cross sections agree to an accuracy of 10%. The Fe isotopes have these cross sections generally determined to an accuracy between 10% and 20%, which is a factor 2 or more than what is specified on the HPRL. If the most abundant isotopes are considered, 56Fe, 52Cr and 54Fe, it can be concluded that the discrepancy in capture again will dominate the one in (n,2n), and even more so, since in two of these nuclides actually register a deficit in the (n,2n) 1-g cross section (for 56Fe cf. discussion on Figure 10).

ADS Simulation
155
Fe-54 Fe-56 Fe-57 Fe-58 Cr-50 Cr-52 Cr-53 Mn-55 -40.00%
-30.00%
-20.00%
-10.00%
0.00%
10.00%
20.00%
30.00%
40.00%
50.00%
CAPTURE
N,2N
N,NE
N,NI
Figure 12: Relative difference between JAR and JENDL 1-group capture, (n,2n), (n,n) and (n,n’ ) cross sections for cladding materials.
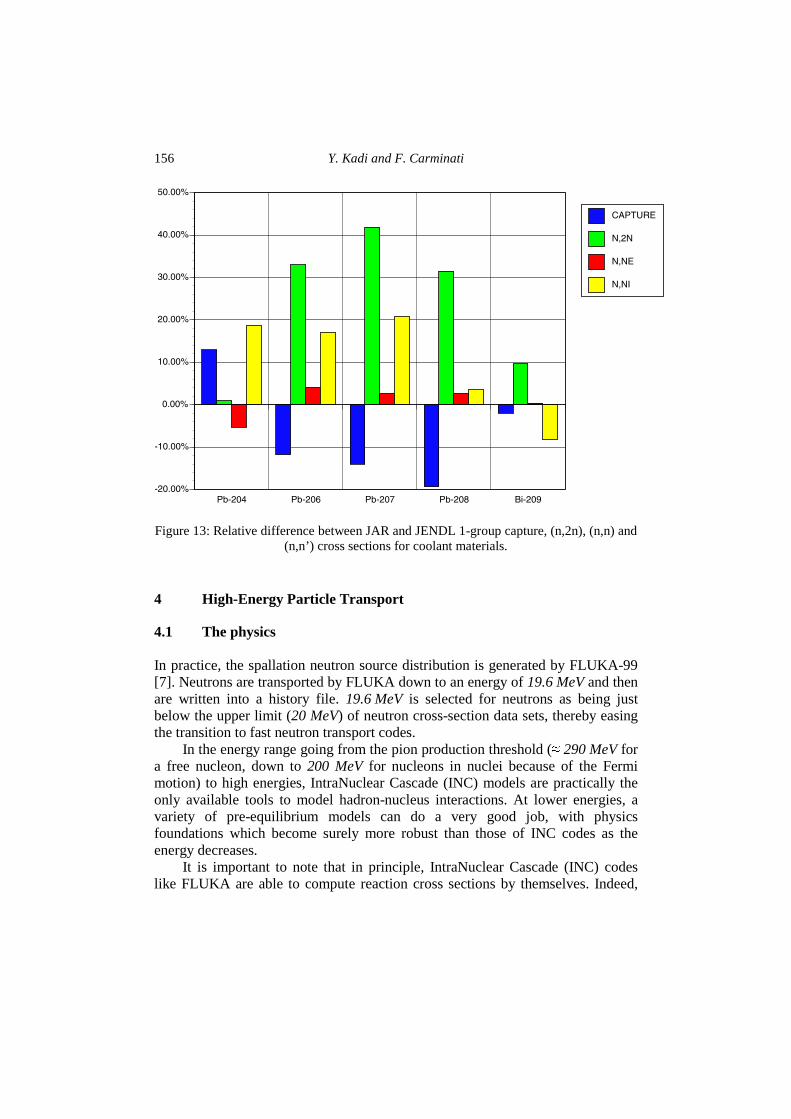
Figure 13, presents the relative difference between capture, (n,2n), elastic and inelastic scattering cross sections in the coolant. Differences are in general over 10% for (n,2n), inelastic scattering and capture for the Pb isotopes. The libraries are seen to agree better for 209Bi, although (n,2n) and inelastic scattering show a variation of close to 10%. The elastic scattering cross section differences stay around or below 5%. The fact that JENDL generally lists higher (n,2n) 1-g cross sections, but still gets a lower occurrence of (n,xn), is explained by the spectrum effect affecting the 1 MeV threshold region.
Y. Kadi and F. Carminati
156
Pb-204 Pb-206 Pb-207 Pb-208 Bi-209 -20.00%
-10.00%
0.00%
10.00%
20.00%
30.00%
40.00%
50.00%
CAPTURE
N,2N
N,NE
N,NI
Figure 13: Relative difference between JAR and JENDL 1-group capture, (n,2n), (n,n) and (n,n’ ) cross sections for coolant materials.
4 High-Energy Particle Transpor t
4.1 The physics In practice, the spallation neutron source distribution is generated by FLUKA-99 [7]. Neutrons are transported by FLUKA down to an energy of 19.6 MeV and then are written into a history file. 19.6 MeV is selected for neutrons as being just below the upper limit (20 MeV) of neutron cross-section data sets, thereby easing the transition to fast neutron transport codes.
In the energy range going from the pion production threshold (� 290 MeV for a free nucleon, down to 200 MeV for nucleons in nuclei because of the Fermi motion) to high energies, IntraNuclear Cascade (INC) models are practically the only available tools to model hadron-nucleus interactions. At lower energies, a variety of pre-equilibrium models can do a very good job, with physics foundations which become surely more robust than those of INC codes as the energy decreases.
It is important to note that in principle, IntraNuclear Cascade (INC) codes like FLUKA are able to compute reaction cross sections by themselves. Indeed,

ADS Simulation
157
the reaction cross section is given by the product of the geometrical cross section by the probability of interaction.
The basic assumption in calculations of intranuclear cascades is that nuclear reactions involving incident particles of high energy can be described in terms of hadron-nucleon collisions within the nucleus. Therefore, a description mainly phenomenological, of hadron-nucleon interactions is essential in understanding the following more complex treatment of nuclear interactions. The FLUKA code adopts the following logic:
• target nucleus description, typically realized through a few concentric spheres of different density and Fermi energy;
• geometrical cross section, corresponding to the nuclear radius or to the maximum possible impact parameter;
• impact parameter selection with a constant probability over the geometrical cross section area. More than one selection can be required if the particle crosses the nucleus without interacting;
• interaction point selection and projectile tracking through the nucleus, according to Fermi motion averaged hadron-nucleon cross sections and possibly to the nuclear mean field, including the Coulomb field;
• target nucleon selection according hadron-pion and hadron-nucleon cross sections and local Fermi energy;
• interaction simulation according to free hN interactions, local Fermi energy and Pauli blocking;
• secondary tracking into the nucleus, until interaction, escape, or energy cut-off;
• pre-equilibrium stage, whenever all excited nucleons are below a given energy threshold (typically a few tens of MeV). This stage is included only in the most recent developments;
• evaporation stage whenever the pre-equilibrium stage is finished, or all particles are below a given threshold (usually of the order of the binding energy), and the system can be assumed to be equilibrated;
• final de-excitation stage when the excitation energy is below the threshold for particle emission and it is spent through photon emission.
A more detailed description of the physics involved in all stages can be found in ref.[28].
Y. Kadi and F. Carminati
158
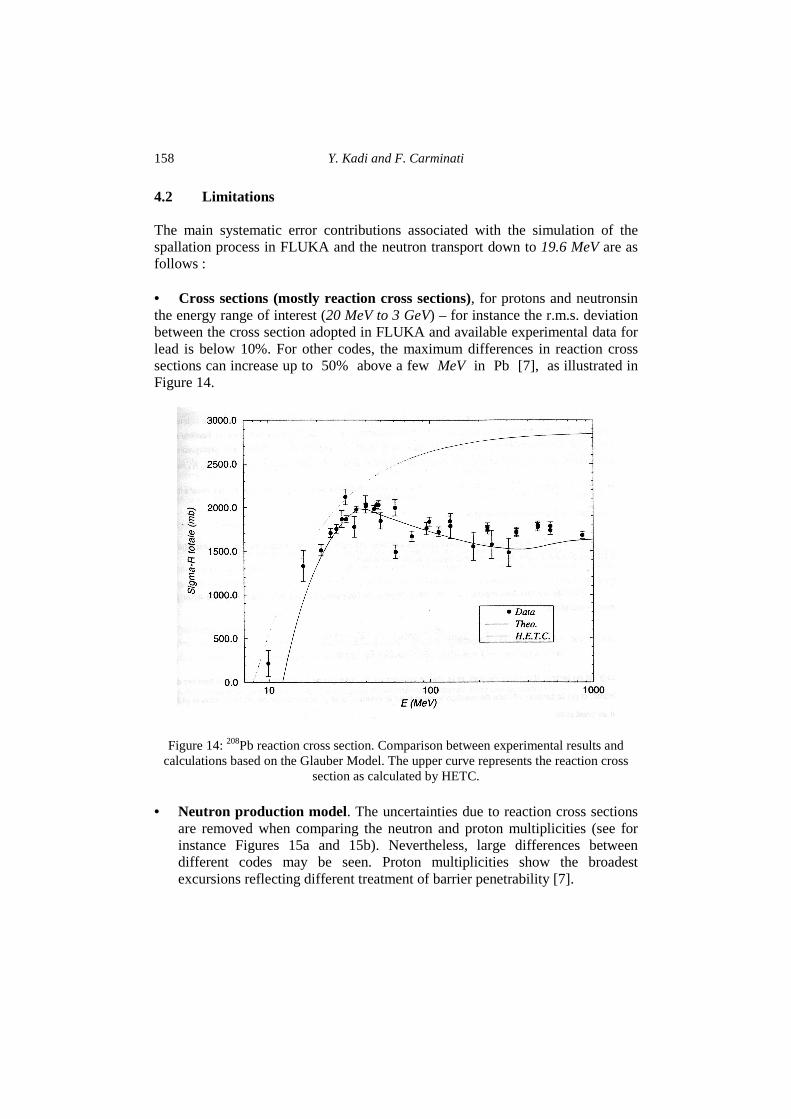
4.2 L imitations The main systematic error contributions associated with the simulation of the spallation process in FLUKA and the neutron transport down to 19.6 MeV are as follows : • Cross sections (mostly reaction cross sections), for protons and neutronsin the energy range of interest (20 MeV to 3 GeV) – for instance the r.m.s. deviation between the cross section adopted in FLUKA and available experimental data for lead is below 10%. For other codes, the maximum differences in reaction cross sections can increase up to 50% above a few MeV in Pb [7], as illustrated in Figure 14.
Figure 14: 208Pb reaction cross section. Comparison between experimental results and calculations based on the Glauber Model. The upper curve represents the reaction cross
section as calculated by HETC. • Neutron production model. The uncertainties due to reaction cross sections
are removed when comparing the neutron and proton multiplicities (see for instance Figures 15a and 15b). Nevertheless, large differences between different codes may be seen. Proton multiplicities show the broadest excursions reflecting different treatment of barrier penetrability [7].

ADS Simulation
159
Figure 15a: Neutron production differential cross section for thin Pb target bombarded by 113 MeV protons. Comparison of experimental results with standard HETC (histograms)
and MINGUS (solid line) calculations.
Figure 15b: Neutron production differential cross section for thin Pb target bombarded by 800 MeV protons. Comparison of experimental results with standard HETC (histograms)
and MINGUS (solid line) calculations.

Y. Kadi and F. Carminati
160
Neutron multiplicities reach nearly a factor two difference, and this would be a serious consideration when using codes for calculating the efficiency of ADS facilities. This difference may be somewhat mitigated in the thick target transport calculations since results show lower microscopic multiplicities may have higher average emission energies [7]. These in turn will give higher secondary emission multiplicities, partially compensating differences in the primary spectra (see Figure 16).
Figure 16: Number of neutrons produced per proton as a function of proton incident energy for a thick Pb target. Comparison of experimental results with standard TIERCE
calculations. The model used in FLUKA to describe nuclear interactions has been extensively benchmarked against several sets of experimental data. Double differential data about neutron production in lead are available for energies from 20 MeV to 3 GeV. The predicted double differential spectra agree with the experimental data within a factor two. The total neutron multiplicity can be estimated with errors not exceeding 10%.
ADS Simulation
161
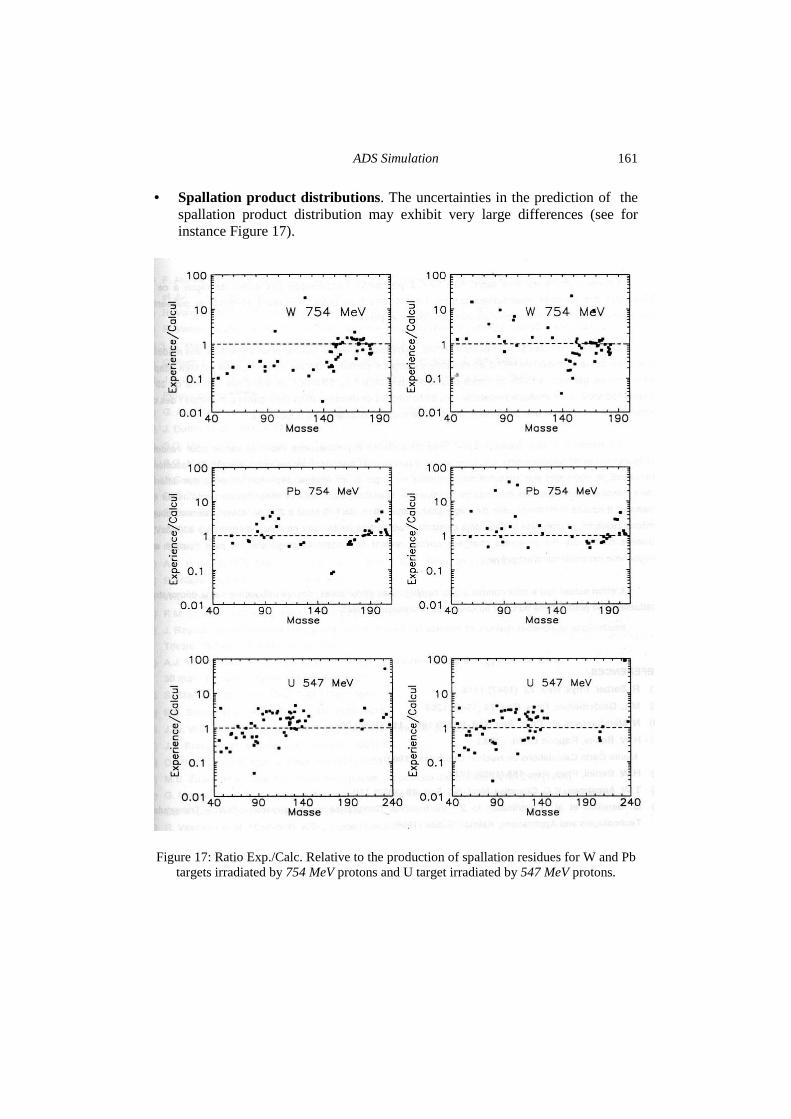
• Spallation product distr ibutions. The uncertainties in the prediction of the spallation product distribution may exhibit very large differences (see for instance Figure 17).
Figure 17: Ratio Exp./Calc. Relative to the production of spallation residues for W and Pb targets irradiated by 754 MeV protons and U target irradiated by 547 MeV protons.
Y. Kadi and F. Carminati
162
5 Analysis of the Energy Amplifier Demonstration Facility
The key objective of the Energy Amplifier Demonstration Facility (EADF), in a first approximation, aims at demonstrating the technical feasibility of a fast neutron operated accelerator-driven system cooled by molten lead-bismuth eutectic (instead of pure molten lead) and in a second phase that of incinerating TRUs and long-lived fission fragments while producing energy. Therefore, it was adopted to use SuperPhénix type U-Pu MOX fuel (instead of thorium-based fuels) which had already been certified and which utilisation in this particular context could stand close scrutiny. 5.1 Reference configuration As in the case of the Energy Amplifier's conceptual design [2], the EADF core consists of an annular structure immersed in molten lead-bismuth eutectic which serves as primary coolant and spallation target (Figure 18). The central annulus contains the spallation target unit which couples the proton accelerator to the sub-critical core. The core is arranged in a honeycomb-like array forming an annulus with four coaxial hexagonal rings of fuel sub-assemblies. The fuel core is itself surrounded by an annular honeycomb-like array of four rings of dummy sub-assemblies, which are essentially empty ducts. The detailed description of the EADF reference configuration can be found in ref. [1].
The present version of the EA Monte Carlo code package enables a rather complete and detailed modelisation of the EADF reference configuration at the level of individual fuel pins or heat exchanger tubes (presently arranged in square lattices). All the major core components have been taken into consideration, such as:
• the fuel sub-assemblies including hexagonal wrapper tubes, spacer grids, central supporting tubes and individual fuel pins;
• the off-core structures such as the radial/axial reflectors and neutron protection structures;
• the primary cooling circuit including the heat exchangers, primary coolant purification units, gas-riser units and primary flow guides;
• the spallation target unit including its dedicated heat removal system;
• the reactor and safety containment vessels including RVACS system.

ADS Simulation
163
1
2
3
4
5
6
7
8
9
10
1. CORE
4. ACS
6. SA TRANSFER MACHINE7. INT. HEAT EXCH.8. SA HANDLING CHANNEL9. SA BASKET10. COVER GAS COOLER
2. REACTOR VESSELS
5. TARGET UNIT
3. ROTATING PLUGS
Figure 18: Schematic view of the reactor system assembly (Source: Ansaldo Nucleare ref.[1]).
Contrary to the preliminary neutronics analysis carried out by ENEA [29], the fuel sub-assemblies are not homogenized. In fact, the fuel pin is sub-divided into 4 radial zones consisting of the steel clad, intermediate gap region, the fuel pellet and its central void region; and 21 axial zones taking into consideration the lower and upper plenum together with both depleted-uranium axial blankets, the supporting and spacer grids, and a series of 13 fuel segments.
Y. Kadi and F. Carminati
164
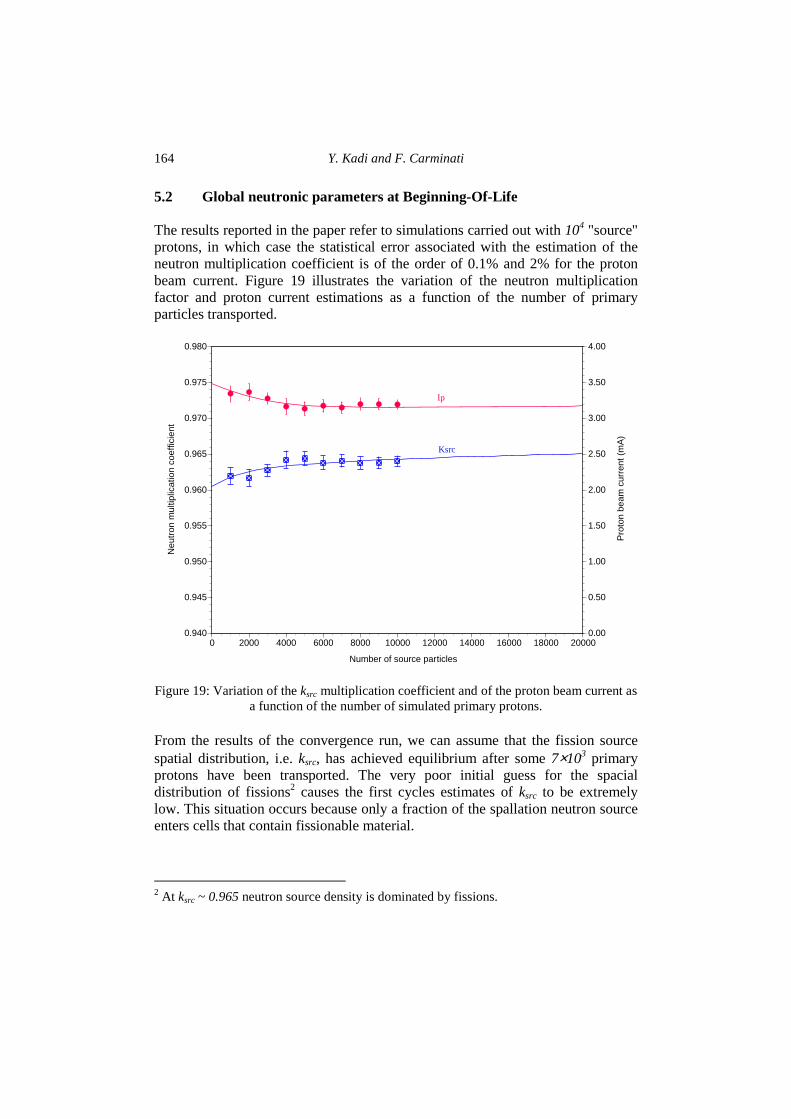
5.2 Global neutronic parameters at Beginning-Of-Life The results reported in the paper refer to simulations carried out with 104 "source" protons, in which case the statistical error associated with the estimation of the neutron multiplication coefficient is of the order of 0.1% and 2% for the proton beam current. Figure 19 illustrates the variation of the neutron multiplication factor and proton current estimations as a function of the number of primary particles transported.
0.940
0.945
0.950
0.955
0.960
0.965
0.970
0.975
0.980
0.00
0.50
1.00
1.50
2.00
2.50
3.00
3.50
4.00
0 2000 4000 6000 8000 10000 12000 14000 16000 18000 20000
Neu
tron
mul
tiplic
atio
n co
effic
ient
Pro
ton
beam
cur
rent
(m
A)
Number of source particles
Ip
Ksrc
Figure 19: Variation of the ksrc multiplication coefficient and of the proton beam current as a function of the number of simulated primary protons.
From the results of the convergence run, we can assume that the fission source spatial distribution, i.e. ksrc, has achieved equilibrium after some 7×10³ primary protons have been transported. The very poor initial guess for the spacial distribution of fissions2 causes the first cycles estimates of ksrc to be extremely low. This situation occurs because only a fraction of the spallation neutron source enters cells that contain fissionable material.
2 At ksrc ~ 0.965 neutron source density is dominated by fissions.
ADS Simulation
165
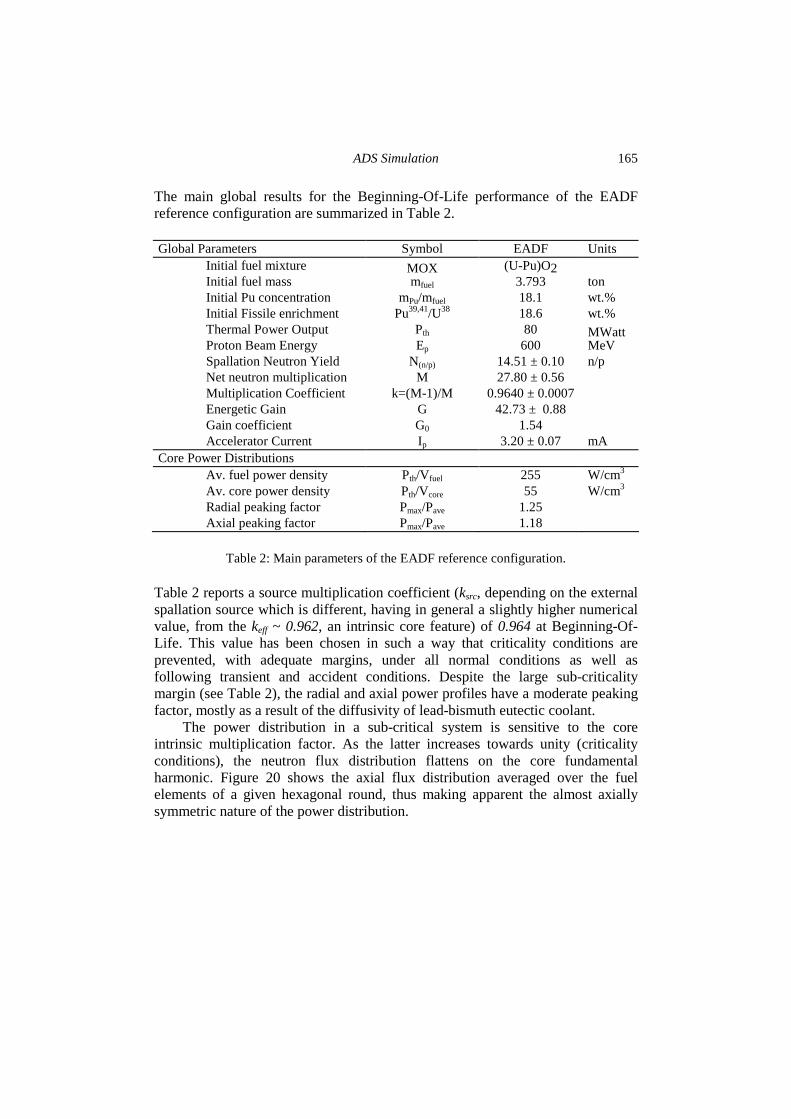
The main global results for the Beginning-Of-Life performance of the EADF reference configuration are summarized in Table 2. Global Parameters Symbol EADF Units Initial fuel mixture MOX (U-Pu)O2 Initial fuel mass mfuel 3.793 ton Initial Pu concentration mPu/mfuel 18.1 wt.% Initial Fissile enrichment Pu39,41/U38 18.6 wt.% Thermal Power Output Pth 80 MWatt Proton Beam Energy Ep 600 MeV Spallation Neutron Yield N(n/p) 14.51 ± 0.10 n/p Net neutron multiplication M 27.80 ± 0.56 Multiplication Coefficient k=(M-1)/M 0.9640 ± 0.0007 Energetic Gain G 42.73 ± 0.88 Gain coefficient G0 1.54 Accelerator Current Ip 3.20 ± 0.07 mA Core Power Distributions Av. fuel power density Pth/V fuel 255 W/cm3 Av. core power density Pth/Vcore 55 W/cm3 Radial peaking factor Pmax/Pave 1.25 Axial peaking factor Pmax/Pave 1.18
Table 2: Main parameters of the EADF reference configuration.
Table 2 reports a source multiplication coefficient (ksrc, depending on the external spallation source which is different, having in general a slightly higher numerical value, from the keff ~ 0.962, an intrinsic core feature) of 0.964 at Beginning-Of-Life. This value has been chosen in such a way that criticality conditions are prevented, with adequate margins, under all normal conditions as well as following transient and accident conditions. Despite the large sub-criticality margin (see Table 2), the radial and axial power profiles have a moderate peaking factor, mostly as a result of the diffusivity of lead-bismuth eutectic coolant.
The power distribution in a sub-critical system is sensitive to the core intrinsic multiplication factor. As the latter increases towards unity (criticality conditions), the neutron flux distribution flattens on the core fundamental harmonic. Figure 20 shows the axial flux distribution averaged over the fuel elements of a given hexagonal round, thus making apparent the almost axially symmetric nature of the power distribution.

Y. Kadi and F. Carminati
166
0.0
0.2
0.4
0.6
0.8
1.0
1.2
1.4
1.6
1.8
2.0
-80 -60 -40 -20 0 20 40 60 80
Neu
tron
Flu
x (n
orm
aliz
ed)
Height (cm)
FUEL REGION
Figure 20: Axial distribution of the neutron flux in the core of the EADF.
5.3 Analysis of the high-energy beam – target interactions The heat deposition of the proton beam in the lead-bismuth eutectic target of the EADF, has been accurately calculated using FLUKA. The beam profile was considered as gaussian with a FWHM in both the x- and y- direction of ~ 7.615 cm. A contour map of the power deposited in the spallation target unit and the surrounding core structures is given in Figure 21. To give an idea about the cooling capabilities required for such a target, we plot the power deposited by the 600 MeV, 3.2 mA proton beam in W/cm3.
0.1
0.1
0.1
0.1
0.1
1
1
10
100
0.1
0.10.1
0.10.1
0.1 0.1
0.1
0.1 0.1
0.10.1 0.1
0.1
0.1
0.10.1
0.1
0
5
10
15
20
25
30
35
40
45
50
-50 -40 -30 -20 -10 0 10 20 30 40 50
Dis
tanc
e fr
om th
e be
am a
xis
(cm
)
Distance along the beam axis (cm)
protons
Figure 21: Power deposited (W/cm3) by the 600 MeV, 3.2 mA proton beam impinging on the lead-bismuth eutectic spallation target.
ADS Simulation
167
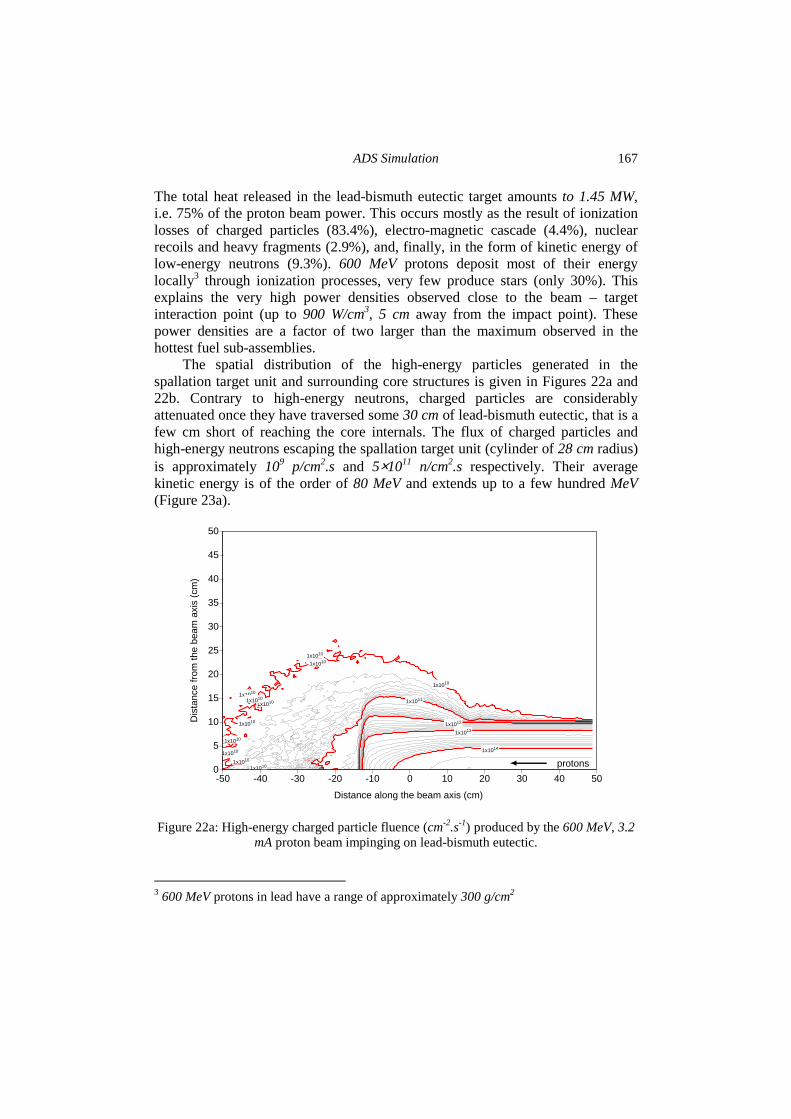
The total heat released in the lead-bismuth eutectic target amounts to 1.45 MW, i.e. 75% of the proton beam power. This occurs mostly as the result of ionization losses of charged particles (83.4%), electro-magnetic cascade (4.4%), nuclear recoils and heavy fragments (2.9%), and, finally, in the form of kinetic energy of low-energy neutrons (9.3%). 600 MeV protons deposit most of their energy locally3 through ionization processes, very few produce stars (only 30%). This explains the very high power densities observed close to the beam – target interaction point (up to 900 W/cm3, 5 cm away from the impact point). These power densities are a factor of two larger than the maximum observed in the hottest fuel sub-assemblies.
The spatial distribution of the high-energy particles generated in the spallation target unit and surrounding core structures is given in Figures 22a and 22b. Contrary to high-energy neutrons, charged particles are considerably attenuated once they have traversed some 30 cm of lead-bismuth eutectic, that is a few cm short of reaching the core internals. The flux of charged particles and high-energy neutrons escaping the spallation target unit (cylinder of 28 cm radius) is approximately 109 p/cm2.s and 5×10¹¹ n/cm2.s respectively. Their average kinetic energy is of the order of 80 MeV and extends up to a few hundred MeV (Figure 23a).
1x10¹⁰
1x10¹⁰
1x10¹⁰
1x10101x1010
1x10¹⁰
1x10¹¹
1x10¹²
1x10¹³
1x10¹⁴
1x10¹⁰
1x10¹⁰
1x10¹⁰
1x10¹⁰
1x10¹⁰
0
5
10
15
20
25
30
35
40
45
50
-50 -40 -30 -20 -10 0 10 20 30 40 50
Dis
tanc
e fr
om th
e be
am a
xis
(cm
)
Distance along the beam axis (cm)
protons
Figure 22a: High-energy charged particle fluence (cm-2.s-1) produced by the 600 MeV, 3.2 mA proton beam impinging on lead-bismuth eutectic.
3 600 MeV protons in lead have a range of approximately 300 g/cm2
Y. Kadi and F. Carminati
168
1x10¹¹
1x10¹¹
1x10121x1012
1x10¹³
1x10140
5
10
15
20
25
30
35
40
45
50
-50 -40 -30 -20 -10 0 10 20 30 40 50
Dis
tanc
e fr
om th
e be
am a
xis
(cm
)
Distance along the beam axis (cm)
protons
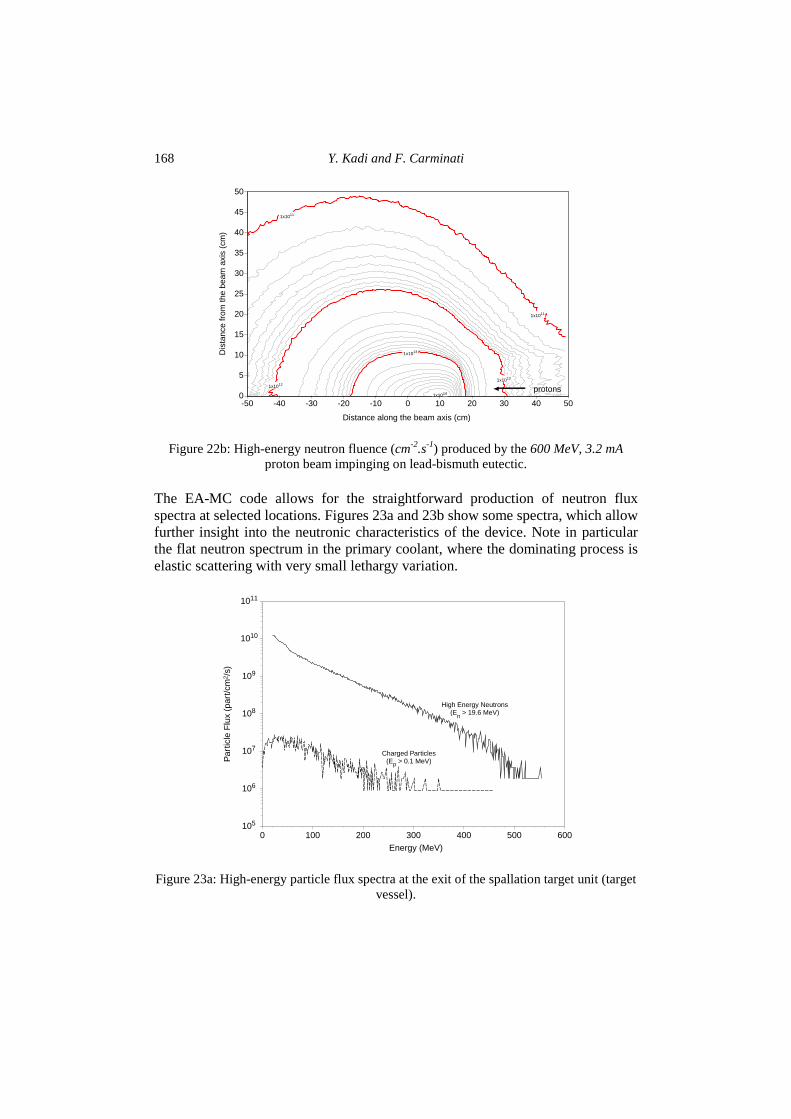
Figure 22b: High-energy neutron fluence (cm-2.s-1) produced by the 600 MeV, 3.2 mA proton beam impinging on lead-bismuth eutectic.
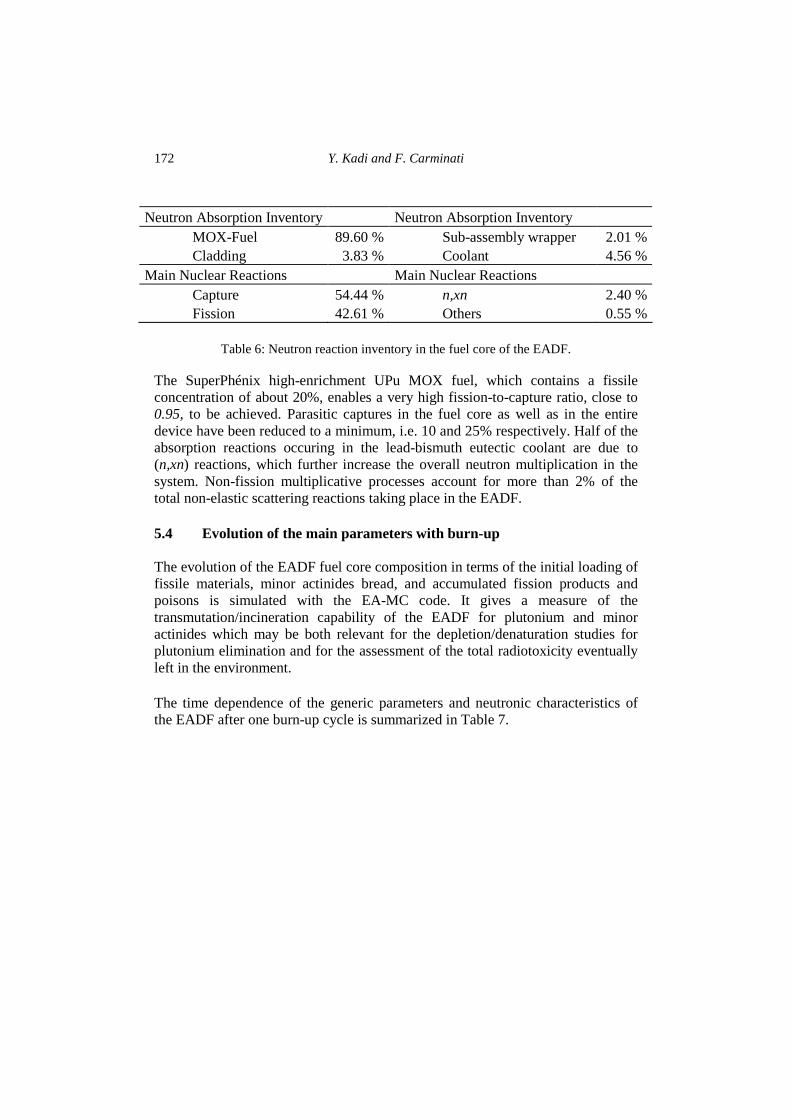
The EA-MC code allows for the straightforward production of neutron flux spectra at selected locations. Figures 23a and 23b show some spectra, which allow further insight into the neutronic characteristics of the device. Note in particular the flat neutron spectrum in the primary coolant, where the dominating process is elastic scattering with very small lethargy variation.
105
106
107
108
109
1010
1011
0 100 200 300 400 500 600
Par
ticle
Flu
x (p
art/c
m2 /
s)
Energy (MeV)
High Energy Neutrons(E
n > 19.6 MeV)
Charged Particles(Ep > 0.1 MeV)
Figure 23a: High-energy particle flux spectra at the exit of the spallation target unit (target vessel).

ADS Simulation
169
105
106
107
108
109
1010
1011
1012
1013
1014
10-3 10-2 10-1 100 101 102 103 104 105 106 107 108
Ne
utr
on
Flu
x (
n/c
m2/s
)
Neutron Energy (eV)
Fuel
Spallation Target
Primary Coolant
Target Vessel
Secondary Coolant
Reactor Vessel
Reactor Roof
Figure 23b: Neutron flux spectra at selected locations of the EADF. The neutron flux spectra generated by the EA-MC code can be used to estimate the heating and damage to structural materials by neutrons with energy above and below 20 MeV. Indeed, in the EADF one can consider separately the high energy portion of the spectrum, due to the primary proton shower, with its intensity proportional to the beam current, and a lower energy region associated with the fission multiplying medium, proportional to the reactor power.
Tables 3 and 4 report results of damage and heating calculations concerning both effects. An accurate calculation is made by using the detailed geometric model of the device and by computing the neutron induced damage self-consistently in each geometric element (made by a given material) for each interacting nuclide [30]. The heating and damage-energy cross sections are extracted from the latest nuclear data libraries [6]. In practice, we have evaluated:
δ(dpa)
δt=�σEa �
2Ed
η
⋅φ ⋅10−21 [dpa/s]

Y. Kadi and F. Carminati
170
where �σEa � is the damage energy production cross section (barn-keV), Ed is the energy required to displace an atom from its lattice position, η = 0.8 is the collision efficiency factor and φ the particle flux (cm-2.s-1).
Region Flux (part/cm2.s) Heat (W/cm3) DPA/year
HE LE HE LE HE4 LE
Proton beam tube (HT-9 Steel) 2.0x10¹³ 2.2x10¹³ 2.7x10⁻¹ 9.4x10⁻² 9.5x10⁻¹ 5.5x10⁻² Spallation target (LBE) 1.7x10¹⁴ 5.9x10¹⁴ 26 5.2x10⁻¹ 8.0 1.6 Spallation target vessel (HT-9) 4.1x10¹² 1.3x10¹⁴ 2.1 4.9x10⁻¹ 1.9x10⁻¹ 4.3x10⁻¹ Target unit containment vessel (HT-9)
4.8x10¹¹ 8.2x10¹³ 1.6x10⁻² 2.6x10⁻¹ 2.3x10⁻² 2.3x10⁻¹
Table 3: Integrated flux, heating and damage of the spallation target unit internal structures, due to low-energy neutrons (LE) and high-energy particles (HE) as computed by EA-MC and FLUKA.
Note that the high-energy induced damage will increase by a factor of two during the fuel cycle (which lasts 2.5 years), since as a result of the burn-up reactivity swing, the beam current increases to 6 mA in order to maintain a constant thermal power output of 80 MW.
Region Flux (n/cm2.s) Heat (W/cm3) DPA/yr
Reactor roof 7.0x10⁸ 3.7x10⁻⁶ 6.7x10⁻⁷ Reactor vessel 1.2x10¹¹ 2.9x10⁻³ 8.3x10⁻⁶ Safety vessel 3.6x10¹⁰ 7.7x10⁻⁴ 2.5x10⁻⁶ Spallation target 5.9x10¹⁴ 0.515 1.566 Target vessel 8.2x10¹³ 0.263 0.230 Heat exchangers 5.8x10¹¹ 1.6x10⁻² 1.5x10⁻⁴ HX secondary coolant 7.2x10¹¹ 2.3x10⁻⁴ 1.1x10⁻⁴ Core neutronic protection 1.5x10¹³ 0.184 5.7x10⁻³ Av. fuel 1.2x10¹⁴ 260 0.772 Av. fuel cladding 3.2x10¹³ 0.098 0.141 Core radial reflector 7.1x10¹³ 0.327 0.146
Table 4: Integrated flux, heating and damage in the reactor internal structures due to
neutrons with energy below 20 MeV as computed by EA-MC.
4 where �σEa � ~ 150 barn-keV for 100 MeV particles impinging on HT-9 steel, and Ed
= 40 eV for HT-9 steel

ADS Simulation
171
The lead-bismuth eutectic pool, in spite of the low absorbing characteristics of the eutectic, allows an important attenuation of the neutron flux and energy, so that the reactor fixed internal structures can be located at a distance of about one meter from the active region of the core, with acceptable dose damage of a few dpa's over the reactor lifetime.
In the EADF heat exchangers, the secondary coolant is a synthetic diathermic oil (with composition close to CH). Neutrons damage the oil by breaking molecular bonds, in an amount roughly proportional to the energy deposited by the neutrons in the oil itself. In order to evaluate such an effect, the energy delivered by the neutrons to the oil has been calculated self-consistently by the EA-MC code. Of course, most of this energy is delivered to elastically scattered hydrogen nuclei: the modification of the neutron spectrum is apparent from Figure 23b, where the spectrum in the secondary coolant is plotted.
A detailed inventory of the neutron induced reactions taking place in several locations of the device is given in Tables 5 and 6.
Neutron Absorption Inventory Neutron Absorption Inventory Reactor vessel 0.33 % Core upper reflector 5.49 % Spallation target 1.96 % Core radial reflector 2.04 % Flow guides 0.14 % Core lower reflector 6.91 % Heat exchangers 0.80 % Fuel core 72.63 % Purification units 0.03 % Primary coolant 6.83 % Gas injection units 0.16 % Escapes 0.16 % Neutron shield 2.52 % Total 100 % Main Nuclear Reactions Main Nuclear Reactions Capture 66.28 % Others 0.43 % Fission 30.95 % Escapes 0.16 % n,xn 2.18 % Total 100 %
Table 5: Neutron reaction inventory at several locations of the EADF.
Y. Kadi and F. Carminati
172
Neutron Absorption Inventory Neutron Absorption Inventory MOX-Fuel 89.60 % Sub-assembly wrapper 2.01 % Cladding 3.83 % Coolant 4.56 % Main Nuclear Reactions Main Nuclear Reactions Capture 54.44 % n,xn 2.40 % Fission 42.61 % Others 0.55 %
Table 6: Neutron reaction inventory in the fuel core of the EADF.
The SuperPhénix high-enrichment UPu MOX fuel, which contains a fissile concentration of about 20%, enables a very high fission-to-capture ratio, close to 0.95, to be achieved. Parasitic captures in the fuel core as well as in the entire device have been reduced to a minimum, i.e. 10 and 25% respectively. Half of the absorption reactions occuring in the lead-bismuth eutectic coolant are due to (n,xn) reactions, which further increase the overall neutron multiplication in the system. Non-fission multiplicative processes account for more than 2% of the total non-elastic scattering reactions taking place in the EADF. 5.4 Evolution of the main parameters with burn-up The evolution of the EADF fuel core composition in terms of the initial loading of fissile materials, minor actinides bread, and accumulated fission products and poisons is simulated with the EA-MC code. It gives a measure of the transmutation/incineration capability of the EADF for plutonium and minor actinides which may be both relevant for the depletion/denaturation studies for plutonium elimination and for the assessment of the total radiotoxicity eventually left in the environment. The time dependence of the generic parameters and neutronic characteristics of the EADF after one burn-up cycle is summarized in Table 7.

ADS Simulation
173
Global Parameters BOC EOC Units Fuel mixture (U-Pu)O2 (U-Pu)O2 Fuel mass 3.793 3.723 ton Pu concentration 18.1 16.7 wt.% Fissile enrichment 18.6 18.1 wt.% Fuel burn-up - 20 GWd/t Cycle length - 900 EFPD Thermal Power Output 80 80 MWatt Proton Beam Energy 600 600 MeV Spallation Neutron Yield 14.51 ± 0.10 14.51 ± 0.10 n/p Net neutron multiplication 27.80 ± 0.56 15.29 ± 0.65 Multiplication Coefficient 0.9640 ± 0.0007 0.9346 ± 0.0009 Energetic Gain 42.73 ± 0.88 23.55 ± 1.00 Gain coefficient 1.54 1.54 Accelerator Current 3.20 ± 0.07 6.00 ± 0.09 mA
Table 7: Main parameters of the EADF reference configuration after one burn-up cycle.
Table 7 reports the variation in the neutron multiplication coefficient after a fuel burn-up of 20 GWd/t, that is 900 days of operation at 80 MWth. During this period of operation the reactivity of the EADF drops by 2.94% in ∆k, which is compensated by a factor two increase in the accelerator current to 6.0 mA in order to maintain a constant power output . In Figure 24, the variation of the UPu MOX fuel composition is plotted as a function of time.

Y. Kadi and F. Carminati
174
10-3
10-2
10-1
100
101
102
103
104
0 200 400 600 800 1000 1200
Rad
io-n
uclid
e st
ockp
ile, (
kg)
Time elapsed, (days)
U-238
Pu-239
Pu-240
Pu-241
U-235
U-236
U-234
Cm-244
Np-237
Pu-242
Am-241
Pu-238
Am-243
Cm-242
Figure 24: Evolution of the actinide concentrations as a function of time for the UPu MOX fuel in the EADF reference configuration.
The rate of plutonium incineration rapidly settles to approximately 7 kg/TWh, at the expense of long-lived minor actinides, namely 237Np, 241,243Am and 244Cm, which are produced at a constant rate of 0.23, 0.17 and 0.01 kg/TWh respectively. This is compared with the production rates of 11 kg/TWh for plutonium, 0.6 kg/TWh for 237Np and 241,243Am, and 0.05 kg/TWh for 244Cm, in a standard PWR. 6 Conclusions
By means of 3-D Monte Carlo simulations we have analyzed a number of neutronic features of the proposed Energy Amplifier Demonstration Facility reference configuration. Realistic models of some in-vessel structures which may affect the overall neutronics have been included in the simulations. The results show that the desired sub-criticality level and power distributions can be achieved, and that neutron-induced damage of the structures can be kept at
ADS Simulation
175
tolerable values. Detailed information on power distribution, neutron spectra and material damage has been generated, which may be useful for the thermal-hydraulic and mechanical designs of the device. Acknowledgements
This work is part of the activity on the Energy Amplifier, promoted by Prof. Carlo Rubbia. We also thank L. Cinotti, who is coordinating the engineering design of the prototype at Ansaldo Nucleare (Genova, Italy), for many discussions on the subject.

Y. Kadi and F. Carminati
176
References
[1] “Energy Amplifier Demonstration Facility Reference Configuration: Summary Report” , ANSALDO Nucleare, EA-B0.00-1-200 – Rev. 0, January, 1999.
[2] C. Rubbia et al., “Conceptual Design of a Fast Neutron Operated High Power Energy Amplifier” , CERN/AT/95-44 (ET), Sept. 29, 1995; see also C. Rubbia, “A High Gain Energy Amplifier Operated with fast Neutrons” , AIP Conference Proc. 346, Int. Conf. on ADT Technologies and Applications, Las Vegas, 1994.
For more details on the TRU’s incineration see also C. Rubbia et al., “Fast Neutron Incineration in the Energy Amplifier as Alternative to Geologic Storage: the case of Spain” , CERN report CERN/LHC/97-01 (EET), Geneva, 17th February 1997 and C. Rubbia et al, “A realistic Plutonium elimination scheme with Energy Amplifiers and Thorium-Plutonium Fuel” CERN report CERN/AT/95-53 (ET), Geneva, 12th December, 1995.
[3] S. Atzeni, Y. Kadi and C. Rubbia, “Statistical Fluctuations in Monte Carlo Simulations of the Energy Amplifier” , CERN report CERN/LHC/97-12 (EET), Geneva, December 7, 1997.
C. Rubbia, “An Analytic Approach to the Energy Amplifier” , CERN internal report, CERN/AT/EET 94-036, Geneva, 1994. see also C. Rubbia, “Why So Many Exponentials ?” , CERN internal report, CERN/AT/EET 94-032, Geneva, 1994. see also S. Atzeni and C. Rubbia, “Source Neutron Amplification and Criticality Safety Margin of an Energy Amplifier” , paper in preparation
[4] S. Andriamonje et al., Phys. Lett. B348 (1995) 697-709; J. Calero et al. Nuclear Instruments and Methods in Physics Research A
376 (1996) 89-103.
[5] H. Arnould et al., Phys. Lett. B458 (1999) 167-180; H. Arnould et al., “Neutron-Driven Nuclear Transmutation by Adiabatic
Resonance Crossing” , CERN-SL-99-036 EET, July 26, 1999 and Report to the European Union, DGXII, EUR 19117 EN;
A. Abánades et al. Nuclear Instruments and Methods in Physics Research A 478 (2002) 577-730.
[6] OECD/NEA Data Bank, Issy-Les-Moulineaux, Paris, France, 1994.
[7] A. Fassó et al., in “ Intermediate Energy Nuclear Data: Models and Codes” , Proceedings of a Specialists' Meeting, Issy les Moulineaux

ADS Simulation
177
(France) May 30 - June 1, 1994, p. 271, published by OECD, 1994, and references therein.
A. Fassó, A. Ferrari, J. Ranft, P.R. Sala, G.R. Stevenson and J.M. Zazula, Nuclear Instruments and Methods A, 332, 459 (1993), also, CERN report CERN/TIS-RP/93-2/PP (1993).
See also A. Ferrari et al., “FLUKA-99 Manual” , INFN, Milan, 1999.
[8] R.E. MacFarlane, D.W. Muir and R.M. Boicourt, “The NJOY Nuclear Data Processing System : User's Manual” , Los Alamos National Laboratory report LA-9303-M, vol. I to IV, May 1982.
[9] D.E. Cullen, “The 1994 ENDF Pre-processing Codes (PRE-PRO 94)” IAEA Nuclear Data Section, Vienna, IAEA-NDS-39 Rev. 8, January 1994.
[10] R.E. Alcouffe et al., “User's Guide for TWODANT: A Code Package for Two-Dimensional Diffusion-Accelerated, Neutral-Particle Transport” , Los Alamos National Laboratory report LA-10049-M, Revision 1, 1984.
[11] R.E. MacFarlane, “TRANSX 2: A Code for Interfacing MATXS Cross-Section Libraries to Nuclear Transport Codes” , Los Alamos National Laboratory report LA-12312-MS, May 1992.
[12] J.F. Breismeister, “MCNPTM - A general Monte Carlo N-particle Transport Code” , Los Alamos National Laboratory report, LA-12625-M, November 1993.
[13] S. Pelloni, Y. Kadi and H.U. Wenger, “Present Methods for Physics Calculations of Hybrid Systems at PSI” , NSC Specialist Meeting on Intermediate Energy Nuclear Data, Nuclear Energy Agency, Paris, May 30 - June 1, 1994.
[14] M.J.Bell, “ORIGEN2: The Oak Ridge Isotope Generation and Depletion Code” . Oak Ridge National Laboratory report ORNL-4628, May 1973.
[15] K. Furuta, Y. Oka and S. Kondo, “SUSD: A Computer Code for Cross-Section Sensitivity and Uncertainty Analysis Including Secondary Neutron Energy and Angular Distributions”, Oak Ridge National Laboratory report ORNL/TR-88/18, November 1988.
[16] F. Carminati and Y. Kadi, “ADS - Neutronic Benchmark (stage 1): A New Approach to the Design of Accelerator Driven Systems” , Proc. of the IAEA Technical Committee Meeting on the Feasibility and Motivation for Hybrid Concepts for Nuclear Energy Generation and Transmutation, IAEA-TC-903.3, Madrid, Spain, 17 - 19 September, 1997.
Y. Kadi and F. Carminati
178
[17] M. Cobo et al., “Notes on the Study of the Most Reliable Neutron Cross Section Data” , CERN internal report, CERN/AT/ET 95-035, Geneva, August 15, 1995.
[18] F. Carminati, “Conversion of EAF 4.2 File for use by EET group” , CERN internal report, CERN/LHC/EET 96-022, Geneva, October 14, 1996.
[19] F. Carminati, “PROCESS : A Cross Section Processing Utility” , CERN internal report, CERN/LHC/EET 96-005, Geneva, January 16, 1996.
[20] F. Carminati, “EET Code Collection User's Guide” , February 26, 1996.
[21] F. Carminati, I. Goulas and J.P. Revol, “A Nuclear Data Base for the EA Monte Carlo” , CERN internal report, CERN/AT/EET 95-008, Geneva, February 14, 1995.
[22] J.K. Tuli, National Nuclear Data Center, Brookhaven National Laboratory, Upton, New York 11973, USA, July 1995.
[23] G. Audi and A.H. Wapstra, “The 1995 Update to the Atomic Mass Evaluation” , Nuclear Physics A595 (1995) 409-480, December 25, 1995.
[24] Final tables of dose coefficients as sent to IAEA for inclusion in the BRSS. National Radiological Protection Board, Chilton Didcot, Oxon OX11 0RQ, U.K., March 9, 1995.
[25] International Commission on Radiological Protection, ICRP, S-171 16 Stockholm, Sweden, Edition 91, 1995.
[26] F. Carminati, I. Goulas and J.P. Revol, “Data for the Simulation of Heat Deposition from Nuclear Decays and Update of the Toxicity Values”, CERN internal report, CERN/AT/EET 95-009, Geneva, March 13, 1995.
[27] M. Dahlfors and Y. Kadi, “Sensitivity Analysis of Neutron Cross Sections Relevant for Accelerator Driven Systems” , in Proc. of the Int. Conf. on Nuclear Data for Science and Technology, Tsukuba, Japan, October 7-12, 2001.
[28] A. Ferrari and P.R. Sala, “The Physics of High Energy Reactions” , INFN, Milan, lecture given at the Workshop on Nuclear Reaction Data and Nuclear Reactors Physics, Design and Safety, International Centre for Theoretical Physics, Trieste, Italy, 15th April - 17th May, 1996.
[29] S. Atzeni, “Preliminary neutronics analysis of the Energy Amplifier prototype” , ENEA internal report, EA D2.02 4 407, Frascati, July 16, 1998.

ADS Simulation
179
[30] F. Carminati and Y. Kadi, “ Implementation of a new Routine for Damage Calculations for the EA Monte Carlo” , CERN internal report, CERN/LHC/EET 98-004, Geneva, April 20, 1998.
Filename: ADS Simulation Directory: H:\smr1325 Template: C:\Documents and Settings\Administrator\Application
Data\Microsoft\Templates\Normal.dot Title: ADS Design Subject: Author: Yacine Kadi Keywords: Comments: Creation Date: 7/10/2002 11:30 AM Change Number: 222 Last Saved On: 5/26/2003 11:58 AM Last Saved By: pc-grilli Total Editing Time: 2,435 Minutes Last Printed On: 5/26/2003 11:59 AM As of Last Complete Printing Number of Pages: 47 Number of Words: 8,921 (approx.) Number of Characters: 50,855 (approx.)