simulation of large tank loading using a...
TRANSCRIPT

SIMULATION OF LARGE TANK LOADING USING A TEST FILL Trempess Moore*, John Sobkowicz*, and Chris Workman*, Thurber Engineering Ltd. Richard Sisson*, Canadian Natural Resources Ltd. * Calgary, Alberta, Canada
ABSTRACT CNRL’s new Oil Sands Plant is under construction near Fort McMurray, Alberta. It includes two main tank farms, the East Tank Farm (ETF) and the West Tank Farm (WTF), with storage tanks up to 60 m in diameter and 20 m high. The tanks are situated over weak foundation soils, namely the Cretaceous Clearwater Formation (a very stiff to hard clay, locally referred to as a “clay shale”), which can be pre-sheared and may exhibit a strain weakening behaviour and unfavourable pore pressure response to loading. Because of the uncertainty associated with the behaviour of the Clearwater clay shale, the expense of mitigation options, and the risk to tank performance, a full-scale field test was conducted to assess the foundation performance under anticipated tank loading. A square test fill, 40 m on a side with two near-vertical faces, was constructed using local sand. Foundation performance was monitored using 8 slope inclinometers installed at various offsets from the fill face, 18 vibrating wire piezometers installed inside and outside of the fill footprint, and 21 survey monitoring points. The fill was raised so that the pressure on the foundation was increased at a rate of about 15 kPa per day. Significant horizontal displacements were detected at a vertical pressure of 50 kPa, and failure of the foundation occurred at a load of 150 kPa. Bringing the test fill foundation to failure in an area of shallow Clearwater provided valuable information which allowed an efficient and safe design of the storage tanks and determined the required cover over the Clearwater for various design loads, to achieve acceptable factors of safety against tank foundation failure. RÉSUMÉ La nouvelle usine d’exploitation des sables bitumineux du CNRL est en construction près de Fort McMurray en Alberta. L’établissement comprend deux regroupements de réservoirs, soit le regroupement est (ETF) et le regroupement ouest (WTF). Ces réservoirs, dont les dimensions peuvent atteindre 60 m de diamètre et 20 m de hauteur, reposent sur un sol à faible capacité portante. En effet, la formation crétacée de Clearwater (une argile raide communément appelé ‘schiste argileux’) préalablement cisaillé peut avoir une résistance décroissante aux contraintes et une réponse de pression interstitielle désavantageuse suite à des chargements. Les incertitudes provenant du comportement du schiste argileux de Clearwater, les coûts des mesures correctives et les risques posées à l’efficacité des réservoirs ont justifié la mise en place d’une série de tests pour évaluer la capacité de la fondation à résister aux contraintes appliquées. Un remblai carré ayant 40 m de largeur et deux faces presque verticales a été construit avec du sable prélevé sur le terrain. Le comportement de la fondation a été étudié à l’aide de 8 indicateurs de pentes, 18 piézomètres à corde vibrantes et 21 points de surveillance géotechnique. Le remblai a été élevé progressivement pour que l’augmentation de la contrainte appliquée sur la fondation soit de 15 kPa par jour. Des déplacements horizontaux considérables ont été observés à des contraintes verticales de 50 kPa et la rupture a eu lieu à une contrainte de 150 kPa. Les informations déduites incluant l’épaisseur minimale de sol requise au dessus de la couche de Clearwater ont permis une conception efficace et l’atteinte des facteurs de sécurité satisfaisants contre la rupture de la fondation. 1. INTRODUCTION Canadian Natural Resources Ltd. (CNRL) is constructing a plant for the extraction and upgrading of bitumen from oil sands. The project/mine is on CNRL Oil Sand Leases 10, 18 and 25, located 70 km north of Fort McMurray, Alberta (Canada). The extraction and upgrading plant is in the southeast quadrant of the project area, within Sections 16 to 21, TWP 96, RGE 11, W4M. The main components of the project are an open pit mine, an extraction plant, an upgrader, and a tailings pond. The plant is to produce 232 million barrels/day (mbbl/d) of synthetic light crude oil by 2012. Phase 1 of the project is scheduled to be complete in the first half of 2008 and will
have a production rate of 110 mbbl/d. Associated facili-ties include an access road, a water intake structure (on the Athabasca River), a cogeneration plant, an airstrip, and facilities for storing coke and sulphur. Temporary storage is required for bitumen and related materials from the extraction plant, prior to upgrading. This is provided in three large (60 m diameter by 20 m high) tanks located in the West Tank Farm (WTF). Stor-age is also required for synthetic crude oil and other products related to the upgrading plant. This is provided in a number of tanks of varying size (up to 60 m diameter) in the East Tank Farm (ETF). Several other large tanks are also proposed at specific locations in the plant site.
977
Sea to Sky Geotechnique 2006

2. SURFICIAL GEOLOGY The surficial geology in the plant site consists of Holo-cene and Pleistocene deposits overlying Cretaceous age Clearwater and McMurray Formation “bedrock”. The near surface soils vary laterally and with depth, but can be described in four main categories:
• Peat (Ho – Facies 898) • Fluvial Sand (Hf – Facies 896 and Pfs – Facies 860) • Glacio-lacustrine Clay (Pl – Facies 880) • Clay Till (Pgtc – Facies 830)
These are listed in descending order, but particular facies may or may not be present at any given location. The “deeper” soils at the site consist of the Clearwater clay shale and the McMurray Formation oil sand. Both of these are Cretaceous deposits and could geologically be defined as bedrock, based on their age. However, they have strength and deformation characteristics similar to a hard to very hard and/or very dense soil. In the area of the plant site, the Clearwater and McMurray Formations total about 100 m in thickness, and are underlain by Devonian Limestone. More detailed information on these two Cretaceous formations is given in the following sub-sections, as they are the main culprits governing the design of the ETF and WTF tanks. 2.1 Clearwater Formation (Clay Shale) The Clearwater Formation (Kc) is a marine clay shale of Cretaceous age. The majority of the formation consists of a hard to very hard, over-consolidated clay, but it also contains some discontinuous layers of indurated siltstone or sandstone that are typically less than 0.5 m thick. There is a significant variability in the nature and beha-viour of the various facies within the Clearwater unit. Some facies, (namely the Kcc-710, the Kcb-700, and the lower part of the Kca-625) are of high plasticity, and are known on occasion to be pre-sheared and slickensided, to have low field and residual strengths, and to have an unfavourable pore pressure response when loaded. Historically these materials have performed poorly under structures in other oil sands operations. The following clay shale facies are present in the WTF: Kcc-710, Kcb-700, Kcb-650, Kca-625, and Kcw-600. Typical soil parameters are given in Table 1. The clay shale is relatively shallow, between 3.8 m and 10 m below natural ground surface, although in one localized area rafted Clearwater material was encountered in the over-lying clay till at a depth as shallow as 1.7 m. The intact Kc material has a thickness of about 5 m in the eastern portion of the WTF and increases to about 16 m on the west side.
Table 1 – Kc Facies – Material Properties
Atterberg Limits (%) Frictional Strength (°)
Kc Facies
Plastic Liquid P.I. Peak Res. Kcc-710 21-34 58-202 36-170 25-30 6-8 Kcb-700 24-42 94-225 67-193 25-35 6-8 Kcb-650 15-19 53-109 34-92 - - Kca-625 16-43 45-160 29-129 21-28 7-14 Kcw-600 13-20 28-70 14-55 35-45 22-28
Only the two lowest facies, the Kca-625 and the Kcw-600, were encountered in the ETF. The top of the Kca-625 is between 2.7 m and 6.3 m below natural ground surface. The unit ranges in thickness from zero in the southwest of the ETF to 8 m in the northeast of the ETF. 2.2 McMurray Formation (Oil Sand) The McMurray Formation oil sand (Km) is located below the Clearwater Formation, and is a very dense oil-bearing sand with occasional layers of clay shale and siltstone, (particularly in the upper portion, where deposition was transgressing to a marine environment). The oil sand is a very strong material with a low compressibility in its undis-turbed state. However, due to the presence of dissolved gas in the pore fluid (water and oil), it can loosen and become weak if it is stress relieved or otherwise disturbed. The McMurray Formation was encountered at a depth of 14 m to 20 m in the WTF and 4 m to 10 m in the ETF. In the WTF, it is highest in the southeast corner, and dips towards the northwest. In the ETF, it is highest in the southwest corner and dips to the northeast. 3. TEST FILL 3.1 Introduction The proposed storage tanks will induce large shear stresses in the foundation soils. Where the Clearwater is shallow, these stresses could result in high lateral defor-mations and tank failure. 3D limit equilibrium analyses indicated that 8 m of a more competent material (combin-ation of overburden and engineered fill) were required to provide a Factor of Safety of 1.5 for global stability. Of the two tank farms, the primary concern was with the WTF, where the Clearwater was encountered as shallow as 3.8 m deep (or in the case of rafted Kc, as shallow as 1.7 m), and where relatively little fill was proposed. The ETF was less of a concern because:
• Up to 6 m of fill was scheduled for site grading, bringing the minimum cover of material over the Clearwater to 8 m.
• Weaker / pre-sheared Clearwater facies were not thought to be present.
It was recognized that additional fill would be required in the WTF to provide an adequate factor of safety against foundation failure. However, to optimize the design of the tanks, it was important to properly understand the
978
Sea to Sky Geotechnique 2006

behaviour of the Clearwater clay shale. It was therefore decided to construct a test fill to simulate actual tank loading. The fill was to apply the same load to the foundation as the tanks would when they were hydro-tested. A slightly smaller footprint was selected than the maximum tank size (40 m square compared to a circular tank of 60 m diameter), based on limit equilibrium analyses that indicated little difference in stability between the two sizes. The following sections provide details of the test fill: its configuration, how it was constructed, instrumentation of the foundation to monitor horizontal and vertical deformation as well as pore pressure response, and foundation performance. 3.2 Configuration Figure 1 shows the general configuration of the test fill. The test fill location was selected in an area of shallow Clearwater to allow for the highest possible stresses applied to this layer, but to avoid an area of muskeg to the southwest, which had poor surface access.
Figure 1 – Location of test fill relative to tanks in the West Tank Farm
The final design consisted of a fill with two near-vertical, reinforced faces, each 40 m long. These were aligned north-south and east-west, to be perpendicular to a) the anticipated overall dip of the Clearwater Formation, and b) possible micro-scale dip as indicated by nearby dip-meter logs, respectively. Straight walls were used to simplify construction and reduce cost. The fill was constructed using locally available sand. Standard proctor testing indicated a total unit weight for the sand of 18.9 kN/m3 at 100% compaction. Based on a design load of 180 kPa, (hydro-test load; 1.3 times the
operating load), the required fill height was 9.5 m. Figure 2 shows a photo of the test fill at the end of construction.
Figure 2 - Photo of completed test fill
3.3 Instrumentation The instrumentation layout is shown on Figure 3. It con-sisted of:
• 4 sets of nested vibrating wire piezometers installed below the fill. The tips were installed in the Kca-625 facies and either the Kcb-700 or Kcc-710 facies.
• 4 single tip vibrating wire piezometers installed below the fill in various Clearwater facies.
• 6 slope inclinometers (SIs), three along each face of the fill, located 5 m from the face and terminating in the Clearwater, nominally at Elevation 279 m. One piezometer was installed in various facies with each of these SIs.
• 2 SIs, one installed 10 m from and in the middle of each fill face. These SIs were extended into the oil sand.
• One hydraulic settlement plate installed near the centre of the fill.
• Several survey pins installed in the ground adjacent to the fill and in the lowest basket on the fill face to monitor surface displacements.
All of the piezometers were installed in fully grouted holes (i.e., no sand packs were used around the tips). This was required due to the short time frame between installation and the start of fill construction, to avoid concerns with the piezometers not reaching equilibrium. Monitoring prior to fill construction indicated that these piezometers stabilized shortly after installation. The piezometers were connected to a data logger and readings were taken hourly throughout and following the fill construction.
979
Sea to Sky Geotechnique 2006
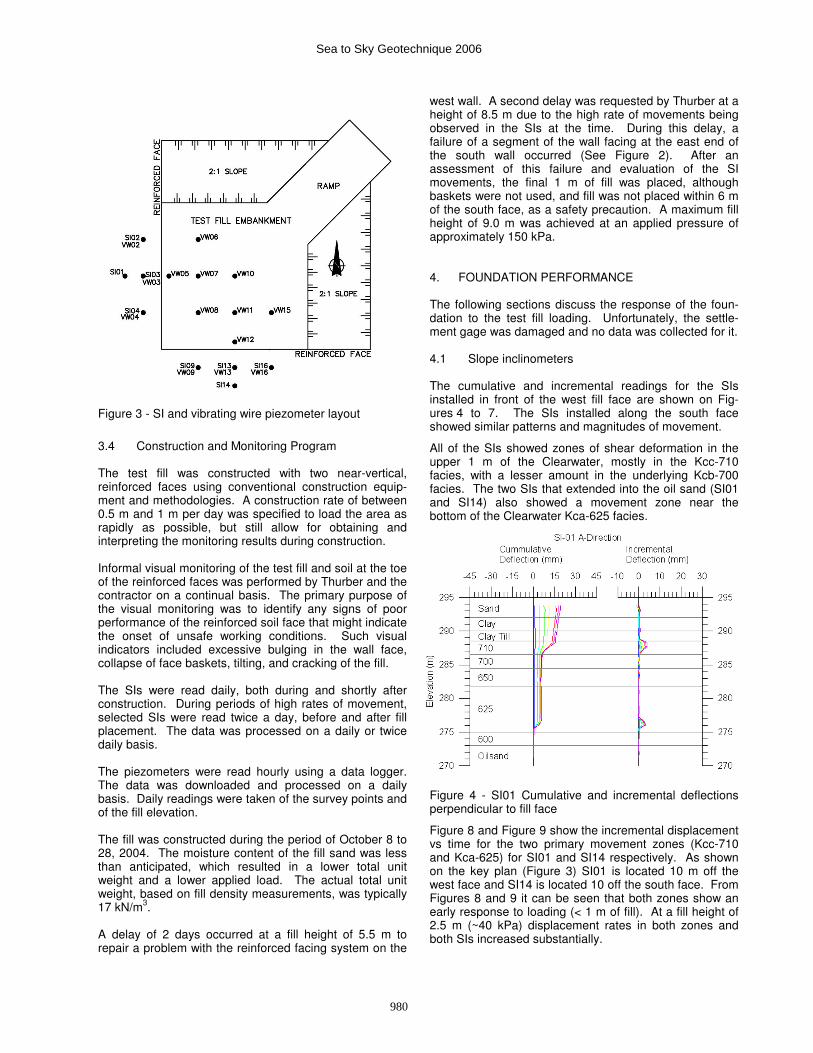
Figure 3 - SI and vibrating wire piezometer layout
3.4 Construction and Monitoring Program The test fill was constructed with two near-vertical, reinforced faces using conventional construction equip-ment and methodologies. A construction rate of between 0.5 m and 1 m per day was specified to load the area as rapidly as possible, but still allow for obtaining and interpreting the monitoring results during construction. Informal visual monitoring of the test fill and soil at the toe of the reinforced faces was performed by Thurber and the contractor on a continual basis. The primary purpose of the visual monitoring was to identify any signs of poor performance of the reinforced soil face that might indicate the onset of unsafe working conditions. Such visual indicators included excessive bulging in the wall face, collapse of face baskets, tilting, and cracking of the fill. The SIs were read daily, both during and shortly after construction. During periods of high rates of movement, selected SIs were read twice a day, before and after fill placement. The data was processed on a daily or twice daily basis. The piezometers were read hourly using a data logger. The data was downloaded and processed on a daily basis. Daily readings were taken of the survey points and of the fill elevation. The fill was constructed during the period of October 8 to 28, 2004. The moisture content of the fill sand was less than anticipated, which resulted in a lower total unit weight and a lower applied load. The actual total unit weight, based on fill density measurements, was typically 17 kN/m3. A delay of 2 days occurred at a fill height of 5.5 m to repair a problem with the reinforced facing system on the
west wall. A second delay was requested by Thurber at a height of 8.5 m due to the high rate of movements being observed in the SIs at the time. During this delay, a failure of a segment of the wall facing at the east end of the south wall occurred (See Figure 2). After an assessment of this failure and evaluation of the SI movements, the final 1 m of fill was placed, although baskets were not used, and fill was not placed within 6 m of the south face, as a safety precaution. A maximum fill height of 9.0 m was achieved at an applied pressure of approximately 150 kPa. 4. FOUNDATION PERFORMANCE The following sections discuss the response of the foun-dation to the test fill loading. Unfortunately, the settle-ment gage was damaged and no data was collected for it. 4.1 Slope inclinometers The cumulative and incremental readings for the SIs installed in front of the west fill face are shown on Fig-ures 4 to 7. The SIs installed along the south face showed similar patterns and magnitudes of movement.
All of the SIs showed zones of shear deformation in the upper 1 m of the Clearwater, mostly in the Kcc-710 facies, with a lesser amount in the underlying Kcb-700 facies. The two SIs that extended into the oil sand (SI01 and SI14) also showed a movement zone near the bottom of the Clearwater Kca-625 facies.
Figure 4 - SI01 Cumulative and incremental deflections perpendicular to fill face
Figure 8 and Figure 9 show the incremental displacement vs time for the two primary movement zones (Kcc-710 and Kca-625) for SI01 and SI14 respectively. As shown on the key plan (Figure 3) SI01 is located 10 m off the west face and SI14 is located 10 off the south face. From Figures 8 and 9 it can be seen that both zones show an early response to loading (< 1 m of fill). At a fill height of 2.5 m (~40 kPa) displacement rates in both zones and both SIs increased substantially.
980
Sea to Sky Geotechnique 2006

Figure 5 - SI02 Cumulative and incremental deflections perpendicular to fill face
Figure 6 - SI03 Cumulative and incremental deflections perpendicular to fill face
Figure 7 - SI04 Cumulative and incremental deflections perpendicular to fill face
Figure 8 – Displacement across specific facies in SI01 (10 m from middle of west face) relative to fill height.
Figure 9 – Displacement across specific facies in SI14 (10 m from middle of south face) relative to fill height.
Prior to the unplanned pause in loading at a fill height of 5.5 m (~90 kPa) displacement rates in the Kcc-710 had reached a maximum of 4 mm/month for SI01 and 30 mm/month for SI14, and in the Kca-625 had reached 13 mm/month for SI01 and 10 mm/month for SI14. During the pause in loading, movements generally decreased to less than 1 mm/month in all zones. The six SIs located 5 m off the west and south fill faces showed similar responses (Figure 10 and 11). However, once construction recommenced, displacement rates began to increase steadily. A second, planned, hiatus in loading was taken at a fill height of 8.5 m (~145 kPa) as displacement rates reached 125 to 150 mm/month in the Kcc-710 for the SIs offset 5 m from the fill and 40 mm/month for the SIs offset 10 m from the fill. During this
981
Sea to Sky Geotechnique 2006

pause in loading a tension crack began to form along the top of the south face about 1 m back from the edge. However, displacement rates in the foundation were decreasing and after some precautions, the last 0.5 m of fill was placed (applied stress = 150 kPa).
Figure 10 – Displacement across Kcb-700/710 for SIs located 5 m from the west face.
Figure 11 - Displacement across Kcb-700/710 for SIs located 5 m from the south face.
The last 0.5 m of fill caused displacement rates to accelerate, reaching a maximum of 175 mm/month in the Kcc-700/710 for the SIs offset 5 m from the fill and 75 mm/month in the Kcc-710 for the SIs offset 10 m from the fill. Displacement rates in the Kca-625, which was only monitored at 10 m from the fill, reached a maximum of 25 mm/month.
Once construction ended, the displacement rates de-creased. Ten days later, they had reached 15 mm/month in the Kcc-710 for the SIs located 5 m from the fill and
5 mm/month for the SIs located 10 m from the fill. All movement in the Kca-625 had virtually stopped. 4.2 Piezometers All of the piezometers performed well during the monitoring program and showed a pore pressure response to the test fill load. The results for selected piezometers near and under the west face are shown on Figures 12 to 17 (results for other piezometers are similar). These plots show the applied pressure of the sand fill at grade, the calculated change in stress at the tip location (using Boussinesq’s equation), the measured pore pressure, and the “incremental” Bbar value calculated for each fill lift. The “incremental” Bbar values were calculated as the change in pore pressure divided by the change in total stress at each tip location, for each increment of fill height. The term “incremental” is used, as the Bbar values do not include the results of any pore pressure dissipation between lifts. The following observations are made from the plots of pore pressure response: 1. An immediate pore pressure response to loading is
observed in all piezometers.
2. A minor amount of pore pressure dissipation is observed between loading stages (typically 12 hours, as no fill was placed overnight).
3. The Kcb-700/Kcc-710 typically exhibited incremental Bbar values between 0.6 and 1.0.
4. The Kcb-650 typically exhibited incremental Bbar
values of 0.4 or less, with the exception of VW05B.
5. After construction of the test fill, all of the tips exhibited pore pressure dissipation. For tips located under the fill the estimated time for full dissipation was 5 to 10 years.
Figure 12 - Pore pressure response for VW03
982
Sea to Sky Geotechnique 2006

Figure 13 - Pore pressure response for VW05A
Figure 14 - Pore pressure response for VW05B
Figure 15 - Pore pressure response for VW07A
Figure 16 - Pore pressure response for VW07B
Figure 17 - Pore pressure response for VW10
Figure 18 – Legend for Figures 12 to 17
4.3 Survey The lateral deflections as of October 26, 2004 from the survey monitoring are provided on Figure 19. It should be noted that some survey points were installed in the reinforcing baskets (largest arrows, with the exception of point F) and include some component of bulging. Maximum lateral displacements were measured at 30-55 mm at the basket face, between 10-30 mm at 0.5 m from the edge of the fill (65 mm was measured at point F) and 5-25 mm at 4 m from the edge of the fill. For
983
Sea to Sky Geotechnique 2006

the most part the displacement vectors coincide with the anticipated direction of ground displacement, with the exception of point F and G, which exhibited ground displacements at an angle to the face. The lateral dis-placements measured at the survey control points were of similar magnitude to the cumulative displacements observed in the SIs.
Figure 19 - Lateral displacement magnitudes measured at survey monitoring points on October 26, 2004 The survey control points were also used monitor settlement. At the basket face settlements of 45-65 mm were observed (including basket deformation). At 0.5 m from the edge of the fill, settlements of 15-20 mm were typically observed, and at 4 m away from the edge of the fill 0-10 mm of heave was observed. In the case of both the lateral displacements and settlements the maximum values were typically observed at either point C, D or E, with the values decreasing towards the north and east fill slopes, as would be expected. 4.4 Performance Summary The WTF test fill demonstrated, at full scale in the field, the likely behaviour of the ground in the WTF area in response to loading by tanks of 40 m to 60 m diameter, with a net applied pressure of up to 150 kPa. The test fill foundation soils experienced large pore pressure increases in response to loading, and towards the end of construction, high lateral movements and movement rates were observed. Bringing the test fill foundation to failure in an area of shallow Clearwater provided valuable information which allowed an efficient and safe design of the storage tanks and determined the required cover over the Clearwater for various design loads, to achieve acceptable factors of safety against failure of the CNRL storage tanks.
5. ACKNOWLEDGEMENTS The writers would like to acknowledge Todd Safruk for his time and effort in installing the instrumentation and managing the construction of the test fill. 6. REFERENCES Byrne, P.M., Cheung, H. and Yan, L. (1987) Soil para-meters for deformation analysis of sand masses, Canadian Geotechnical Journal, Vol. 24, pp 336-376.
984
Sea to Sky Geotechnique 2006