simulation result of a nuclear power plant cooling system
TRANSCRIPT
37
INCREASING EFFICIENCY OF FIXTURE PLANNING BY AUTOMATING SOME PLANNING STEPS
planning steps – they take remarkably less time.
Figure 8 Gearbox housings [11]
Table 1 The time needed for different stages of the fixture planning and design [11]
Stages of the fixture planning and design
Gearbox housings
Part A Part B Part C Part D
Regeneration of the model and feature recognition 1 min 8 s 9 s 10 s 7 s
Defining machining requirements 12 min 9 min 13 min 7 min
Finding the conceptual solution of the fixture 1 min 42 s 1 min 8 s 2 min 10 s 1 min 56 s
Fixture configuration Auxiliary setup 56 s
Main setup 32
s
Auxiliary setup 46 s
Main setup 22 s
Auxiliary setup 41 s
Main setup 28 s
Auxiliary setup 30 s
Main setup 24 s
References
[1] J. R.. Boerma, H. J. J. Kals: „FIXES, a System for
Automatic Selection of Setups and Design of Fixtures”,
Annals of CIRP Vol. 37/1, 1988. pp. 443-446.
[2] A. Joneja, T-C Chang „Setup and fixture planning in
autmated process planning systems”, IIE Transaction
31, 1999. pp. 653-665.
[3] W. Ma, J. Li and Y. Rong, „Development of Automated
Fixture Planning Systems”, Int. J. of Adv. Manuf.
Techn. 15, pp. 171-181, 1999.
[4] M. Horváth, A. Márkus, J. Váncza „Process planning
with genetic algorithms on results of knowledge-based
reasoning”, Int. J. Comp. Integ. Manuf. 9,No.2, 1996,
pp. 145-166.
[5] M. Marefat, J. Britanik „Case-based process planning
using an object-oriented model representation”, Robo.
and Comp.-Integ. Manuf. 13, No. 3, 1997. pp. 229-251..
[6] H. Paris, D. Brissaud „Process planning strategy based
on fixturing indicator evaluation”, Int. J. of Adv.
Manuf. Techn. 25, pp. 913-922, 2005.
[7] S. Bansal, S. Nagarajan, N. Venkata Reddy „An
integrated fixture planning system for minimum
tolerances”, Int. J. of Adv. Manuf. Techn. 38, pp. 501-
513, 2008.
[8] A. Rétfalvi “IGES-based CAD model postprocessing
module of a Setup and Fixture Planning System for box-
shaped parts”, IEEE 9th Symp. on Intel. Syst. and Inform.,
September 8-10, 2011, Subotica, Serbia
[9] M. Stampfer „Integrated Setup and Fixture Planning
System for Gearbox Casings”, Int. J. of Adv. Manuf.
Techn., 26, pp.310-318, 2005.
[10] M. Stampfer „Automated setup and fixture planning
system for box-shaped parts”, Int. J. of Adv. Manuf.
Techn. 45, pp. 540-552, 2009.
[11] A. Rétfalvi „Fixture Design System with Automatic
Generation and Modification of Compementary Elements
for Modular Fixtures”, Acta Polytechnica Hungarica,
vol.12, No.7, pp. 163-182, 2015
EXPRES 2017
ISBN 978-86-919769-1-0
Simulation result of a nuclear power plant cooling system using Matlab
A, SZENTE a , I. FARKAS
b, P. ODRY
c
a Paks Nuklear Power Plant, Paks, Hungary, E-mail: [email protected] b University of Dunaújváros/Computer Engineering, Dunaújváros, Hungary, E-mail: [email protected] c University of Dunaújváros/Computer Engineering, Dunaújváros, Hungary, E-mail: [email protected]
It has been shown in recent years that there is a great need for additional security measures to be taken in high security systems in
case of occurrence of unanticipated events. A Nuclear Power Plant is exactly such kind of a sophisticated system. Thou, before
we begin to work on improving the overall security of a system, we must familiarize ourselves with the type of event that causes
the issue during an unanticipated event. For this we need a well-constructed simulation. The fortification of the removal of decay
heat following the subcritical stage of a reactor shutdown forms a significant portion of the workings of a nuclear power plant.
The lack of such a measure could lead to a catastrophic meltdown (Fukushima 2011). The necessary electrical energy for this
process under normal conditions is supplied by the primary (national and home power grids) and secondary (diesel generators)
electrical supply systems. One of the key factors of the insurance of higher plant safety could be the application of a third diverse
decay heat removal ensuring system. The solutions that we came up with were based on the observations of the Paks Nuclear
Power Plant in Hungary VVER440 type reactor cores, thou it could be reflected to any similar working nuclear power plant type.
Keywords: Nuclear Power Plant, subcritical stage of a reactor, primary electrical supply systems, security,
simulation
1. The basics of nuclear power plant
cooling
Once the adequate boric concentration is reached
during shutdown the reactor needs to be cooled down,
and kept at a desirable temperature. During cooldown
on the one hand the heat stored in the structure as well
as the decay heat generated by the active zone needs to
be removed.
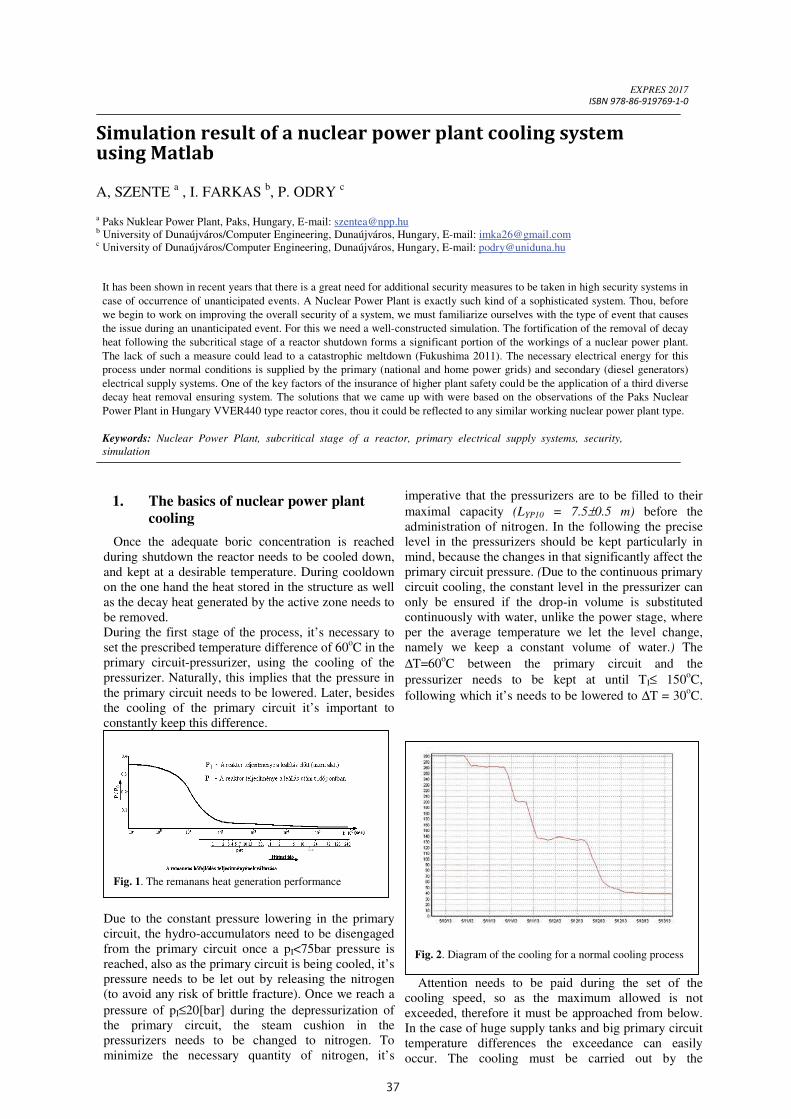
During the first stage of the process, it’s necessary to
set the prescribed temperature difference of 60oC in the
primary circuit-pressurizer, using the cooling of the
pressurizer. Naturally, this implies that the pressure in
the primary circuit needs to be lowered. Later, besides
the cooling of the primary circuit it’s important to
constantly keep this difference.
Due to the constant pressure lowering in the primary
circuit, the hydro-accumulators need to be disengaged
from the primary circuit once a pI<75bar pressure is
reached, also as the primary circuit is being cooled, it’s
pressure needs to be let out by releasing the nitrogen
(to avoid any risk of brittle fracture). Once we reach a
pressure of pI≤20[bar] during the depressurization of
the primary circuit, the steam cushion in the
pressurizers needs to be changed to nitrogen. To
minimize the necessary quantity of nitrogen, it’s
imperative that the pressurizers are to be filled to their
maximal capacity (LYP10 = 7.5±0.5 m) before the
administration of nitrogen. In the following the precise
level in the pressurizers should be kept particularly in
mind, because the changes in that significantly affect the
primary circuit pressure. (Due to the continuous primary
circuit cooling, the constant level in the pressurizer can
only be ensured if the drop-in volume is substituted
continuously with water, unlike the power stage, where
per the average temperature we let the level change,
namely we keep a constant volume of water.) The
∆T=60oC between the primary circuit and the
pressurizer needs to be kept at until TI≤ 150oC,
following which it’s needs to be lowered to ∆T = 30oC.
Attention needs to be paid during the set of the
cooling speed, so as the maximum allowed is not
exceeded, therefore it must be approached from below.
In the case of huge supply tanks and big primary circuit
temperature differences the exceedance can easily
occur. The cooling must be carried out by the
Fig. 1. The remanans heat generation performance
Fig. 2. Diagram of the cooling for a normal cooling process

38
2
subtraction of steam from the fresh steam collector
until TI = 140oC is reached. The condensate condensed
in the technology condenser is returned to the
secondary supply tank. In the last third of the water-
steam cooling the heating of the supply containers
should be gradually reduced to ensure the temperature
step between the primary - secondary circuit.
While above TI>190oC it’s advisable to avoid a too
high active zone pressure difference, an FKSZ needs to
be shut down. Because of the even cooling of primary
circuit pipes, the shutdown FKSZ needs to be restarted
(TI =175 and at 160oC) once we stopped an operator.
Once TI< 150oC is reached the speed of cooling drops
significantly, because the ∆T between the supply water
and the primary circuit is low. Once a stable value of
below 150oC is reached, the system should be switched
from steam – water to water – water cooling. To do
this the GF, fresh steam lines, fresh steam collectors,
and the cooling system should be filled with feed
water. Before the start of the filling, prevention of
inadvertent defense operations must take place, the
security of the GF’s need to be paralyzed on the BER
panel, because LGF>Lnominal+600mm excludes the
upload path. The speed of the filling needs to be set in
such a way that it’s minimum 3.5h’s. At this stage of
the cool-down the migration from the Stepped Start
Programs to the SSP II should be checked. The switch
to this program also means that some elements of the
ZÜHR systems are no longer needed now, in fact their
trigger could lead to adverse consequences, and
therefore, they should be staggered.
(Eg., Under pressure, still closed, but cooled reactor, if
the TH pumps are started even if for a false signal, we
can go beyond the allowed pressure of the brittle
temperature in seconds, or the sprinkler system starts
for a wrong signal, since on this primary temperature
it’s unlikely that even in the event of a broken pipe the
pressure of the containment reaches the limit.)Since
the amount of heat removal is steadily declining over
the filling, care should be taken that the primary circuit
does not warm up to above 150°C.
After filling the secondary side, the cooling must
continue a water - water mode of operation using five
FKSZ while TI <100°C is reached. The secondary side
circulation is ensured by chilling pumps. If the primary
circuit average temperature is below 100°C, the FKSZ’s
need to be stopped by detaching the earlier used two
loops. Secondary side steam generators that have been
taken out of the plant loops should not be excluded,
ensuring their intense chilling. Their detachment should
be carried out at TGF fal≤ 4°C but no later than before the
reactor is depressurized. If the difference in temperature
between the pressurizer and the added water is ∆T < 80oC
the cooling of the pressurizer can be continued by using
supplement pumps
2. The simulation of the cooling
To be able to analyze the task, in the first step let’s see
how large this energy is [1,5]. The codes that use
numerical methods to estimate the remnant heat (decay
heat) (Melcor, Relap 1-2-3, Trac, Origen) are capable to
model the state with a precision of 3-5%.
A. The simulation of remanent heat
Using MATLAB R2013a with numerical methods we
simulated (Figure 5.), a T=335days constantly
operational P0 = 1485MWt („Megawatt thermal”) heat
energy producing reactor, it’s remnant heat 10 days
following it’s shutdown (864000s) is shown on figure6.
This value even after ten days is more than 3MWt.
Fig. 3. Tipical cooling diagram for a rector block
Fig. 4. Change of the remanent thermal power in six-month
period at the Fukushima power plant
3
The algorithm used [M. Ragheb, 3/22/2011] [2]:
P(t) = 6.48x10⁻³
P0 [t -0.2
– (t+T0) -0.2
] [MWt] (1)
B. The emergency stop in the system after shutdown
Hereinafter, we excited the SCRAM (emergency
stop) signal shutdown reactor and associated metalwork
combined transfer function with the current heat output
signal (Figure 7.).
The transfer function was determined by a single
proportional storage member (PT1) function,
determined because of water and metal mass,
considering the reactor, fuel, main water circuit lines,
primary coolant masses and specific heat values.
Without forced circulation or additional heat removal,
using an account with very high heat storage capacity,
the output function scaled in average temperatures
even after ten days shows a monotonic character
(Figure 4.). Assuming continuously available (fixed)
emergency stop heat extracting system and power, the
about 4MWt heat removal reverses its trend on the
seventh day, at a temperature of 300°C (Figure 8, the
third chart).
Fig. 5. Simulation modelling of remanent heat
Fig. 6. The simulated remanent thermal power
Fig. 7. Extended simulation model

39
2
subtraction of steam from the fresh steam collector
until TI = 140oC is reached. The condensate condensed
in the technology condenser is returned to the
secondary supply tank. In the last third of the water-
steam cooling the heating of the supply containers
should be gradually reduced to ensure the temperature
step between the primary - secondary circuit.
While above TI>190oC it’s advisable to avoid a too
high active zone pressure difference, an FKSZ needs to
be shut down. Because of the even cooling of primary
circuit pipes, the shutdown FKSZ needs to be restarted
(TI =175 and at 160oC) once we stopped an operator.
Once TI< 150oC is reached the speed of cooling drops
significantly, because the ∆T between the supply water
and the primary circuit is low. Once a stable value of
below 150oC is reached, the system should be switched
from steam – water to water – water cooling. To do
this the GF, fresh steam lines, fresh steam collectors,
and the cooling system should be filled with feed
water. Before the start of the filling, prevention of
inadvertent defense operations must take place, the
security of the GF’s need to be paralyzed on the BER
panel, because LGF>Lnominal+600mm excludes the
upload path. The speed of the filling needs to be set in
such a way that it’s minimum 3.5h’s. At this stage of
the cool-down the migration from the Stepped Start
Programs to the SSP II should be checked. The switch
to this program also means that some elements of the
ZÜHR systems are no longer needed now, in fact their
trigger could lead to adverse consequences, and
therefore, they should be staggered.
(Eg., Under pressure, still closed, but cooled reactor, if
the TH pumps are started even if for a false signal, we
can go beyond the allowed pressure of the brittle
temperature in seconds, or the sprinkler system starts
for a wrong signal, since on this primary temperature
it’s unlikely that even in the event of a broken pipe the
pressure of the containment reaches the limit.)Since
the amount of heat removal is steadily declining over
the filling, care should be taken that the primary circuit
does not warm up to above 150°C.
After filling the secondary side, the cooling must
continue a water - water mode of operation using five
FKSZ while TI <100°C is reached. The secondary side
circulation is ensured by chilling pumps. If the primary
circuit average temperature is below 100°C, the FKSZ’s
need to be stopped by detaching the earlier used two
loops. Secondary side steam generators that have been
taken out of the plant loops should not be excluded,
ensuring their intense chilling. Their detachment should
be carried out at TGF fal≤ 4°C but no later than before the
reactor is depressurized. If the difference in temperature
between the pressurizer and the added water is ∆T < 80oC
the cooling of the pressurizer can be continued by using
supplement pumps
2. The simulation of the cooling
To be able to analyze the task, in the first step let’s see
how large this energy is [1,5]. The codes that use
numerical methods to estimate the remnant heat (decay
heat) (Melcor, Relap 1-2-3, Trac, Origen) are capable to
model the state with a precision of 3-5%.
A. The simulation of remanent heat
Using MATLAB R2013a with numerical methods we
simulated (Figure 5.), a T=335days constantly
operational P0 = 1485MWt („Megawatt thermal”) heat
energy producing reactor, it’s remnant heat 10 days
following it’s shutdown (864000s) is shown on figure6.
This value even after ten days is more than 3MWt.
Fig. 3. Tipical cooling diagram for a rector block
Fig. 4. Change of the remanent thermal power in six-month
period at the Fukushima power plant
3
The algorithm used [M. Ragheb, 3/22/2011] [2]:
P(t) = 6.48x10⁻³
P0 [t -0.2
– (t+T0) -0.2
] [MWt] (1)
B. The emergency stop in the system after shutdown
Hereinafter, we excited the SCRAM (emergency
stop) signal shutdown reactor and associated metalwork
combined transfer function with the current heat output
signal (Figure 7.).
The transfer function was determined by a single
proportional storage member (PT1) function,
determined because of water and metal mass,
considering the reactor, fuel, main water circuit lines,
primary coolant masses and specific heat values.
Without forced circulation or additional heat removal,
using an account with very high heat storage capacity,
the output function scaled in average temperatures
even after ten days shows a monotonic character
(Figure 4.). Assuming continuously available (fixed)
emergency stop heat extracting system and power, the
about 4MWt heat removal reverses its trend on the
seventh day, at a temperature of 300°C (Figure 8, the
third chart).
Fig. 5. Simulation modelling of remanent heat
Fig. 6. The simulated remanent thermal power
Fig. 7. Extended simulation model
40
4
It should be noted, a lesser value is also capable of
reversing the trend, that is to cause cooling, since the
thermal decomposition function decreases
monotonically, the question is when and how long will
it allow the average temperature to climb up. In the
case of our operating systems protection signals are
formed at - 305°C and 310°C values, it is not
appropriate to allow a higher value for a standing
block either. An obvious question is whether the huge,
metal and water - weight stored heat energy should be
directly converted in to electrical energy by an
electrical (TEG) converter and used for powering the
residual heat removal as a "third kind" diverse
authoritarian type supply.
Main equipment otherwise covered with insulation if
you cover them with TEG –considering characteristics
of temperature and ventilation of the area (the box) will
continue, - it is required due to cold-side heat removal
by the TEG–to generate approximately 2.5 - 3.0MW of
electricity, if we assume current TEG efficiencies [4].
C. The installation of TEG as a residual heat-
absorber
A system thus formed, from a thermal perspective is a
negative feedback system, which guarantees safety (9)
for protection against overtemperature. The
thermoelectric generator in the feedback path can also
be modeled as a PT1 member, however, it’s time
constant is much smaller than the pre-coupling loop, the
time constant of the technology.
The thus constructed MATLAB model can be seen on
figure 10., while the cooling curves are shown on figure
11. The “minima” function that does not allow the
temperature to climb above 300°C, should have at least
a transfer function. Increasing the time
constant does not affect the shape of the curve, it
determines the availability of electric power that can be
extracted from the TEG, while the proportional transfer
component has effect on the slope of the cooling.
Fig. 8. Without forced circulation or additional heat
removal SCRAM
PT1
PT1
-
TEG
Technológia
Fig. 10. The model of effect for incorporated TEG heat removal
5
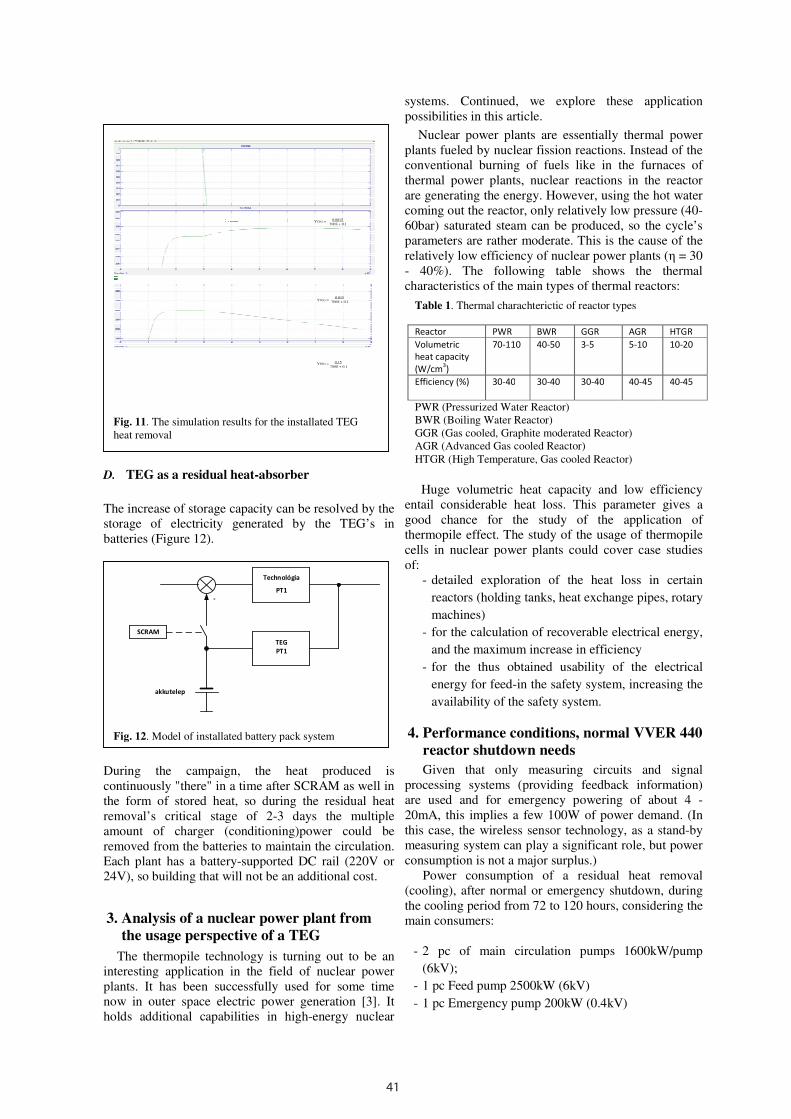
D. TEG as a residual heat-absorber
The increase of storage capacity can be resolved by the
storage of electricity generated by the TEG’s in
batteries (Figure 12).
During the campaign, the heat produced is
continuously "there" in a time after SCRAM as well in
the form of stored heat, so during the residual heat
removal’s critical stage of 2-3 days the multiple
amount of charger (conditioning)power could be
removed from the batteries to maintain the circulation.
Each plant has a battery-supported DC rail (220V or
24V), so building that will not be an additional cost.
3. Analysis of a nuclear power plant from
the usage perspective of a TEG
The thermopile technology is turning out to be an
interesting application in the field of nuclear power
plants. It has been successfully used for some time
now in outer space electric power generation [3]. It
holds additional capabilities in high-energy nuclear
systems. Continued, we explore these application
possibilities in this article.
Nuclear power plants are essentially thermal power
plants fueled by nuclear fission reactions. Instead of the
conventional burning of fuels like in the furnaces of
thermal power plants, nuclear reactions in the reactor
are generating the energy. However, using the hot water
coming out the reactor, only relatively low pressure (40-
60bar) saturated steam can be produced, so the cycle’s
parameters are rather moderate. This is the cause of the
relatively low efficiency of nuclear power plants (η = 30
- 40%). The following table shows the thermal
characteristics of the main types of thermal reactors:
Huge volumetric heat capacity and low efficiency
entail considerable heat loss. This parameter gives a
good chance for the study of the application of
thermopile effect. The study of the usage of thermopile
cells in nuclear power plants could cover case studies
of:
- detailed exploration of the heat loss in certain
reactors (holding tanks, heat exchange pipes, rotary
machines)
- for the calculation of recoverable electrical energy,
and the maximum increase in efficiency
- for the thus obtained usability of the electrical
energy for feed-in the safety system, increasing the
availability of the safety system.
4. Performance conditions, normal VVER 440
reactor shutdown needs
Given that only measuring circuits and signal
processing systems (providing feedback information)
are used and for emergency powering of about 4 -
20mA, this implies a few 100W of power demand. (In
this case, the wireless sensor technology, as a stand-by
measuring system can play a significant role, but power
consumption is not a major surplus.)
Power consumption of a residual heat removal
(cooling), after normal or emergency shutdown, during
the cooling period from 72 to 120 hours, considering the
main consumers:
- 2 pc of main circulation pumps 1600kW/pump
(6kV);
- 1 pc Feed pump 2500kW (6kV)
- 1 pc Emergency pump 200kW (0.4kV)
0.0015
700S + 0.1YTEG =
0.015
700S + 0.1
0.15
700S + 0.1
YTEG =
YTEG =
Fig. 11. The simulation results for the installated TEG
heat removal
SCRAM
PT1
PT1
-
TEG
Technológia
akkutelep
Fig. 12. Model of installated battery pack system
Table 1. Thermal charachterictic of reactor types
Reactor PWR BWR GGR AGR HTGR Volumetric heat capacity (W/cm3)
70-110 40-50 3-5 5-10 10-20
Efficiency (%)
30-40 30-40 30-40 40-45 40-45
PWR (Pressurized Water Reactor)
BWR (Boiling Water Reactor)
GGR (Gas cooled, Graphite moderated Reactor)
AGR (Advanced Gas cooled Reactor)
HTGR (High Temperature, Gas cooled Reactor)
41
4
It should be noted, a lesser value is also capable of
reversing the trend, that is to cause cooling, since the
thermal decomposition function decreases
monotonically, the question is when and how long will
it allow the average temperature to climb up. In the
case of our operating systems protection signals are
formed at - 305°C and 310°C values, it is not
appropriate to allow a higher value for a standing
block either. An obvious question is whether the huge,
metal and water - weight stored heat energy should be
directly converted in to electrical energy by an
electrical (TEG) converter and used for powering the
residual heat removal as a "third kind" diverse
authoritarian type supply.
Main equipment otherwise covered with insulation if
you cover them with TEG –considering characteristics
of temperature and ventilation of the area (the box) will
continue, - it is required due to cold-side heat removal
by the TEG–to generate approximately 2.5 - 3.0MW of
electricity, if we assume current TEG efficiencies [4].
C. The installation of TEG as a residual heat-
absorber
A system thus formed, from a thermal perspective is a
negative feedback system, which guarantees safety (9)
for protection against overtemperature. The
thermoelectric generator in the feedback path can also
be modeled as a PT1 member, however, it’s time
constant is much smaller than the pre-coupling loop, the
time constant of the technology.
The thus constructed MATLAB model can be seen on
figure 10., while the cooling curves are shown on figure
11. The “minima” function that does not allow the
temperature to climb above 300°C, should have at least
a transfer function. Increasing the time
constant does not affect the shape of the curve, it
determines the availability of electric power that can be
extracted from the TEG, while the proportional transfer
component has effect on the slope of the cooling.
Fig. 8. Without forced circulation or additional heat
removal SCRAM
PT1
PT1
-
TEG
Technológia
Fig. 10. The model of effect for incorporated TEG heat removal
5
D. TEG as a residual heat-absorber
The increase of storage capacity can be resolved by the
storage of electricity generated by the TEG’s in
batteries (Figure 12).
During the campaign, the heat produced is
continuously "there" in a time after SCRAM as well in
the form of stored heat, so during the residual heat
removal’s critical stage of 2-3 days the multiple
amount of charger (conditioning)power could be
removed from the batteries to maintain the circulation.
Each plant has a battery-supported DC rail (220V or
24V), so building that will not be an additional cost.
3. Analysis of a nuclear power plant from
the usage perspective of a TEG
The thermopile technology is turning out to be an
interesting application in the field of nuclear power
plants. It has been successfully used for some time
now in outer space electric power generation [3]. It
holds additional capabilities in high-energy nuclear
systems. Continued, we explore these application
possibilities in this article.
Nuclear power plants are essentially thermal power
plants fueled by nuclear fission reactions. Instead of the
conventional burning of fuels like in the furnaces of
thermal power plants, nuclear reactions in the reactor
are generating the energy. However, using the hot water
coming out the reactor, only relatively low pressure (40-
60bar) saturated steam can be produced, so the cycle’s
parameters are rather moderate. This is the cause of the
relatively low efficiency of nuclear power plants (η = 30
- 40%). The following table shows the thermal
characteristics of the main types of thermal reactors:
Huge volumetric heat capacity and low efficiency
entail considerable heat loss. This parameter gives a
good chance for the study of the application of
thermopile effect. The study of the usage of thermopile
cells in nuclear power plants could cover case studies
of:
- detailed exploration of the heat loss in certain
reactors (holding tanks, heat exchange pipes, rotary
machines)
- for the calculation of recoverable electrical energy,
and the maximum increase in efficiency
- for the thus obtained usability of the electrical
energy for feed-in the safety system, increasing the
availability of the safety system.
4. Performance conditions, normal VVER 440
reactor shutdown needs
Given that only measuring circuits and signal
processing systems (providing feedback information)
are used and for emergency powering of about 4 -
20mA, this implies a few 100W of power demand. (In
this case, the wireless sensor technology, as a stand-by
measuring system can play a significant role, but power
consumption is not a major surplus.)
Power consumption of a residual heat removal
(cooling), after normal or emergency shutdown, during
the cooling period from 72 to 120 hours, considering the
main consumers:
- 2 pc of main circulation pumps 1600kW/pump
(6kV);
- 1 pc Feed pump 2500kW (6kV)
- 1 pc Emergency pump 200kW (0.4kV)
0.0015
700S + 0.1YTEG =
0.015
700S + 0.1
0.15
700S + 0.1
YTEG =
YTEG =
Fig. 11. The simulation results for the installated TEG
heat removal
SCRAM
PT1
PT1
-
TEG
Technológia
akkutelep
Fig. 12. Model of installated battery pack system
Table 1. Thermal charachterictic of reactor types
Reactor PWR BWR GGR AGR HTGR Volumetric heat capacity (W/cm3)
70-110 40-50 3-5 5-10 10-20
Efficiency (%)
30-40 30-40 30-40 40-45 40-45
PWR (Pressurized Water Reactor)
BWR (Boiling Water Reactor)
GGR (Gas cooled, Graphite moderated Reactor)
AGR (Advanced Gas cooled Reactor)
HTGR (High Temperature, Gas cooled Reactor)
42
6
In the last stages of cooling only two cooling
pumps are operating (160kW/machine, 0.4kV voltage).
Additional one needs to add the above (typically relay
activated) control, measurement and control loops
consumption as well. During the stage of shut down
the greatest power requirement approximately is
6000kW (6MW), which after 72-120 drops to 300 -
400kW. It’s not negligible that the “big” pumps have
6kV 50Hz voltage needs.
Emergency core cooling systems power
consumption, for an automatic protection signal in case
of declared types of breakdown is:
- 3 pc High pressure emergency core pump
520kW/pump, 6kV
- 3 pc Low pressure emergency core pump
125kW/pump, 0.4kV
- 3 pc Spinkler system pump160kW/pump,
0.4kV.
Given for worst case emergency scenario, an
approximately 2500kW power demand occurs in the
emergency cooling period.
The surface temperature of the reactor (more
precisely the reactors metal walls temperature) is being
constantly monitored and registered, illustrated on a
self-made P&I schema which means the usage of 3
Pt46 resistance-thermometers (YA00T101B1, B3, B5
alphanumeric measurements, disposed 120° relative to
each other). During normal operation, at any point in
time these measurements show values of 240°C-
250°C. I am not aware of the surface temperature
distribution modeling, but this is the true value for
about the entire wall surface. The blue colored
measurements are computer measurement, they are
available in an archived (trend) form. The trend shows
the temperature measurements of six concrete consoles
(YA00T001B1-B6).
5. Approximation of the extractable power
with the TEG
An assessment of the potential primary circuit
surfaces: in the situation with six main water conduits,
their coverable length with TEG in total is 120m,
accounted for a hot and cold branch of 10-10m.
Obviously, the treatment, operation equipment, nozzles,
valves, thermometer bag places cannot be affected with
the TEG covering. With a 560mm diameter, main water
conduit, on most the pipe surfaces we can have access to
a usable surface of 210m2, with 270°C average
temperature. This means that on the cold end 250°C, on
the hot end 280°C temperatures can heat the placed
TEG’s. Calculating with six, 10m long, 4m diameter
steam generators we get a surface of 754m2, at 220°C
which is coverable. A major piece of equipment surface
is the pressurizer where the coverable area is 52m2, but
the temperature of the surface is 280°C. The similar
exploration of the secondary circuit: a 135m long,
465mm diameter main steam pipe means a surface of
197m2, at 220°C. Calculating with a water supply
system average temperature of 180°C, with a 426mm
diameter on 120m length, we get a similar surface of
160m2. The major secondary containers, low - and high-
pressure preheater lines, supply containers usable
surfaces relative to the block are: 395m2, 100°C average
temperature preheater, 480m2, 200°C average
temperature high pressure preheater, two 105m2, 150°C
temperature supply tanks. The above are the major
places for energy retrieval, leaving out the auxiliary
systems and small unusable surfaces. The room
temperatures, „cold side temperatures” are between
30°C - 50°C.
Fig. 13. Self-made P&I schema
Fig. 14. TEG material pair efficieny
7
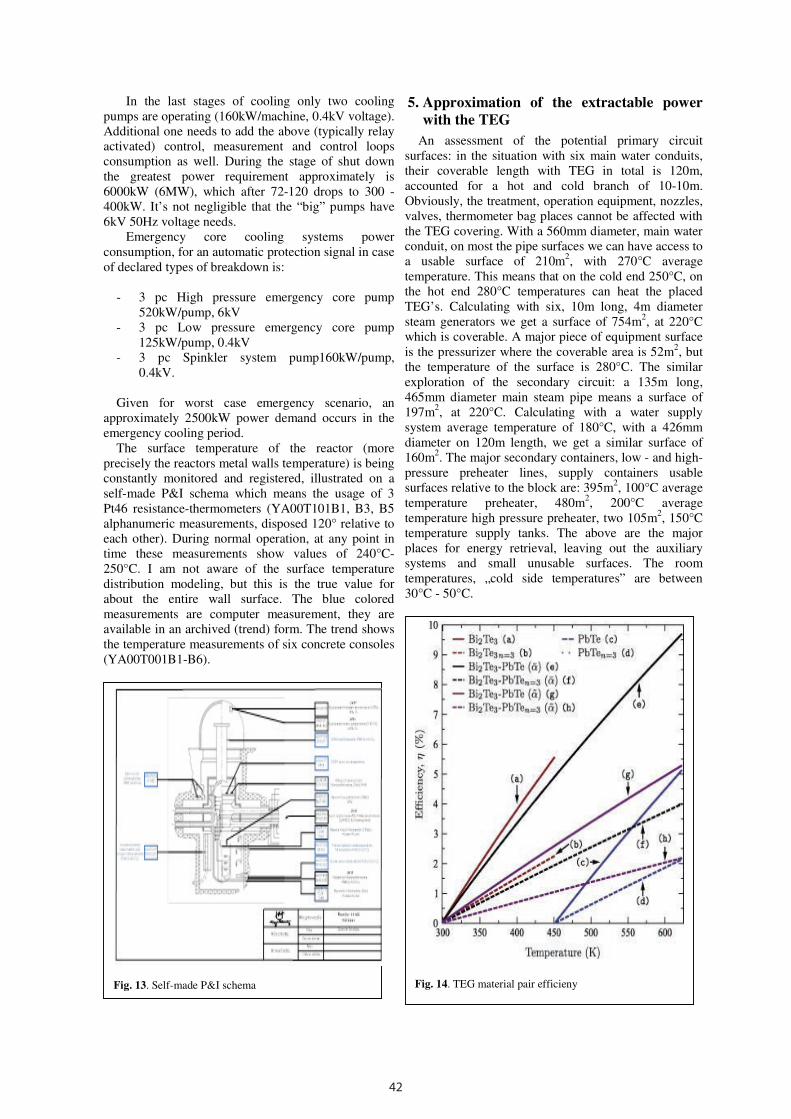
Thanks to Thomson, Seebeck and Peltier’s research,
we use thermocouples for measurement purposes for a
long time now. However, the phenomenon of using it
as an energy source application is made possible
through experimenting with new materials. One of the
best types of such thermoelectric modules (TEG’s)
with the best thermoelectric properties is the bismuth-
telluride (Bi2TE3) based pseudo-binary group of alloys.
Figure 7. shows some of the more important TEG
material pairs efficiency as a function of temperature.
6. Summary
In this paper, we have tried to show how is it possible
to simulate processes taking place in an abandoned
nuclear power plant. As you can see this can be
resolved perfectly using MATLAB. We have outlined
the theoretical possibility of usage of residual heat
removal using a third, diverse way method. In further
studies, we try to put more emphasis on the fine tuning
of the simulated system and to clarify the physical
realization of the possibilities.
During the study, it can be concluded that, yes, there is
justification in using the TEG in nuclear power plants.
We may have to wait a few years so that TEG’s with
such parameters hit the market that enable greater power
generation (and thus enabling the operation of stronger
motors with them), but the results outlined here are said
to be promising. If we only consider that the resulting
2.68MW, the daily consumption of a small town, can be
covered by it, or it can supply the mentioned measuring
and signaling devices current needs, we should look at it
as it is worth it. In any case, its usage is worth further
consideration when critical outages, or emergencies
occur.
Acknowledgements This work/publication is supported by the EFOP-3.6.1-
16-2016-00003 project. The project is co-financed by
the European Union.
References [1] Laszlo Kajtar, Jozsef Nyers, Janos Szabo: Dynamic
thermal dimensioning of underground spaces;
Volume 87, 1 July 2015, Pages 361–368
[2] M. Ragheb: Decay heat generation in fission
reactors, 3/22/2011
[3] A. Szente, I. Farkas and P. Odry: The application of
ThermopileTechnology in high Energy Nuclear
Power Plants,Expres 2014
[4] http://www.tecteg.com/
[5] Nyers József, Kajtar Laszlo, Slavica Tomic, Nyers
ArpadInvestment-savings Method for Energy-
economic Optimization of External Wall Thermal
Insulation ThicknessENERGY AND BUILDINGS
86: pp. 268-274. (2014)
Hot side
Heat source temperature: 500°C Hot side temperature 480°C Cool side temperature: 45°C Open circuit voltage: 19.45V Output voltage: 9.75V Load current: 1.13 A Output power: 11.0 W Surface: 0.004 m2
Cool side Fig. 15. CMO-32-62S CASCADE TEG module

43
6
In the last stages of cooling only two cooling
pumps are operating (160kW/machine, 0.4kV voltage).
Additional one needs to add the above (typically relay
activated) control, measurement and control loops
consumption as well. During the stage of shut down
the greatest power requirement approximately is
6000kW (6MW), which after 72-120 drops to 300 -
400kW. It’s not negligible that the “big” pumps have
6kV 50Hz voltage needs.
Emergency core cooling systems power
consumption, for an automatic protection signal in case
of declared types of breakdown is:
- 3 pc High pressure emergency core pump
520kW/pump, 6kV
- 3 pc Low pressure emergency core pump
125kW/pump, 0.4kV
- 3 pc Spinkler system pump160kW/pump,
0.4kV.
Given for worst case emergency scenario, an
approximately 2500kW power demand occurs in the
emergency cooling period.
The surface temperature of the reactor (more
precisely the reactors metal walls temperature) is being
constantly monitored and registered, illustrated on a
self-made P&I schema which means the usage of 3
Pt46 resistance-thermometers (YA00T101B1, B3, B5
alphanumeric measurements, disposed 120° relative to
each other). During normal operation, at any point in
time these measurements show values of 240°C-
250°C. I am not aware of the surface temperature
distribution modeling, but this is the true value for
about the entire wall surface. The blue colored
measurements are computer measurement, they are
available in an archived (trend) form. The trend shows
the temperature measurements of six concrete consoles
(YA00T001B1-B6).
5. Approximation of the extractable power
with the TEG
An assessment of the potential primary circuit
surfaces: in the situation with six main water conduits,
their coverable length with TEG in total is 120m,
accounted for a hot and cold branch of 10-10m.
Obviously, the treatment, operation equipment, nozzles,
valves, thermometer bag places cannot be affected with
the TEG covering. With a 560mm diameter, main water
conduit, on most the pipe surfaces we can have access to
a usable surface of 210m2, with 270°C average
temperature. This means that on the cold end 250°C, on
the hot end 280°C temperatures can heat the placed
TEG’s. Calculating with six, 10m long, 4m diameter
steam generators we get a surface of 754m2, at 220°C
which is coverable. A major piece of equipment surface
is the pressurizer where the coverable area is 52m2, but
the temperature of the surface is 280°C. The similar
exploration of the secondary circuit: a 135m long,
465mm diameter main steam pipe means a surface of
197m2, at 220°C. Calculating with a water supply
system average temperature of 180°C, with a 426mm
diameter on 120m length, we get a similar surface of
160m2. The major secondary containers, low - and high-
pressure preheater lines, supply containers usable
surfaces relative to the block are: 395m2, 100°C average
temperature preheater, 480m2, 200°C average
temperature high pressure preheater, two 105m2, 150°C
temperature supply tanks. The above are the major
places for energy retrieval, leaving out the auxiliary
systems and small unusable surfaces. The room
temperatures, „cold side temperatures” are between
30°C - 50°C.
Fig. 13. Self-made P&I schema
Fig. 14. TEG material pair efficieny
7
Thanks to Thomson, Seebeck and Peltier’s research,
we use thermocouples for measurement purposes for a
long time now. However, the phenomenon of using it
as an energy source application is made possible
through experimenting with new materials. One of the
best types of such thermoelectric modules (TEG’s)
with the best thermoelectric properties is the bismuth-
telluride (Bi2TE3) based pseudo-binary group of alloys.
Figure 7. shows some of the more important TEG
material pairs efficiency as a function of temperature.
6. Summary
In this paper, we have tried to show how is it possible
to simulate processes taking place in an abandoned
nuclear power plant. As you can see this can be
resolved perfectly using MATLAB. We have outlined
the theoretical possibility of usage of residual heat
removal using a third, diverse way method. In further
studies, we try to put more emphasis on the fine tuning
of the simulated system and to clarify the physical
realization of the possibilities.
During the study, it can be concluded that, yes, there is
justification in using the TEG in nuclear power plants.
We may have to wait a few years so that TEG’s with
such parameters hit the market that enable greater power
generation (and thus enabling the operation of stronger
motors with them), but the results outlined here are said
to be promising. If we only consider that the resulting
2.68MW, the daily consumption of a small town, can be
covered by it, or it can supply the mentioned measuring
and signaling devices current needs, we should look at it
as it is worth it. In any case, its usage is worth further
consideration when critical outages, or emergencies
occur.
Acknowledgements This work/publication is supported by the EFOP-3.6.1-
16-2016-00003 project. The project is co-financed by
the European Union.
References [1] Laszlo Kajtar, Jozsef Nyers, Janos Szabo: Dynamic
thermal dimensioning of underground spaces;
Volume 87, 1 July 2015, Pages 361–368
[2] M. Ragheb: Decay heat generation in fission
reactors, 3/22/2011
[3] A. Szente, I. Farkas and P. Odry: The application of
ThermopileTechnology in high Energy Nuclear
Power Plants,Expres 2014
[4] http://www.tecteg.com/
[5] Nyers József, Kajtar Laszlo, Slavica Tomic, Nyers
ArpadInvestment-savings Method for Energy-
economic Optimization of External Wall Thermal
Insulation ThicknessENERGY AND BUILDINGS
86: pp. 268-274. (2014)
Hot side
Heat source temperature: 500°C Hot side temperature 480°C Cool side temperature: 45°C Open circuit voltage: 19.45V Output voltage: 9.75V Load current: 1.13 A Output power: 11.0 W Surface: 0.004 m2
Cool side Fig. 15. CMO-32-62S CASCADE TEG module