simultaneous hplc determination of 22 components of · pdf file ·...
TRANSCRIPT
January - February 2014 Indian Journal of Pharmaceutical Sciences 19
*Address for correspondence E-mail: [email protected]
Simultaneous HPLC Determination of 22 Components of Essential Oils; Method Robustness with Experimental DesignA. POREL*, Y. SANYAL AND A. KUNDUEast India Pharmaceutical Works Limited, Quality Control Department, 119, Biren Roy Road (W), Kolkata‑700 061, India
Porel, et al.: LC Determination of Potential Components in Essential Oil
The aim of the present study was the development and validation of a simple, precise and specific reversed phase HPLC method for the simultaneous determination of 22 components present in different essential oils namely cinnamon bark oil, caraway oil and cardamom fruit oil. The chromatographic separation of all the components was achieved on Wakosil–II C
18 column with mixture of 30 mM ammonium acetate buffer (pH 4.7), methanol
and acetonitrile in different ratio as mobile phase in a ternary linear gradient mode. The calibration graphs plotted with five different concentrations of each component were linear with a regression coefficient R2>0.999. The limit of detection and limit of quantitation were estimated for all the components. Effect on analytical responses by small and deliberate variation of critical factors was examined by robustness testing with Design of Experiment employing Central Composite Design and established that this method was robust. The method was then validated for linearity, precision, accuracy, specificity and demonstrated to be applicable to the determination of the ingredients in commercial sample of essential oil.
Key words: Cinnamon bark oil, caraway oil, cardamom fruit oil, Design of Experiment, essential oil, HPLC, robustness testing
Since time immemorial, essential oils have been used for many purposes due to their diverse pharmacological properties. These are mainly complex mixtures of terpenoids and aromatic compounds. Cardamom oil is mainly used as a flavour, in flatulent indigestion and as an appetite stimuliser. In addition, it also possesses antibacterial, antiseptic, carminative and antispasmodic properties[1]. Caraway oil is used in pharmacy, perfumery, food and is also effective against spasmodic gastrointestinal complaints, flatulence, irritable stomach, indigestion, lack of appetite and dyspepsia in adults[2,3]. Cinnamon oil is used as a carminative, diuretic, antiflatulent, antipyretic, antiallergenic, antiinflammatory and in cardiac disorders[4‑6]. The sources of oils namely Ceylon cinnamon bark oil, cardamom fruit oil and caraway oil are Cinnamomum zeylancium Blume (synonym C. verum J Presl, Family: Lauraceae), Elettaria cardamomum Maton (Family: Zingiberaceae) and Carum carvi L (Family: Umbelliferae), respectively. Most of the reported chromatographic
methods for quantitative determination of constituents of essential oils are mainly by GC or GC‑MS. The main constituent of Ceylon cinnamon bark oil is trans cinnamaldehyde (72.0‑82.15%), which is estimated by GC‑MS analysis[4]. Several minor constituents generally present in all cinnamomum species, namely trans cinnamyl acetate (3.24‑3.65%), eugenol (1.07‑13.3%), trans cinnamyl alcohol (0.5‑0.6%), o‑methoxy benzaldehyde (0.09‑0.15%), benzyl benzoate (0.4‑1.0%), α‑terpineol (0.35‑0.62%), β‑caryophyllene (1.0‑2.0%), linalool (0.7‑1.06%), limonene (0.09‑0.095%), myrcene (0.07‑0.08%), β‑pinene (0.02‑0.03%), traces of benzaldehyde and trans cinnamic acid have been estimated by GC[7‑9]. The major constituents of caraway oil, R‑carvone (37.98‑73.0 %), D‑limonene (18.0‑38.26%), along with some minor constituents α‑pinene (5.21%), cis‑carveol (5.01%) and β‑myrcene (4.67%) were analysed by GC analysis[10,11]. The main constituent of cardamom oil, that is, α‑terpinyl acetate (20.0‑68.0%), 1,8‑cineole (10.7‑60.0%), along with some other minor constituents linalool, linalyl acetate, α‑terpineol, terpinen‑4‑ol, geraniol, nerol and methyl eugenol were also analysed by GC[8,12‑15]. A
Research Paper

www.ijpsonline.com
20 Indian Journal of Pharmaceutical Sciences January - February 2014
GC method for chromatographic purity had been described in British Pharmacopoeia for Ceylon cinnamon bark oil[16] and caraway oil[17].
A few LC methods have been reported for the quantitative determination of some components of different cinnamomum species. High performance liquid chromatography (HPLC) methods for chromatographic separation and determination of some characteristic compounds in essential oils[18], cinnamaldehyde and methyl eugenol from the methanolic extraction of dried bark powder of Cinnamomum zeylancium Blume[18,19], eugenol, cinnamaldehyde and iso eugenol from the leaf powder and stem bark of some Cinnamomum species[20], eugenol from the extract of dried powder of Cinnamomum tamala leaves and its polyhedral formulation have been reported[21]. No LC method is reported so far for analysis of caraway oil and cardamom oil, and also no validated LC method is known for the simultaneous and quantitative determination of most potential components present in these three essential oils. The quantitation of essential oil components is essential to determine the quality as their content varies with geographical and seasonal variation. All essential oils are subjected to deterioration, mainly caused by oxidation, hydrolysis or polymerisation on long‑term storage. But GC method has some limitation for volatile components as structural alterations of thermally labile compounds may occur during analysis due to high temperature of injector or columns. These oils are used in many pharmaceutical oral liquid preparations with water based matrices, which needs time consuming sample preparation steps for GC analysis. The need for a simple validated liquid chromatographic method for simultaneous estimation of all potential components present in these essential oils was felt. This developed and validated HPLC method can be considered as an alternative or supplementary method of essential oil analysis.
The present study was planned for the simultaneous analysis of a total of 22 constituents, namely benzoic acid (BA), trans cinnamic acid (TCNMA), coumarin (CMN), benzaldehyde (BNZLD), cinnamylalcohol (CNMOH), trans cinnamaldehyde (TCNM), eugenol (EGL), trans‑2‑methoxycinnamaldehyde (2MCNM), D(+) carvone (CVN), (‑) carveol (CVL), α‑terpineol (ATPNOL), (‑) terpinen‑4‑ol (TPN‑4‑OL), (+) dihydrocarvone (DHCVN), linalool
(LNL), geraniol (GRNL), safrole (SFRL), benzyl benzoate (BBZT), (±)α‑terpinylacetate (ATPA), myrcene (MYR), (+)‑limonene (LMN), (+)‑α‑pinene (PNN) and (‑) trans caryophyllene (TCRPHLN) belonging to different chemical classes such as alcohol, carbonyl compounds, esters, lactones, cyclic hydrocarbons and phenols for their identification as well as quantification.
MATERIALS AND METHODS
All 22 standards (GR grade, 1‑22) of respective essential oil components were purchased from following sources: BA (100%), BNZLD (99%) from Merck, Germany, TCNMA (99%), CNMOH (98%), EGL (99%), CVL (97%), ATPNOL (90%), GRNL (98%), MYR (95%) from Aldrich, Germany, SFRL (97%), TCRPHLN (98.5%) from Sigma, Germany, CMN (90%), TCNM (99%), CVN(98%), DHCVN (98%), LNL (97%), BBZT (99%), LMN (90%) from Across Organics, ATPA (90%), PNN (98%) from Fluka. Methanol and acetonitrile gradient grade for HPLC analysis were obtained from Merck (Germany). High purity water was prepared using Milli Q purification system from Millipore (Peenya, Bangalore, India); all commercial oils were purchased from International Flavors and Fragrances India Limited, India.
The HPLC system consisted of Waters 1525 binary pump, Waters 717 plus auto sampler and Waters 2487 dual λ absorbance detector (Waters, Milford, MA, USA). Reversed phase columns, Hypersil ODS C18 (100×4.6 mm, i.d. 3µ) from Thermo Fischer, USA, Spherisorb C18 (125×4.6 mm, i.d. 3µ) from Waters, USA and Wakosil‑II C18 (150×4.6 mm, i.d. 3µ) from SGE, Australia were used. Free statistics software, version 1.1.23‑r7m Wessa, P. (2013) was used for statistical calculation.
Optimised chromatographic conditions:A ternary gradient elution was carried out using a isocratic mixture of 30 mM ammonium acetate buffer, pH 4.7 (a), methanol (b) and acetonitrile (c) in different ratio as mobile phase A, B and C at a flow rate of 1.1 ml/min, with injection volume being 30 µl. The mobile phases A, B and C were prepared in the following ratio of ammonium acetate buffer, 30 mM, pH 4.7 (a), acetonitrile (b) and methanol (c): A (61:19.5:19.5); B (32:34:34) and C (5:47.5:47.5). The ammonium acetate buffer was

www.ijpsonline.com
January - February 2014 Indian Journal of Pharmaceutical Sciences 21
prepared by dissolving 3.23 g of ammonium acetate in 1000 ml water and final pH was adjusted by adding acetic acid. All solutions were filtered through 0.22 µm nylon filter and degassed before use. HPLC analyses started isocratically with 100% A for 70 min, followed by a linear gradient to 100% B in 5 min, then an isocratic step for 50 min, followed by a linear gradient to 100% C in 5 min and then an isocratic step for 20 min before equilibration to starting conditions within 10 min. All 22 components eluted in 160 min with reproducible retention time, SD ranging from 0.26 to 2.67.
The chromatographic detection of all the analytes was done at 210 nm leading to the best signal‑to‑noise background ratio and close to λ max of maximum components. Identification of each component was done by comparing the RTs with that of the corresponding standard solution. Ultraviolet (UV)‑visible spectra were recorded (190‑720 nm) in order to obtain spectral information of each reference compound and essential oil sample.
Preparation of stock and standard solutions:For the preparation of individual stock solution of 22 standards (1‑22), each component was accurately weighed in volumetric flask and appropriately diluted with the diluting solvent, acetonitrile. The required concentration for linearity, range, accuracy and precision was prepared from the stock solution by serial dilution with the mobile phase A. All solutions, except benzaldehyde, were sufficiently stable for at least 15 d at 4º. Their stability was checked at regular intervals by HPLC comparing the constant area of each single peak, with the area obtained for the freshly prepared solution, which was fairly the same. Fresh working solutions were prepared daily by appropriate dilution of the stock solution using mobile phase A as diluting solvent.
Preparation of oil sample solution:Each accurately measured sample of caraway oil, cinnamon oil and cardamom oil was diluted with acetonitrile and mobile phase A (1:1) to make a concentration of around 4.0 mg/ml for the determination of assay for minor constituents and around 1 mg/ml for major components. The resulting solution was then subjected to HPLC analysis after filtration with 0.22 µm filter paper. All commercial oil samples were analysed in triplicate under the best chromatographic conditions. The
concentration of each component was determined from the corresponding peak area of the standard solution of known concentration.
Method validation:The developed analytical method was validated with respect to linearity, accuracy, precision, detection limit and robustness. The linearity was evaluated by analysing five different concentrations of each component ranging over lower to higher concentrations in triplicate, and was established by plotting the peak area versus standard concentration of each component using the method of least squares (MLS). For further confirmation of linearity, variance homogeneity of residuals (homoscedasticity) was checked. Also, by performing Student’s t‑test, it was found that the intercept was not significantly different from zero. Appropriate dilution of working standard solutions were made and analysed to obtain the limit of detection (LOD). LOD and limit of quantitation (LOQ) for a peak were evaluated on the basis of a signal‑to‑noise ratio of about 3:1 and about 10:1, respectively.
A standard mixture solution containing known amounts of all the 22 components with six different concentrations was analysed three times within a day to determine the within‑day variability and with three different concentrations on three different days in triplicate to determine between‑day precision and accuracy. Accuracy was further established by spiking with known amounts of each of the 22 standards to individual oil, before diluting to volume. The resultant solution was analysed in triplicate and accuracy was calculated by considering total and original concentration of each analyte.
Test for robustness was performed to predict any undesirable change of measured responses in routine practice by deliberate experimental variation of factors in infinitesimal small quantity around procedural value. Central Composite Design (CCD), (face centred, CCF, α=±1) was used for experimental set up and evaluation.
RESULTS AND DISCUSSION
The main purpose of the chromatographic method development was simultaneous separation and estimation of some most potential secondary metabolites present in essential oils as major and

www.ijpsonline.com
22 Indian Journal of Pharmaceutical Sciences January - February 2014
minor components. Twenty‑two components (1‑22) belonging to different chemical classes were chosen for the study. Their chemical structures are given in fig. 1. A detection wavelength of 210 nm was selected for its high sensitivity to all compounds (1‑22) after a full range UV scan. Compounds 1‑8, 16, 17 were aromatic derivatives, while the others, namely, 9‑15 and 18‑22 were terpenoids with differences in liophilicity and polarity. From the value of liophilicity, log P (logarithm of partition coefficient, P between two phases, calculated using Advanced Chemistry Development (ACD/Labs) software) of each component, it was found that all 22 compounds could be divided into three broad categories: compounds 1‑16 having maximum hydrophilicity (log P 1.48‑2.59), 17‑21 with intermediate hydrophilicity (log P 3.3‑3.78) and compound 22 with lowest hydrophilicity or maximum liophilicity (log P 5.09). As generally compounds with higher liophilicity having lower aqueous solubility are expected to be strongly retained by a highly liophilic RP column and vice versa, a gradient program with the
variation of polarity of mobile phase was planned to achieve acceptable separation. Sodium or ammonium acetate buffer solution of different molarity (20‑30 mM) in the pH range of 3‑7 was selected as the mobile phase A and 1:1 mixture of methanol and acetonitrile in different ratio as mobile phase B for optimisation purpose. Three columns with different hydrophobicity (e.g. Sperisorb ODS (125×4.6 mm, i.d. 3μ), Hypersil ODS (100×4.6 mm, i.d. 3μ) and Wakosil II C18 (150×4.6 mm, i.d. 3μ)) were selected for the purpose. The aromatic compounds present in essential oil eluted in reasonable time with good resolution by a simple mobile phase combination of water, acetonitrile and methanol in all three octadesylsilane (ODS) columns in isocratic mode, but the main tedious task was to select the optimum condition to elute with good separation of terpenic compounds having no good chromophores.
From initial investigation 6 critical pairs (CP), CMN/BNZLD, CP1; CVN/CVL, CP2; ATPNOL/ TPN‑4‑
Fig. 1: Chemical structures of twenty two components (1-22).
�
�
�

www.ijpsonline.com
January - February 2014 Indian Journal of Pharmaceutical Sciences 23
OL, CP3; TPN‑4‑OL/DHCVN, CP4; LNL/GRNL, CP5; and MYR/LMN, CP6 were identified. Buffer ratio was found to be a critical factor in the resolution of some closely eluted pairs of compounds, may be due to their close log P values. Increasing the aqueous buffer ratio from 50 to 70% and decreasing pH of buffer from 5.0 to 3.0 resulted in improvement of resolution among the pairs. From the above findings, it was anticipated that acetate buffer (a) between 50 and 70% ratio with a suitable pH in the range of 3‑5 might give the best resolution of CPs. Using another octadecylsilane column, Wakosil II C18, (150×4.6 mm, 3 µm), better resolution was found for all the components and with Spherisorb ODS column, separation was not good and hence not considered for further study.
After screening several gradient programmes, the following multiple time segmented binary gradient program, t (min)/%B: 0/37, 50/37, 55/50, 90/50, 95/75, 105/75, 110/95, 130/95, 140/37 (pH 5.0, 20 mM of Na‑acetate buffer) using Hypersil ODS column resulted in better resolution of all six CPs (CP1 to CP6). Due to unavailability of pure ATPA (18) standard, an unidentified impurity always appeared with this. Using ammonium acetate buffer, no improvement was found in the same column. Switching over to Wakosil II C18 (150×4.6 mm, 3 µm) column and volatile buffer ammonium acetate with further lowering of pH to 4.7, a good separation of the above six CPs was achieved, with the same time segmented binary program, but baseline noise was significantly high, creating difficulties for estimation of minor components in commercial oil sample. To minimise this baseline noise, 30 mM ammonium acetate buffer with pH 4.7 (a), methanol (b) and acetonitrile (c) was premixed in requisite ratio, as optimised from several multi‑segmented gradient runs. Three isocratic mixtures with the solvents a, b, c were prepared in the ratio of 61:19.5:19.5 (ternary gradient solvent mixture A), 32:34:34 (ternary gradient solvent mixture B), 5:47.5:47.5 (ternary gradient solvent mixture C). Finally, a best chromatographic separation of all the components was achieved by the ternary gradient programme at room temperature, as described in previous section of optimised chromatographic condition.
Under the chromatographic conditions, the 22 components were appropriately separated over a run
time of 160 min. The resolution (Rs) for all the five CPs achieved was in the range of 1.1 to 4.5. A typical chromatogram of a blank run and another for mixture of all 22 standards are shown in figs. 2 and 3, respectively. System suitability and system precision were performed daily by calculating values of N, Rs and Tf. The calibration curves were constructed covering lower to higher level of concentrations for all the 22 components. For each component, a series of five concentration points were prepared and analysed in triplicate. A summary of linearity validation data is given in Table 1. The correlation coefficient (r) for all linear regression equations were 0.999, explaining excellent correlation between analyte peak area and concentration of the component. In addition, the analysis of residuals for the assay showed that the values were randomly scattered around zero, which showed a good fit with the linear model. Also, the statistical analysis of variance (ANOVA) corresponding to the collected data of linearity the F test statistic (F) and its corresponding P‑value (P<0.05) indicated an overall goodness of fit for the model for all the 22 components, as listed in Table 1. The Student’s t‑test indicated that the intercept was not different from zero. The t‑exp was less than 2.132, which was tabulated value. The linearity was considered validated from the results obtained. The LOD of all the major and minor constituents was found to be in the ranges of 0.54‑11.65 µg/ml and the LOQ in the range of 2.30‑35.60 µg/ml (Table 1).
The within‑day precision showed mean absolute recovery in the range of 98.51‑102.78%, with RSD 0.13‑2.08% for three major components TCNM, CVN
Fig. 2: Blank chromatogram run in optimised ternary gradient programme.Isocratic run with 100% A, 0-70 min; linear gradient to 100% B, 70-75 min; isocratic run with 100% B, 75-125 min; linear gradient to 100% C, 125-130 min; isocratic run with 100% C, 130-150 min; equilibration to 100% A, 150-160 min.

www.ijpsonline.com
24 Indian Journal of Pharmaceutical Sciences January - February 2014
and ATPA and with mean absolute recovery 97.34‑103.96% with RSD 0.08‑3.85% for the remaining 19 minor components. The results are given in Table 2. The between‑day precision showed mean absolute recovery in the range of 101.12‑103.35% with RSD 0.65‑3.25% for the three main components TCNM,
CVN and ATPA and mean absolute recovery 97.48‑103.87% with RSD 0.19‑4.64% for the remaining 19 minor constituents (data not given). By applying ANOVA test to the recovery result, the statistical results with 95% confidence limit indicated that there was no significant difference between within‑day and between‑day analysis results in respect of tabulated F value. The accuracy and precision for the HPLC method was confirmed by the study of real samples spiked with known amounts of the corresponding standard substances. Three different levels (110, 120 and 130%) of spiking were analysed in triplicate to evaluate the s.d. A batch containing maximum number of identified components was chosen for spiking. In cinnamon oil, mean absolute recovery (±SD) of major component TCNM was 99.94±0.51% while that of other minor components ranged from 91.06±0.37% to 109.20±2.40%. In cardamom oil, mean absolute recovery of major component ATPA was 101.64±0.23% and that of other minor components ranged from 90.32±0.21% to 111.25±3.63%. In caraway oil mean absolute recovery of 2 major components, CVN and LMN was found to be 96.15±0.78% and 94.73±1.72%, respectively, while the minor components ranged from 95.94±0.54% to 114.31±3.35%. This indicated that the assay value obtained accurately represented the true content of the
Fig. 3: Typical HPLC chromatogram of mixtures of (1-22) standard compounds.1=BA (3.04), 2=TCNMA(5.84), 3=CMN(7.04), 4=BNZLD(7.52), 5=CNMOH(9.67), 6=TCNM (13.14),7=EGL(19.69), 8=2-MCNM (23.29), 9=CVN (31.16), 10=CVL (34.02), 11=ATPNOL (41.12), 12=TPN-4-OL (45.94), 13=DHCVN (49.73), 14=LNL (58.32 ), 15=GRNL (61.71)), 16=SFRL (76.88),17=BBZT (81.54),18=ATPA (88.65), 19=MYR (102.15), 20=LMN (107.88), 21=PNN (116.61 ), 22=TCRPHLN (136.42). unk= unidentified peak (RT given within parentheses)
TABLE 1: DATA FOR VALIDATION OF LINEARITY Compound Range
(µg/ml)Slope 95% C.I. of slope Intercept S.E. of
slopeT‑stat of intercept
F‑Stat (model)
P stat (model)
LOD (µg/ml)
LOQ (µg/ml)
BA 1.5-15.0 12679 1.22 E-04-1.30 E 04 9739 93 1.83 18469 5.41 E-05 0.75 2.3TCNMA 4.0-40.0 83200 8.02 E 04-8.61 E 04 69344 930 1.459 7987 3.1 E-06 0.54 1.98CMN 4.0-40.0 82546 (7.98-8.5) E+04 68553 861 1.558 9172 2.5 E-06 1.65 4.54BNZLD 2.5-50 45055 (3.5-5.47) E+04 177165 3046 1.13 219 0.00067 1.42 2.98CMNOH 5.0-50.0 94371 (8.87-9.99) E+04 129271 1762 1.43 2867 1.43 E-05 1.39 4.52TCNM 20.0-200 158625 (1.50-1.66) E+05 165046 2398 1.34 4372 7.62 E-06 3.22 8.98EGL 20.0-200.0 194325 (1.77-2.1) E+05 321931 5147 1.22 1425 4.08 E-05 3.11 8.622MCNM 20.0-200.0 226525 (2.05-2.47) E+05 489065 6475 1.47 1223 5.13 E-05 2.98 9.31CVN 75.0-750.0 74749 (1.84-1.97) E+05 5358 420 0.25 31556 3.93 E-07 10.5 29.5CVL 75.0-750.0 191081 (7.34-7.60) E+04 136117 1958 1.36 9518 2.37 E-06 11.65 35.6ATPNOL 35.0-350.0 52186 (5.09-5.34) E+04 706 284 0.04 33649 2.97 E- 05 4.98 16.25TPN-4-OL 60.0-600.0 49407 (4.92-4.95) E+04 7659 40 3.34 1514642 6.60 E-07 8.88 31.43DHCVN 50.0-500.0 43064 (4.22-4.38) E+04 7568 191 0.69 50832 1.96 E-05 7.56 26.1LNL 45.0-450.0 64022 (6.29-.51) E+04 1697 256 0.11 1514642 1.6 E-05 7.53 24.3GRNL 20.0-200.0 95546 (9.2-9.9) E+04 -168628 821 3.61 13543 7.38 E-05 2.65 7.34SFRL 10.0-100.0 117160 (1.0-1.3) E+05 252492 4357 1.13 723 0.00011 1.58 5.41BBZT 20.0-200.0 141339 (1.35-1.47) E+05 114622 1935 1.16 5332 5.65 E-06 2.98 8.56ATPA 70.0-700.0 67411 (6.59-6.88) E+04 39585 330 2.10 41718 2.39 E-05 2.76 9.21MYR 20.0-200.0 217273 (2.07-2.27) E+05 -138534 2276 1.06 9111 0.000109 2.99 10.14LMN 35.0-350.0 101686 9.88 E+04-1.04 E+05 -22396 661 0.59 23628 4.23 E-05 5.2 14.56PNN 40.0-400.0 167999 (1.51-1.84) E+05 248894 3813 1.14 1940 0.00051 6.92 19.29TCRPHLN 20.0-200.0 122984 (1.18-1.27) E+05 86956 1313 1.29 8760 2.68 E-06 3.7 10.56Five concentration point of each component was analysed in triplicate. C.I.=Confidence interval, S.E.= Standard error
www.ijpsonline.com
January - February 2014 Indian Journal of Pharmaceutical Sciences 25
components in the oils over a wide range. The results are given in Table 3.
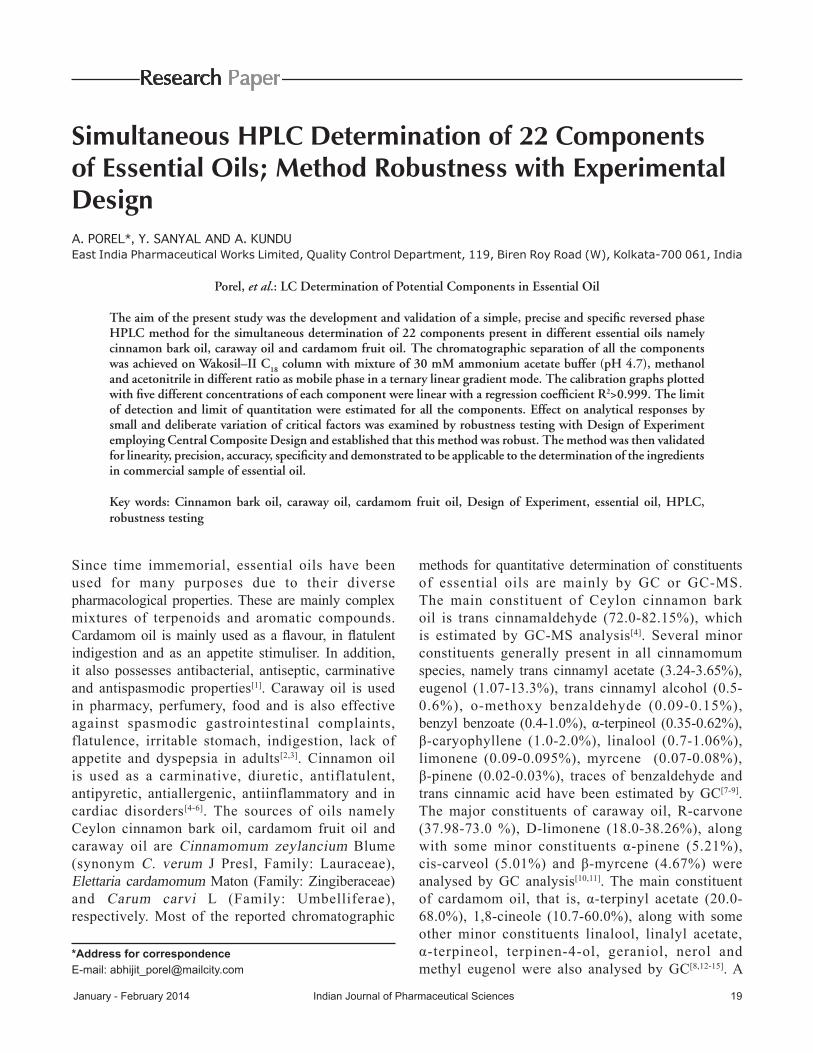
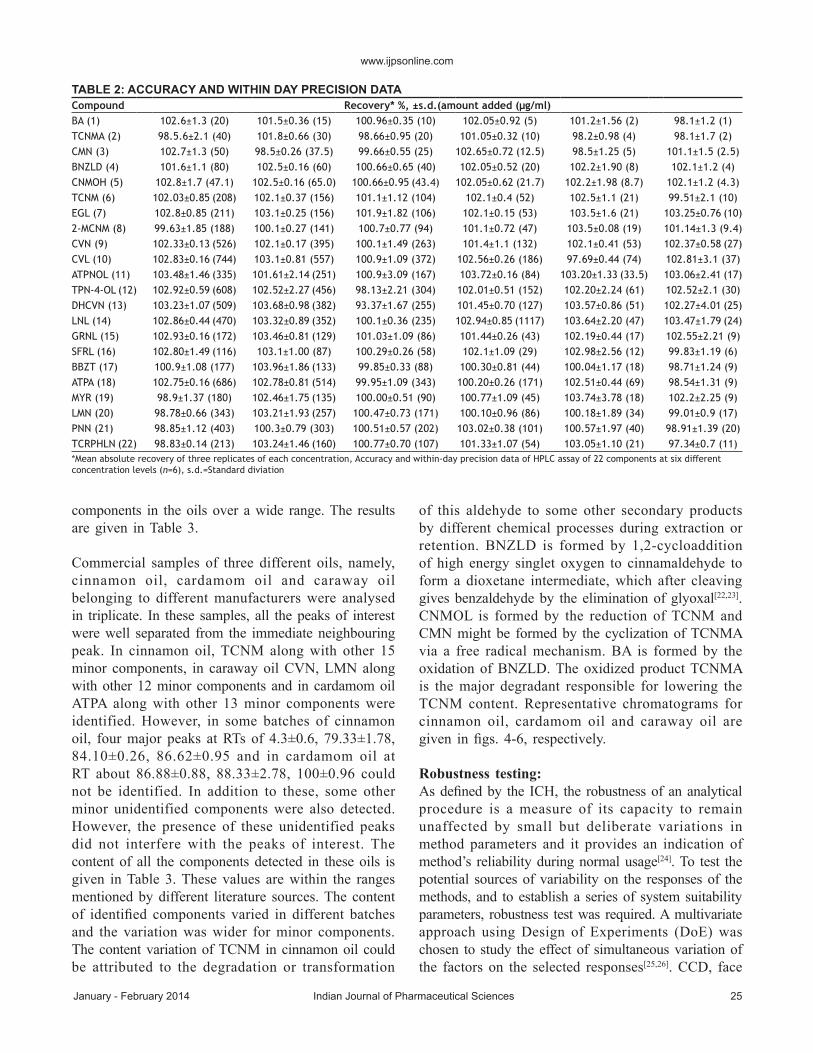
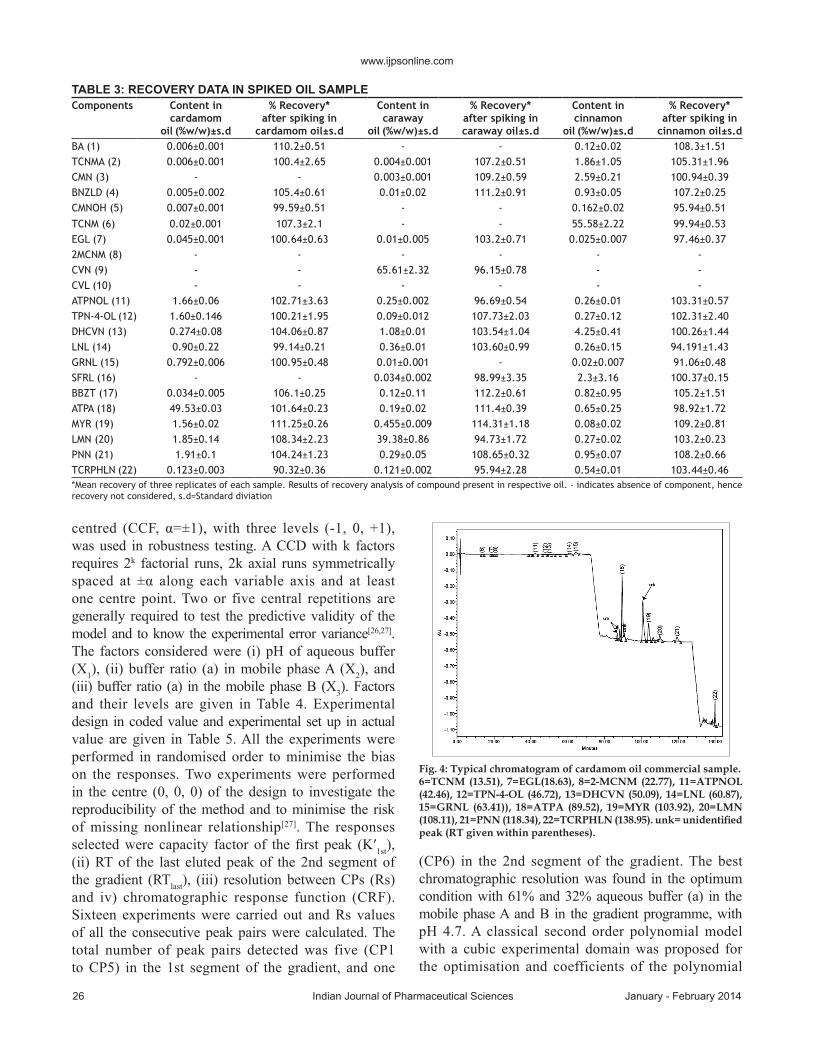
Commercial samples of three different oils, namely, cinnamon oil, cardamom oil and caraway oil belonging to different manufacturers were analysed in triplicate. In these samples, all the peaks of interest were well separated from the immediate neighbouring peak. In cinnamon oil, TCNM along with other 15 minor components, in caraway oil CVN, LMN along with other 12 minor components and in cardamom oil ATPA along with other 13 minor components were identified. However, in some batches of cinnamon oil, four major peaks at RTs of 4.3±0.6, 79.33±1.78, 84.10±0.26, 86.62±0.95 and in cardamom oil at RT about 86.88±0.88, 88.33±2.78, 100±0.96 could not be identified. In addition to these, some other minor unidentified components were also detected. However, the presence of these unidentified peaks did not interfere with the peaks of interest. The content of all the components detected in these oils is given in Table 3. These values are within the ranges mentioned by different literature sources. The content of identified components varied in different batches and the variation was wider for minor components. The content variation of TCNM in cinnamon oil could be attributed to the degradation or transformation
of this aldehyde to some other secondary products by different chemical processes during extraction or retention. BNZLD is formed by 1,2‑cycloaddition of high energy singlet oxygen to cinnamaldehyde to form a dioxetane intermediate, which after cleaving gives benzaldehyde by the elimination of glyoxal[22,23]. CNMOL is formed by the reduction of TCNM and CMN might be formed by the cyclization of TCNMA via a free radical mechanism. BA is formed by the oxidation of BNZLD. The oxidized product TCNMA is the major degradant responsible for lowering the TCNM content. Representative chromatograms for cinnamon oil, cardamom oil and caraway oil are given in figs. 4‑6, respectively.
Robustness testing:As defined by the ICH, the robustness of an analytical procedure is a measure of its capacity to remain unaffected by small but deliberate variations in method parameters and it provides an indication of method’s reliability during normal usage[24]. To test the potential sources of variability on the responses of the methods, and to establish a series of system suitability parameters, robustness test was required. A multivariate approach using Design of Experiments (DoE) was chosen to study the effect of simultaneous variation of the factors on the selected responses[25,26]. CCD, face
TABLE 2: ACCURACY AND WITHIN DAY PRECISION DATACompound Recovery* %, ±s.d.(amount added (µg/ml)BA (1) 102.6±1.3 (20) 101.5±0.36 (15) 100.96±0.35 (10) 102.05±0.92 (5) 101.2±1.56 (2) 98.1±1.2 (1)TCNMA (2) 98.5.6±2.1 (40) 101.8±0.66 (30) 98.66±0.95 (20) 101.05±0.32 (10) 98.2±0.98 (4) 98.1±1.7 (2)CMN (3) 102.7±1.3 (50) 98.5±0.26 (37.5) 99.66±0.55 (25) 102.65±0.72 (12.5) 98.5±1.25 (5) 101.1±1.5 (2.5)BNZLD (4) 101.6±1.1 (80) 102.5±0.16 (60) 100.66±0.65 (40) 102.05±0.52 (20) 102.2±1.90 (8) 102.1±1.2 (4)CNMOH (5) 102.8±1.7 (47.1) 102.5±0.16 (65.0) 100.66±0.95 (43.4) 102.05±0.62 (21.7) 102.2±1.98 (8.7) 102.1±1.2 (4.3)TCNM (6) 102.03±0.85 (208) 102.1±0.37 (156) 101.1±1.12 (104) 102.1±0.4 (52) 102.5±1.1 (21) 99.51±2.1 (10)EGL (7) 102.8±0.85 (211) 103.1±0.25 (156) 101.9±1.82 (106) 102.1±0.15 (53) 103.5±1.6 (21) 103.25±0.76 (10)2-MCNM (8) 99.63±1.85 (188) 100.1±0.27 (141) 100.7±0.77 (94) 101.1±0.72 (47) 103.5±0.08 (19) 101.14±1.3 (9.4)CVN (9) 102.33±0.13 (526) 102.1±0.17 (395) 100.1±1.49 (263) 101.4±1.1 (132) 102.1±0.41 (53) 102.37±0.58 (27)CVL (10) 102.83±0.16 (744) 103.1±0.81 (557) 100.9±1.09 (372) 102.56±0.26 (186) 97.69±0.44 (74) 102.81±3.1 (37)ATPNOL (11) 103.48±1.46 (335) 101.61±2.14 (251) 100.9±3.09 (167) 103.72±0.16 (84) 103.20±1.33 (33.5) 103.06±2.41 (17)TPN-4-OL (12) 102.92±0.59 (608) 102.52±2.27 (456) 98.13±2.21 (304) 102.01±0.51 (152) 102.20±2.24 (61) 102.52±2.1 (30)DHCVN (13) 103.23±1.07 (509) 103.68±0.98 (382) 93.37±1.67 (255) 101.45±0.70 (127) 103.57±0.86 (51) 102.27±4.01 (25)LNL (14) 102.86±0.44 (470) 103.32±0.89 (352) 100.1±0.36 (235) 102.94±0.85 (1117) 103.64±2.20 (47) 103.47±1.79 (24)GRNL (15) 102.93±0.16 (172) 103.46±0.81 (129) 101.03±1.09 (86) 101.44±0.26 (43) 102.19±0.44 (17) 102.55±2.21 (9)SFRL (16) 102.80±1.49 (116) 103.1±1.00 (87) 100.29±0.26 (58) 102.1±1.09 (29) 102.98±2.56 (12) 99.83±1.19 (6)BBZT (17) 100.9±1.08 (177) 103.96±1.86 (133) 99.85±0.33 (88) 100.30±0.81 (44) 100.04±1.17 (18) 98.71±1.24 (9)ATPA (18) 102.75±0.16 (686) 102.78±0.81 (514) 99.95±1.09 (343) 100.20±0.26 (171) 102.51±0.44 (69) 98.54±1.31 (9)MYR (19) 98.9±1.37 (180) 102.46±1.75 (135) 100.00±0.51 (90) 100.77±1.09 (45) 103.74±3.78 (18) 102.2±2.25 (9)LMN (20) 98.78±0.66 (343) 103.21±1.93 (257) 100.47±0.73 (171) 100.10±0.96 (86) 100.18±1.89 (34) 99.01±0.9 (17)PNN (21) 98.85±1.12 (403) 100.3±0.79 (303) 100.51±0.57 (202) 103.02±0.38 (101) 100.57±1.97 (40) 98.91±1.39 (20)TCRPHLN (22) 98.83±0.14 (213) 103.24±1.46 (160) 100.77±0.70 (107) 101.33±1.07 (54) 103.05±1.10 (21) 97.34±0.7 (11)*Mean absolute recovery of three replicates of each concentration, Accuracy and within‑day precision data of HPLC assay of 22 components at six different concentration levels (n=6), s.d.=Standard diviation
www.ijpsonline.com
26 Indian Journal of Pharmaceutical Sciences January - February 2014
centred (CCF, α=±1), with three levels (‑1, 0, +1), was used in robustness testing. A CCD with k factors requires 2k factorial runs, 2k axial runs symmetrically spaced at ±α along each variable axis and at least one centre point. Two or five central repetitions are generally required to test the predictive validity of the model and to know the experimental error variance[26,27]. The factors considered were (i) pH of aqueous buffer (X1), (ii) buffer ratio (a) in mobile phase A (X2), and (iii) buffer ratio (a) in the mobile phase B (X3). Factors and their levels are given in Table 4. Experimental design in coded value and experimental set up in actual value are given in Table 5. All the experiments were performed in randomised order to minimise the bias on the responses. Two experiments were performed in the centre (0, 0, 0) of the design to investigate the reproducibility of the method and to minimise the risk of missing nonlinear relationship[27]. The responses selected were capacity factor of the first peak (K′1st), (ii) RT of the last eluted peak of the 2nd segment of the gradient (RTlast), (iii) resolution between CPs (Rs) and iv) chromatographic response function (CRF). Sixteen experiments were carried out and Rs values of all the consecutive peak pairs were calculated. The total number of peak pairs detected was five (CP1 to CP5) in the 1st segment of the gradient, and one
(CP6) in the 2nd segment of the gradient. The best chromatographic resolution was found in the optimum condition with 61% and 32% aqueous buffer (a) in the mobile phase A and B in the gradient programme, with pH 4.7. A classical second order polynomial model with a cubic experimental domain was proposed for the optimisation and coefficients of the polynomial
TABLE 3: RECOVERY DATA IN SPIKED OIL SAMPLEComponents Content in
cardamom oil (%w/w)±s.d
% Recovery* after spiking in
cardamom oil±s.d
Content in caraway
oil (%w/w)±s.d
% Recovery* after spiking in caraway oil±s.d
Content in cinnamon
oil (%w/w)±s.d
% Recovery* after spiking in
cinnamon oil±s.dBA (1) 0.006±0.001 110.2±0.51 - - 0.12±0.02 108.3±1.51TCNMA (2) 0.006±0.001 100.4±2.65 0.004±0.001 107.2±0.51 1.86±1.05 105.31±1.96CMN (3) - - 0.003±0.001 109.2±0.59 2.59±0.21 100.94±0.39BNZLD (4) 0.005±0.002 105.4±0.61 0.01±0.02 111.2±0.91 0.93±0.05 107.2±0.25CMNOH (5) 0.007±0.001 99.59±0.51 - - 0.162±0.02 95.94±0.51TCNM (6) 0.02±0.001 107.3±2.1 - - 55.58±2.22 99.94±0.53EGL (7) 0.045±0.001 100.64±0.63 0.01±0.005 103.2±0.71 0.025±0.007 97.46±0.372MCNM (8) - - - - - -CVN (9) - - 65.61±2.32 96.15±0.78 - -CVL (10) - - - - - -ATPNOL (11) 1.66±0.06 102.71±3.63 0.25±0.002 96.69±0.54 0.26±0.01 103.31±0.57TPN-4-OL (12) 1.60±0.146 100.21±1.95 0.09±0.012 107.73±2.03 0.27±0.12 102.31±2.40DHCVN (13) 0.274±0.08 104.06±0.87 1.08±0.01 103.54±1.04 4.25±0.41 100.26±1.44LNL (14) 0.90±0.22 99.14±0.21 0.36±0.01 103.60±0.99 0.26±0.15 94.191±1.43GRNL (15) 0.792±0.006 100.95±0.48 0.01±0.001 - 0.02±0.007 91.06±0.48SFRL (16) - - 0.034±0.002 98.99±3.35 2.3±3.16 100.37±0.15BBZT (17) 0.034±0.005 106.1±0.25 0.12±0.11 112.2±0.61 0.82±0.95 105.2±1.51ATPA (18) 49.53±0.03 101.64±0.23 0.19±0.02 111.4±0.39 0.65±0.25 98.92±1.72MYR (19) 1.56±0.02 111.25±0.26 0.455±0.009 114.31±1.18 0.08±0.02 109.2±0.81LMN (20) 1.85±0.14 108.34±2.23 39.38±0.86 94.73±1.72 0.27±0.02 103.2±0.23PNN (21) 1.91±0.1 104.24±1.23 0.29±0.05 108.65±0.32 0.95±0.07 108.2±0.66TCRPHLN (22) 0.123±0.003 90.32±0.36 0.121±0.002 95.94±2.28 0.54±0.01 103.44±0.46*Mean recovery of three replicates of each sample. Results of recovery analysis of compound present in respective oil. - indicates absence of component, hence recovery not considered, s.d=Standard diviation
Fig. 4: Typical chromatogram of cardamom oil commercial sample. 6=TCNM (13.51), 7=EGL(18.63), 8=2-MCNM (22.77), 11=ATPNOL (42.46), 12=TPN-4-OL (46.72), 13=DHCVN (50.09), 14=LNL (60.87), 15=GRNL (63.41)), 18=ATPA (89.52), 19=MYR (103.92), 20=LMN (108.11), 21=PNN (118.34), 22=TCRPHLN (138.95). unk= unidentified peak (RT given within parentheses).
www.ijpsonline.com
January - February 2014 Indian Journal of Pharmaceutical Sciences 27
model were estimated by the nonlinear least squares regression (NLREG).
The equation model proposed for this design is given in Eqn. 1. Y = b0 + b1x1 + b2x2 + b3x3 + b11x1
2 + 2b22x22 + b33x3
2 + b12 x1x2 + b13 x1x3 + b23 x2x3 … Eqn 1, where Y presents the estimated responses, K′1st, RTlast, Rs6 and CRF, b0 is the average experimental response, coefficients b1, b2 and b3 are the estimated effects of the factors considered. The extent to which these terms affect the parameters of the method is called the main effects. The coefficients b12, b13 and b23 are interaction terms. The size of the coefficients of the polynomials used in the model determines the importance of interaction. The proposed model for the responses related with capacity factor of the 1st peak (K′1st), RT of the last peak (RTlast) in the second segment of the gradient, resolution for critical pair CP6 (RS6) and CRF is given in the following equations:
K′1st = 9.36 ‑ 0.67 x1 + 0.29 x2 ‑ 0.05 x3 + 3.46·10‑1 x1
2 ‑ 3.73·10‑1 x22 ‑ 1.87·10‑2 x3
2 ‑ 0.07 x1 x2 ‑ 0.1 x1 x3 ‑ 0.07 x2 x3 … Eqn 2; RTlast = 123.87+ 0.79 x1 + 2.15 x2 + 1.15 x3 ‑1.52 x1
2 ‑ 2.64 x22 + 1.82 x3
2 + 0.89 x1 x2 ‑ 1.72 x1 x3 + 0.49 x2 x3 … Eqn 3; CRF = 9.40+ 0.16 x1 + 0.45 x2 + 0.004 x3 + 1.05 x1
2 + 5.59·10‑1 x2
2 ‑ 1.38 x32 + 0.35 x1 x2 ‑ 0.05 x1 x3 ‑ 0.04
x2 x3 … Eqn 4; RS6 = 3.97 + 0.16 x1 + 0.01 x2 + 0.03x3 + 4.89·10‑1 x1
2 + 2.09·10‑1 x22 ‑ 5. 10‑1 x3
2 + 0.09 x1 x2 + 0.16 x1 x3 ‑ 0.18 x2 x3 … Eqn 5.
Fig. 6: Typical chromatogram of cinnamon oil commercial sample. 1=BA ( 3.02), 2=TCNMA (5.81), 3=CMN(7.05), 4=BNZLD (7.54 ), 6=TCNM (13.15), 7=EGL(18.67), 8=2-MCNM (22.41),11=ATPNOL (39.54), 12=TPN-4-OL (42.41), 13=DHCVN (47.71), 15=GRNL (63.43)), 16=SFRL (76.06),17=BBZT (80.11), 19=MYR (103.21), 21=PNN (113.42), 22=TCRPHLN (137.98). unk= unidentified peak. (RT given within parentheses).
Fig. 5: Typical chromatogram of caraway oil commercial sample. 6=TCNM (14.15), 9=CVN (31.18), 11=ATPNOL (39.66), 12=TPN-4-OL (43.28), 13=DHCVN (47.26), 14=LNL (59.11), 16=SFRL (76.82), 17=BBZT (82.56),18=ATPA (87.18), 19=MYR (103.55), 20=LMN (109.32), 21=PNN (118.39), 22=TCRPHLN (141.22). (RT given within parentheses).
TABLE 4: FACTORS AND THEIR LOWER (−), UPPER (+) AND ZERO (0) LEVELSFactors Factor levels
(−) (+) (0)x1 Buffer pH 4.6 4.8 4.7x2 Buffer ratio of 1st segment of gradient A 60 62 61x3 Buffer ratio of 2nd segment of gradient
B31 33 32
Factors at three levels (−1, 0, +1) for Central Composite Design
TABLE 5: CENTRAL COMPOSITE DESIGN (CCD) FOR THREE FACTORS
Trial Experimental design (a)
Experimental set up (b)
Std Run x1 x2 x3 Buffer pH
Buffer ratio (a) in
mobile phase A
Buffer ratio (a) in
mobile phase B
9 1 -1 0 0 4.6 61 325 2 -1 -1 1 4.6 60 3312 3 0 1 0 4.7 62 3116 4 0 0 0 4.7 61 327 5 -1 1 1 4.6 62 3310 6 1 0 0 4.8 61 322 7 1 -1 -1 4.8 60 3114 8 0 0 1 4.7 61 334 9 1 1 -1 4.8 62 3115 10 0 0 0 4.7 61 326 11 1 -1 1 4.8 60 3313 12 0 0 -1 4.7 61 311 13 -1 -1 -1 4.6 60 318 14 1 1 1 4.8 62 3311 15 0 -1 0 4.7 60 323 16 -1 1 -1 4.6 62 31Central composite design with 3 selected critical factors (a) in coded value (-1, 0, +1) and (b) in actual value for robustness testing
www.ijpsonline.com
28 Indian Journal of Pharmaceutical Sciences January - February 2014
From Eqns 2‑5, it was evident that aqueous buffer ratios in A, B and pH of buffer had significant positive effect on resolution, RT and capacity factor, justifying the acceptance of the chosen model.
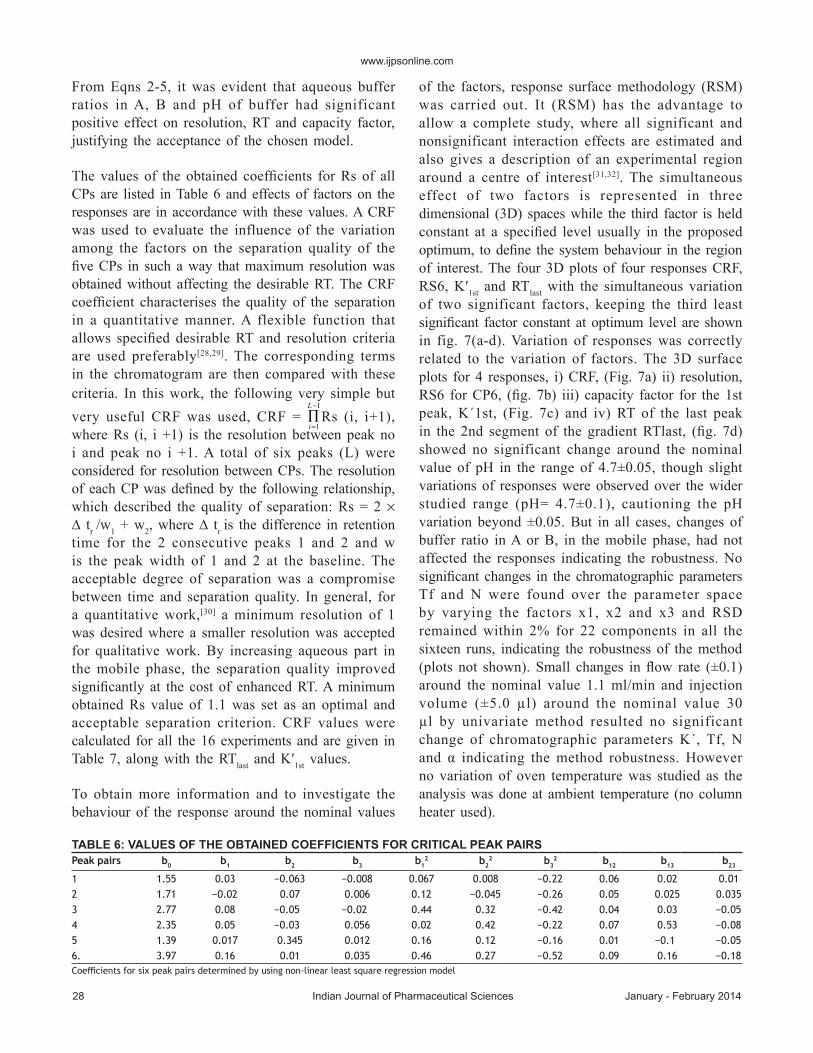
The values of the obtained coefficients for Rs of all CPs are listed in Table 6 and effects of factors on the responses are in accordance with these values. A CRF was used to evaluate the influence of the variation among the factors on the separation quality of the five CPs in such a way that maximum resolution was obtained without affecting the desirable RT. The CRF coefficient characterises the quality of the separation in a quantitative manner. A flexible function that allows specified desirable RT and resolution criteria are used preferably[28,29]. The corresponding terms in the chromatogram are then compared with these criteria. In this work, the following very simple but very useful CRF was used, CRF = ∏
i
L
=
−
1
1
Rs (i, i+1), where Rs (i, i +1) is the resolution between peak no i and peak no i +1. A total of six peaks (L) were considered for resolution between CPs. The resolution of each CP was defined by the following relationship, which described the quality of separation: Rs = 2 × ∆ tr /w1 + w2, where ∆ tr is the difference in retention time for the 2 consecutive peaks 1 and 2 and w is the peak width of 1 and 2 at the baseline. The acceptable degree of separation was a compromise between time and separation quality. In general, for a quantitative work,[30] a minimum resolution of 1 was desired where a smaller resolution was accepted for qualitative work. By increasing aqueous part in the mobile phase, the separation quality improved significantly at the cost of enhanced RT. A minimum obtained Rs value of 1.1 was set as an optimal and acceptable separation criterion. CRF values were calculated for all the 16 experiments and are given in Table 7, along with the RTlast and K′1st values.
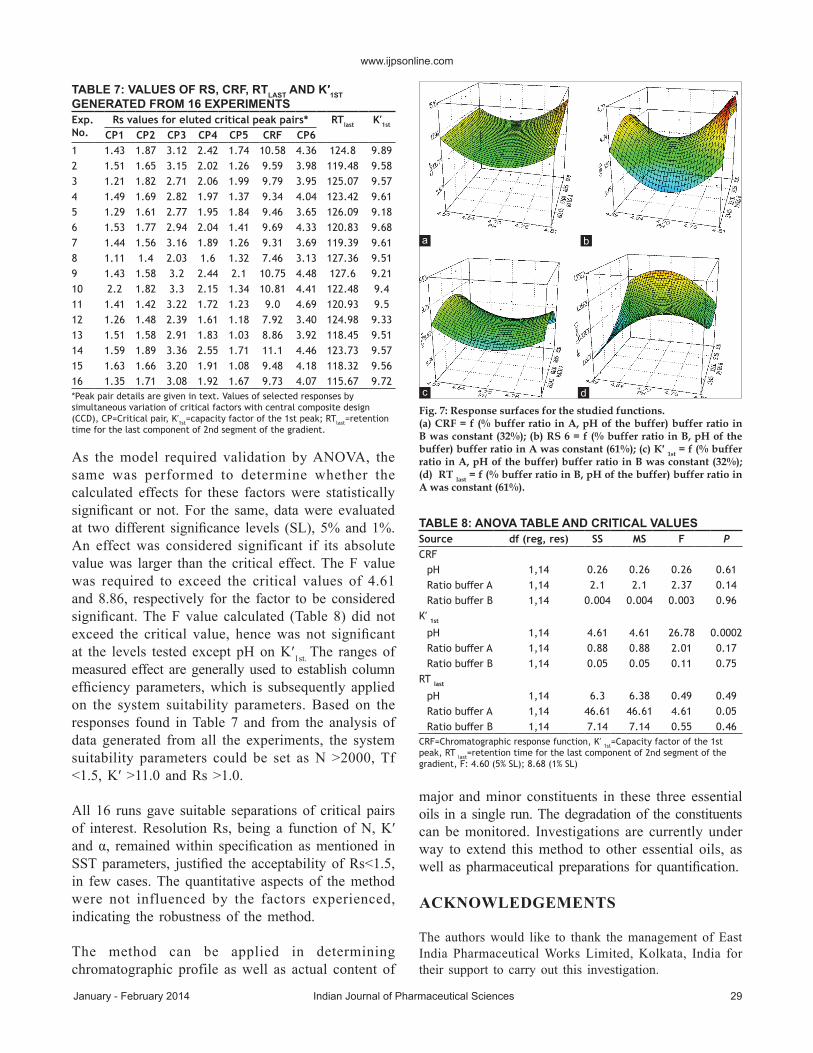
To obtain more information and to investigate the behaviour of the response around the nominal values
of the factors, response surface methodology (RSM) was carried out. It (RSM) has the advantage to allow a complete study, where all significant and nonsignificant interaction effects are estimated and also gives a description of an experimental region around a centre of interest[31,32]. The simultaneous effect of two factors is represented in three dimensional (3D) spaces while the third factor is held constant at a specified level usually in the proposed optimum, to define the system behaviour in the region of interest. The four 3D plots of four responses CRF, RS6, K′1st and RTlast with the simultaneous variation of two significant factors, keeping the third least significant factor constant at optimum level are shown in fig. 7(a‑d). Variation of responses was correctly related to the variation of factors. The 3D surface plots for 4 responses, i) CRF, (Fig. 7a) ii) resolution, RS6 for CP6, (fig. 7b) iii) capacity factor for the 1st peak, K´1st, (Fig. 7c) and iv) RT of the last peak in the 2nd segment of the gradient RTlast, (fig. 7d) showed no significant change around the nominal value of pH in the range of 4.7±0.05, though slight variations of responses were observed over the wider studied range (pH= 4.7±0.1), cautioning the pH variation beyond ±0.05. But in all cases, changes of buffer ratio in A or B, in the mobile phase, had not affected the responses indicating the robustness. No significant changes in the chromatographic parameters Tf and N were found over the parameter space by varying the factors x1, x2 and x3 and RSD remained within 2% for 22 components in all the sixteen runs, indicating the robustness of the method (plots not shown). Small changes in flow rate (±0.1) around the nominal value 1.1 ml/min and injection volume (±5.0 µl) around the nominal value 30 µl by univariate method resulted no significant change of chromatographic parameters K´, Tf, N and α indicating the method robustness. However no variation of oven temperature was studied as the analysis was done at ambient temperature (no column heater used).
TABLE 6: VALUES OF THE OBTAINED COEFFICIENTS FOR CRITICAL PEAK PAIRS Peak pairs b0 b1 b2 b3 b1
2 b22 b3
2 b12 b13 b23
1 1.55 0.03 −0.063 −0.008 0.067 0.008 −0.22 0.06 0.02 0.012 1.71 −0.02 0.07 0.006 0.12 −0.045 −0.26 0.05 0.025 0.0353 2.77 0.08 −0.05 −0.02 0.44 0.32 −0.42 0.04 0.03 −0.054 2.35 0.05 −0.03 0.056 0.02 0.42 −0.22 0.07 0.53 −0.085 1.39 0.017 0.345 0.012 0.16 0.12 −0.16 0.01 −0.1 −0.056. 3.97 0.16 0.01 0.035 0.46 0.27 −0.52 0.09 0.16 −0.18Coefficients for six peak pairs determined by using non‑linear least square regression model
www.ijpsonline.com
January - February 2014 Indian Journal of Pharmaceutical Sciences 29
As the model required validation by ANOVA, the same was performed to determine whether the calculated effects for these factors were statistically significant or not. For the same, data were evaluated at two different significance levels (SL), 5% and 1%. An effect was considered significant if its absolute value was larger than the critical effect. The F value was required to exceed the critical values of 4.61 and 8.86, respectively for the factor to be considered significant. The F value calculated (Table 8) did not exceed the critical value, hence was not significant at the levels tested except pH on K′1st. The ranges of measured effect are generally used to establish column efficiency parameters, which is subsequently applied on the system suitability parameters. Based on the responses found in Table 7 and from the analysis of data generated from all the experiments, the system suitability parameters could be set as N >2000, Tf <1.5, K′ >11.0 and Rs >1.0.
All 16 runs gave suitable separations of critical pairs of interest. Resolution Rs, being a function of N, K′ and α, remained within specification as mentioned in SST parameters, justified the acceptability of Rs<1.5, in few cases. The quantitative aspects of the method were not influenced by the factors experienced, indicating the robustness of the method.
The method can be applied in determining chromatographic profile as well as actual content of
major and minor constituents in these three essential oils in a single run. The degradation of the constituents can be monitored. Investigations are currently under way to extend this method to other essential oils, as well as pharmaceutical preparations for quantification.
ACKNOWLEDGEMENTS
The authors would like to thank the management of East India Pharmaceutical Works Limited, Kolkata, India for their support to carry out this investigation.
TABLE 7: VALUES OF RS, CRF, RTLAST AND K′1ST GENERATED FROM 16 EXPERIMENTSExp. No.
Rs values for eluted critical peak pairs* RTlast K′1st
CP1 CP2 CP3 CP4 CP5 CRF CP61 1.43 1.87 3.12 2.42 1.74 10.58 4.36 124.8 9.892 1.51 1.65 3.15 2.02 1.26 9.59 3.98 119.48 9.583 1.21 1.82 2.71 2.06 1.99 9.79 3.95 125.07 9.574 1.49 1.69 2.82 1.97 1.37 9.34 4.04 123.42 9.615 1.29 1.61 2.77 1.95 1.84 9.46 3.65 126.09 9.186 1.53 1.77 2.94 2.04 1.41 9.69 4.33 120.83 9.687 1.44 1.56 3.16 1.89 1.26 9.31 3.69 119.39 9.618 1.11 1.4 2.03 1.6 1.32 7.46 3.13 127.36 9.519 1.43 1.58 3.2 2.44 2.1 10.75 4.48 127.6 9.2110 2.2 1.82 3.3 2.15 1.34 10.81 4.41 122.48 9.411 1.41 1.42 3.22 1.72 1.23 9.0 4.69 120.93 9.512 1.26 1.48 2.39 1.61 1.18 7.92 3.40 124.98 9.3313 1.51 1.58 2.91 1.83 1.03 8.86 3.92 118.45 9.5114 1.59 1.89 3.36 2.55 1.71 11.1 4.46 123.73 9.5715 1.63 1.66 3.20 1.91 1.08 9.48 4.18 118.32 9.5616 1.35 1.71 3.08 1.92 1.67 9.73 4.07 115.67 9.72*Peak pair details are given in text. Values of selected responses by simultaneous variation of critical factors with central composite design (CCD), CP=Critical pair, K′1st=capacity factor of the 1st peak; RTlast=retention time for the last component of 2nd segment of the gradient.
Fig. 7: Response surfaces for the studied functions.(a) CRF = f (% buffer ratio in A, pH of the buffer) buffer ratio in B was constant (32%); (b) RS 6 = f (% buffer ratio in B, pH of the buffer) buffer ratio in A was constant (61%); (c) K′ 1st = f (% buffer ratio in A, pH of the buffer) buffer ratio in B was constant (32%); (d) RT last = f (% buffer ratio in B, pH of the buffer) buffer ratio in A was constant (61%).
dc
ba
TABLE 8: ANOVA TABLE AND CRITICAL VALUES Source df (reg, res) SS MS F PCRF
pH 1,14 0.26 0.26 0.26 0.61Ratio buffer A 1,14 2.1 2.1 2.37 0.14Ratio buffer B 1,14 0.004 0.004 0.003 0.96
K′ 1st
pH 1,14 4.61 4.61 26.78 0.0002Ratio buffer A 1,14 0.88 0.88 2.01 0.17Ratio buffer B 1,14 0.05 0.05 0.11 0.75
RT last
pH 1,14 6.3 6.38 0.49 0.49Ratio buffer A 1,14 46.61 46.61 4.61 0.05Ratio buffer B 1,14 7.14 7.14 0.55 0.46
CRF=Chromatographic response function, K′ 1st=Capacity factor of the 1st peak, RT last=retention time for the last component of 2nd segment of the gradient, F: 4.60 (5% SL); 8.68 (1% SL)
www.ijpsonline.com
30 Indian Journal of Pharmaceutical Sciences January - February 2014
REFERENCES
1. Al‑Zuhair H, El‑Saych B, Ameen HA, Al‑Shoora H. Pharmacological studies of cardamom oil in animals. Pharmacol Res 1996;34:79‑82.
2. Johri RK. Cuminum cyminum and Carum carvi: An update. Pharmacog Rev 2011;5:63‑72.
3. Samojlik I, Lakié N, Mimica‑Dukié N, Dakovié‑Svajcer k, Bozin B. Antioxidant and hepato protective potential of essential oilsb of coriander (Coriandrum sativum L.) and caraway (Carum carvi L.) (Apiaceae). J Agric Food Chem 2010;58:8848‑53.
4. Wang R, Ruijiang W, Bao Y. Extraction of essential oils from five cinnamon leaves and identification of their volatile compound composition. Innov Food Sci Emerg Technol 2009;10: 289‑92.
5. Mir SR, Ali M, Kapoor R. Chemical composition of essential oil of Cinnamomum tamala Nees et Eberm leaves. Flavour Frag J 2004;19:112‑4.
6. Gurdip S, Kapoor IPS, Pratibha S, De Heluani CS, Marina PD, Cesar ANC. Chemistry, antioxidant and antimicrobial investigations on essential oil and oleoresins of Zingiber officinale. Food Chemical Toxicol 2008;46(10):3295‑3302.
7. Vernin G, Vernin C, Metzger J, Pujol L, Parkanvi C. GC/MS Analysis of cinnamon and cassia essential oils: A Comparative Study. In: G Charalambous, editor. Spices, herbs and edible fungi, B.V. Amsterdam: Elsvier Science; 1994. p. 411‑25.
8. Wang R, Ruijiang W, Bao Y. Comparison of volatile compound composition of cinnamon (Cinnamonum Cassia Presl) bark prepared by hydrodistillation and headspace solid phase microextraction. J Food Process Eng 2011;34:175‑85.
9. Kamaliroosta L, Gharachorloo M, Kamaliroosta Z, Alimohammed ZKH. Extraction of cinnamon essential oil and identification of its chemical compounds. J Med Plant Res 2012;6:609‑14.
10. Fang R, Jiang CH, Wang XY, Zhang HM, Liu ZL, Zhou L et al. Insecticidial activity of essential oil of carum carvi fruits from China and its main components against two grain storage insects. Molecules 2010;15:9391‑402.
11. Sedlảkovả J, Kocourkovả B, Lojkovả L, Kuban V. The essential oil content in caraway species (Carum carvi L.). Hort Sci (Prague) 2003;30:73‑9.
12. Kizhakkayil J, Thomas E, Zacharia TJ, Syamkumar S, Sasikumar B. A comparative quality apprisal of exported cardamoms of India, Sri Lanka and Guatemela. Nat Prod Radiance 2006;5:361‑5.
13. Rhaman A, Choudhury MI, Farooq A, Ahmed A, Iqbal MZ, Demirci B, et al. Antifungal activities and essential oil constituents of some spices from Pakistan. J Chem Soc Pak 2000;22:60‑5.
14. Amma KPAP, Rani MP, Sasidharan I, Nisha VNP, Chemical composition, flavonoid‑ phenolic contents and radical scavenging activity of four major varieties of cardamom. Int J Biol Med Res 2010;1:20‑4.
15. Singh G, Kiran S, Marimuthu P, Isidorov V, Vinogorova V. Antioxidant and antimicrobial activities of essential oil and various oleoresins of Elettaria cardamomum (seeds and pods). J Sci Food Agric 2008;88:280‑9.
16. British Pharmacopoeia. Vol 4. London: HMSO Publication; 2012. p. 3534‑5.
17. British Pharmacopoeia. Vol 4. London: HMSO Publication; 2012. p. 3518‑9.
18. Jurek C, Stintzing FC, Application of high‑performance liquid chromatography diode array detection and mass spectrometry to the analysis of characteristic compounds in various essential oils. Anal Bioanal Chem 2011;400:3109‑23.
19. Gursale A, Dighe V, Parekh G. Simultaneous quantitative determination of cinnamalehyde and methyl eugenol from stem bark of Cinnamomum zeylanicum Blume using RP‑HPLC. J Chromatogr Sci 2010;48:59‑62.
20. Dighe VV, Gursale AA, Charegaonkar GA. Quantitation of eugenol, cinnamaldehyde and isoeugenol from Cinnamomum tamala Nees and Eberm leaf powder and Cinnamomum zeylanicum Breyn stem bark powder by LC. Chromatographia 2009;70:1759‑62.
21. Dighe VV, Gursale AA, Sane RT, Menon S, Patel PH. Quantitative determination of eugenol from Cinnamomum tamala Nees and Eberm leaf powder and polyhedral formulation using reversed phase liquid chromatography. Chromatographia 2005;61:443‑6.
22. Frimer AA. The reaction of singlet oxygen with olefins: the question of mechanism. Chem Rev 1979:79:359‑87.
23. Friedman M, Kozukne N, Harden LA. Cinnamaldehyde content in foods determined by Gas chromatography‑mass spectrometry. J Agr Food Chem 2000:48:5702‑09.
24. ICH, Q2 (R1), Harmonized Tripartite Guideline, Validation of Analytical Procedures: Text and Methodology, in: International Conference on Harmonisation of Technical Requirements for the Registration of Pharmaceuticals for Human Use, November, 2005.
25. Fabre H. Robustness testing in liquid chromatography and capillary electrophoresis. J Pharm Biomed Anal 1996;14:1125‑32.
26. Lewis GA, Mathieu D, Phan‑Tan‑Luu R. editors. Pharmaceutical Experimental Design, New York: Marcel Decker; 1999.
27. Lundsted T, Seifert E, Abramo L, Thelin B, Nystorm A, Patterson J, et al. Experimental design and optimization, Chemom Intell Lab Syst 1998;42:3‑40.
28. Kanaka R, Rayanakorn M, Watanesk S, Vaneesorn Y. Optimization of high performance liquid chromatographic parameters for the determination of capsaicinoid compounds using the simplex method. Anal Sci 2002;18:661‑5.
29. Bylund D, Bergens A, Jacobson SP. Optimization and chromatographic separation by use of a chromatographic response function, empirical modelling and multivariate analysis. Chromatographia 1997;44:74‑80.
30. Poole CF, Poole SK. editors. Chromatography Today. 5th ed. Amsterdam: Elsevier Science Publishers; 2012.
31. Toribio L, del Nozal MJ, Bernal JL, Alonso C, Jiménez JJ. Comparative study of the enantioselective separation of several antiulcer drugs by high‑performance liquid chromatography and supercritical fluid chromatography. J Chromatogr A 2005;1091:118‑23.
32. Ragonese R, Mulholland M, Kalman J. Full and fractional experimental designs for robustness in the high‑performance liquid chromatographic analysis of codeine phosphate, pseudoephedrine hydrochloride and chlorpheniramine maleate in a pharmaceutical preparation. J Chromatogr A 2000;870:45‑51.
Accepted 28 November 2013Revised 20 November 2013
Received 27 June 2013Indian J Pharm Sci 2014;76(1):19-30